
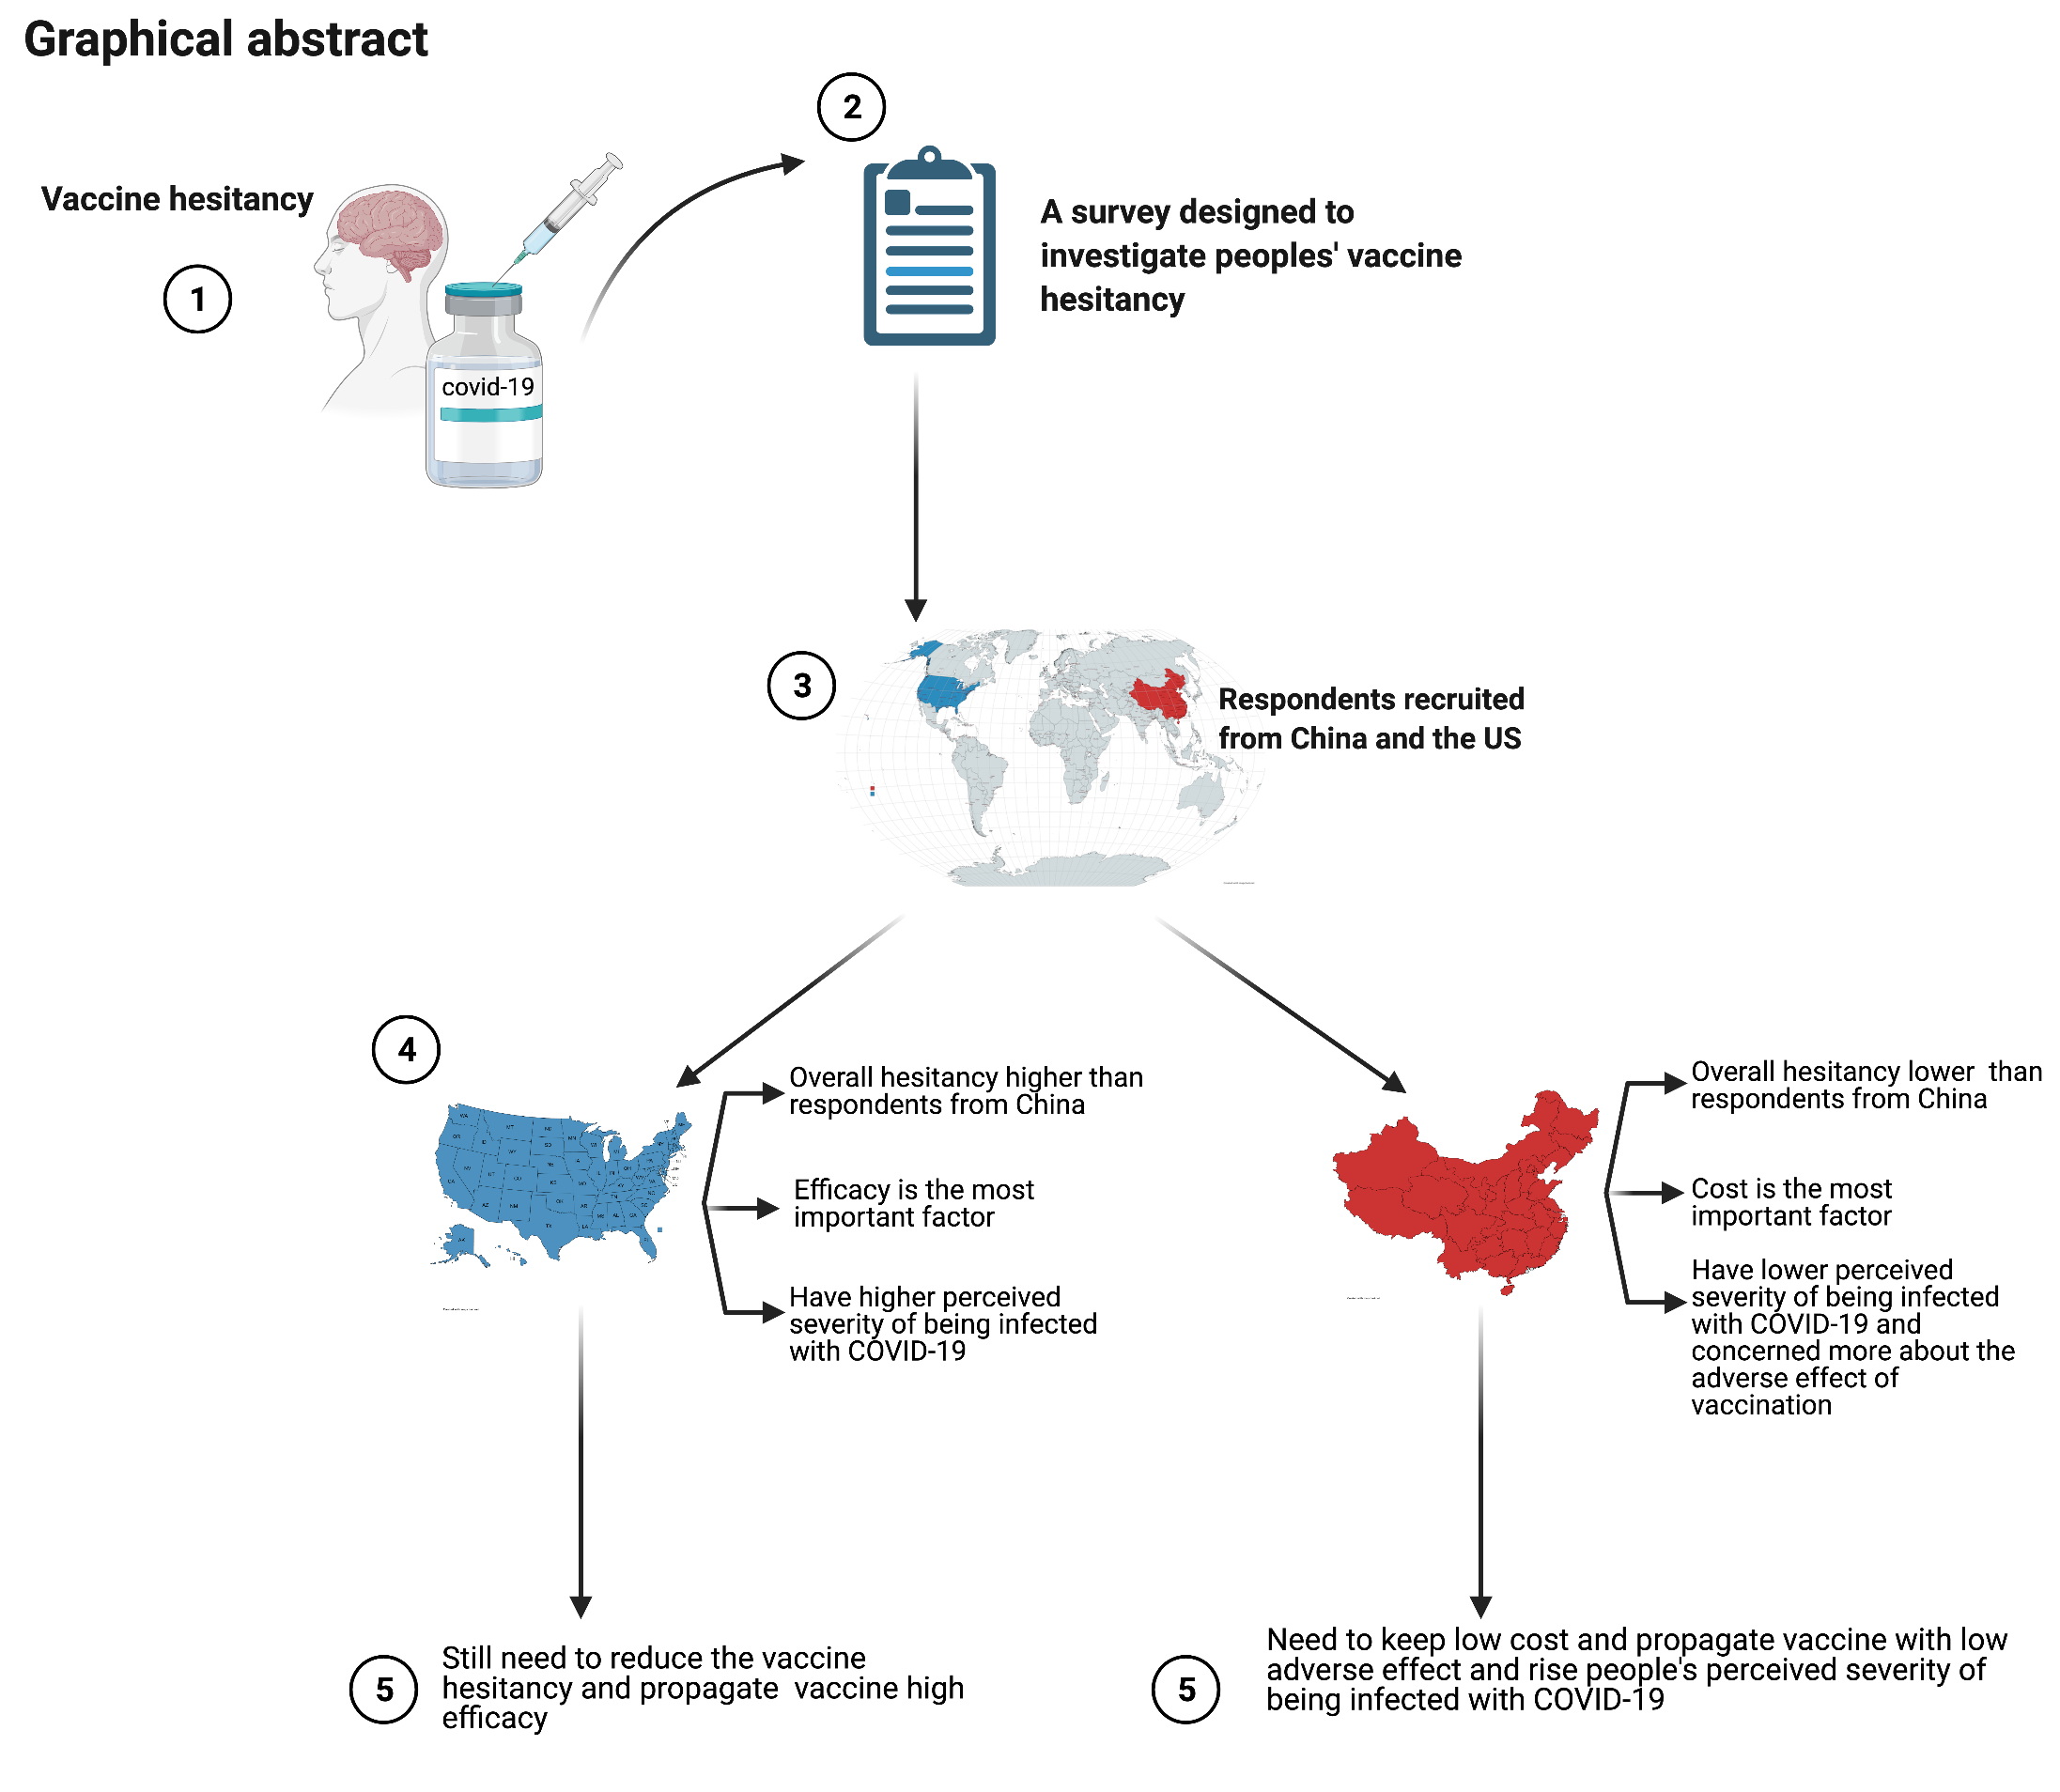
A Comparison of Vaccine Hesitancy of COVID-19 Vaccination in China and the United States

 , , ,
, , ,  ,
,  and
and
Abstract
:
1. Introduction
2. Materials and Methods
2.1. Study Design
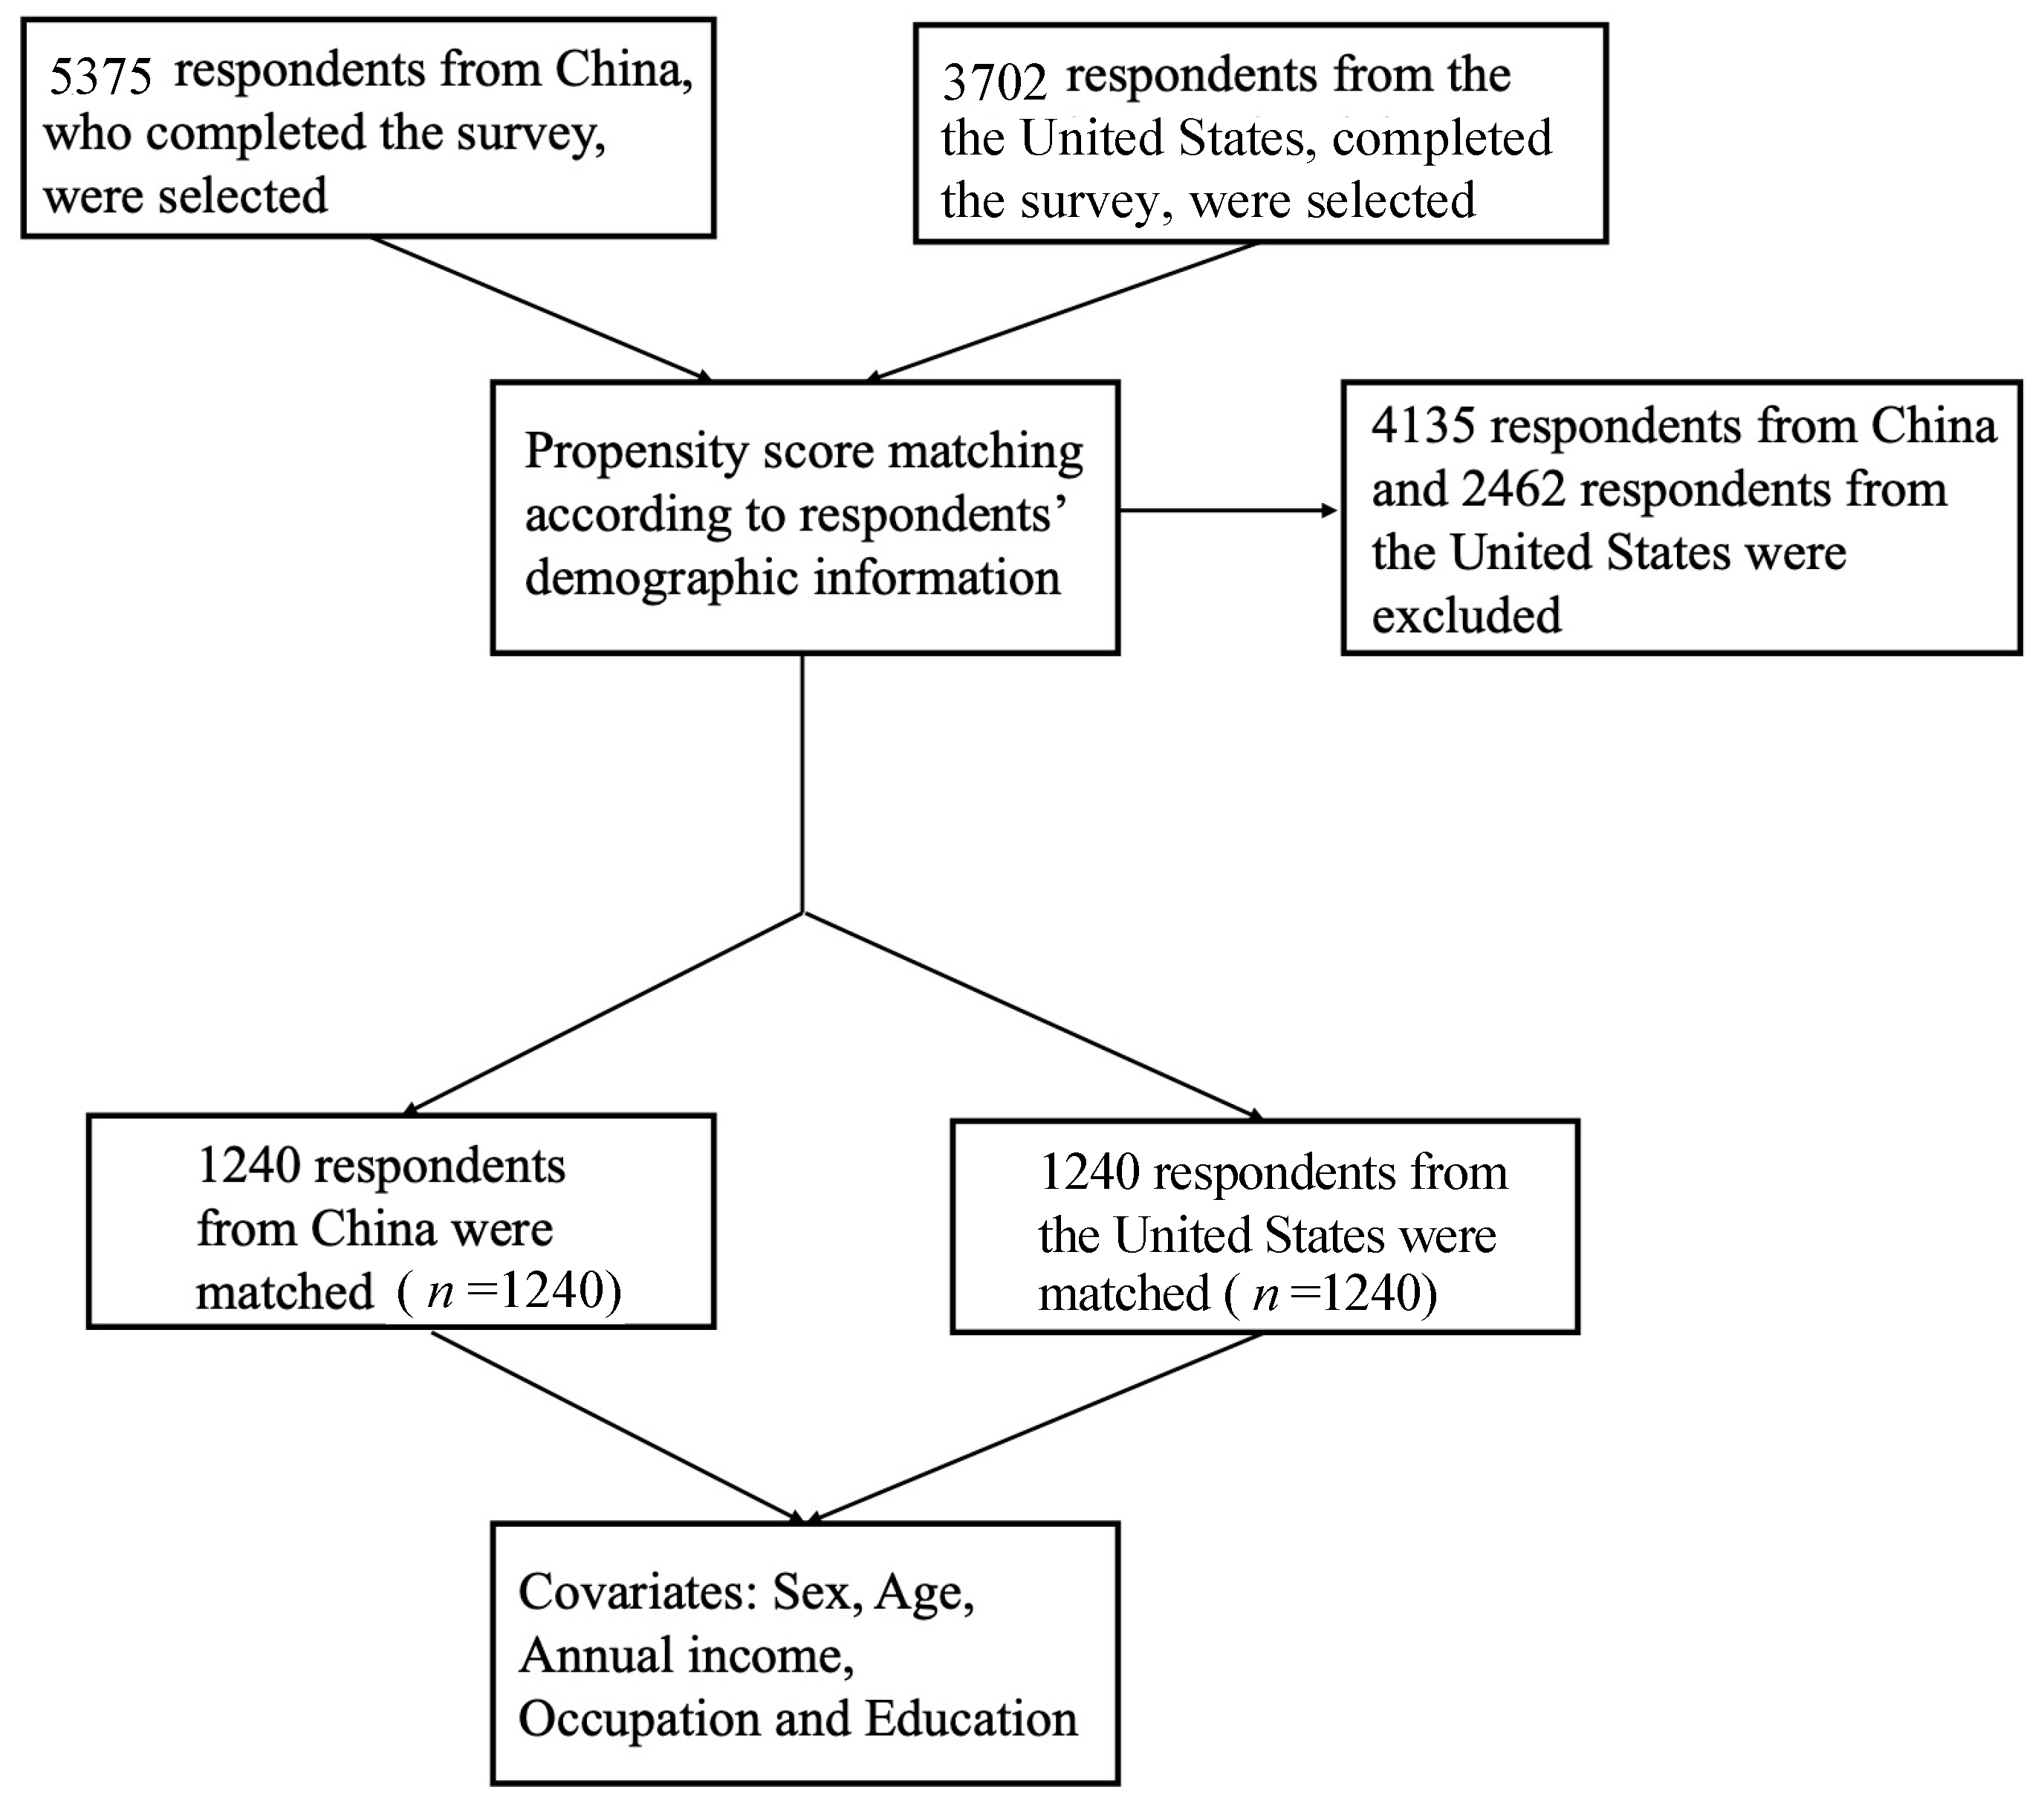
2.2. Respondents
2.3. Data Collection
2.4. Survey Design
2.5. Statistical Analysis
2.6. Scenario Analysis and Simulation
3. Results
3.1. Respondents’ Characteristics
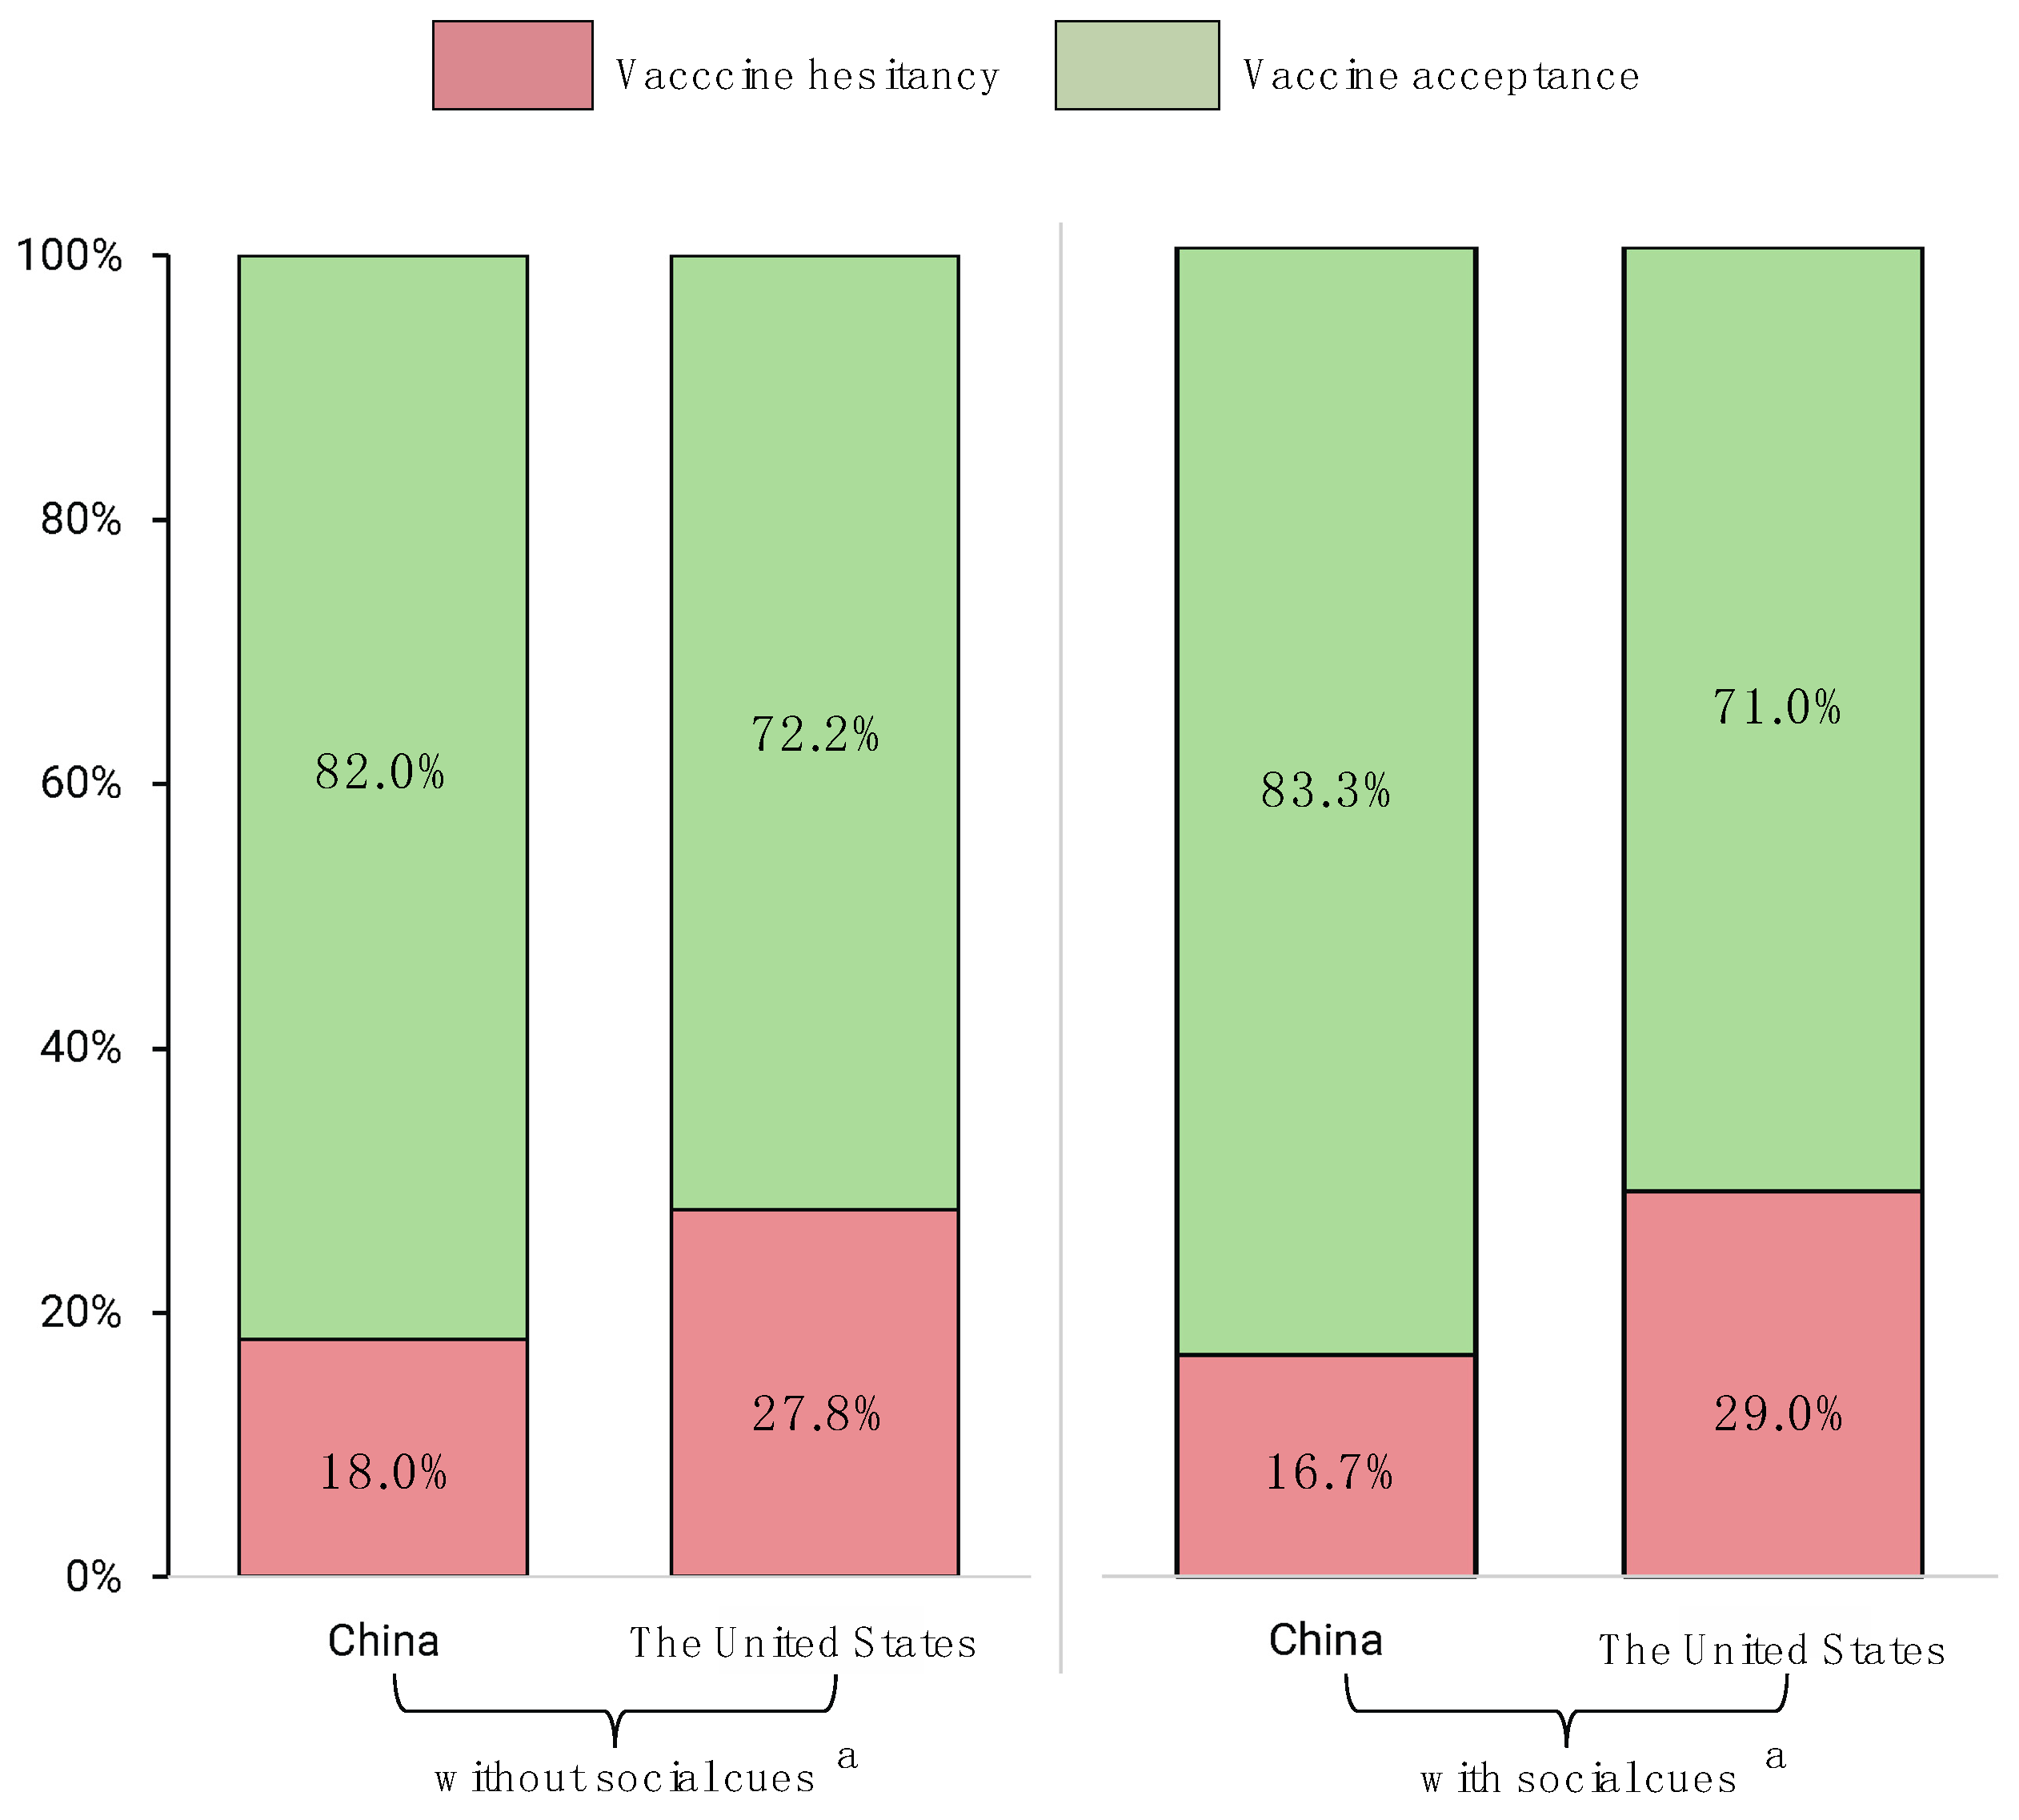
3.2. Generate Hesitancy and Participants’ Vaccination History
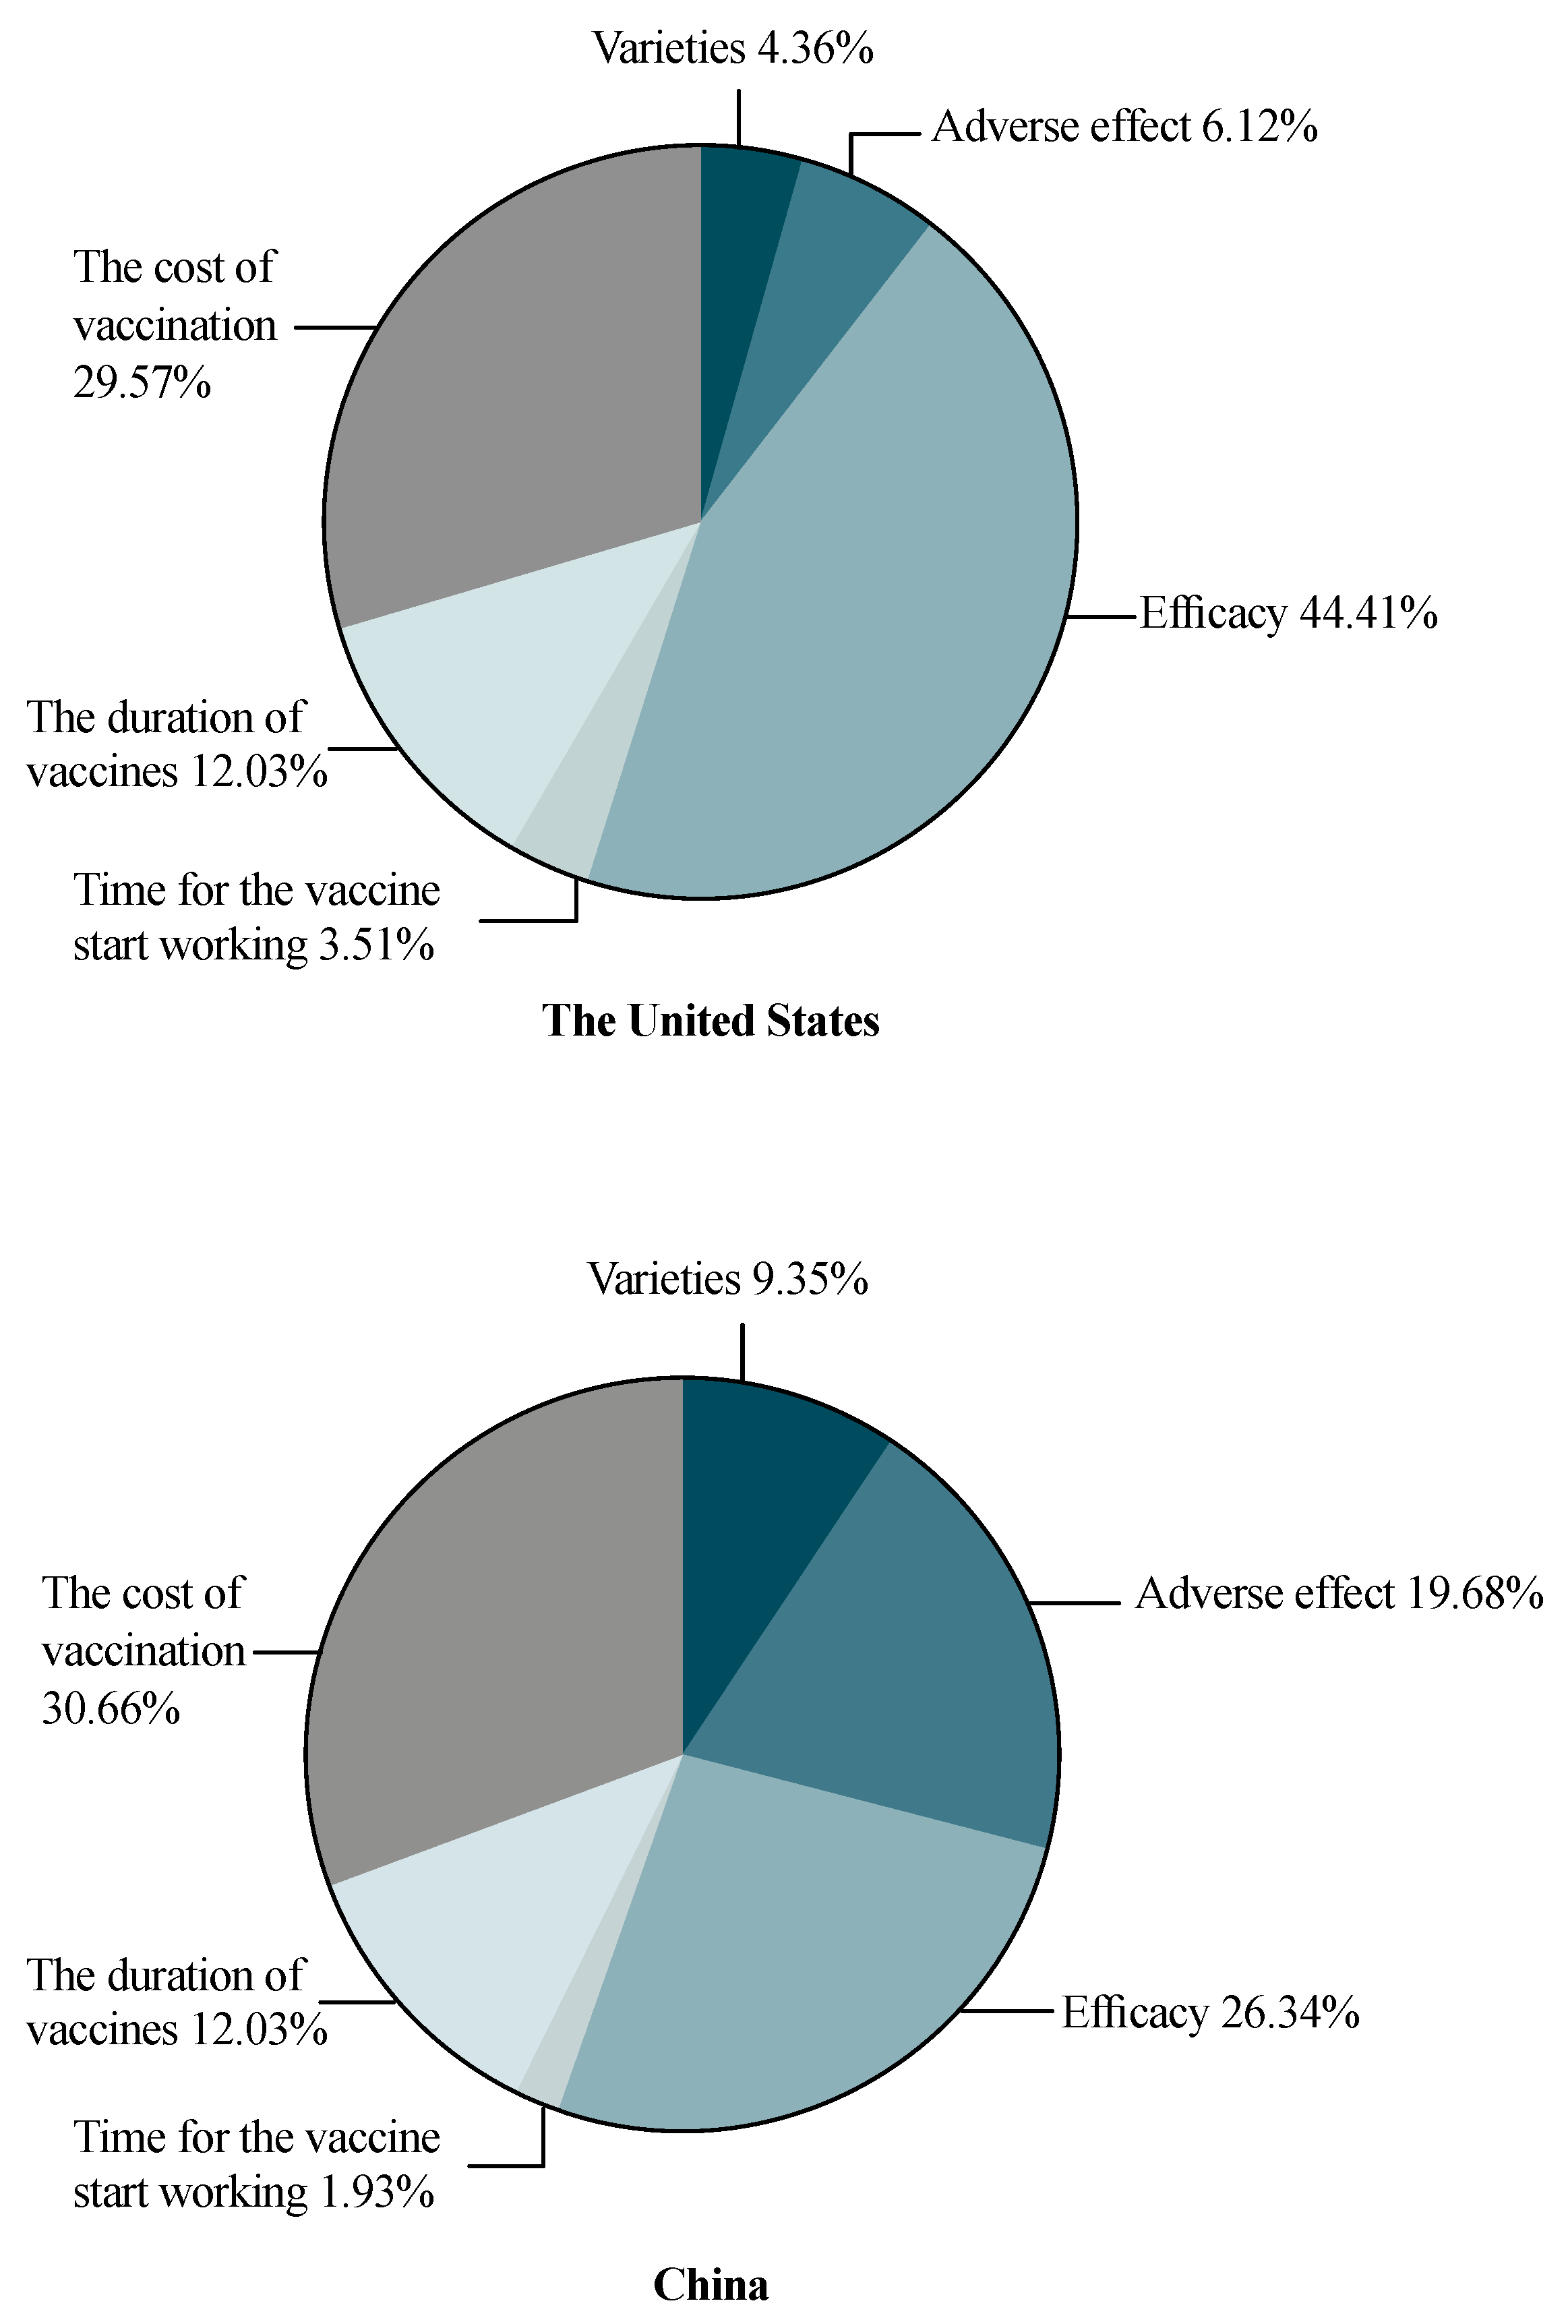
3.3. Post-PSM Participants’ Vaccine Preference, Attributes and Level of Importance
3.4. Post-PSM Scenario Analysis and Uptake Likelihood Prediction
3.5. Behavioral and Psychological Results
4. Discussion
Strengths and Limitations
5. Conclusions
Supplementary Materials
Author Contributions
Funding
Institutional Review Board Statement
Informed Consent Statement
Data Availability Statement
Conflicts of Interest
References
- Huang, C.; Wang, Y.; Li, X.; Ren, L.; Zhao, J.; Hu, Y.; Zhang, L.; Fan, G.; Xu, J.; Gu, X.; et al. Clinical features of patients infected with 2019 novel coronavirus in Wuhan, China. Lancet 2020, 395, 497–506. [Google Scholar] [CrossRef] [Green Version]
- Yang, Y.; Peng, F.; Wang, R.; Guan, K.; Jiang, T.; Xu, G.; Sun, J.; Chang, C. The deadly coronaviruses: The 2003 SARS pandemic and the 2020 novel coronavirus epidemic in China. J. Autoimmun. 2020, 109, 102434. [Google Scholar] [CrossRef] [PubMed]
- Imai, N.; Gaythorpe, K.A.; Abbott, S.; Bhatia, S.; Van Elsland, S.; Prem, K.; Liu, Y.; Ferguson, N.M. Adoption and impact of non-pharmaceutical interventions for COVID-19. Wellcome Open Res. 2020, 5, 59. [Google Scholar] [CrossRef] [PubMed] [Green Version]
- World Health Organization. Timeline: WHO’s COVID-19 Response. Available online: https://www.who.int/emergencies/diseases/novel-coronavirus-2019/interactive-timeline (accessed on 12 March 2021).
- Miller, I.F.; Becker, A.D.; Grenfell, B.T.; Metcalf, C.J.E. Disease and healthcare burden of COVID-19 in the United States. Nat. Med. 2020, 26, 1212–1217. [Google Scholar] [CrossRef]
- Sarun Charumilind, M.C.; Lamb, J.; Sabow, A.; Wilson, M. When Will the COVID-19 Pandemic End? McKinsey& Company: New York, NY, USA, 2021. [Google Scholar]
- Worldometer. Countries Where COVID-19 Has Spread. 2021. Available online: https://www.worldometers.info/coronavirus/countries-where-coronavirus-has-spread/ (accessed on 12 March 2021).
- World Health Organization. WHO Coronavirus (COVID-19) Dashboard. Available online: https://covid19.who.int/ (accessed on 12 March 2021).
- 2020-21, C. Report 9—Impact of Non-Pharmaceutical Interventions (NPIs) to Reduce COVID-19 Mortality and Healthcare Demand. Available online: https://www.imperial.ac.uk/mrc-global-infectious-disease-analysis/covid-19/report-9-impact-of-npis-on-covid-19/ (accessed on 12 March 2021).
- Fong, M.W.; Gao, H.; Wong, J.Y.; Xiao, J.; Shiu, E.Y.; Ryu, S.; Cowling, B.J. Nonpharmaceutical Measures for Pandemic Influenza in Nonhealthcare Settings—Social Distancing Measures. Emerg. Infect. Dis. 2020, 26, 976–984. [Google Scholar] [CrossRef]
- Davies, N.G.; Kucharski, A.J.; Eggo, R.M.; Gimma, A.; Edmunds, W.J. Centre for the Mathematical Modelling of Infectious Diseases COVID-19 working group. Effects of non-pharmaceutical interventions on COVID-19 cases, deaths, and demand for hospital services in the UK: A modelling study. Lancet Public Health 2020, 5, e375–e385. [Google Scholar] [CrossRef]
- DeRoo, S.S.; Pudalov, N.J.; Fu, L.Y. Planning for a COVID-19 Vaccination Program. JAMA 2020, 323, 2458–2459. [Google Scholar] [CrossRef]
- Centers for Disease Control and Prevention. Different COVID-19 Vaccines. 2021. Available online: https://www.cdc.gov/coronavirus/2019-ncov/vaccines/different-vaccines.html (accessed on 12 March 2021).
- Jones, I.; Roy, P. Sputnik V COVID-19 vaccine candidate appears safe and effective. Lancet 2021, 397, 642–643. [Google Scholar] [CrossRef]
- Remmel, A. COVID vaccines and safety: What the research says. Nature 2021, 590, 538–540. [Google Scholar] [CrossRef]
- Torjesen, I. Covid-19: Norway investigates 23 deaths in frail elderly patients after vaccination. BMJ 2021, 372, n149. [Google Scholar] [CrossRef]
- Kim, J.H.; Marks, F.; Clemens, J.D. Looking beyond COVID-19 vaccine phase 3 trials. Nat. Med. 2021, 27, 205–211. [Google Scholar] [CrossRef] [PubMed]
- Times, G. Sinovac’s COVID-19 Vaccine 78% Effective in Phase 3 Trial in Brazil. 2021. Available online: https://www.globaltimes.cn/page/202101/1212201.shtml (accessed on 12 March 2021).
- Malcom, K. Overcoming COVID-19 Vaccine Hesitancy. 2021. Available online: https://healthblog.uofmhealth.org/wellness-prevention/overcoming-covid-19-vaccine-hesitancy (accessed on 14 March 2021).
- More Than Half of Adults Over 50 Say They’ll Get COVID-19 Vaccination, But Many Want to Wait. Available online: https://news.umich.edu/more-than-half-of-adults-over-50-say-theyll-get-covid-19-vaccination-but-many-want-to-wait/ (accessed on 14 March 2021).
- Centers for Disease Control and Prevention. About Variants of the Virus that Causes COVID-19. 2021. Available online: https://www.cdc.gov/coronavirus/2019-ncov/transmission/variant.html (accessed on 18 March 2021).
- Centers for Disease Control and Prevention. Science Brief: Emerging SARS-CoV-2 Variants. 2021. Available online: https://www.cdc.gov/coronavirus/2019-ncov/science/science-briefs/scientific-brief-emerging-variants.html (accessed on 18 March 2021).
- Lazarus, J.V.; Ratzan, S.C.; Palayew, A.; Gostin, L.O.; Larson, H.J.; Rabin, K.; Kimball, S.; El-Mohandes, A. A global survey of potential acceptance of a COVID-19 vaccine. Nat. Med. 2021, 27, 225–228. [Google Scholar] [CrossRef] [PubMed]
- Lin, C.; Tu, P.; Beitsch, L.M. Confidence and Receptivity for COVID-19 Vaccines: A Rapid Systematic Review. Vaccines 2020, 9, 16. [Google Scholar] [CrossRef] [PubMed]
- Lew, L. China’s Low Vaccination Rate Risks Delaying Return to Normal, Warns Leading Medical Expert Zhong Nanshan. 2021. Available online: https://www.scmp.com/news/china/science/article/3126296/chinas-low-vaccination-rate-risks-delaying-return-normal-warns (accessed on 21 March 2021).
- Sallam, M. COVID-19 Vaccine Hesitancy Worldwide: A Concise Systematic Review of Vaccine Acceptance Rates. Vaccines 2021, 9, 160. [Google Scholar] [CrossRef]
- Volpp, K.G.; Loewenstein, G.; Buttenheim, A.M. Behaviorally Informed Strategies for a National COVID-19 Vaccine Promotion Program. JAMA 2021, 325, 125–126. [Google Scholar]
- McElveen CLaR. 10 Reasons the US and China Should Cooperate Now to Stop the Pandemic. 2021. Available online: https://www.brookings.edu/blog/order-from-chaos/2021/03/02/10-reasons-the-us-and-china-should-cooperate-now-to-stop-the-pandemic/ (accessed on 21 March 2021).
- Yuan, N. Reflections on China–US relations after the COVID-19 pandemic. China Int. Strategy Rev. 2020, 2, 14–23. [Google Scholar] [CrossRef]
- McCredie, M.N.; Morey, L.C. Who Are the Turkers? A Characterization of MTurk Workers Using the Personality Assessment Inventory. Assessment 2019, 26, 759–766. [Google Scholar] [CrossRef]
- Country Classification; The United Nations: New York, NY, USA, 2014; pp. 143–150.
- COVID Live Update. Available online: https://www.worldometers.info/coronavirus/?utm_campaign=homeAdvegas1? (accessed on 21 January 2021).
- Zhang, Y.; Zeng, G.; Pan, H.; Li, C.; Hu, Y.; Chu, K.; Han, W.; Chen, Z.; Tang, R.; Yin, W.; et al. Safety, tolerability, and immunogenicity of an inactivated SARS-CoV-2 vaccine in healthy adults aged 18–59 years: A randomised, double-blind, placebo-controlled, phase 1/2 clinical trial. Lancet Infect. Dis. 2021, 21, 181–192. [Google Scholar] [CrossRef]
- Wouters, O.; Shadlen, K.; Salcher-Konrad, M.; Pollard, A.; Larson, H.; Teerawattananon, Y.; Jit, M. Challenges In Ensuring Global Access To COVID-19 Vaccines: Production, Affordability, Allocation, And Deployment. Lancet 2021, 397, 1023–1034. [Google Scholar] [CrossRef]
- Polack, F.P.; Thomas, S.J.; Kitchin, N.; Absalon, J.; Gurtman, A.; Lockhart, S.; Perez, J.L.; Pérez Marc, G.; Moreira, E.D.; Zerbini, C.; et al. Safety and Efficacy of The BNT162b2 mRNA Covid-19 Vaccine. N. Engl. J. Med. 2021, 384, 1576–1578. [Google Scholar]
- Voysey, M.; Clemens, S.A.C.; Madhi, S.A.; Weckx, L.Y.; Folegatti, P.M.; Aley, P.K.; Angus, B.; Baillie, V.L.; Barnabas, S.L.; Bhorat, Q.E.; et al. Safety And Efficacy Of The Chadox1 Ncov-19 Vaccine (AZD1222) Against SARS-Cov-2: An Interim Analysis Of Four Randomised Controlled Trials In Brazil, South Africa, And The UK. Lancet 2021, 397, 99–111. [Google Scholar] [CrossRef]
- Coe, A.; Gatewood, S.; Moczygemba, L.; Goode, J. The Use Of The Health Belief Model To Assess Predictors Of Intent To Receive The Novel (2009) H1N1 Influenza Vaccine. Innov. Pharm. 2012, 3, 2. [Google Scholar] [CrossRef]
- Randolph, J.; Falbe, K.; Manuel, A.K.; Balloun, J.L. A step-by-step guide to propensity score matching in R. Pract. Assess. Res. Eval. 2014, 19, 1–6. [Google Scholar]
- Share of Preference Options. Available online: https://sawtoothsoftware.com/help/lighthouse-studio/manual/hid_shareofpreference.html (accessed on 12 March 2021).
- Wang, J.; Jing, R.; Lai, X.; Zhang, H.; Lyu, Y.; Knoll, M.D.; Fang, H. Acceptance of COVID-19 Vaccination during the COVID-19 Pandemic in China. Vaccines 2020, 8, 482. [Google Scholar] [CrossRef] [PubMed]
- Chodosh, S. Why Only Half of Americans Say They Would Get a COVID-19 Vaccine. Available online: https://www.popsci.com/story/health/covid-19-vaccine-poll/ (accessed on 12 March 2021).
- Kreps, S.; Prasad, S.; Brownstein, J.S.; Hswen, Y.; Garibaldi, B.T.; Zhang, B.; Kriner, D.L. Factors Associated with US Adults’ Likelihood of Accepting COVID-19 Vaccination. JAMA Netw. Open 2020, 3, e2025594. [Google Scholar] [CrossRef] [PubMed]
- 7 in 10 Americans Would Be Likely to Get a Coronavirus Vaccine, Post-ABC Poll Finds. Available online: https://www.washingtonpost.com/health/7-in-10-americans-would-be-likely-to-get-a-coronavirus-vaccine-a-post-abc-poll-finds/2020/06/01/4d1f8f68-a429-11ea-bb20-ebf0921f3bbd_story.html (accessed on 21 March 2021).
- Wong, M.C.S.; Wong, E.L.Y.; Huang, J.; Huang, J.; Cheung, A.W.L.; Law, K.; Chong, M.K.C.; Ng, R.W.Y.; Lai, C.K.C.; Boon, S.S.; et al. Acceptance of the COVID-19 vaccine based on the health belief model: A population-based survey in Hong Kong. Vaccine 2021, 39, 1148–1156. [Google Scholar] [CrossRef]
- McFadden, S.M.; Malik, A.A.; Aguolu, O.G.; Willebrand, K.S.; Omer, S.B. Perceptions of the adult US population regarding the novel coronavirus outbreak. PLoS ONE 2020, 15, e0231808. [Google Scholar] [CrossRef] [PubMed]
- Wilson, K.; Nguyen, T.; Henningsen, H.; Brehaut, J.C.; Hoe, E. Acceptance of a pandemic influenza vaccine: A systematic review of surveys of the general public. Infect. Drug Resist. 2011, 4, 197–207. [Google Scholar] [CrossRef] [Green Version]
- Zijtregtop, E.A.M.; Wilschut, J.; Koelma, N.; Van Delden, J.J.M.; Stolk, R.P.; Van Steenbergen, J.; Broer, J.; Wolters, B.; Postma, M.; Hak, E. Which factors are important in adults’ uptake of a (pre)pandemic influenza vaccine? Vaccine 2009, 28, 207–227. [Google Scholar] [CrossRef]
- National Health Commission of People’s Republic of China. Vaccination Status. 2021. Available online: http://www.nhc.gov.cn/xcs/yqfkdt/gzbd_index.shtml (accessed on 21 March 2021).
- NewsPoints, FirstWord Pharma. Fauci Says Herd Immunity Could Require nearly 90% to get Coronavirus Vaccine. 2020. Available online: https://www.firstwordpharma.com/node/1786647 (accessed on 21 March 2021).
- McNeil, D.G., Jr. How Much Herd Immunity Is Enough? 2021. Available online: https://www.nytimes.com/2020/12/24/health/herd-immunity-covid-coronavirus.html (accessed on 21 March 2021).
- Centers for Disease Control and Prevention. COVID Data Tracker. 2021. Available online: https://covid.cdc.gov/covid-data-tracker/#vaccinations (accessed on 31 March 2021).
- Finance Sina Not Being Vaccinated Is very Dangerous and Will Suffer! Latest Reminder from Zhong Nanshan and Zhang Wenhong. 2021. Available online: https://finance.sina.com.cn/chanjing/cyxw/2021-03-31/doc-ikmxzfmi9945586.shtml (accessed on 31 March 2021).
- Eskola, J.; Duclos, P.; Schuster, M.; Macdonald, N.E. How to deal with vaccine hesitancy? Vaccine 2015, 33, 4215–4217. [Google Scholar] [CrossRef] [Green Version]
- Nowak, G.J.; Gellin, B.G.; MacDonald, N.E.; Butler, R. Addressing vaccine hesitancy: The potential value of commercial and social marketing principles and practices. Vaccine 2015, 33, 4204–4211. [Google Scholar] [CrossRef] [PubMed] [Green Version]
- Bump, J.B.; Friberg, P.; Harper, D.R. International collaboration and covid-19: What are we doing and where are we going? BMJ 2021, 372, n180. [Google Scholar] [CrossRef] [PubMed]
- Wise, J. Covid-19: European countries suspend use of Oxford-AstraZeneca vaccine after reports of blood clots. BMJ 2021, 372, n699. [Google Scholar] [CrossRef] [PubMed]
- Determann, D.; Korfage, I.J.; Lambooij, M.S.; Bliemer, M.; Richardus, J.H.; Steyerberg, E.W.; De Bekker-Grob, E.W. Acceptance of Vaccinations in Pandemic Outbreaks: A Discrete Choice Experiment. PLoS ONE 2014, 9, e102505. [Google Scholar] [CrossRef]
- World Health Organization. Report of the SAGE Working Group on Vaccine Hesitancy; WHO: Geneva, Switzerland, 2014. [Google Scholar]
- Xinhua Net. China to Make COVID-19 Vaccine Global Public Good. 2020. Available online: http://www.xinhuanet.com/english/2020-06/07/c_139121278.htm (accessed on 31 March 2021).
- Michel, J.; Goldberg, J. Education, Healthy Ageing And Vaccine Literacy. J. Nutr. Health Aging 2021, 25, 698–701. [Google Scholar] [CrossRef] [PubMed]


| Demographic Items | Unmatched | Matched | ||||
|---|---|---|---|---|---|---|
| China | United States | p-Value | China | United States | p-Value | |
| Sample size, n | 5374 | 3701 | 1240 | 1240 | ||
| Sex (%) | 0.003 | 1.00 | ||||
| Male | 2385 (44.4%) | 1765 (47.7%) | 534 (43.1%) | 535 (43.1%) | ||
| Female | 2971 (55.3%) | 1918 (51.8%) | 706 (56.9%) | 705 (56.9%) | ||
| Other | 18 (0.3%) | 18 (0.5%) | 0 (0.0%) | 0 (0.0%) | ||
| Age interval in years (%) | ||||||
| 18–25 | 1119 (20.8%) | 501 (13.5%) | <0.001 | 164 (13.2%) | 162 (13.1%) | 1.00 |
| 26–30 | 759 (14.1%) | 762 (20.6%) | 235 (19.0%) | 234 (18.9%) | ||
| 31–35 | 697 (13.0%) | 750 (20.3%) | 244 (19.7%) | 251 (20.2%) | ||
| 36–40 | 488 (9.1%) | 505 (13.6%) | 152 (12.3%) | 152 (12.3%) | ||
| 41–45 | 514 (9.6%) | 368 (9.9%) | 139 (11.2%) | 136 (11.0%) | ||
| 46–50 | 630 (11.7%) | 241 (6.5%) | 105 (8.5%) | 103 (8.3%) | ||
| 51–55 | 429 (8.0%) | 174 (4.7%) | 89 (7.2%) | 84 (6.8%) | ||
| 56–60 | 347 (6.5%) | 154 (4.2%) | 60 (4.8%) | 60 (4.8%) | ||
| Above 60 | 391 (7.3%) | 246 (6.6%) | 52 (4.2%) | 58 (4.7%) | ||
| Highest educational level (%) | ||||||
| Pre-primary education or primary school education | 399 (7.4%) | 2 (0.1%) | <0.001 | Non-postgraduate 1221 (98.5%) | Non- postgraduate 1222 (98.5%) | 0.87 |
| Middle school education | 591 (11.0%) | 15 (0.4%) | ||||
| High school education | 933 (17.4%) | 675 (18.2%) | ||||
| Vocational school education | 887 (16.5%) | 508 (13.7%) | ||||
| Bachelor’s degree | 2021 (37.6%) | 1710 (46.2%) | ||||
| Master’s degree | 422 (7.9%) | 711 (19.2%) | ||||
| PhD degree | 121 (2.3%) | 80 (2.2%) | 19 (1.5%) | 18 (1.5%) | ||
| Occupation and working area (%) | ||||||
| Students | 1230 (22.9%) | 249 (6.7%) | <0.001 | 139 (11.2%) | 132 (10.6%) | 1.00 |
| Managers | 681 (12.7%) | 541 (14.6%) | 178 (14.4%) | 174 (14.0%) | ||
| Professionals | 768 (14.3%) | 993 (26.8%) | 250 (20.2%) | 250 (20.2%) | ||
| Technicians and associate professionals | 795 (14.8%) | 423 (11.4%) | 148 (11.9%) | 157 (12.7%) | ||
| Clerical support workers | 230 (4.3%) | 318 (8.6%) | 121 (9.8%) | 122 (9.8%) | ||
| Service and sales workers | 515 (9.6%) | 453 (12.2%) | 185 (14.9%) | 188 (15.2%) | ||
| Skilled agricultural, forestry and fishery workers | 373 (6.9%) | 43 (1.2%) | 14 (1.1%) | 14 (1.1%) | ||
| Craft and related trade workers | 121 (2.3%) | 78 (2.1%) | 27 (2.2%) | 28 (2.3%) | ||
| Plant and machine operators and assemblers | 184 (3.4%) | 32 (0.9%) | 11 (0.9%) | 11 (0.9%) | ||
| Elementary occupations | 133 (2.5%) | 75 (2.0%) | 16 (1.3%) | 14 (1.1%) | ||
| Armed forces occupations | 73 (1.4%) | 19 (0.5%) | 6 (0.5%) | 4 (0.3%) | ||
| Other | 271 (5.0%) | 477 (12.9%) | 145 (11.7%) | 146 (11.8%) | ||
| Annual salary level (%) | ||||||
| Under USD 10,000 | 2254 (48.0%) | 398 (11.0%) | <0.001 | 335 (27.0%) | 333 (26.9%) | 1.00 |
| USD 10,001–20000 | 1225 (26.1%) | 382 (10.6%) | 257 (20.7%) | 259 (20.9%) | ||
| USD 20,001–30,000 | 561 (12.0%) | 481 (13.3%) | 236 (19.0%) | 236 (19.0%) | ||
| USD 30,001–40,000 | 296 (6.3%) | 472 (13.1%) | 192 (15.5%) | 193 (15.6%) | ||
| USD 40,001–50,000 | 163 (3.5%) | 456 (12.6%) | 91 (7.3%) | 92 (7.4%) | ||
| USD 50,001–60,000 | 55 (1.2%) | 464 (12.8%) | 41 (3.3%) | 40 (3.2%) | ||
| USD 60,001–70,000 | 46 (1.0%) | 331 (9.2%) | 23 (1.9%) | 24 (1.9%) | ||
| Above USD 70,000 | 94 (2.0%) | 630 (17.4%) | 65 (5.2%) | 63 (5.1%) | ||
| Acceptance of vaccination (totally unwilling, 0–totally willing, 10) | ||||||
| Average | 7.8 (2.5) | 7.2 (3.5) | <0.001 | 7.8 (2.4) | 6.9 (3.5) | <0.001 |
| Acceptance of vaccination if someone else recommends (totally unwilling, 0–totally willing, 10) | ||||||
| Average | 7.8 (2.5) | 7.2 (3.3) | <0.001 | 7.8 (2.3) | 6.9 (3.5) | <0.001 |
| Ever been infected with COVID-19? (%) | ||||||
| Yes | 56 (1.0%) | 569 (15.4%) | <0.001 | 21 (1.7%) | 194 (15.6%) | <0.001 |
| No | 5243 (97.6%) | 3102 (83.8%) | 1196 (96.5%) | 1033 (83.3%) | ||
| Not answered | 75 (1.4%) | 30 (0.8%) | 23 (1.9%) | 13 (1.0%) | ||
| Friend family or community ever infected? (%) | ||||||
| Yes | 149 (2.8%) | 2575 (69.6%) | <0.001 | 47 (3.8%) | 815 (65.7%) | <0.001 |
| No | 5110 (95.1%) | 1096 (29.6%) | 1156 (93.2%) | 415 (33.5%) | ||
| Not answered | 115 (2.1%) | 30 (0.8%) | 37 (3.0%) | 10 (0.8%) | ||
| Marital state (%) | ||||||
| Single | 1830 (34.1%) | 1391 (37.6%) | <0.001 | 372 (30.0%) | 522 (42.1%) | <0.001 |
| Married | 3107 (57.8%) | 1905 (51.5%) | 739 (59.6%) | 577 (46.5%) | ||
| Divorced | 185 (3.4%) | 273 (7.4%) | 58 (4.7%) | 98 (7.9%) | ||
| Other | 67 (1.2%) | 109 (2.9%) | 16 (1.3%) | 38 (3.1%) | ||
| Not answered | 185 (3.4%) | 23 (0.6%) | 55 (4.4%) | 5 (0.4%) | ||
| Source of information of COVID-19 vaccines (%) | ||||||
| Healthcare provider | 1844 (34.3%) | 1294 (35.0%) | 0.52 | 433 (34.9%) | 387 (31.2%) | 0.050 |
| CDC or public health department | 2464 (45.9%) | 1958 (52.9%) | <0.001 | 583 (47.0%) | 612 (49.4%) | 0.24 |
| News reports | 3907 (72.7%) | 2333 (63.0%) | <0.001 | 908 (73.2%) | 773 (62.3%) | <0.001 |
| Social media | 2720 (50.6%) | 1490 (40.3%) | <0.001 | 645 (52.0%) | 505 (40.7%) | <0.001 |
| Friends or family members | 2065 (38.4%) | 1199 (32.4%) | <0.001 | 431 (34.8%) | 380 (30.6%) | 0.029 |
| Employers | 422 (7.9%) | 457 (12.3%) | <0.001 | 112 (9.0%) | 110 (8.9%) | 0.89 |
| Pharmaceutical company advertisement | 432 (8.0%) | 123 (3.3%) | <0.001 | 100 (8.1%) | 41 (3.3%) | <0.001 |
| Other | 14 (0.3%) | 54 (1.5%) | <0.001 | 4 (0.3%) | 17 (1.4%) | 0.004 |
| Share of Preference | Base Scenario | Scenario 1 | Scenario 2 | Scenario 3 | Scenario 4 | Scenario 5 | Scenario 6 | Scenario 7 | Scenario 8 |
|---|---|---|---|---|---|---|---|---|---|
| United States | |||||||||
| Vaccine varieties | Inactivated vaccine | Adenovirus vaccine | mRNA | mRNA | Inactivated vaccine | Adenovirus vaccine | Adenovirus vaccine | Adenovirus vaccine | mRNA |
| Adverse effect | moderate | Very mild | Moderate | Mild | Very mild | Mild | Very mild | Very mild | Very mild |
| Efficacy | 55% | 75% | 95% | 95% | 75% | 95% | 65% | 75% | 95% |
| Time for the vaccine to start working | 20 days | 20 days | 20 days | 20 days | 10 days | 20 days | 5 days | 5 days | 5 days |
| The duration of vaccine effectiveness | 5 months | 5 months | 5 months | 5 months | 5 months | 5 months | 5 months | 5 months | 20 months |
| The cost of vaccination | USD 50 | USD 50 | USD 50 | USD 50 | USD 50 | USD 50 | USD 50 | USD 50 | USD 50 |
| Share of preference | 2.9% | 8.2% | 14.2% | 17.3% | 7.7% | 16.2% | 5.2% | 9.2% | 19.1% |
| China | |||||||||
| Vaccine varieties | Adenovirus vaccine | Adenovirus vaccine | mRNA vaccine | mRNA vaccine | Inactivated vaccine | Adenovirus vaccine | Adenovirus vaccine | Adenovirus vaccine | Inactivated vaccine |
| Adverse effect | moderate | Very mild | Moderate | Mild | Very mild | Mild | Very mild | Very mild | Very mild |
| Efficacy | 55% | 75% | 95% | 95% | 75% | 95% | 65% | 75% | 95% |
| Time for the vaccine to start working | 20 days | 20 days | 20 days | 20 days | 10 days | 20 days | 5 days | 5 days | 5 days |
| The duration of vaccine effectiveness | 5 months | 5 months | 5 months | 5 months | 5 months | 5 months | 5 months | 5 months | 20 months |
| The cost of vaccination | USD 50 | USD 50 | USD 50 | USD 50 | USD 50 | USD 50 | USD 50 | USD 50 | USD 50 |
| Share of preference | 4.5% | 10.7% | 9.4% | 13.4% | 13.7% | 12.4% | 7.9% | 10.6% | 17.6% |
| Attributes | Variable | Coefficient | Std. Error | OR | 95% CI | p-Value | Coefficient | Std. Error | OR | 95% CI | p-Value |
|---|---|---|---|---|---|---|---|---|---|---|---|
| United States (n = 1240) | China (n = 1240) | ||||||||||
| Varieties | mRNA | Reference | |||||||||
| Adenovirus vector vaccines | 0.006 | 0.019 | 0.940 | (0.906–0.976) | 0.761 | −0.105 | 0.018 | 0.922 | (0.890–0.954) | <0.001 | |
| Inactivated vaccine | −0.073 | 0.019 | 0.869 | (0.837–0.902) | <0.001 | 0.128 | 0.018 | 1.164 | (1.124–1.205) | <0.001 | |
| Adverse effect | very mild | Reference | |||||||||
| mild | 0.070 | 0.019 | 1.013 | (0.976–1.051) | <0.001 | 0.077 | 0.018 | 0.879 | (0.849–0.910) | <0.001 | |
| moderate | −0.128 | 0.019 | 0.831 | (0.800–0.863) | <0.001 | −0.284 | 0.018 | 0.612 | (0.591–0.635) | <0.001 | |
| Efficacy | 55% | Reference | |||||||||
| 65% | −0.516 | 0.028 | 1.213 | (1.147–1.282) | <0.001 | −0.246 | 0.025 | 1.088 | (1.036–1.144) | <0.001 | |
| 75% | 0.061 | 0.029 | 2.158 | (2.038–2.285) | 0.038 | 0.048 | 0.028 | 1.461 | (1.384–1.543) | 0.084 | |
| 85% | 0.438 | 0.025 | 3.146 | (2.994–3.306) | <0.001 | 0.204 | 0.024 | 1.707 | (1.627–1.791) | <0.001 | |
| 95% | 0.726 | 0.027 | 4.196 | (3.980–4.424) | <0.001 | 0.326 | 0.026 | 1.928 | (1.832–2.030) | <0.001 | |
| Time for the vaccine to start working | 5 days | Reference | |||||||||
| 10 days | −0.035 | 0.024 | 0.904 | (0.863–0.948) | 0.142 | 0.021 | 0.022 | 1.025 | (0.982–1.069) | 0.324 | |
| 15 days | 0.017 | 0.023 | 0.953 | (0.912–0.996) | 0.445 | −0.027 | 0.022 | 0.976 | (0.936–1.019) | 0.217 | |
| 20 days | −0.048 | 0.025 | 0.893 | (0.849–0.938) | 0.060 | 0.008 | 0.024 | 1.011 | (0.965–1.059) | 0.732 | |
| The duration of vaccine effectiveness | 5 months | Reference | |||||||||
| 10 months | −0.081 | 0.024 | 1.148 | (1.096–1.202) | <0.001 | −0.021 | 0.022 | 1.153 | (1.105–1.204) | 0.338 | |
| 15 months | 0.131 | 0.024 | 1.419 | (1.354–1.487) | <0.001 | 0.048 | 0.023 | 1.236 | (1.182–1.292) | 0.035 | |
| 20 months | 0.169 | 0.023 | 1.475 | (1.410–1.543) | <0.001 | 0.136 | 0.022 | 1.350 | (1.293–1.409) | <0.001 | |
| The cost of vaccination | $0 | Reference | |||||||||
| $50 | 0.179 | 0.026 | 0.674 | (0.640–0.709) | <0.001 | 0.162 | 0.025 | 0.776 | (0.740–0.814) | <0.001 | |
| $100 | −0.111 | 0.026 | 0.504 | (0.479–0.530) | <0.001 | −0.029 | 0.024 | 0.641 | (0.612–0.672) | 0.225 | |
| $150 | −0.263 | 0.029 | 0.433 | (0.409–0.458) | <0.001 | −0.200 | 0.027 | 0.540 | (0.513–0.570) | <0.001 | |
| $200 | −0.381 | 0.031 | 0.385 | (0.362–0.409) | <0.001 | −0.349 | 0.029 | 0.466 | (0.440–0.493) | <0.001 | |
Publisher’s Note: MDPI stays neutral with regard to jurisdictional claims in published maps and institutional affiliations. |
© 2021 by the authors. Licensee MDPI, Basel, Switzerland. This article is an open access article distributed under the terms and conditions of the Creative Commons Attribution (CC BY) license (https://creativecommons.org/licenses/by/4.0/).
Share and Cite
Liu, T.; He, Z.; Huang, J.; Yan, N.; Chen, Q.; Huang, F.; Zhang, Y.; Akinwunmi, O.M.; Akinwunmi, B.O.; Zhang, C.J.P.; et al. A Comparison of Vaccine Hesitancy of COVID-19 Vaccination in China and the United States. Vaccines 2021, 9, 649. https://0-doi-org.brum.beds.ac.uk/10.3390/vaccines9060649
Liu T, He Z, Huang J, Yan N, Chen Q, Huang F, Zhang Y, Akinwunmi OM, Akinwunmi BO, Zhang CJP, et al. A Comparison of Vaccine Hesitancy of COVID-19 Vaccination in China and the United States. Vaccines. 2021; 9(6):649. https://0-doi-org.brum.beds.ac.uk/10.3390/vaccines9060649
Chicago/Turabian StyleLiu, Taoran, Zonglin He, Jian Huang, Ni Yan, Qian Chen, Fengqiu Huang, Yuejia Zhang, Omolola M. Akinwunmi, Babatunde O. Akinwunmi, Casper J. P. Zhang, and et al. 2021. "A Comparison of Vaccine Hesitancy of COVID-19 Vaccination in China and the United States" Vaccines 9, no. 6: 649. https://0-doi-org.brum.beds.ac.uk/10.3390/vaccines9060649