Article

Groundwater Remediation of Volatile Organic Compounds Using Nanofiltration and Reverse Osmosis Membranes—A Field Study

by
Thomas J. Ainscough
1,2,
Darren L. Oatley-Radcliffe
1,2,* and
Andrew R. Barron
1,3,4
1
Energy Safety Research Institute (ESRI), Bay Campus, Swansea University, Fabian Way, Swansea SA1 8EN, UK
2
Centre for Water Advanced Technologies and Environmental Research (CWATER), College of Engineering, Bay Campus, Swansea University, Fabian Way, Swansea SA1 8EN, UK
3
Department of Chemistry and Department of Materials Science and Nanoengineering, Rice University, Houston, TX 77005, USA
4
Faculty of Engineering, Universiti Teknologi Brunei, Jalan Tungku Link, Gadong BE1410, Brunei
*
Author to whom correspondence should be addressed.
Submission received: 9 December 2020 / Revised: 11 January 2021 / Accepted: 11 January 2021 / Published: 16 January 2021

Abstract

:
Groundwater contamination by chlorinated hydrocarbons represents a particularly difficult separation to achieve and very little is published on the subject. In this paper, we explore the potential for the removal of chlorinated volatile and non-volatile organics from a site in Bedfordshire UK. The compounds of interest include trichloroethylene (TCE), tetrachloroethylene (PCE), cis-1,2-dichloroethylene (DCE), 2,2-dichloropropane (DCP) and vinyl chloride (VC). The separations were first tested in the laboratory. Microfiltration membranes were of no use in this separation. Nanofiltration membranes performed well and rejections of 70–93% were observed for synthetic solutions and up to 100% for real groundwater samples. Site trials were limited by space and power availability, which resulted in a maximum operating pressure of only 3 bar. Under these conditions, the nanofiltration membrane removed organic materials, but failed to remove VOCs to any significant extent. Initial results with a reverse osmosis membrane were positive, with 93% removal of the VOCs. However, subsequent samples taken demonstrated little removal. Several hypotheses were presented to explain this behavior and the most likely cause of the issue was fouling leading to adsorption of the VOCs onto the membrane and allowing passage through the membrane matrix.

Graphical Abstract

1. Introduction

The remediation of contaminated groundwater is a costly and complex process typically involving multiple stages and systems [1]. Water treatment plants vary greatly depending on the compounds and contaminants in the water source that need to be reduced or removed to below trace levels to meet local environmental standards [2]. A treatment plant can use a combination of physical, chemical and biological steps. A standard setup for hydrocarbon (including volatiles) remediation could include an oil–water separator (OWS) as an initial physical separation stage followed by an activated biological sludge and chemical dosing stage to remove oil emulsions below 150 microns and dissolved organics [3,4]. Often an adsorption stage is included and the selection of the adsorbent material is critical to success [5]. Other combinations of technology for VOC removal are also available and these may include the use of plasma, adsorption and catalysis [6] to name but a few.
Integrated membrane systems for desalination used in drinking water production typically combine a microfiltration (MF) or ultrafiltration (UF) membrane as a prefilter to preserve the integrity and avoid particulate damage of the reverse osmosis (RO) membrane by removing suspended solids and microorganisms [7,8]. Nanofiltration (NF) also plays a predominant role in the drinking water industry [9,10]—NF membranes were initially deployed as water softeners due to their unique capabilities of screening divalent and multivalent ions such as calcium (Ca2+) and magnesium (Mg2+) found in hard water areas [11]. Advances in the development of NF membranes has given NF membranes additional usages in water purification, specifically the removal of naturally occurring organic material including viruses and pesticides [12,13]. NFs are not capable of removing all organic material [14]. However, their inclusion is warranted to reduce fouling of the RO membranes by the organic material they can filter [15,16]. RO membranes will exclude all remaining divalent and multivalent ions, RO will also remove monovalent ions such as sodium (Na+) salts. One of the major costs in the remediation of a contaminated water source is the use of activated carbon adsorption removal of volatile organic compounds (VOCs) [17]. The occurrence of VOCs within local water sources is highly regulated due to the associated health concerns [18,19,20]. Due to the prohibitively expensive nature of activated carbon, the used cartridges can be regenerated using solvent regeneration [21,22], steam regeneration [23,24] or more commonly used thermal regeneration [25,26,27]. Thermal regeneration is conducted by pyrolysis, burning off adsorbed VOCs along with a carrier gas, mainly nitrogen, to remove the VOCs and regenerate the activated carbon. There are two major drawbacks with thermal regeneration—it requires considerable investment in a suitable furnace which will only become financially viable with a high enough quantity of activated carbon [28], and it causes carbon losses of 5–15 wt% [29] or a reduction in adsorptive capacity [30], the addition of new material to make up the absorptive losses is required. Thus, small to medium wastewater treatment plants will dispose of the spent activated carbon through an external company where it will be recycled or regenerated for a cost and a discount on fresh material that would be required is applied.
In this work, our research group was approached by a large multinational company, which will be referred to as Company A for confidentiality purposes, to investigate the use of membrane technology for the removal of VOCs to reduce the expenditure of activated carbon on Company A’s water treatment plants. Previous work [31,32] suggested that a novel super-hydrophilic ceramic microfiltration membrane could be used for this purpose. The study also investigated the use of nanofiltration and reverse osmosis membranes for the application which was conducted using laboratory trials and on site technology deployment.

2. Experimental

2.1. Background Information and Preliminary Testing

The remediation process at the Bedfordshire site involves the clean up of contaminated groundwater and the treatment process involves both liquid and vapor VOC abatement processes; both of which contain granular activated carbon as a treatment process. The groundwater from specifically dug wells in high-contamination areas is pumped to an OWS. The decanted water is passed through an air stripper to remove pollutants with high Henry’s Law coefficients such as trichloroethylene (TCE) and tetrachloroethylene (PCE). The air-stripped VOCs are directed to the vapor treatment process, and the groundwater with any remaining dissolved VOCs is passed through a biological treatment step followed by the granular activated carbon adsorption stage. There is a chemical additive stage prior to being reinjected back into the ground wells.
The contaminated water source is an historically polluted source from a redundant production process, and the water contained over 10 VOCs above trace GC–MS detection. The EPA environmental limit for the compounds found in the water source is 5 ppb, and five compounds were regularly detected above this level—they were TCE, PCE cis-1,2-dichloroethylene (DCE), 2,2-dichloropropane (DCP) and vinyl chloride (VC). The volatile organic compounds had molecular weights between 62.50 g mol−1 (VC) and 165.83 g mol−1 (PCE). The intrinsic hydrophobicity of these compounds varied significantly, as was reflected by the logarithm of their octanol–water partitioning coefficient (XLogP3). As can be seen in Table 1, the properties of the selected volatile organic compounds demonstrated that some compounds are hydrophilic (XLogP3 > 2.5) while others are hydrophobic (XLogP3 < 2.5) and ranged between 1.5 and 3.4. The groundwater at the Bedfordshire site has very little organic content compared to Company A’s other global sites. However, the global scope of the project covers any contaminated groundwater source Company A may have. The project initiated between Swansea University and Company A was to develop a system of removing organic matter contamination from groundwaters on various sites with an initial test site located in the UK. The methodology used in this study was to be based upon the development of a novel super-hydrophilic ceramic membrane system as previously reported [31,32]. Preliminary investigations from this project increased operational understanding of the separation mechanisms of the modified ceramic membrane and have shown that the membrane is very good for separations where the contamination levels are very high. In heavily contaminated systems, there is in effect a biphasic mixture of organic and aqueous components (with some low-level organics dissolved in the aqueous phase). The modified ceramic membrane has been shown to be extremely effective at separating these two phases. However, the low-level organics dissolved within the aqueous phase are not separated to a high degree in this process. Thus, to produce an ultra-clean aqueous stream, an additional NF or RO process is proposed as a polishing step. For this reason, the site strategy for deployment of a pilot system at the site was modified to use a polymeric NF and/or RO membrane.

2.1.1. Pilot-Scale Testing of Ceramic Microfiltration Membranes

All preliminary ceramic membrane filtrations were conducted on a Swansea University MF/UF pilot-scale membrane rig, as pictured in Figure 1. The system used is overengineered for the application required. However, the use of two pumps allows the pressure and cross-flow velocity to be independently controlled, which is beneficial in a research environment. The system was originally designed to be operated as both a micro and ultrafiltration system, capable of operating at pressures of up to 6 bar. However, the system can operate at the much lower pressures required for microfiltration using inverters for the pumps. The system consists of a 100 L stainless steel feed tank, which feeds into the feed pump (Fristam FPE 742, Fristam Pumpen KG, Hamburg, Germany) which can deliver up to 5.5 bar pressure at a flow rate of up to 10 m3/h. The flow then enters the second pump (P2: Fristam FPE 722, Fristam Pumpen KG, Hamburg, Germany), which is capable of delivering up to 3.8 bar at a flow rate of up to 10 m3/h. The flow from P2 then passes through the membrane module. The retentate flows out of the membrane module and enters the optional heat exchanger system. The heat exchanger consists of two shell and tube heat exchangers connected to a cold water and/or steam supply as required. Cold water supply is controlled by a solenoid (Burkert 6213 A, Burkert, Ingelfingen, Germany) connected to a thermostat on the control board. The retentate re-circulates around the loop and returns to the feed tank via a diaphragm valve which sets the loop pressure (large black valve at the top of Figure 1). The system was operated at several pressures controlled via the pumps (P1 and P2) and the return valve. A temperature of 25 °C was maintained throughout the experimental work controlled by the solenoid valves attached to the heat exchangers controlling the steam and water flow rates.
An industrial-scale Pall Membralox 0.2 µm ceramic microfiltration membrane was used (Pall, Portsmouth, UK). The membrane active layer and support are made from alpha-alumina, α-Al2O3, and with an active area of 0.24 m2, the membrane is capable of handling temperatures of up to 95 °C, with a full pH range of 0–14 and a maximum pressure of 8 bar.

2.1.2. Small-Scale Laboratory Testing Equipment for Nanofiltration and Reverse Osmosis

All preliminary NF experiments were conducted at room temperature (22 ± 1 °C) and pH 6.5 ± 0.2, which is the pH of the deionized water (DI) water used throughout the study (Millipore Elix 5, Watford, UK). The filtrations were carried out using a commercially available stirred frontal filtration system (Membranology HP350 Filtration Cell, Membranology Ltd., Swansea, UK), previously described by Oatley-Radcliffe et al. [33] and illustrated in Figure 2. The cell has an operating capacity of 350 mL feed solution and an effective membrane surface area of 41.8 cm2. The filtration solutions were stirred magnetically at 300 rpm, the maximum practical stirrer speed previously determined [34].
Prior to first use, all membranes were soaked in DI water for 24 h. At the start of each series of experiments, the membrane was flushed with DI water at 30 bar for 1 h or 350 mL of filtrate, whichever was achieved first, to reach a steady compressed permeate flux. Following the compression experiment, a membrane clean water flux was recorded for 5, 10, 15, 20, 25 and 30 bar. Rejection experiments were then conducted at the previously stated pressures using toluene at a concentration of 1 g L−1 and a sample of groundwater prefiltered through a 0.2 µm microfilter to remove sediment. The concentrations of toluene and groundwater for the feed solution and permeate samples were analyzed using a total organic carbon analyzer (Shimadzu TOC-LCPH, Shimadzu Corporation, Milton Keynes, UK). Rejection measurements were based on 20 mL of permeate once the initial 5 mL of permeate was discarded, with 25 mL removed in total. After each rejection experiment the membrane was rinsed with DI water to remove any residual materials. Following a period of testing, the membrane pure water flux was retested to assess any deterioration in the membrane performance; this is a simple check for any potential fouling.

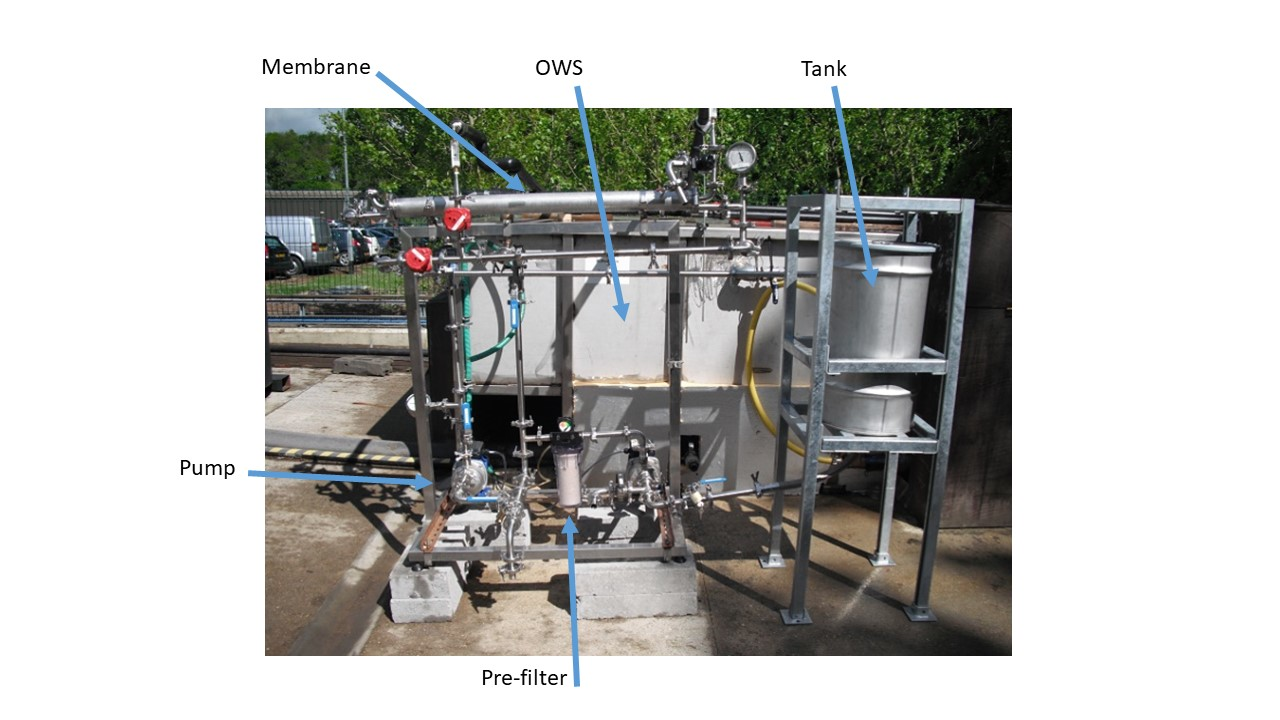
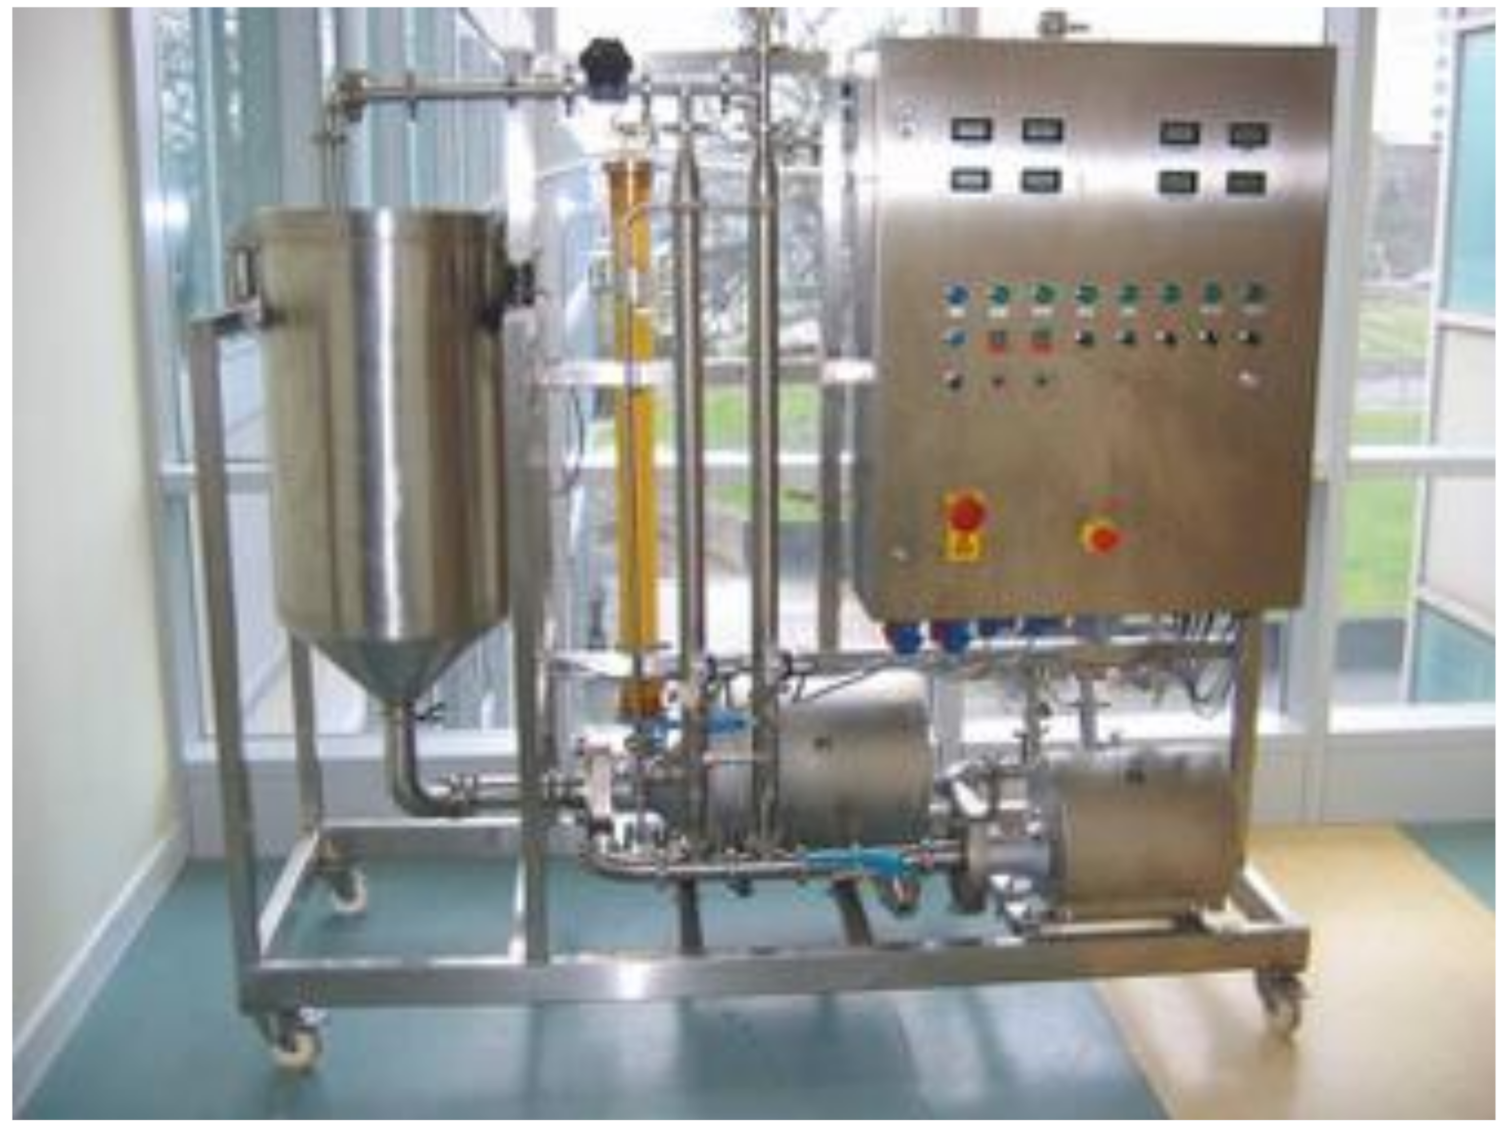
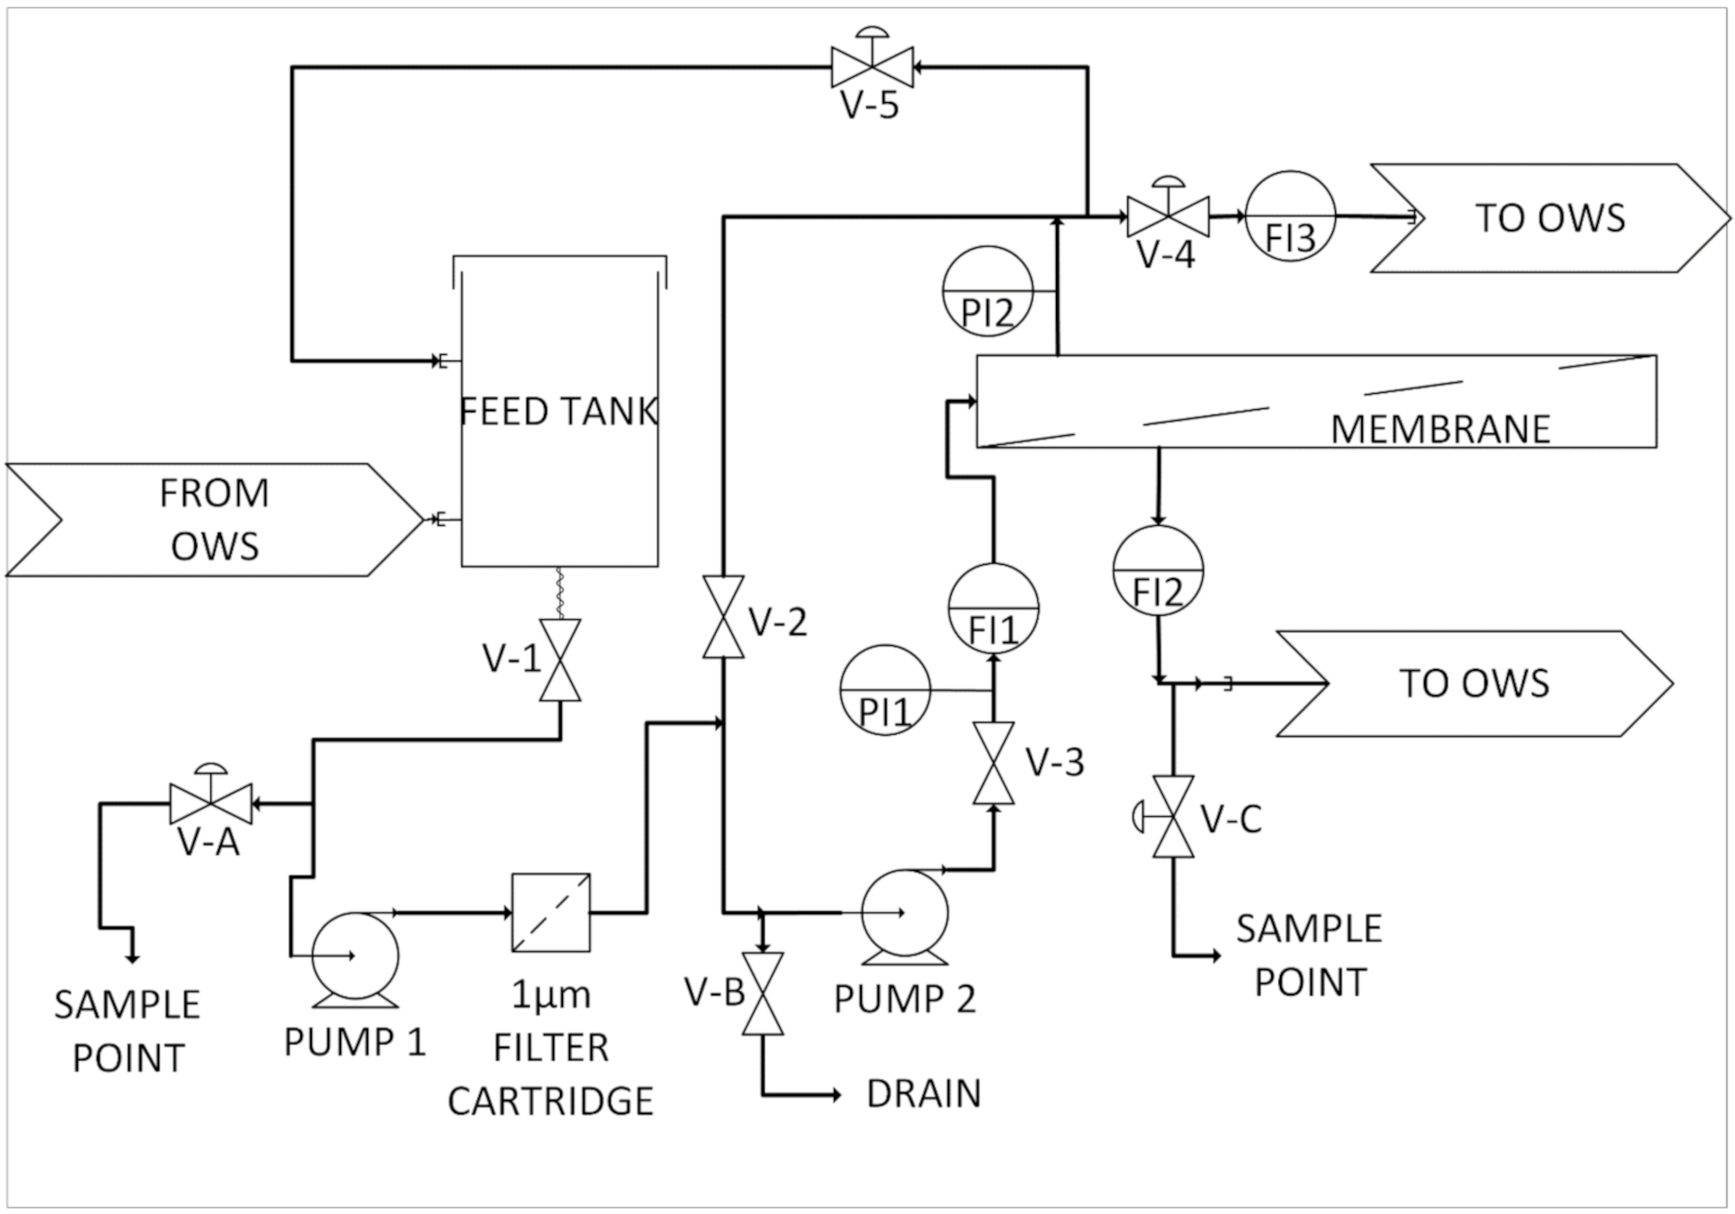
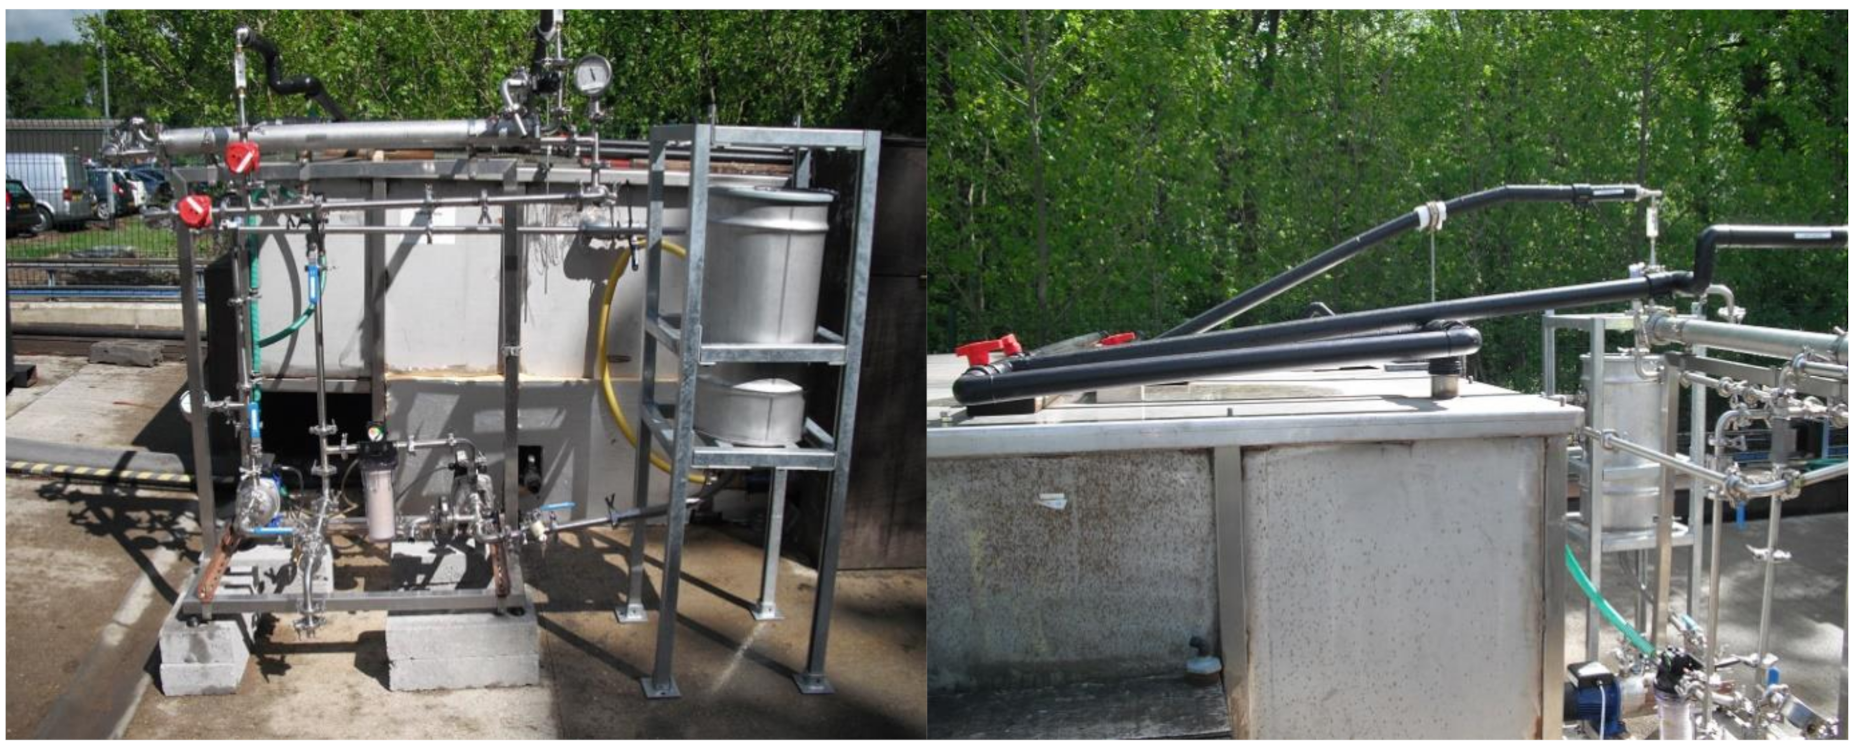
2.2. Nanofiltration/Reverse Osmosis Pilot for Deployment at the Bedfordshire Site

The Bedfordshire site trial was conducted over a 4 month period, with an initial setup and commissioning exercise lasting two days. Due to the limited capacity of the electrical supply identified at the water processing unit, the deployment of a full-scale pilot system was not possible. A simplified pilot rig was constructed to avoid overloading the electrical capacity at the site; however, this simplified rig was not capable of the full operational range normally expected for a membrane process. Most notably, the applied operating feed pressure of this simple rig was limited to only 3.0 bar, with a maximum deliverable pressure of 3.5 bar. The rig was capable of operating in several modes using both polymeric NF and RO 2.5″ membrane modules separately. The membrane system, illustrated in Figure 3, consisted of a custom fabricated stainless steel feed tank (Axium Process Ltd., Hendy, UK) and in house-built Unistrut frame designed to be fully adjustable to allow the tank to be gravity fed from the OWS whilst also preventing the OWS from being fully drained. From the feed tank, pump 1 (Lowara-4HMS3/A) was used to provide pressure and top up flow to the membrane system. Following the pump was a filter cartridge housing (Pentek-3G housing) containing a string wound polypropylene 1.0 micron pre filter (Prosep) used to protect the NF or RO membrane from particulate debris. A second pump (Lowara-4HMS3/A) was used to provide circulation flow through the NF or RO membrane. After the second pump, a pressure gauge (Wika 232.50 and L990.22 Sanitary Seal) indicated the pressure of the membrane feed. A paddle flowmeter (Burkert S030 DN25 and Burkert 8035) allowed the flow rate through the membrane to be recorded, a parameter needed for calculating the cross-flow velocity needed for understanding the membrane performance throughout the trial. Both membranes were contained within a custom stainless steel housing (Axium Process Ltd., Hendy, UK). A second pressure gauge after the membrane indicated the pressure of the membrane retentate, in conjunction with the first pressure gauge the transmembrane pressure can be calculated to allow the calculation of the membrane flux per bar across the membrane. A flowmeter (Omega Engineering) was placed on the membrane retentate return to the OWS. This flowmeter was switched out between a FL7205 and FL2098 depending on operation of the rig, with the majority of retentate being recycled to the Swansea feed tank or back to the OWS, respectively. In addition, a flowmeter (Omega Engineering-FL7201) on the membrane permeate outlet was used to monitor the permeate flow rate, a parameter used to monitor the membrane performance by calculating the membrane flux using the known surface area of the membrane. A schematic of the pilot plant is included in Figure 3 and photographed in Figure 4.
All materials processed during the site trial were removed from the existing OWS within the groundwater facility and returned to the OWS following processing, i.e., there was no risk of non-treatment leading to non-compliance of the site during the trial period.
Throughout the trial, either total organic carbon (TOC) analysis conducted by Swansea University (Shimadzu, TOC-LPH, Milton Keynes, UK) or gas chromatography mass spectrometry (GC–MS) conducted by Natural Resources Wales (NRW, Llanelli, UK) using a method equivalent to that of the EPA 8260b for volatile organic compounds (VOCs) was used to analyze the separation performance.
The NF membrane used was a GE Osmonics DK series (model: DK2540F1073). The RO membrane used was a GE Osmonics AK series (model: AK2540TM).

2.3. Laboratory Analysis

2.3.1. General Laboratory Filtration Trials

Salt rejection was measured at the previously stated pressures using sodium chloride (NaCl) (Fisher Scientific, Loughborough, UK) at a concentration of 2000 ppm, and the conductivity of feed and permeate samples was measured using a conductivity probe (Jenway Model 3450). Toluene rejection was measured at the previously stated pressures using toluene (Reagent grade, Fisher Scientific, Loughborough, UK) at a concentration of 100 ppm, and the concentrations of feed and permeate samples were measured using a total organic carbon analyzer (Shimadzu TOC-LCPH, Shimadzu Corporation, Milton Keynes, UK). TCE rejection was measured on its own at the previously stated pressures using TCE (Puriss ≥ 99.5% (GC), Sigma, Gillingham, UK) at a concentration of 100 ppm, and the concentrations of feed and permeate samples were measured using a total organic carbon analyzer (Shimadzu TOC-LCPH, Shimadzu Corporation, Milton Keynes, UK). A feed VOC mixture of TCE, PCE, DCE and DCP (Sigma, Gillingham, UK) was created with a concentration of 100 ppm for all solvents. For all feed batches, the VOCs were initially dissolved in 50 mL of methanol (Fisher Scientific, Loughborough, UK) and added to a 5 L flask. A further 50 mL of methanol was added to the measuring cylinder and transferred to the 5 L flask to avoid any residual VOCs clinging to the glassware. VOC rejection was measured at the previously stated pressures. Feed and permeate samples were measured using a headspace GC–MS system at Swansea University (Agilent GC 6850, MS 5977A, HS 7697A 12-vial) not previously available during the preliminary and pilot-scale trial. Two calibrations were conducted—a ppb calibration and ppm calibration—with the following standards: blank, 10, 50, 100, 250, 500, and 1000 ppb and 1, 10, 50, 100, and 150 ppm, respectively. Data acquisition and analyses were performed using the MassHunter Workstation software with quantification using the selected ion monitoring (SIM) method. See Table 2 for GC–MS HS method.
All rejection measurements analyzed by TOC were based on 20 mL of permeate once the initial 5 mL of permeate was discarded, with 25 mL removed in total. All GC–MS rejection measurements were based on 10 mL of permeate once the initial 5 mL of permeate was discarded, with 15 mL removed in total. After each rejection experiment, the membrane was rinsed with DI water to remove any residual solvent. Following each experiment set—NaCl, toluene, TCE and VOC mixture, respectively—a clean water flux was conducted at 20 bar to ensure the membrane was not deteriorating or fouling.

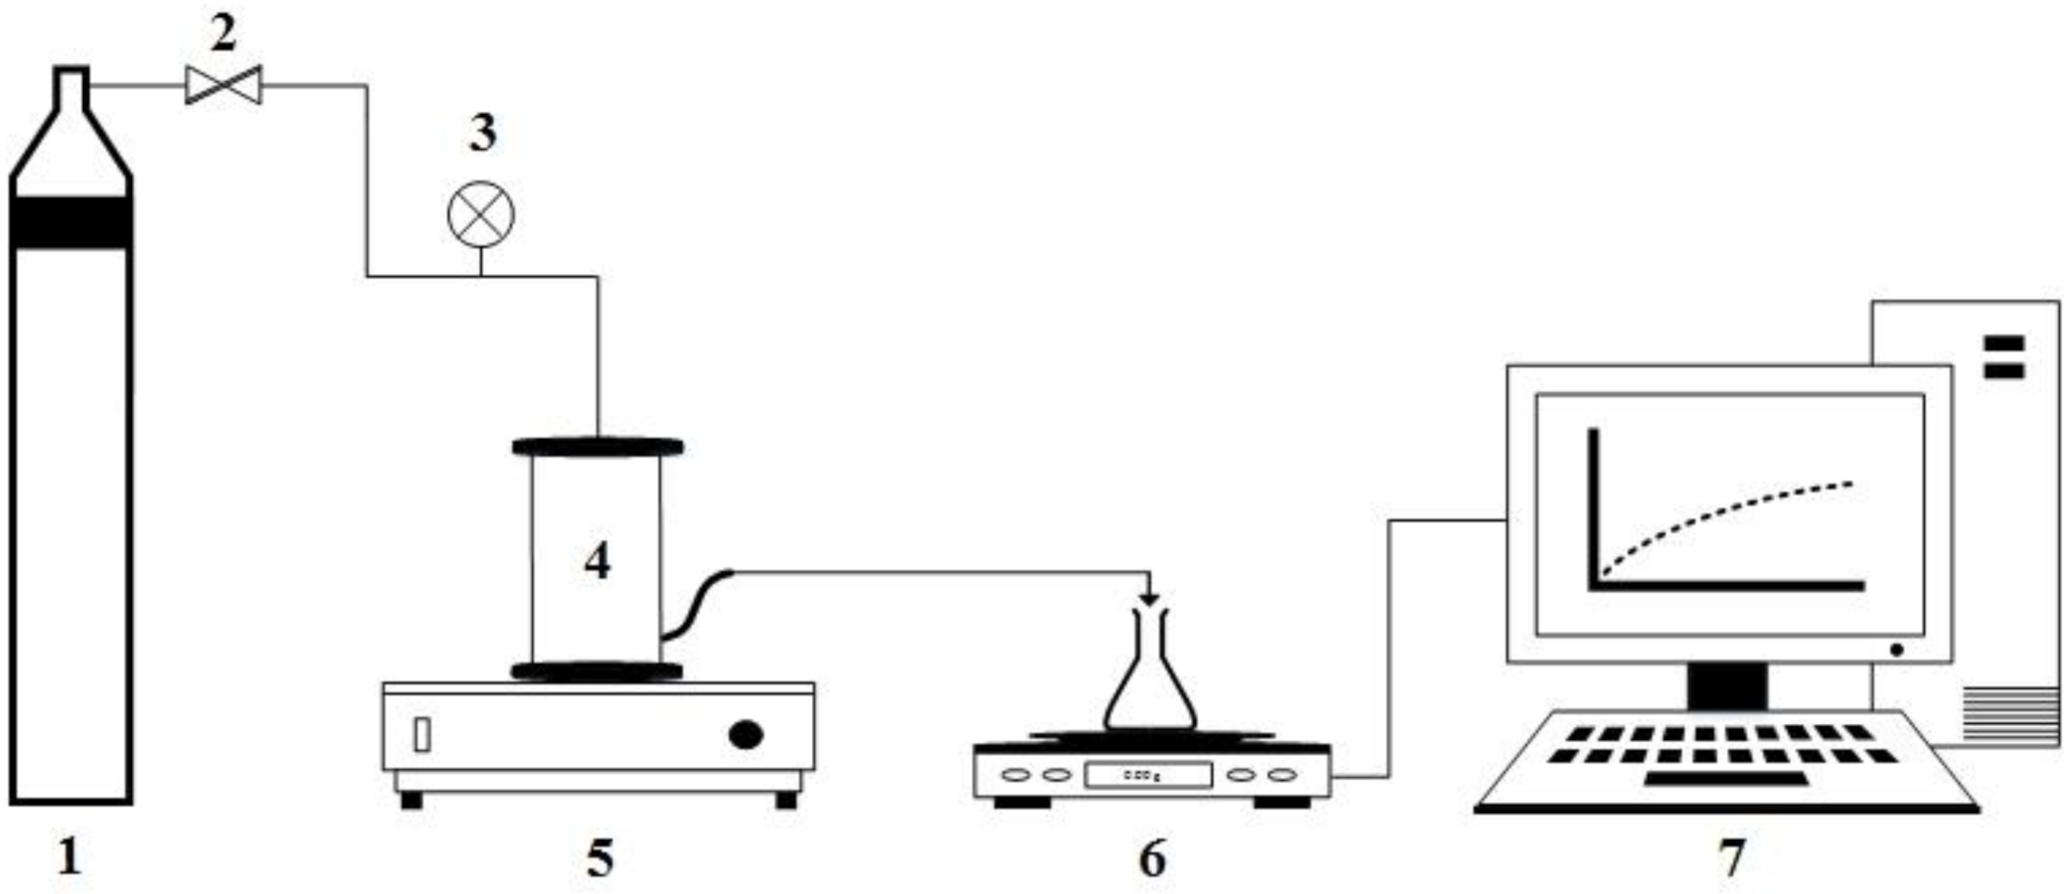
2.3.2. Contact Angle Measurements

Contact angles of the dry membranes were measured using a VCA Optima contact angle analyzer (AST Products Inc., Billerica, USA) using the static sessile drop method. A droplet of ultrapure water obtained from the Millipore Elix 5 was delivered onto the dry membrane surface and a static image of the droplet was taken after contact with the surface. Contact angle measurements performed using the VCA Optima software for each membrane at 5 different locations were recorded and the average taken. Contact angles and standard deviations are included in Table 3a,b.

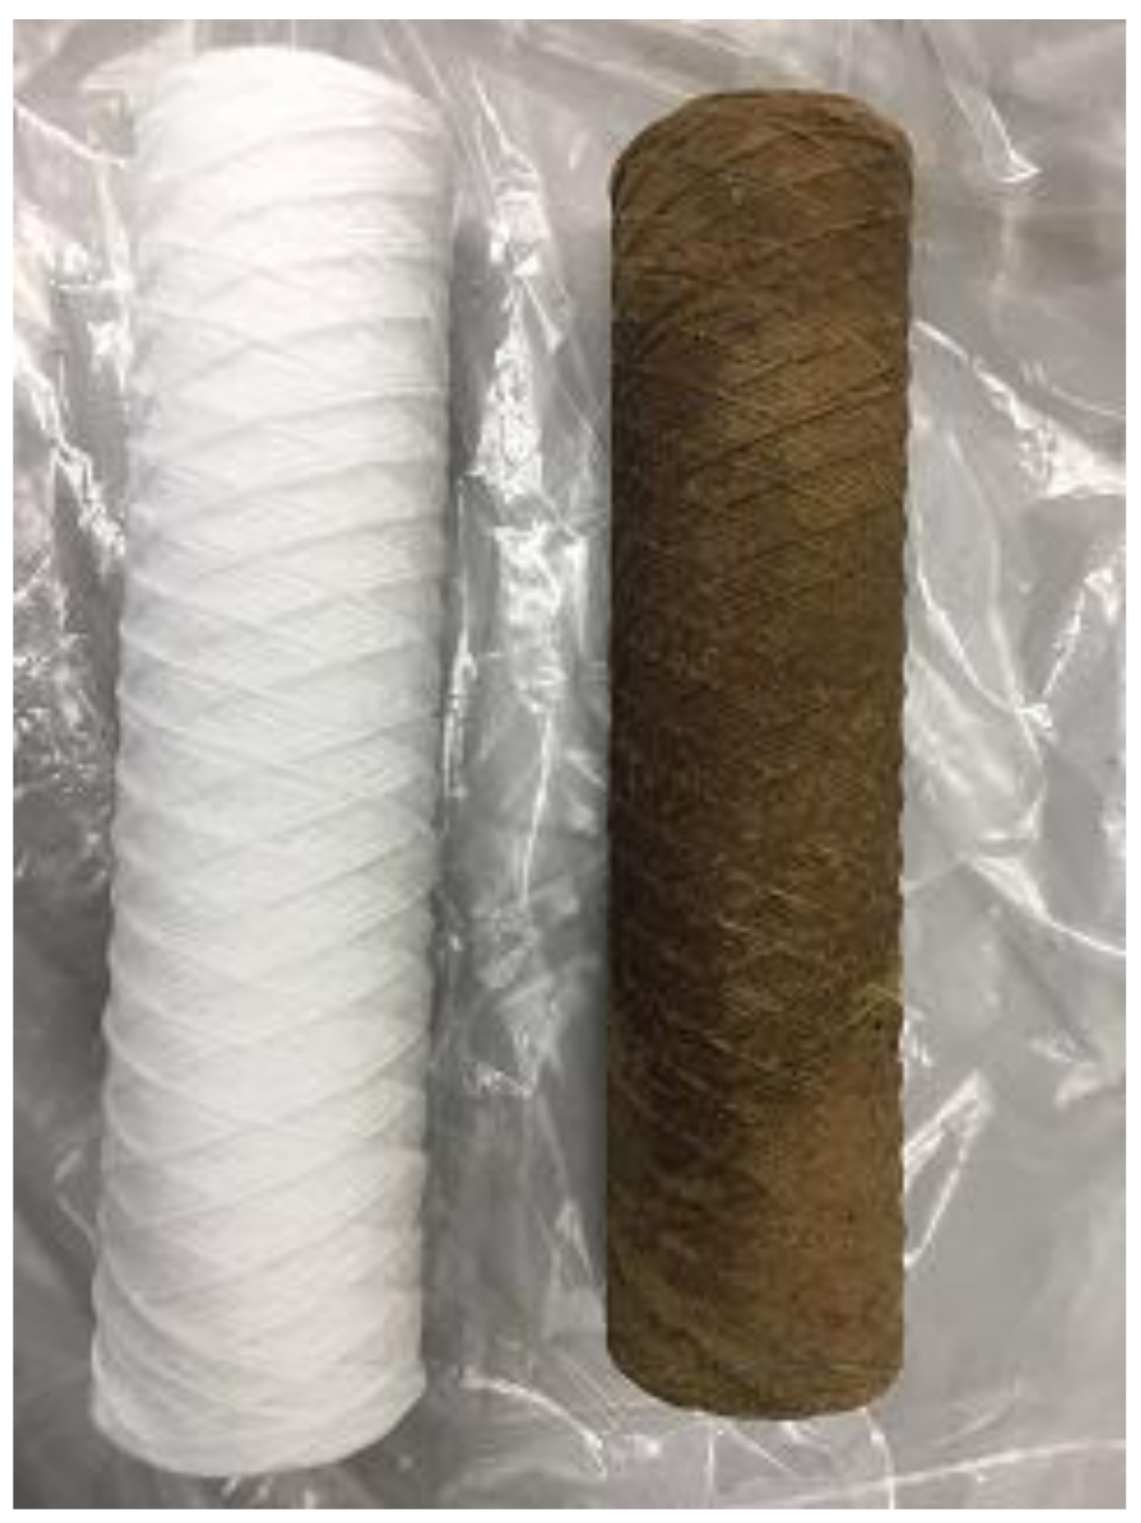
2.3.3. Membranes Used

The membranes used in this study were obtained in either flat sheet format for laboratory trials or spiral wound format for pilot and deployment trials. Four NF membranes were used in total; namely, the DK and DL membranes sourced from GE Osmonics and the NF90 and NF270 sourced from Dow Filmtec. Five RO membranes were used and these were the AK and AG (GE Osmonics) and the BW30, BW30LE and BW30XFR (Dow Filmtec). Full details of the NF and RO membranes are illustrated in Table 3a,b, respectively.

2.4. Rejection Theory

The experimental rejection characteristics of a membrane are usually defined by the observed rejection:
R obs = 1 C P C F
where CF and CP are the concentrations of the feed and permeate, respectively. However, due to concentration polarization, the concentration at the membrane surface, CW is higher than that of the bulk feed concentration, CF. Therefore, real rejection of the solute, Rreal, which is always equal to or greater than Robs is defined as:
R real = 1 C P C W
The concentration at the wall, CW, can be calculated indirectly using a suitable model for concentration polarization [33,34,35]. The approach to concentration polarization taken in this study is that of the infinite rejection method first reported by Nakao and Kimura [36] and given as:
exp J v k =   C W C P C F C P
where k is the mass transfer, defined as:
k =   D eff , δ
and D eff , is the diffusion coefficient at infinite dilution and δ is the thickness of the concentration polarization layer.
The mass transfer coefficient may be determined experimentally by the substitution of Equations (1) and (2) into Equation (3), yielding:
ln 1   R obs R obs =   J v k +   ln 1   R real R real
In this case, the mass transfer coefficient may be represented as
k = a ω n
where a and n are predetermined constants and ω is the stirrer speed. For the Membranology cell, these constants are 2.993 × 10⁻⁶ and 0.415, respectively [34].

3. Results and Discussion

3.1. Preliminary Experiments

As previously alluded to, our understanding of the modified ceramic separation capabilities changed during the preliminary investigations into their use for this study. Previous and ongoing work using frack-produced water has demonstrated that the membranes are capable of cleaning water at the molecular level [32]. These waters are heavily contaminated far beyond solubility limits, resulting in biphasic mixtures and oil–water emulsions. Under these conditions, the modified ceramics are capable of separating small hydrocarbons such as toluene. However, upon attempting to use these membranes on a saturated toluene solution in just DI water, 1 g L−1 at 20 °C, no separation occurred. Therefore, the modified ceramics would not be suitable for the Bedfordshire trial, or at least not the only type of filter, hence exploratory NF laboratory studies were conducted to assess potential. The same toluene–water concentration solution that was showing 0% rejection with the ceramic membranes was rejecting between 70% and 93% of toluene using a NF membrane with a transmembrane pressure (TMP) of 2.5–20 bar, respectively. See Table 4.
With a successful separation, a further experiment using a 350 mL sample of the Bedfordshire site water was run. The sample was prefiltered by a 0.2 micron ceramic membrane prior to feed analysis and NF filtration occurring. It was first discovered during this experiment that the total organic carbon content of the feed water was considerably lower than expected. The results of the test are shown below in Table 5.
The NF DK series showed excellent overall organic carbon removal even at relatively low pressures. Unfortunately, the GC–MS equipment was not available at this stage to test specific volatile organic removal capabilities of the membrane.

3.2. Pilot Scale

3.2.1. Nanofiltration

The initial setup employed a GE DK series NF membrane, set to operate with most the retentate (concentrated dirty water) from the membrane directed back to the Swansea feed tank, whilst a small bleed of retentate and clean water permeate was returned to the OWS. In this configuration, if the membrane performed well and separated the volatile organic carbons, then the concentration of these organics in the Swansea feed tank would steadily increase. Further, the configuration removes only a small quantity of liquids from the OWS to replenish the lost permeate from the pilot rig to avoid increased mixing within the OWS. After 4 weeks of operation, the configuration was changed to return both the retentate and the permeate back to the OWS. In this mode, the membrane process is no longer a recycle of retentate or concentration process, but a once-through continuous process more suitable for larger-scale operations. During the once-through trial period, an observation was made that the prefilter experienced considerable fouling compared to the recycle mode of operation. See Figure 5. This was most likely the result of the increased flow of liquid from the OWS causing settled sediment within the OWS to be dispersed and transferred to the pilot system. There is also the possibility that during this period of operation, the well pumps were sending more silt to the OWS. Prior to deployment, it was recommended that a prefilter be installed in the system as a precaution despite the OWS water containing ‘minimal solids.’ Throughout the trial, the solids concentration of the OWS water was above what would be considered minimal for a NF membrane system under normal operation—a permanent system would have to cope with this level of solids more appropriately than weekly filter changes such as the incorporation of the functionalized ceramic microfiltration membrane. The decision was made to return to the original configuration to prevent starving the second pump or deadheading the first pump should the prefilter block completely.
The feed to the pilot from the Bedfordshire OWS contained five major compounds in varying quantities, totaling between 7358 and 1360 ppb across the trial period. The GC–MS data of the five main compounds are shown graphically in Figure 6a–e for VC, DCE, DCP, TCE and PCE, respectively.
For both operating configurations, the GC–MS method for VOCs detected very little or no separation occurring during the NF trial, with the feed and permeate samples being comparable. As an example, sample data from 27th May of the five main compounds, shown in Table 6, clearly show no separation of the VOCs occurring.
The results for the NF were disappointing but not completely unexpected if the membranes were to follow normal separation principles. It is well known from literature [37] that rejection of a solute is dependent on the applied pressure for steric rejection—the higher the applied pressure, the higher the rejection. At low pressures, or Bedfordshire trial operating pressures, the rejections are considerably lower than the rejection expected at typical operating pressures of NF and RO membranes. During the NF stage of the trial, TOC analysis was conducted in conjunction with the GC–MS analysis. As shown in Table 7, on average, 75% of the total organic carbon was removed by the NF membrane.
A rejection of 75% organic carbon is a much more positive result than the equivalent VOC rejection—the 1 µm prefilter (microfilter) will absorb only a fraction, if any, dissolved organic carbon. This is clear evidence that the NF membrane is still separating some organics, if not quite as efficiently as the laboratory conditions—the use of an NF is not entirely redundant as the removal of organics will assist in preventing an RO membrane downstream from being fouled. When trying to understand why the membrane displayed reduced organic carbon, the harsher conditions found in real-world trial conditions and the damage potentially inflicted on the membrane module must be considered. If the membrane had been damaged or pore sizes enlarged by the water contaminants, then the permeate flux would have been much greater than a flux of 5 LMH/bar, as suggested by the manufacturer. Upon closer examination of the recorded permeate flow rates and operating pressures during the trial, the membrane flux performance changed very little throughout the trial, with the specific flux averaging 5.45 LMH/bar ± 0.5 during operation. See Table 8.
Therefore, the membrane was not inadvertently damaged by dissolved solids or other materials. Despite the nanofiltration membrane not removing the VOCs, it effectively removed a large percentage of other organic carbons in the water source. As previously noted, the operating pressure of 3 bar is very low for a NF membrane of this type. A minimum operating pressure would usually be 8 bar(g), with a preferred operating pressure upwards of 20–30 bar(g). Increasing the operating pressure could potentially improve the rejection characteristics of the membrane. However, the lack of rejection of the VOCs even at 3 bar(g) suggests that VOC removal may not be viable with an NF membrane and only a trial using more appropriate equipment could confirm this fact. However, the initial proposal of using a ceramic microfilter required a reduced pressure system. To confirm this conclusion further in-house laboratory testing was necessary to gather rejection data at higher pressures (5–30 bar).
Upon analyzing the used pilot membrane, the membrane surface was considerably fouled see Figure 7. This fouling layer does not appear to have affected the permeate flow rate due to the pore size of the membrane being considerably smaller than the expected pore size of the foulant. However, this filter cake could have significantly affected the separation properties of the membrane, negating the surface charge effects [38,39].

3.2.2. Reverse Osmosis

Prior to the Bedfordshire deployment, there were concerns that the nanofiltration membrane would not be fully effective at removing the VOCs to below the levels desired due to the pore size and reduced pressures being used. As a result, a low-energy RO membrane was purchased ready to switch out the nanofiltration membrane during the trial if necessary. A low-energy RO is designed to operate at a much lower pressure, 7 to 10 bar(g), than normal RO pressures (>60 bar) while separating 98% of NaCl versus 99.5% NaCl, respectively. Despite the Bedfordshire pilot rig pressure being limited to 3 bar, the low-energy RO membrane was anticipated to yield better separation than the NF membrane and considerably better separation than a standard RO membrane.
Due to circumstances outside of our control, TOC analysis was unavailable during the RO trial period. The GC–MS results for VOCs showed 92.8% removal on the first sample taken after an hour of operation. See Table 9.
This was a very promising result considering the membrane was being operated at a pressure considerably less than optimum, suggesting that a further increase in pressure would increase the separation capabilities beyond 93% rejection of the VOCs. However, the following sample (two weeks later) and those beyond showed no VOC separation. See Table 10.
Once again, if the membrane had been damaged, then the permeate flux would have been much greater than the initial flux when the membrane was first installed. The results indicate that the specific flux did not change significantly during the sample period. See Table 11.
The membrane does appear to have experienced considerable fouling towards the end of the trial as the specific flux drops to approximately 29% of the original value. Membrane fouling can affect the quality of rejection, the surface charge of the membrane can be severely impacted by the build up of a fouling layer, and this may well explain the results seen [40,41]. Also of note during this period of operation, the prefilter experienced considerable fouling by silt. It is possible that the silt saturated the microfilter, and was forced through to the RO membrane and that this then had a detrimental effect on the membrane performance. This silt contamination was confirmed post trial. See Figure 8a,b. In addition, the dissolved organic material rejected by the NF membrane would also be rejected (and to a higher extent) by the RO membrane and could possibly cause fouling. However, without GC–MS data for the latter stages of the RO trial and no TOC data throughout, a categorical confirmation that fouling is the reason behind this reduced separation is not possible from the pilot-scale trials.
As with the NF trial, further testing on the RO membranes across an increased pressure range, including TOC and GC–MS analysis at the Bedfordshire site conditions and the operating conditions suggested by the manufacturer, was required. At the same time, an investigation into the fouling effects on the membrane under more stringent monitoring conditions should be conducted. This will determine whether fouling caused the rejection of the VOCs to drop so drastically. As a final note on the pilot-scale trial, during decommissioning of the system, it was discovered that one of the side port ferrules had been severely rusted on the stainless steel feed tank. Further, multiple pin holes were found on the side of the tank. See Figure 9. The tank was returned to the manufacturer for diagnostic analysis. The manufacturer’s report indicated that the tank was made of an inferior quality stainless steel, 304, while all other components of the system were 316 L. The ferrule issue was also a result of the stainless steel used and the thickness of the tank. The ferrule was 316 L grade, and as a result, 316 L weld filler was used, which requires a higher temperature than 304 weld filler. When heated to the higher welding temperatures, the chromium combines with the carbon, leaving the steel short of chromium. Therefore, any further systems should be fully constructed from 316 L as a minimum. However, the use of a suitable plastic such as PVC or HDPE would be recommended to considerably reduce the cost of any subsequent system.

3.2.3. Contact Angle

The contact angle was measured for the fouled DK and AK pilot-scale trial membranes, and the DK NF membrane hydrophobicity increased significantly to 72.88 ± 0.78°. The AK RO membrane, on the other hand, behaved in the opposite manner—the hydrophilicity increased to 48.76 ± 2.52°. Similar phenomena have been reported previously [39,42].

3.3. Laboratory Scale

3.3.1. TOC Analysis

Additional testing under laboratory conditions was necessary to understand the results of the pilot-scale trial. As well as the GE DK membrane used in the pilot scale, another three NF membranes were tested, as listed in Table 3a. As for RO, together with the pilot-scale RO membrane, GE Osmonics AK, an additional four RO membranes were assessed, as shown in Table 3b. The first experiment was investigating salt rejection, and the reason for this test was twofold. Firstly, membrane manufacturers supply NaCl rejection data for RO at a specific operating condition, and therefore this testing allows comparison with the manufacturer’s published results as a secondary check that the membrane is operating as expected. Secondly, the treated groundwater will eventually be released back into the local water supply, and since a change in groundwater salinity may have an adverse effect on the local environment, this must be monitored and balanced. The second set of experiments using toluene, an immiscible aromatic hydrocarbon, were used to replicate a very common groundwater contamination of a water–oil biphasic mixture with extremely low solubility, 0.52 g/L at 20 °C. The final set of experiments were on a TCE–water mixture, the predominant contaminate found in the groundwater at the Bedfordshire site. TOC analysis was used to analyze the rejection as the GC–MS was initially unavailable. Results from all three experimental sets conducted for nine membranes can be found in Table 12a–i.
The rejection of NaCl for NF membranes is not widely published by the manufacturer as NF is primarily used as a water softener, typically removing divalent salts not monovalent. However, literature values suggest that a NaCl rejection of 5–95% can be expected for NF depending on feed salinity and operating conditions [43]. Clean water fluxes obtained from the new membranes confirmed that the membranes were operating effectively. Toluene is a relatively inexpensive solvent, making it ideal as an initial solvent to test the performance of the NF membranes. As previously discussed, toluene has a low solubility with water at room temperature. When the concentration exceeds the solubility limit, the solution forms a biphasic mixture with a top layer of toluene. Due to this nature of biphasic mixtures, representative sampling can be particularly difficult to achieve. To avoid these difficulties, the feed concentration selected, 0.1 g L−1, removes the potential for inaccurate feed concentration samples. For all four NF membranes, the observed rejection decreases as the applied pressure increases. For example, for Dow NF90, the observed rejection is 90.4% to 51.7%, between 5 and 30 bar, respectively—this is counter to the real rejection, which takes concentration polarization at the membrane surface into account. The real rejection ranges between 88.1% and 99%, respectively, and the greatest difference between the observed and real rejection, ≥60%, is at the highest pressures. This occurrence is sensible, since as the pressure increases, the flux rate increases, and the resulting mass transfer is governed by convective transport of solute to the membrane surface. This convective flux to the membrane surface is significantly higher than the mixing rate removing solute from the membrane surface and thus concentration polarization is inevitable. The rejection data obtained for TCE demonstrate a similar pattern. However, the observed and real rejections are both lower when compared to the equivalent toluene results. If nanofiltration separation was based solely on steric (size) exclusion, then we would expect to see toluene rejecting less than TCE due to its lower MW. However, previous studies have proven that NF exhibits a combination of separation mechanisms from both UF and RO, steric and Donnan (charge) exclusion or ionic diffusion, respectively [44,45,46]. All four membranes exhibit a similar decline in observed rejection from 5 to 15 bar, to varying degrees. Between 15 and 30 bar, the rejection appears to reach a plateau, with only some slight fluctuations observed.
The rejection of NaCl for RO membranes is published by the manufacturer, allowing a cheap and relatively simple way of testing the membranes integrity. GE Osmonics market the AK as a low-energy brackish water reverse osmosis (BWRO) with a minimum NaCl rejection of 98% using a 500 ppm NaCl solution, with operating conditions of 8 bar pressure, 25 °C and pH 7.5. As shown in Table 12e, the observed rejection was less than the advertised minimum. However, this can be explained as the feed solution used was 4-fold above the manufacturer test solution, 2000 ppm. A higher feed NaCl concentration increases the salt gradient between the feed and permeate or osmotic difference. An increase in osmotic gradient requires a higher applied pressure to overcome the osmotic pressure to maintain the permeate flux. With a constant pressure, the water flux decreases, and therefore salt passage increases. GE Osmonics tests on the AG series use a 2000 ppm NaCl solution, with operating conditions set as 15.5 bar operating pressure, 25 °C and pH 7.5. The AG series is marketed as a standard BWRO with a minimum NaCl rejection of 99%. It is unclear why GE use two different feed solutions for comparable membranes. As shown in Table 12f, the observed rejection was 99.2% at 15 bar. Dow Filmtec publicize the BW30 as a low-energy BWRO with a minimum NaCl rejection of 99% using a 2000 ppm NaCl solution, with operating conditions of 15.5 bar pressure, 25 °C and pH 8. As shown in Table 12g, BW30 only obtained a salt rejection of 96.1%. BW30LE, a low-energy BWRO, has a minimum NaCl rejection of 98% using a 2000 ppm NaCl solution, with operating conditions of 10 bar pressure, 25 °C and pH 8. As shown in Table 12h, BW30LE only obtained an observed salt rejection of 94.3%. The final Dow Filmtec membrane, BW30XFR, is an optimized extra fouling-resistant BWRO membrane. Dow claim a minimum salt rejection of 99.4%, and operational conditions are the same as those used in BW30. When tested, the membrane attained a salt rejection of 96.8%, as noted in Table 12i. It is unclear whether the manufacturers’ stated minimum rejections are observed or calculated real rejections. It is assumed that the published data are observed, but if the results are real, the results in this study are closer to the manufacturers’ values. The RO membranes exhibit the same separation tendencies as the NF membranes for toluene and TCE, but with higher observed rejections for all the RO membranes. As reverse osmosis membranes have no physical pores, size exclusion is no longer a separation mechanism. Solute passage is determined purely by solution diffusion, thus, the increased rejection for the RO membranes is entirely logical. Comparing the observed rejection and calculated real rejection, the variances between them are less pronounced compared to the NF membranes. This fully agrees with the NF filtration pressure increase vs. observed/real rejection theory—increased convective flux results in increased concentration polarization. RO membranes have a greatly reduced specific flux when evaluated against NF membranes. A lower permeate flux produces less convection to the membrane surface, which in turn minimizes concentration polarization, hence, less discrepancy between observed and real rejection.

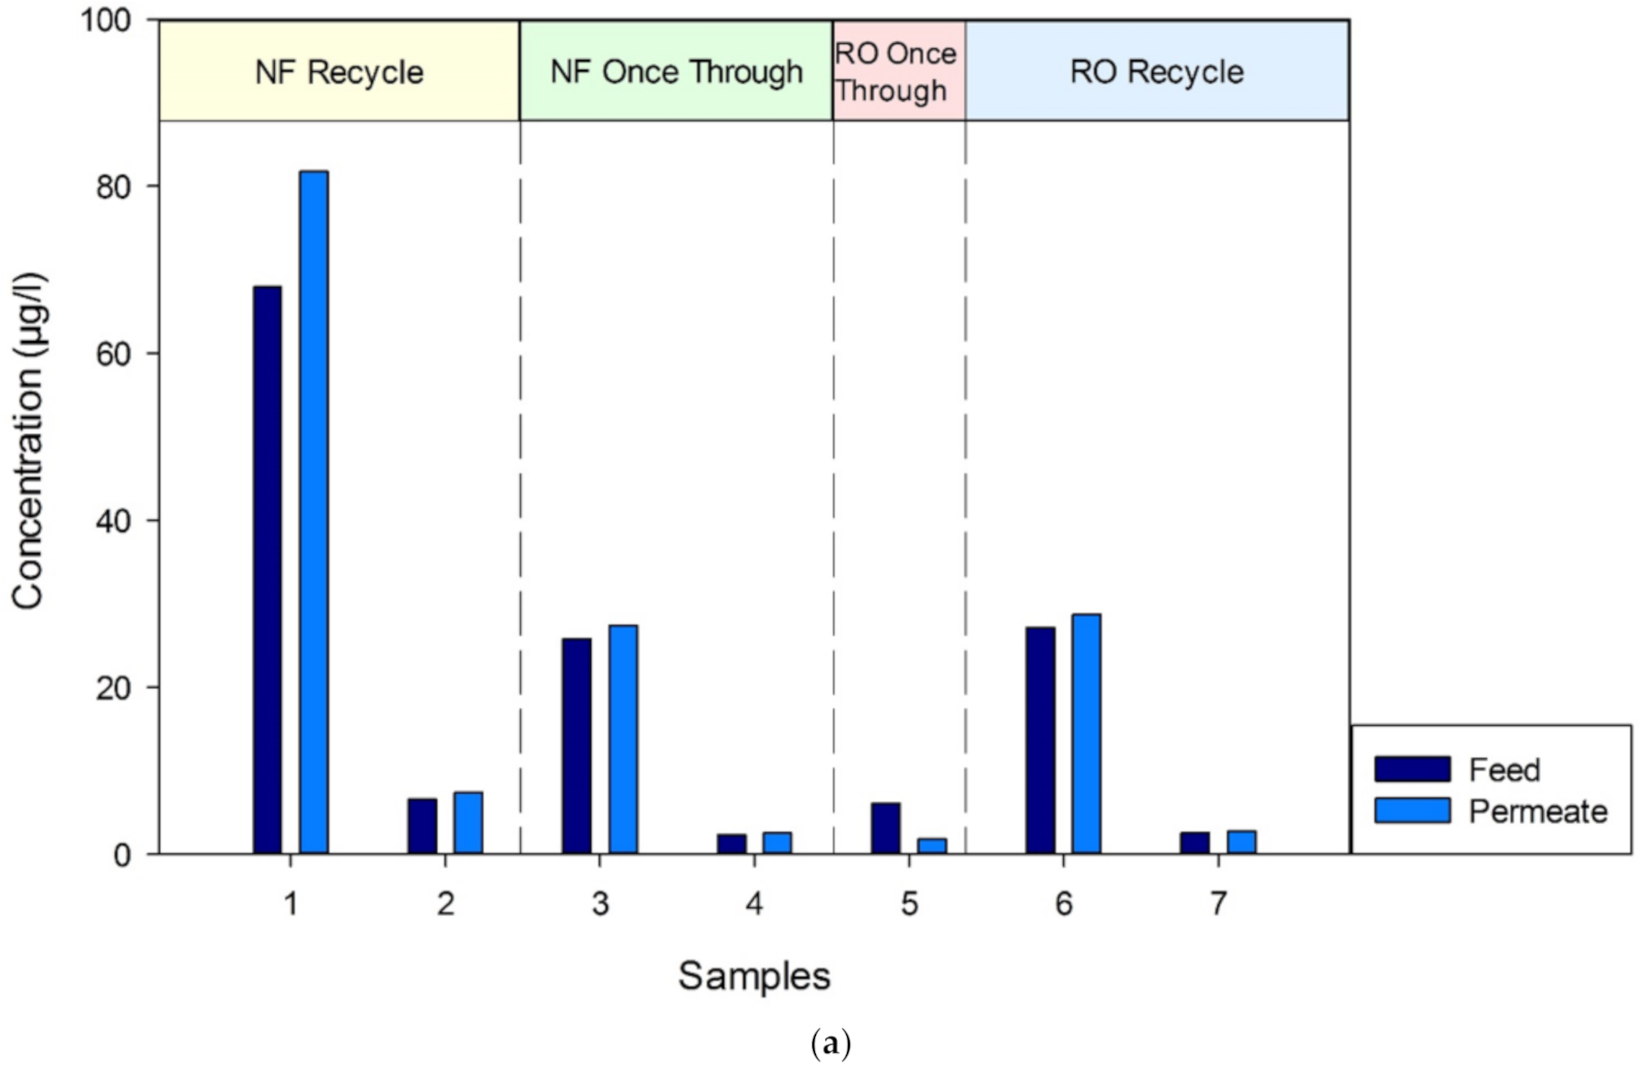
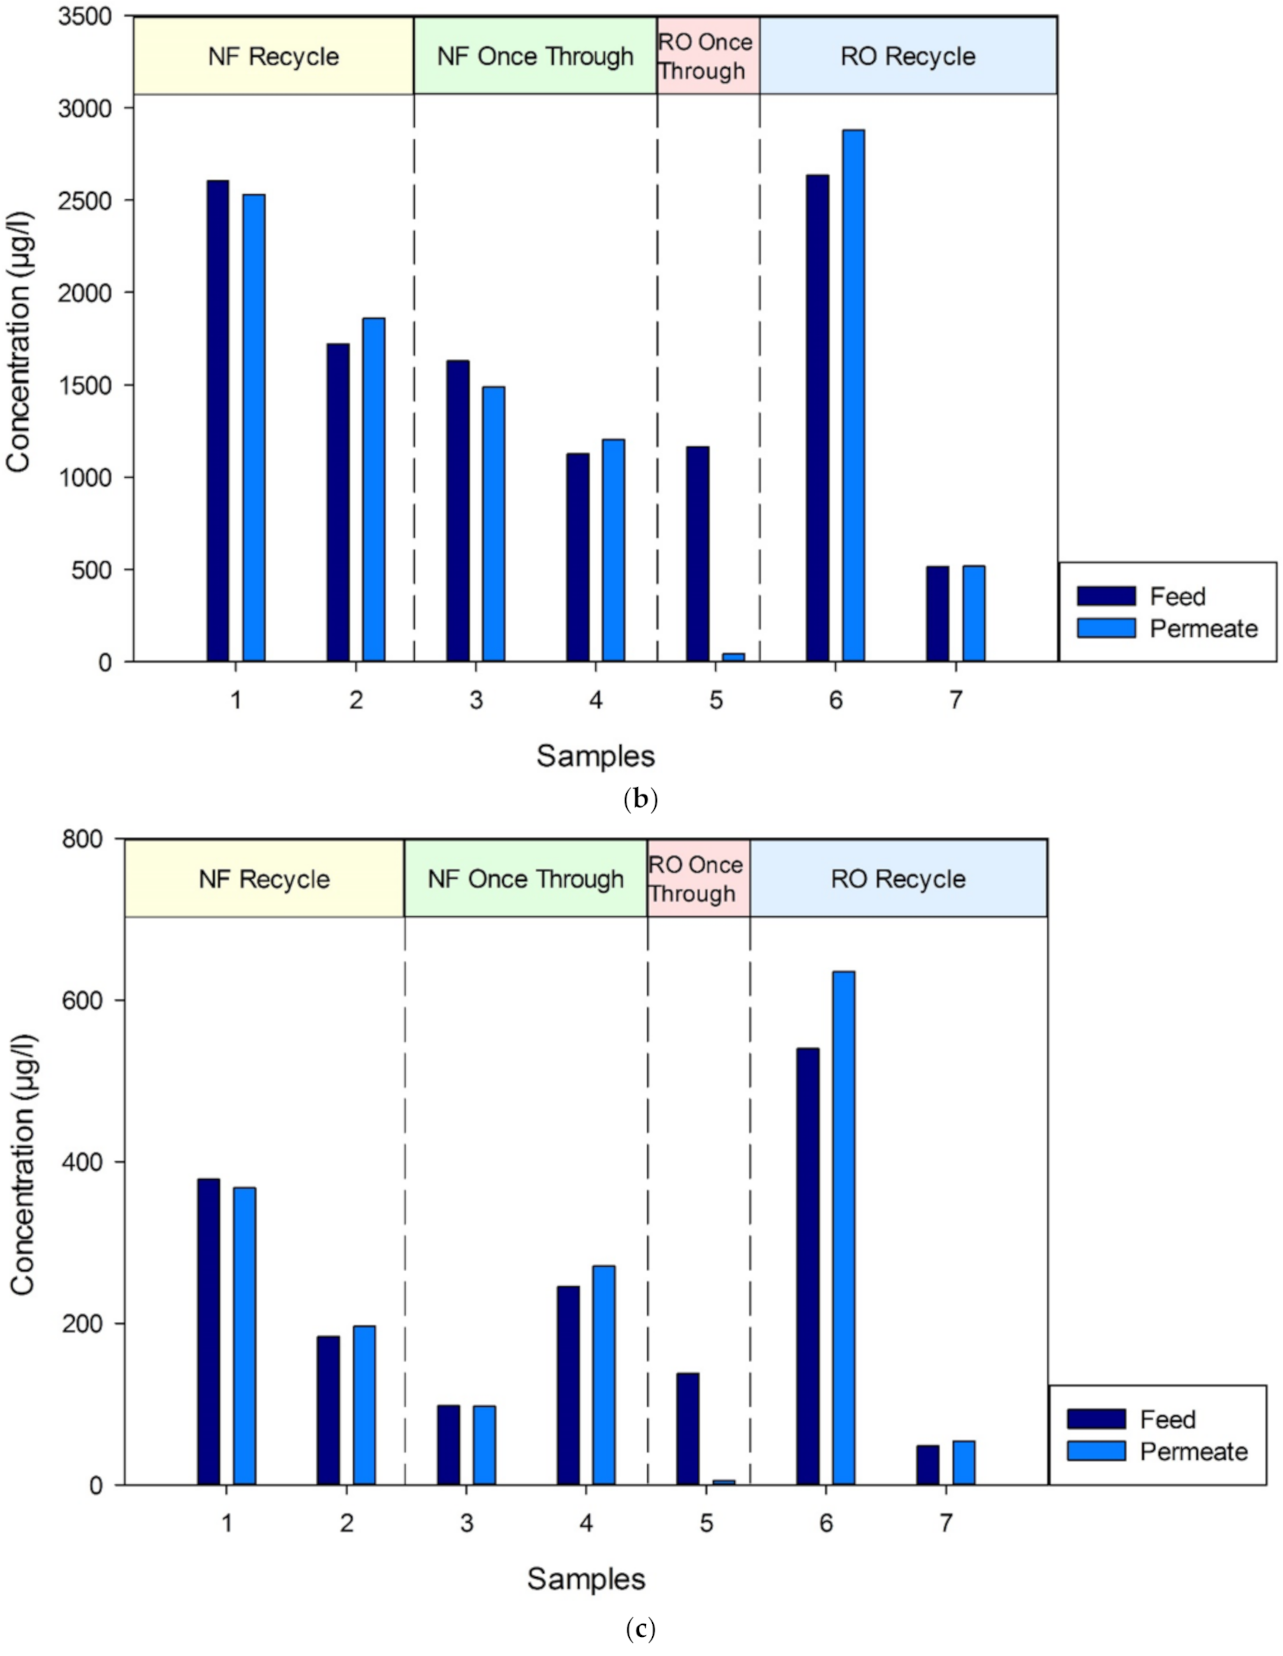
3.3.2. GC–MS Analysis

The TOC system at Swansea university was not equipped with the optional purgeable organic carbon (POC) analyzer. VOCs are easily purged from a sample via sparging, the TOC of the sample can be determined by the addition of the POC and non-purgeable organic carbon (NPOC). Despite the TOC method used not including a sparge of the sample, volatiles can be difficult to quantify through the subtraction method compared to the addition method, TOC = TC − IC and TOC = POC + NPOC, respectively. The analysis of volatile organic compounds (VOCs) in environmental water samples is usually performed by either headspace (HS) or purge and trap (P&T), with separation by gas chromatography (GC) and detection by mass spectrometry (MS). The P&T method uses a carrier gas remove volatiles from the solution and these are caught in an adsorbent trap. The trap is then heated which releases the volatiles into the GC-MS for subsequent analysis. This method provides excellent sensitivity as the total sample is extracted. However, in comparison to other methods, P&T methods are generally more complicated to operate and maintain. They can also suffer from a degree of water carry over, which may lead to a loss in sensitivity, a loss of peak shape and, in some cases, sample cross contamination. The obvious alternative is the HS method which uses a closed sample arrangement. In this case, the sample vial containing the total solution is heated (and agitated in some systems) in order to drive the volatiles out of the solution and into the headspace of the vial. When this is the case, an equilibrium forms between the volatile contained in the solution and the headspace. This equilibrium can be shifted by the addition of salt to the sample. After a specified time, a portion of the headspace is transferred onto the GC–MS via a valve with a sample loop. This technique is robust and experiences few carryover problems as less water is transferred to the GC–MS. The GC–MS HS system was installed at Swansea university after the pilot-scale trials, but during the laboratory trial. Therefore, a mixture of VOCs was produced. See Section 3.3.1. This VOC mixture underwent the same experimental pressures as the TOC analysis. The rejection results are shown in Figure 10a–i.
The membrane fluxes recorded with the VOC mixture feed show an interesting difference within the NF membranes tested and the RO membranes compared to the fluxes documented during the TCE TOC analysis tests. The GE NF90 behaved differently compared to all the other membranes—the flux on average, increased 11% when the mixture of VOC was filtered. All the other investigated NF membranes exhibited a decrease in flux—on average, 4%, 16% and 10% for NF270, DK and DL, respectively. The RO membranes suffered a far greater deterioration in flux—BW30 and BW30LE lost 31% of their permeate flux. Dow BW30XFR flux was down by 41% and 34% for the GE Osmonics AK membrane when compared to the TOC trials. The greatest drop in permeate flow rate was suffered by the AG membrane—a 74% loss. Upon examining the rejections from the GC–MS quantitation data, the GC–MS results generally agree with the TOC analysis—an increase in pressure decreases the solute retention. The reduction in rejection for the nanofiltration membranes was more severe than the equivalent TOC results for TCE—the lowest TCE rejection for TOC was between 21% and 47% for the four NF membranes. The equivalent GC–MS rejections observed were 0% for all four membranes at the highest operating pressure. This large discrepancy demonstrates the inaccuracies of using TOC as a method of substantiating the levels of VOCs in an aqueous sample. Concentration polarization is evident once again for the NF membranes. The largest difference of observed to real rejection was seen with DCP using NF270 at 30 bar, 8.8% to 97.1%, respectively—an 88.3% change. The NF membranes show good separation of TCE and PCE at 5 bar. DCE and DCP separation, however, would be considered poor across the pressure range. All the RO membranes demonstrate very good separation of PCE across the pressure range. TCE separation is good for observed rejection, and once concentration polarization is considered, the rejection increases to very good. Observed and real rejection both decrease as the pressure increases. DCE rejection remains very poor above 5 bar applied pressure for all RO membranes, particularly the low-energy BWRO Dow Filmtec BW30LE. In fact, the low-energy BW30LE performs worse compared to the standard RO membrane BW30 for all tests. Low-energy RO membranes are designed to operate at a significantly reduced operating pressure, whilst maintaining the separation capabilities and permeate flow rates of a standard RO operating at high pressure, this allows vastly reduced operating costs, making RO desalination much more appealing. This study has proven that this is not strictly true—there is a clear loss in rejection proficiency with an increase in permeate flow rate when comparing a standard RO to a low-energy RO at the same operating pressure. Previous and more recently published research [47,48] have suggested that solvent passage through an NF or RO membrane is due to the convection of the solvent to the membrane surface—adsorption of the VOCs through the membrane matrix followed by desorption from the membrane into the low concentration permeate. From the results, this study would confirm this theory. It has also been suggested that pressure has little to no effect on the rejection with this theory [47]. However, the experimental data presented in this study show this not to be the case. An increase in pressure increases the permeate flow rate, as a result the convection of solute towards the membrane surface increases, increasing concentration polarization. This increase in concentration polarization and permeate flow rate increases the rate of adsorption and desorption through the membrane matrix, respectively. Despite the continuous stirring within the cell, concentration polarization is made more likely due to the use of a frontal or dead-end filtration cell. A cross-flow filtration cell, where the feed is passed across the membrane surface rather than directly downwards onto surface, would reduce the possibility of concentration polarization occurring. The variations of adsorption kinetics have been attributed to the hydrophilicity or hydrophilicity of the membrane surface and the solvent molecule [48,49]. Solvents considered hydrophilic have a higher logarithm octanol–water partitioning coefficient, XLogP3 > 2.5, hydrophobic VOCs, XLogP3 < 2.5. The six highlighted VOCs throughout this paper are listed in Table 1, from most hydrophobic to hydrophilic. If the theory of hydrophilicity rejection is correct, then the rejection of the GC–MS results should be as follows (lowest to highest rejection) DCE < DCP < TCE < PCE. However, the rejection data from this study contradict this theory—DCP rejections are higher than TCE and PCE across the pressure range for all five RO membranes. DCP was not a VOC investigated by the previous researchers. The referenced study [48] also researched the rejection characteristics over a prolonged period of time, and it was determined that the concentration of VOCs in the permeate steadily increases until no separation occurs after 24 h. This would agree with the adsorption theory and the decrease in rejection at higher pressures observed in this study. An increase in pressure is simply speeding up the rate of adsorption and desorption that is experienced over a longer timeframe at a low pressure. All the membranes tested in this study were hydrophilic, having a contact angle <90 °C, the use of a membrane with a hydrophobic surface may present better selectivity of VOCs. Conversely, a hydrophobic membrane will experience a significant reduction in membrane flux, permeate flow rate, compared to the analogous hydrophilic membrane. Hence, a compromise between selectivity and permeate production rate must be balanced—a common situation to contemplate when selecting a suitable membrane for an application.

4. Conclusions

The results reported in this study demonstrate that an RO membrane has the potential to separate some VOCs that can be found in a contaminated groundwater source. The use of an extra fouling-resistant membrane, BWRO, from Dow Filmtec BW30XFR, produced promising results for the removal of all tested VOCs at 5 bar, with 100% observed rejection. The use of RO membranes for VOC removal is, however, an issue at high pressures and over a prolonged period of operation. Rejection proficiencies decline as the permeate flux increases, which in turn increases the convection of the VOCs to the membrane surface, causing concentration polarization at the membrane wall. An inevitable increase in concentration polarization results in a higher probability of adsorption of VOCs onto the membrane. The same principal explains the decline in VOC retention over time, due to adsorption of VOCs through the membrane matrix. The use a frontal filtration in the study compounds this problem. DCE was a compound that was inefficiently separated for all membranes tested at pressures above 5 bar. Hydrophobic VOCs generally appear to be more susceptible to adsorption than their counterparts, the hydrophilic VOCs. However, DCP would either discredit this correlation or is simply an anomaly to the rule. Further, in-depth study of VOCs is required to determine the validity of the suggested hypothesis.

Author Contributions

Conceptualization and methodology, A.R.B. and D.L.O.-R.; formal analysis, T.J.A.; investigation, T.J.A. and D.L.O.-R.; resources, A.R.B.; data curation, T.J.A. and D.L.O.-R.; writing—original draft preparation, T.J.A.; writing—review and editing, A.R.B. and D.L.O.-R.; visualization, T.J.A.; supervision, A.R.B. and D.L.O.-R.; project administration, A.R.B.; funding acquisition, A.R.B. All authors have read and agreed to the published version of the manuscript.

Funding

Financial support was provided by Lockheed Martin Corporation, the Robert A. Welch Foundation, the BioInnovation Wales projects which are part funded by the European Social Fund (ESF) and the Welsh government Sêr Cymru program.

Data Availability Statement

The data presented in this study are available in article.

Conflicts of Interest

The authors declare no conflict of interest.

References

  1. Houlihan, M.F.; Lucia, P.C. Remediation of Contaminated Groundwater. In The Handbook of Groundwater Engineering, 1st ed.; Delleur, J., Ed.; CRC Press: Boca Raton, FL, USA, 1999; pp. 29–39. [Google Scholar]
  2. Henze, M.; Harremoes, P.; la Cour Jansen, J.; Arvin, E. Wastewater Treatment: Biological and Chemical Processes, 3rd ed.; Springer: Berlin/Heidelberg, Germany, 2002. [Google Scholar]
  3. Rahman, K.S.M.; Thahira-Rahman, J.; Lakshmanaperumalsamy, P.; Banat, I.M. Towards efficient crude oil degradation by a mixed bacterial consortium. Bioresour. Technol. 2002, 85, 257–261. [Google Scholar] [CrossRef] [Green Version]
  4. Peña, A.A.; Hirasaki, A.G.J.; Miller, C.A. Chemically Induced Destabilization of Water-in-Crude Oil Emulsions. Ind. Eng. Chem. Res. 2005, 44, 1139–1149. [Google Scholar] [CrossRef]
  5. Li, X.; Zhang, L.; Yang, Z.; Wang, P.; Yan, Y.; Ran, J. Adsorption materials for volatile organic compounds (VOCs) and the key factors for VOCs adsorption process: A review. Sep. Purif. Technol. 2020, 235, 116213. [Google Scholar] [CrossRef]
  6. KP Veerapandian, S.; De Geyter, N.; Giraudon, J.M.; Lamonier, J.F.; Morent, R. The use of zeolites for VOCs abatement by combining non-thermal plasma, adsorption, and/or catalysis: A review. Catalysts 2019, 9, 98. [Google Scholar] [CrossRef] [Green Version]
  7. Fritzmann, C.; Löwenberg, J.; Wintgens, T.; Melin, T. State-of-the-art of reverse osmosis desalination. Desalination 2007, 216, 1–76. [Google Scholar] [CrossRef]
  8. Greenlee, L.F.; Lawler, D.F.; Freeman, B.D.; Marrot, B.; Moulin, P. Reverse osmosis desalination: Water sources, technology, and today’s challenges. Water Res. 2009, 43, 2317–2348. [Google Scholar] [CrossRef]
  9. Mohammad, A.W.; Teow, Y.H.; Ang, W.L.; Chung, Y.T.; Oatleyradcliffe, D.L.; Hilal, N. Nanofiltration membranes review: Recent advances and future prospects. Desalination 2015, 356, 226–254. [Google Scholar] [CrossRef]
  10. Costa, A.R.; De Pinho, M.N. Performance and cost estimation of nanofiltration for surface water treatment in drinking water production. Desalination 2006, 196, 55–65. [Google Scholar] [CrossRef]
  11. Schaep, J.; Van Der Bruggen, B.; Uytterhoeven, S.; Croux, R.; Vandecasteele, C.; Wilms, D.; Van Houtte, E.; Vanlerberghe, F. Removal of hardness from groundwater by nanofiltration. Desalination 1998, 119, 295–301. [Google Scholar] [CrossRef]
  12. Van der Bruggen, B.; Vandecasteele, C. Removal of pollutants from surface water and groundwater by nanofiltration: Overview of possible applications in the drinking water industry. Environ. Pollut. 2003, 122, 435–445. [Google Scholar] [CrossRef]
  13. Van Der Bruggen, B.; Everaert, K.; Wilms, D.; Vandecasteele, C. Application of nanofiltration for removal of pesticides, nitrate and hardness from ground water: Rejection properties and economic evaluation. J. Membr. Sci. 2001, 193, 239–248. [Google Scholar] [CrossRef]
  14. Hilal, N.; Al-Zoubi, H.; Darwish, N.A.; Mohamma, A.W.; Abu Arabi, M. A comprehensive review of nanofiltration membranes:Treatment, pretreatment, modelling, and atomic force microscopy. Desalination 2004, 170, 281–308. [Google Scholar] [CrossRef]
  15. Hong, S.; Elimelech, M. Chemical and physical aspects of natural organic matter (NOM) fouling of nanofiltration membranes. J. Membr. Sci. 1997, 132, 159–181. [Google Scholar] [CrossRef]
  16. Mondal, S.; Wickramasinghe, S.R. Produced water treatment by nanofiltration and reverse osmosis membranes. J. Membr. Sci. 2008, 322, 162–170. [Google Scholar] [CrossRef]
  17. Dias, J.M.; Alvim-Ferraz, M.C.; Almeida, M.F.; Rivera-Utrilla, J.; Sánchez-Polo, M. Waste materials for activated carbon preparation and its use in aqueous-phase treatment: A review. J. Environ. Manag. 2007, 85, 833–846. [Google Scholar] [CrossRef]
  18. Lee, L.J.-H.; Chan, C.-C.; Chung, C.-W.; Ma, Y.-C.; Wang, G.-S.; Wang, J. Health risk assessment on residents exposed to chlorinated hydrocarbons contaminated in groundwater of a hazardous waste site. J. Toxicol. Environ. Health Part A 2002, 65, 219–235. [Google Scholar] [CrossRef]
  19. Fan, C.; Wang, G.-S.; Chen, Y.-C.; Ko, C.-H. Risk assessment of exposure to volatile organic compounds in groundwater in Taiwan. Sci. Total. Environ. 2009, 407, 2165–2174. [Google Scholar] [CrossRef]
  20. Huang, B.; Lei, C.; Wei, C.; Zeng, G. Chlorinated volatile organic compounds (Cl-VOCs) in environment—Sources, potential human health impacts, and current remediation technologies. Environ. Int. 2014, 71, 118–138. [Google Scholar] [CrossRef]
  21. Cooney, D.O.; Nagerl, A.; Hines, A.L. Solvent regeneration of activated carbon. Water Res. 1983, 17, 403–410. [Google Scholar] [CrossRef]
  22. Tamon, H.; Saito, T.; Kishimura, M.; Okazaki, M.; Toei, R. Solvent regeneration of spent activated carbon in wastewater treatment. J. Chem. Eng. Jpn. 1990, 23, 426–432. [Google Scholar] [CrossRef] [Green Version]
  23. Kim, J.-H.; Ryu, Y.-K.; Haam, S.; Lee, C.-H.; Kim, W.-S. Adsorption and steam regeneration of n-hexane, mek, and toluene on activated carbon fiber. Sep. Sci. Technol. 2001, 36, 263–281. [Google Scholar] [CrossRef]
  24. San Miguel, G.; Lambert, S.D.; Graham, N. The regeneration of field-spent granular-activated carbons. Water Res. 2001, 35, 2740–2748. [Google Scholar] [CrossRef]
  25. Suzuki, M.; Misic, D.M.; Koyama, O.; Kawazoe, K. Study of thermal regeneration of spent activated carbons: Thermogravimetric measurement of various single component organics loaded on activated carbons. Chem. Eng. Sci. 1978, 33, 271–279. [Google Scholar] [CrossRef]
  26. Moreno-Castilla, C.; Rivera-Utrilla, J.; Joly, J.P.; López-Ramón, M.V.; Ferro-García, M.A.; Carrasco-Marín, F. Thermal regeneration of an activated carbon exhausted with different substituted phenols. Carbon 1995, 33, 1417–1423. [Google Scholar] [CrossRef]
  27. Sabio, E.; González, E.; González, J.F.; González-García, C.M.; Ramiro, A.; Ganan, J. Thermal regeneration of activated carbon saturated with p-nitrophenol. Carbon 2004, 42, 2285–2293. [Google Scholar] [CrossRef]
  28. United States Environmental Protection Agency (USEPA). Wastewater Technology Fact Sheet: Granular Activated Carbon Adsorption and Regeneration; EPA 832-F-00-017; UESPA: Washington, DC, USA, 2000. [Google Scholar]
  29. Álvarez, P.M.; Beltrán, F.J.; Gómez-Serrano, V.; Jaramillo, J.; Rodríguez, E.M. Comparison between thermal and ozone regenerations of spent activated carbon exhausted with phenol. Water Res. 2004, 38, 2155–2165. [Google Scholar] [CrossRef]
  30. Ledesma, B.; Román, S.; Álvarez-Murillo, A.; Sabio, E.; González, J. Cyclic adsorption/thermal regeneration of activated carbons. J. Anal. Appl. Pyrolysis 2014, 106, 112–117. [Google Scholar] [CrossRef]
  31. Maguire-Boyle, S.J.; Barron, A.R. A new functionalization strategy for oil/water separation membranes. J. Membr. Sci. 2011, 382, 107–115. [Google Scholar] [CrossRef]
  32. Maguire-Boyle, S.J.; Huszman, J.E.; Ainscough, T.J.; Oatley-Radcliffe, D.; Alabdulkarem, A.A.; Al-Mojil, S.F.; Barron, A.R. Superhydrophilic functionalization of micro-filtration ceramic membranes enables separation of hydrocarbons from frac and produced waters without fouling. Sci. Rep. 2017, 7, 12267. [Google Scholar] [CrossRef] [Green Version]
  33. Oatley, D.L.; Williams, S.R.; Barrow, M.S.; Williams, P.M. Critical appraisal of current nanofiltration modelling strategies for seawater desalination and further insights on dielectric exclusion. Desalination 2014, 343, 154–161. [Google Scholar] [CrossRef]
  34. Oatley-Radcliffe, D.L.; Williams, S.R.; Ainscough, T.J.; Lee, C.; Johnson, D.J.; Williams, P.M. Experimental determination of the hydrodynamic forces within nanofiltration membranes and evaluation of the current theoretical descriptions. Sep. Purif. Technol. 2015, 149, 339–348. [Google Scholar] [CrossRef] [Green Version]
  35. Nicolas, S.; Balannec, B.; Béline, F.; Bariou, B. Ultrafiltration and reverse osmosis of small non-charged molecules: A comparison study of rejection in a stirred and an unstirred batch cell. J. Membr. Sci. 2000, 164, 141–155. [Google Scholar] [CrossRef]
  36. Nakao, S.-I.; Kimura, S. Analysis of solutes rejection in ultrafiltration. J. Chem. Eng. Jpn. 1981, 14, 32–37. [Google Scholar] [CrossRef] [Green Version]
  37. Spiegler, K.S.; Kedem, O. Thermodynamics of hyperfiltration (reverse osmosis): Criteria for efficient membranes. Desalination 1966, 1, 311–326. [Google Scholar] [CrossRef]
  38. Verliefde, A.R.; Cornelissen, E.R.; Heijman, S.G.J.; Petrinić, I.; Luxbacher, T.; Amy, G.L.; Van Der Bruggen, B.; Van Dijk, J.C. Influence of membrane fouling by (pretreated) surface water on rejection of pharmaceutically active compounds (PhACs) by nanofiltration membranes. J. Membr. Sci. 2009, 330, 90–103. [Google Scholar] [CrossRef]
  39. Bellona, C.; Marts, M.; Drewes, J.E. The effect of organic membrane fouling on the properties and rejection characteristics of nanofiltration membranes. Sep. Purif. Technol. 2010, 74, 44–54. [Google Scholar] [CrossRef]
  40. Xu, P.; Drewes, J.E.; Kim, T.-U.; Bellona, C.; Amy, G. Effect of membrane fouling on transport of organic contaminants in NF/RO membrane applications. J. Membr. Sci. 2006, 279, 165–175. [Google Scholar] [CrossRef]
  41. Agenson, K.O.; Urase, T. Change in membrane performance due to organic fouling in nanofiltration (NF)/reverse osmosis (RO) applications. Sep. Purif. Technol. 2007, 55, 147–156. [Google Scholar] [CrossRef]
  42. Chang, E.E.; Chang, Y.C.; Liang, C.H.; Huang, C.P.; Chiang, P.C. Identifying the rejection mechanism for nanofiltration membranes fouled by humic acid and calcium ions exemplified by acetaminophen, sulfamethoxazole, and triclosan. J. Hazard. Mater. 2012, 221, 19–27. [Google Scholar] [CrossRef]
  43. Hilal, N.; Al-Zoubi, H.; Mohammad, A.W.; Darwish, N.A. Nanofiltration of highly concentrated salt solutions up to seawater salinity. Desalination 2005, 184, 315–326. [Google Scholar] [CrossRef]
  44. Bowen, W.R.; Mohammad, A.W.; Hilal, N. Characterisation of nanofiltration membranes for predictive purposes—Use of salts, uncharged solutes and atomic force microscopy. J. Membr. Sci. 1997, 126, 91–105. [Google Scholar] [CrossRef]
  45. Oatley, D.L.; Llenas, L.; Pérez, R.; Williams, P.M.; Martínez-Lladó, X.; Rovira, M. Review of the dielectric properties of nanofiltration membranes and verification of the single oriented layer approximation. Adv. Colloid Interface Sci. 2012, 173, 1–11. [Google Scholar] [CrossRef] [PubMed]
  46. Oatley, D.L.; Llenas, L.; Aljohani, N.H.; Williams, P.M.; Martínez-Lladó, X.; Rovira, M.; De Pablo, J. Investigation of the dielectric properties of nanofiltration membranes. Desalination 2013, 315, 100–106. [Google Scholar] [CrossRef]
  47. Ducom, G.; Cabassud, C. Interests and limitations of nanofiltration for the removal of volatile organic compounds in drinking water production. Desalination 1999, 124, 115–123. [Google Scholar] [CrossRef]
  48. Altalyan, H.N.; Jones, B.; Bradd, J.; Nghiem, L.D.; Alyazichi, Y.M. Removal of volatile organic compounds (VOCs) from groundwater by reverse osmosis and nanofiltration. J. Water Process. Eng. 2016, 9, 9–21. [Google Scholar] [CrossRef] [Green Version]
  49. Kiso, Y.; Nishimura, Y.; Kitao, T.; Nishimura, K. Rejection properties of non-phenylic pesticides with nanofiltration membranes. J. Membr. Sci. 2000, 171, 229–237. [Google Scholar] [CrossRef]
Figure 1. Swansea University ceramic pilot microfiltration membrane rig.
Membranes 11 00061 g001
Figure 2. Frontal filtration experimental setup (1—nitrogen gas bottle, 2—pressure regulator, 3—pressure indicator, 4—Membranology HP350 stirred cell, 5—magnetic stirrer plate, 6—weight balance, 7—computer data logger).
Membranes 11 00061 g002
Figure 3. A schematic drawing of the pilot membrane rig used for the Bedfordshire site trials.
Membranes 11 00061 g003
Figure 4. Pilot membrane rig used for the Bedfordshire site trials. Left: front view of the pilot. Right: connection to the existing Bedfordshire OWS unit.
Membranes 11 00061 g004
Figure 5. An example of a virgin prefilter (left) and a fouled prefilter (right).
Membranes 11 00061 g005
Figure 6. (a) Graphical representation of GC–MS data for vinyl chloride throughout the pilot trial. (b) Graphical representation of GC–MS data for cis-1,2-dichlorothylene throughout the pilot trial. (c) Graphical representation of GC–MS data for 2,2-dichloropropane throughout the pilot trial. (d) Graphical representation of GC–MS data for trichloroethylene throughout the pilot trial. (e) Graphical representation of GC–MS data for tetrachloroethylene throughout the pilot trial.
Membranes 11 00061 g006aMembranes 11 00061 g006bMembranes 11 00061 g006c
Figure 7. New DK membrane (left) vs. post trial DK membrane (right).
Membranes 11 00061 g007
Figure 8. Illustration of the fouling that occurred for the RO membrane. (a) Fouled backing layer; (b) virgin membrane surface [left] vs. post trial membrane surface [right].
Membranes 11 00061 g008
Figure 9. Swansea feed tank corrosion. Top left, rusting around the tri-clamp connection. Top right and bottom, pitting on the vessel surface.
Membranes 11 00061 g009
Figure 10. (a) Dow NF90 membrane flux (LMH) and observed and real rejection data for VOC solution using GC–MS HS analysis. (b) Dow N270 membrane flux (LMH) and observed and real rejection data for VOC solution using GC–MS HS analysis. (c) GE DK membrane flux (LMH) and observed and real rejection data for VOC solution using GC–MS HS analysis. (d) GE DL membrane flux (LMH) and observed and real rejection data for VOC solution using GC–MS HS analysis. (e) GE AK membrane flux (LMH) and observed and real rejection data for VOC solution using GC–MS HS analysis. (f) GE AG membrane flux (LMH) and observed and real rejection data for VOC solution using GC–MS HS analysis. (g) Dow BW30 membrane flux (LMH) and observed and real rejection data for VOC solution using GC–MS HS analysis. (h) Dow BW30LE membrane flux (LMH) and observed and real rejection data for VOC solution using GC–MS HS analysis. (i) Dow BW30XFR membrane flux (LMH) and observed and real rejection data for VOC solution using GC–MS HS analysis.
Membranes 11 00061 g010aMembranes 11 00061 g010bMembranes 11 00061 g010cMembranes 11 00061 g010dMembranes 11 00061 g010e
Table 1. Summary of physio-chemical properties of selected VOCs.
CompoundCAS #FormulaMW (g/mol)XLogP3
Vinyl Chloride75-01-4C2H3Cl62.501.5
Cis-1,2-Dichloroethylene156-59-2C2H2CL296.941.9
2,2-Dichloropropane594-20-7C3H6Cl2112.9812.1
Trichloroethylene79-01-6C2HCl3131.392.6
Toluene108-88-3C7H892.1412.7
Tetrachloroethylene127-18-4C2Cl4165.833.4
Table 2. GC–MS HS method settings.
Headspace ParametersAgilent 7697A HS—12 vial
Temperature settings
Oven temperature70 °C
Loop temperature85 °C
Transfer line temperature120 °C
Timing settings
Vial equilibration10 min
Injection duration0.3 min
GC cycle time22 min
Vial settings
Vial size20 mL
Vial pressurization15 psi
Loop size1.0 mL
Extraction time0.3 min
ModeSingle extraction
Transfer line flow20 mL/min
Transfer lineAgilent p/n 160-2535-5
Line typeFused silica, deactivated
Line diameter0.53 mm
Vial and cap20 mL, PTFE/silicone septa
GC ParametersAgilent 6850 series II GC
Inlet settings
HeaterOn—150 °C
PressureOn—6.4 psi
Total flowOn—42.6 mL/min
Run time6.8 min
Gas saverOff
Split ratio40:1
Split flow40 mL/min
Oven settings
Oven ramp°C/minNext °CHold
Initial 300.3 min
Ramp 15550 min
Ramp 210700 min
Total run time15.8 min
Equilibration time0.5 min
Oven Max temperature260 °C
ColumnAgilent J & W HP-5
Length30 m
Diameter0.25 mm
Film thickness0.25 μm
ModeConstant flow
Pressure6.4 psi
Nominal initial flow1 mL/min
InletFront
OutletMSD
Outlet pressureVacuum
MSD ParametersAgilent 5977A MSD
MSD settings
Solvent delay0.0 min
Sim ions4
Quantitation ions61, 77, 130, 166 M/Z
Sim dwell50 msec/ion
Quad temperature150
Source temperature230
Transfer line temperature250
Gain factor5
Table 3. Characteristics and supporting information for the membranes used in this study.
a. Properties of NF membranes used in this study.
MembraneDKDLNF90NF270
Manufacturer GE OsmonicsGE OsmonicsDow FilmtecDow Filmtec
Support material PolysulfonePolysulfonePolysulfonePolysulfone
Surface material TFC PATFC PAPAPA
Maximum operating temperature 50 °C50 °C45 °C45 °C
Maximum operating pressure 41 bar41 bar41 bar41 bar
pH range 3–93–92–112–11
Flux (GFD)/psi 22/10028/22046–60/13072–98/130
MWCO ~150–300~150–300~200–400~200–400
Contact angle 26.36 ± 0.48°27.60 ± 0.38°27.40 ± 0.89°21.22 ± 0.88°
b. Properties of RO membranes used in this study.
MembraneAKAGBW30BW30LEBW30XFR
ManufacturerGE OsmonicsGE OsmonicsDow FilmtecDow FilmtecDow Filmtec
Support materialPolysulfonePolysulfonePolysulfonePolysulfonePolysulfone
Surface materialTFC PATFC PAPAPAPA
Maximum operatingtemperature50 °C50 °C45 °C45 °C45 °C
Maximum operatingpressure27 bar41 bar41 bar41 bar41 bar
pH range4–114–112–112–112–11
Flux (GFD)/psi26/11526/22526/22537–46/22528–33/225
MWCO~0~0~100~100~100
Contact angle70.21 ± 1.09°72.21 ± 2.52°55.86 ± 0.67°67.58 ± 0.30°56.61 ± 0.66°
Table 4. TOC data for dead-end filtration of the Bedfordshire site water.
1 g/L Toluene–Water Dead-End Filtration
Sample NameTOC (mg/L)Rejection
Desal DK feed508.6
Desal DK 2.5 bar permeate34.1593.29%
Desal DK 5 bar permeate108.578.67%
Desal DK 10 bar permeate127.175.01%
Desal DK 20 bar permeate154.269.68%
Table 5. TOC data for dead-end filtration of the Bedfordshire site water.
Company a Water Dead-End Filtration
Sample NameTOC (µg/L)Rejection
Desal DK feed3913
Desal DK 2.5 bar permeate316.491.91%
Desal DK 5 bar permeate37.599.04%
Desal DK 10 bar permeate0100.00%
Desal DK 20 bar permeate0.11~100.00%
Table 6. GC–MS data of five main components detected for the 27th May samples.
CompoundFeed 1 (µg/L)Feed 2 (µg/L)Permeate 1 (µg/L)Permeate 2 (µg/L)
Total5476568456625639
VC6.66.57.57.3
DCE1687175819741749
DCP177.4188.6212180.1
TCE3594372034573691
PCE7.97.68.17.7
Table 7. Swansea University TOC data for NF trial.
DateSampleTotal Carbon (µg/L)Inorganic Carbon
(µg/L)
Total Organic Carbon (µg/L)Average (µg/L)Rejection
13/05/2015Feed89,79682,6357161759857.19%
Feed90,38882,3538035
Permeate64,20860,93432743253
Permeate63,75960,5273232
27/05/2015Feed84,05976,9477112731470.30%
Feed83,06975,5537516
Permeate65,73163,56621652172
Permeate65,71463,5352179
09/06/2015Feed80,89474,5346360636078.30%
Permeate62,65961,27913801380
Feed79,40573,2656140614079.10%
Permeate59,33458,05112831283
23/06/2015Feed75,76270,4455317531771.96%
Permeate60,34158,85014911491
Table 8. Nanofiltration membrane performance data.
DateInlet (bar)Outlet (bar)TMP (bar)Recycle (l/s)Permeate Flow (usgph)Permeate Flow
(l/h)
Flux (LMH)Specific Flux (LMH/bar)
13th May2.851.652.251.044.5017.0310.654.73
19th May2.601.402.001.053.4012.878.045.75
19th May3.001.802.401.054.2015.909.945.52
27th May2.601.402.001.043.2012.117.575.41
27th May3.001.802.401.054.6017.4110.886.05
1st June2.952.402.681.044.0015.149.463.94
9th June2.801.602.201.024.0015.149.465.91
9th June3.001.802.401.034.2015.909.945.52
23rd June2.501.301.901.023.0011.367.105.46
23rd June3.001.802.401.034.4016.6610.415.78
8th July2.000.801.401.032.007.574.735.91
Table 9. GC–MS data of five main components detected for the 8th July samples.
CompoundFeed (µg/L)Permeate (µg/L)Rejection (%)
Total3670.0264.092.8
VC6.11.870.3
DCE1165.043.596.3
DCP137.25.196.3
TCE2351.7175.892.5
PCE7.10.691.7
Table 10. GC–MS data for five main components detected on 21th July.
CompoundFeed (µg/L)Permeate (µg/L)
Total65526613
VC27.128.7
DCE2636.92881.8
DCP539.8635.2
TCE3340.83058.7
PCE5.75.1
Table 11. RO membrane pilot-scale performance data.
TimeInlet (bar)Outlet (bar)TMP (bar)Recycle Flow (L/s)Permeate Flow (L/h)Flux (LMH)Specific Flux (LMH/bar)
8th July2.001.401.700.6723982.121.51
21st July3.001.602.301.0337082.421.51
04th Aug3.001.402.200.6824411.971.41
18th Aug3.001.402.20**1.511.08
1st Sept2.600.701.65**0.300.43
1st Sept3.001.502.25**1.671.11
* Unable to read totalizer.
Table 12. Laboratory separation assessment trials using nanofiltration and reverse osmosis membranes.
a. Dow NF90 membrane flux (LMH) and observed and real rejection data for NaCl, toluene and trichloroethylene from conductivity and TOC measurements.
NaClTolueneTCE
MembraneFluxObsdRealFluxObsdRealFluxObsdReal
NF90 5 bar35.550.5%69.2%40.290.4%95.8%45.972.7%88.1%
NF90 10 bar80.458.6%89.4%85.870.5%94.1%86.142.6%83.4%
NF90 15 bar12360.6%95.9%131.158.6%96.3%126.332.3%88.7%
NF90 20 bar172.252.4%98.1%179.549.7%98.1%163.932.6%94.8%
NF90 25 bar213.154.8%99.3%225.649.5%99.3%203.839.3%98.4%
NF90 30 bar236.532.1%98.9%275.651.7%99.8%241.132.7%99.0%
b. Dow NF270 membrane flux (LMH) and observed and real rejection data for NaCl, toluene and trichloroethylene from conductivity and TOC measurements.
NaClTolueneTCE
MembraneFluxObsdRealFluxObsdRealFluxObsdReal
NF270 5 bar45.948.6%72.3%54.583.5%94.4%47.853.9%77.2%
NF270 10 bar94.749.2%88.8%108.457.1%93.6%98.836.4%83.7%
NF270 15 bar137.850.4%95.6%157.745.6%96.5%15529.2%92.8%
NF270 20 bar18648.4%98.3%215.336.4%98.6%199.323.2%96.2%
NF270 25 bar230.438.1%99.0%259.436.0%99.4%258.421.5%98.8%
NF270 30 bar282.941.8%99.7%303.239.9%99.8%296.328.5%99.7%
c. GE DK membrane flux (LMH) and observed and real rejection data for NaCl, toluene and trichloroethylene from conductivity and TOC measurements.
NaClTolueneTCE
MembraneFluxObsdRealFluxObsdRealFluxObsdReal
DK 5 bar27.838.3%53.5%28.587.8%93.1%26.672.8%82.9%
DK 10 bar49.842.0%68.6%55.266.5%87.1%49.758.8%81.2%
DK 15 bar72.648.2%82.4%80.459.0%89.6%75.747.7%83.1%
DK 20 bar103.350.4%91.0%109.653.3%92.8%96.247.4%88.4%
DK 25 bar120.650.8%93.8%129.253.0%95.2%115.652.2%93.4%
DK 30 bar146.451.4%96.5%15551.8%97.1%137.848.2%95.2%
d. GE DL membrane flux (LMH) and observed and real rejection data for NaCl, toluene and trichloroethylene from conductivity and TOC measurements.
NaClTolueneTCE
MembraneFluxObsdRealFluxObsdRealFluxObsdReal
DL 5 bar31.633.7%50.6%32.777.5%87.7%29.477.8%87.0%
DL 10 bar64.634.7%69.0%60.858.4%84.4%59.250.9%79.4%
DL 15 bar91.739.1%83.1%9047.7%87.0%84.938.9%80.7%
DL 20 bar117.640.7%90.3%114.450.2%92.7%111.635.5%86.7%
DL 25 bar140.341.2%94.0%136.450.5%95.5%137.835.6%92.2%
DL 30 bar174.540.9%97.1%160.753.1%97.6%15534.5%94.3%
e. GE AK membrane flux (LMH) and observed and real rejection data for NaCl, toluene and trichloroethylene from conductivity and TOC measurements.
NaClTolueneTCE
MembraneFluxObsdRealFluxObsdRealFluxObsdReal
AK 5 bar6.993.2%94.1%9.298.3%98.6%8.579.1%82.1%
AK 10 bar15.395.3%96.6%16.794.9%96.4%17.273.4%80.2%
AK 15 bar21.895.8%97.3%24.196.5%97.9%26.370.4%81.0%
AK 20 bar30.796.6%98.3%32.195.4%97.7%34.473.1%85.4%
AK 25 bar38.297.0%98.7%40.694.0%97.5%41.272.2%86.6%
AK 30 bar47.197.0%98.9%48.193.8%97.8%51.769.7%87.9%
f. GE AG membrane flux (LMH) and observed and real rejection data for NaCl, toluene and trichloroethylene from conductivity and TOC measurements.
NaClTolueneTCE
MembraneFluxObsdRealFluxObsdRealFluxObsdReal
AG 5 bar10.996.8%97.5%15.498.9%99.3%14.478.2%83.2%
AG 10 bar27.898.9%99.4%28.895.0%97.3%28.563.1%76.3%
AG 15 bar46.599.2%99.7%41.795.9%98.3%42.368.9%85.0%
AG 20 bar60.399.3%99.8%56.594.1%98.2%57.469.9%89.3%
AG 25 bar76.899.4%99.9%70.292.9%98.4%70.169.8%91.6%
AG 30 bar95.599.3%99.9%85.192.3%98.8%8468.0%93.2%
g. Dow BW30 membrane flux (LMH) and observed and real rejection data for NaCl, toluene and trichloroethylene from conductivity and TOC measurements.
NaClTolueneTCE
MembraneFluxObsdRealFluxObsdRealFluxObsdReal
BW30 5 bar11.193.4%94.7%1495.4%96.6%14.684.2%88.1%
BW30 10 bar24.494.9%96.9%27.796.7%98.2%27.379.0%87.3%
BW30 15 bar37.396.1%98.2%40.293.0%97.0%40.363.6%81.1%
BW30 20 bar52.696.6%98.9%53.592.0%97.4%54.552.2%78.6%
BW30 25 bar64.996.7%99.2%6691.3%97.9%6666.7%89.7%
BW30 30 bar77.596.9%99.4%78.990.7%98.2%79.665.1%91.6%
h. Dow BW30LE membrane flux (LMH) and observed and real rejection data for NaCl, toluene and trichloroethylene from conductivity and TOC measurements.
NaClTolueneTCE
MembraneFluxObsdRealFluxObsdRealFluxObsdReal
BW30LE 5 bar15.291.5%93.8%20.796.0%97.5%22.664.9%75.3%
BW30LE 10 bar35.994.3%97.4%41.191.2%96.3%43.247.6%70.3%
BW30LE 15 bar53.996.1%98.8%60.584.3%95.4%63.248.8%79.5%
BW30LE 20 bar77.596.1%99.3%79.883.1%96.7%87.248.5%86.7%
BW30LE 25 bar94.796.4%99.5%103.382.0%97.8%105.349.3%91.0%
BW30LE 30 bar11296.6%99.7%11277.0%97.6%127.465.2%96.9%
i. Dow BW30XFR membrane flux (LMH) and observed and real rejection data for NaCl, toluene and trichloroethylene from conductivity and TOC measurements.
NaClTolueneTCE
MembraneFluxObsdRealFluxObsdRealFluxObsdReal
BW30XFR 5 bar1094.8%95.8%13.695.4%96.5%1368.9%74.7%
BW30XFR 10 bar2396.0%97.6%26.998.1%98.9%26.683.6%90.2%
BW30XFR 15 bar35.796.8%98.5%40.597.0%98.8%40.276.0%88.5%
BW30XFR 20 bar48.496.9%98.9%53.995.7%98.7%51.774.3%90.1%
BW30XFR 25 bar60.397.0%99.2%6695.0%98.8%63.276.5%93.0%
BW30XFR 30 bar68.997.1%99.4%80.494.7%99.1%75.276.8%94.6%
Publisher’s Note: MDPI stays neutral with regard to jurisdictional claims in published maps and institutional affiliations.

