1. Introduction
The development of new technologies over the past decade has been associated with a sharp increase in lithium consumption, which is evident by a tenfold increase in lithium production from 1995 to 2019, reaching about 80,000 tons per year [
1]. This is mainly due to the growing demand for lithium-ion batteries (about 65% of all lithium mined in 2019) for electric vehicles, energy accumulation, and electronic equipment [
2]. The electrochemical potential (3.045 V) and density (534 kg/m
3) of lithium [
2,
3] give the batteries the highest specific and volumetric energy density (more than 160 W∙h/kg), which is more than twice the nickel-cadmium (~50W∙h/kg) and nickel-metal hydride (~70 W∙h/kg) batteries [
4]. In addition to batteries, lithium is widely used in the ceramics and glass industries (~18%), the production of lubricants (~5%), polymer and chemical technologies, metallurgy, air purification, and other areas such as medicine, hydrogen, and nuclear energy [
1,
5,
6,
7,
8,
9].
Due to its chemical activity, lithium can be found in nature only in the form of salts presented in more than 150 different minerals, solid ores (spodumene, petalite, and lepidolite), and salt brines (salt lakes and geothermal brines) [
10]. Today, the total lithium reserves worldwide are estimated as 80 million tons [
1], and more than 60% of lithium is presented in the brines [
1,
11,
12,
13]. Despite the fact that about 83% of lithium is produced today from the brines due to its lower production cost [
5], the ores remain the main sources of lithium in some countries like Australia [
1]. The recovery of lithium from a different kind of natural brines such as geothermal brine is complicated by high water salinity 200–500 g/L and the presence of hardness ions, especially magnesium ions [
13,
14]. Li
+ and Mg
2+ ions have very similar size of 0.076 and 0.075 nm, respectively, which requires additional efforts and processing steps in the case of a high Mg
2+/Li
+ ratio [
15,
16]. Among different methods of lithium recovery (e.g., extraction, crystallization, precipitation, ion-exchange adsorption, electrodialysis), extraction and ionic adsorption are most widely used due to their high selectivity [
10,
17,
18,
19,
20,
21,
22,
23,
24]. The membrane-based extraction (ME) can be considered a novel and promising method due to its modularity and the absence of direct contact of aqueous and organic phases that prevents the extractant loss and negative impact on the environment [
22,
23,
24]. High separation characteristics (productivity and selectivity) were demonstrated with ethylene–vinyl alcohol (EVAL) membranes in the membrane extraction [
23]. The membrane prepared from 30% EVAL showed a Li
+ flux of 6.8 g/m
2∙h at a Li
+ feed concentration of 0.7 g/L. However, these membranes possess limited stability under operation conditions (extractant regeneration by strong hydrochloric acid). To overcome this problem, it was recently proposed to use acid-resistance membranes based on poly(ether-ether-ketone) (PEEK) for solvent regeneration; PEEK membranes demonstrated stable performance during the long-term operation of 500 h [
24]. It should be noted that the membrane contactor demonstrates effective operation with a high mass transfer rate when lithium concentration in the feed solution is at the preferable level (2 g/L or higher). As can be seen from
Table 1, lithium concentration in the prospective geothermal brines in Russian Federation varies from 0.01 up to 0.5 g/L [
25,
26], which requires the prior concentration of the initial geothermal brine by a factor of 4–200 in order to achieve the required lithium content. However, such treatment is associated with scaling and salt deposition due to high initial salinity and the pronounced presence of calcium and magnesium in some cases, which would result in the drop of membrane productivity, deterioration of heat and mass transfer, and the increasing of hydraulic resistance [
27].
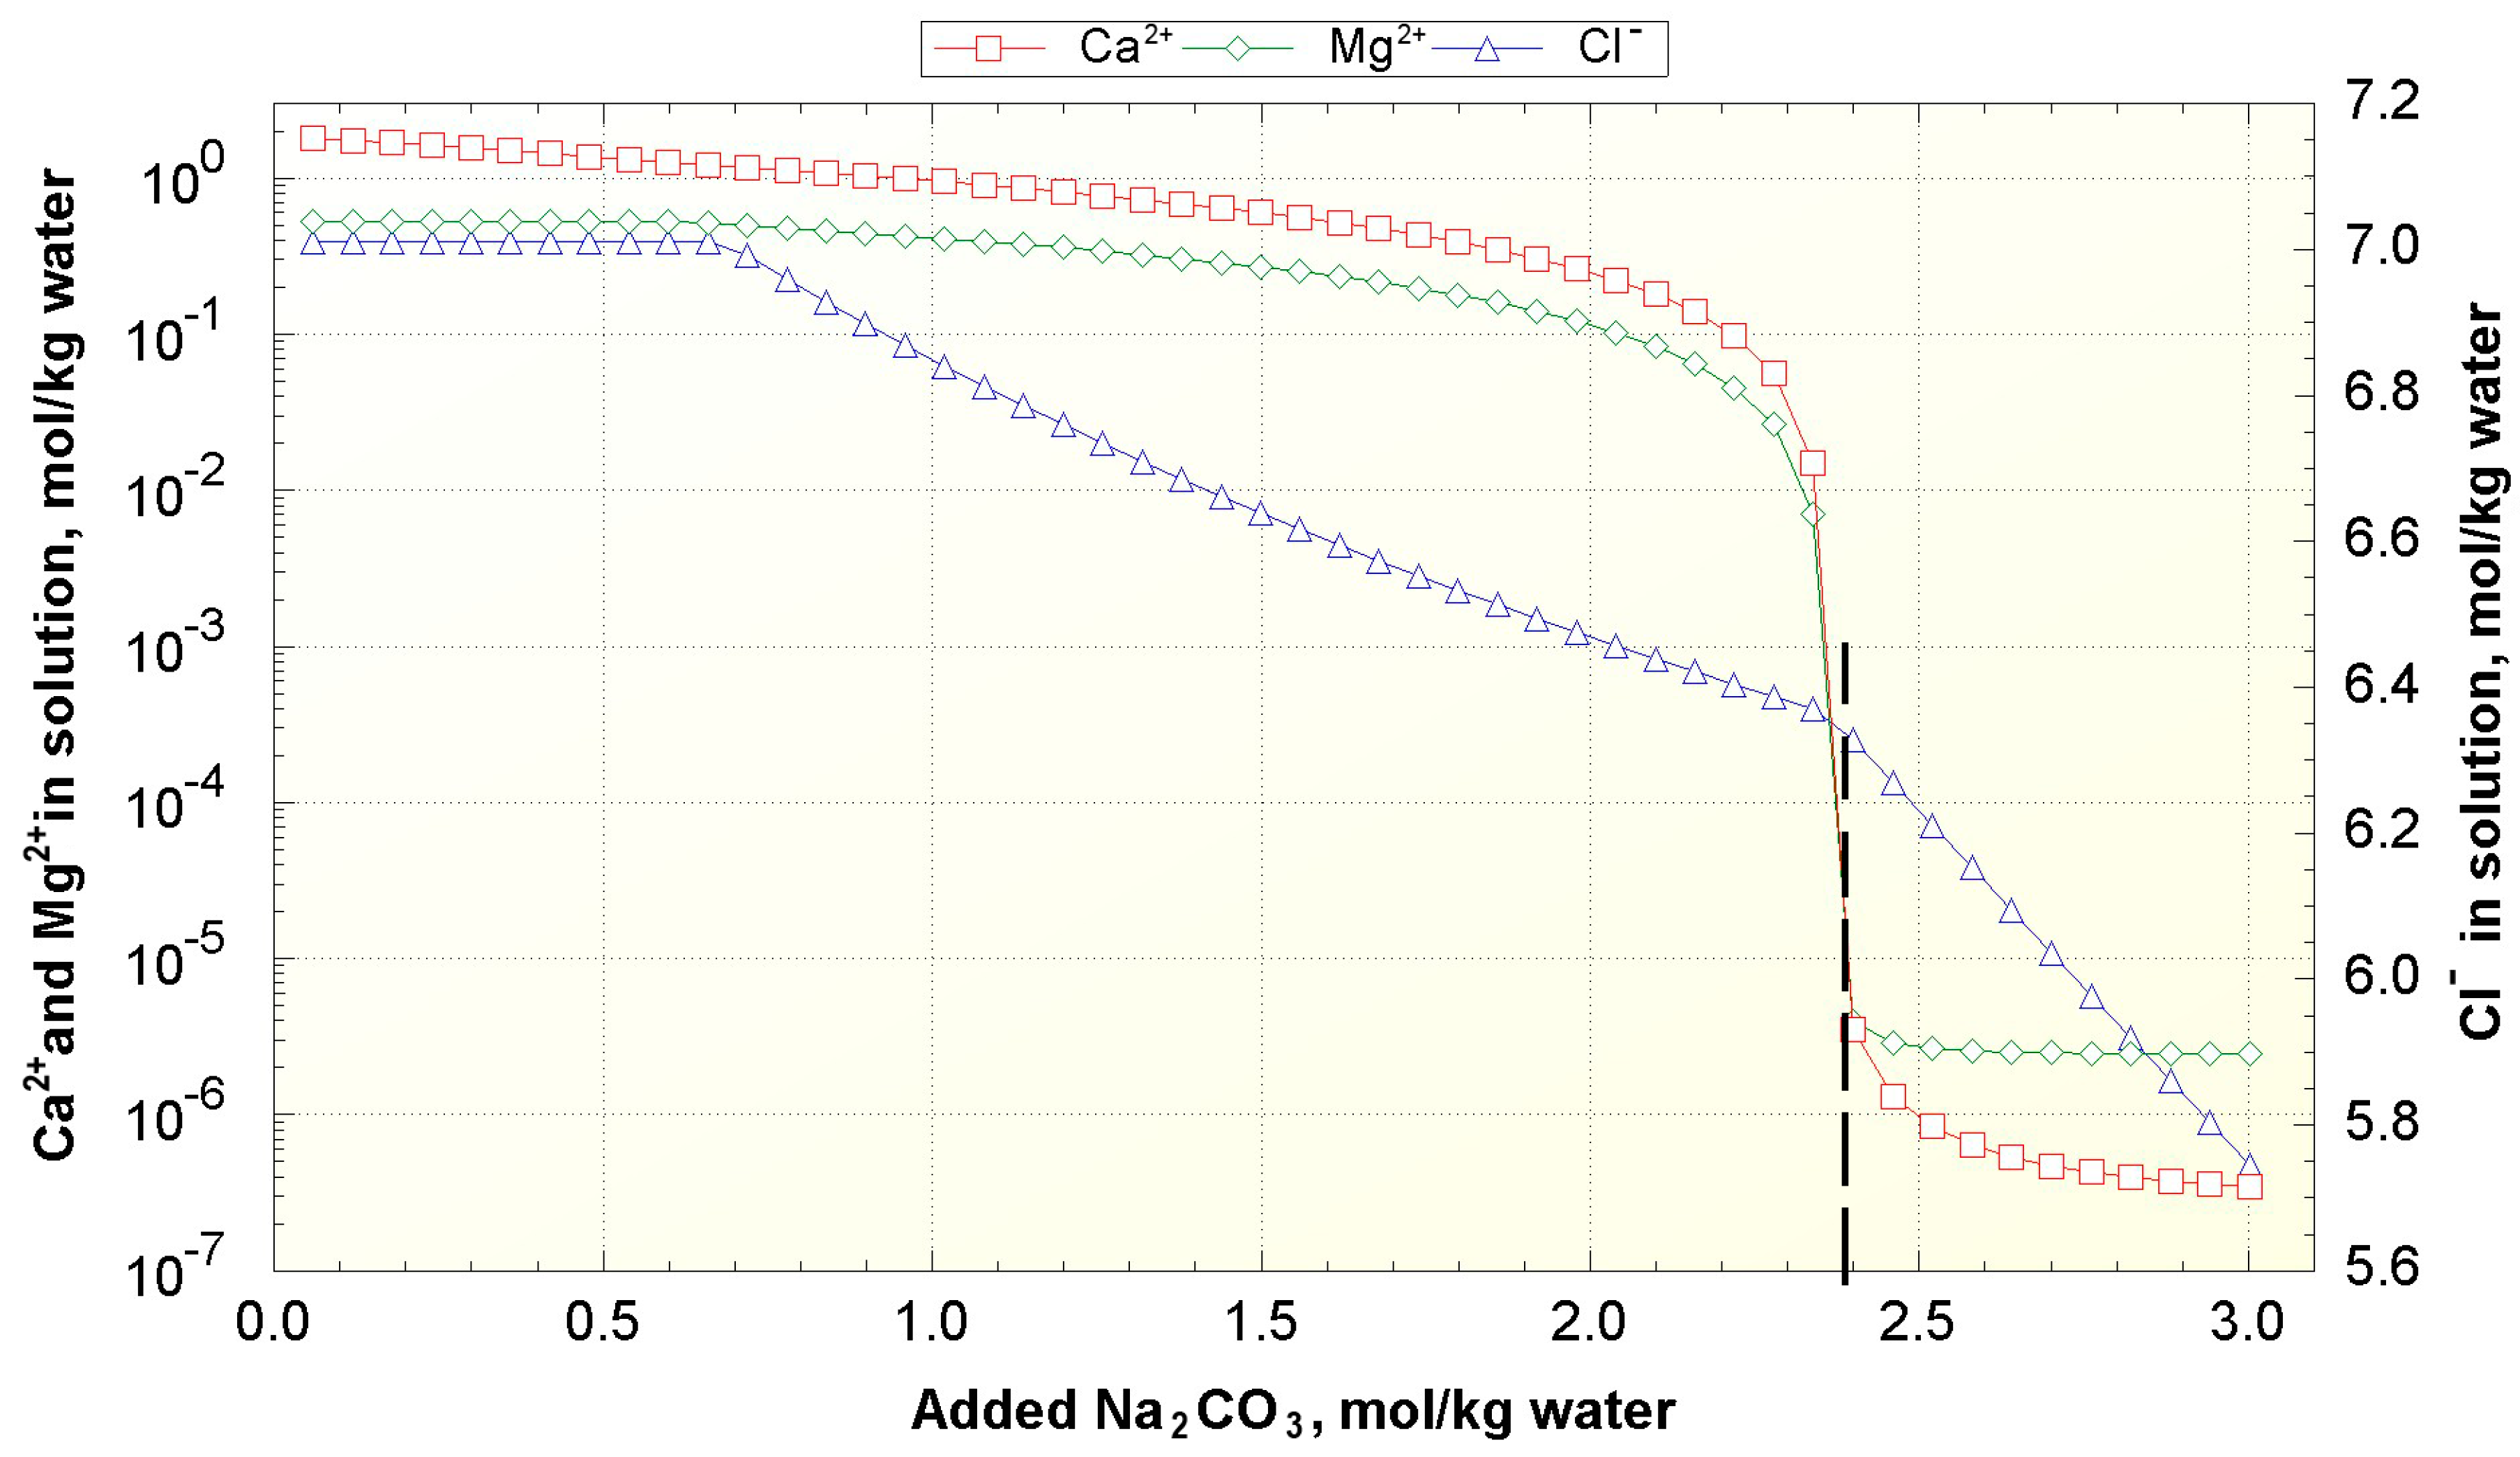
The scaling phenomena can be mitigated by the addition of special reagents like slaked lime (Ca(OH)
2) or soda (Na
2CO
3), resulting in the precipitation of hardness ions in the form of insoluble carbonate compounds (CaCO
3, MgCO
3, CaMg(CO
3)
2) [
28,
29]. Lime removes carbonate salts, while soda removes non-carbonate salts [
30]. However, this method requires a high amount of reagents, which is associated with the introduction of additional ions to the brine solution [
31].
In the 2010s, a new method called membrane-assisted crystallization was proposed for simultaneous water production using membrane technology and recovery of dissolved compounds in the solid form by its crystallization from saturated solutions [
32]. This approach is compelling because of its compactness, lesser metal consumption, and greater flexibility in the process operation, and it was already utilized for crystallization of inorganic salts [
33,
34] and organic compounds [
35] using pressure-driven processes of solution concentration (reverse osmosis, nanofiltration) as well as evaporation processes (pervaporation, membrane distillation). The membrane distillation (MD) can be considered one of the effective approaches for the concentration of different kinds of brines with moderate or high salinity [
36]. In this thermally-driven process, the membrane acts as a non-selective barrier that provides high fluxes of water vapors through the pores of the membrane and high selectivity since the saline water as the non-wetting liquid for hydrophobic membrane remains in the feed compartment [
37,
38]. In contrast to pervaporation, reverse osmosis or distillation processes, the membrane distillation can be effectively operated at the atmospheric pressure by utilizing low-grade heat sources [
38,
39,
40,
41,
42,
43,
44,
45]. A variety of MD processes can provide different configurations of hot (feed) and cold (permeate) streams, which are usually positioned within the membrane module on a distance no greater than few millimeters. Recently, a new construction of air gap MD module was proposed [
43,
45,
46,
47] and patented [
48]; this concept allows the intensification of the membrane distillation process. The key engineering element of this construction is a porous condensing surface (porous condenser) for condensation of water (permeate) vapors, which allows to scale up the process to the industrial level, simplify the construction, reduce the dimensions, and use the membrane module with any spatial orientation without the loss of efficiency. Using the simulation software Simulink (MATLAB), a membrane distillation process with a porous condenser using solar energy collectors for desalination of seawater was modeled. Simulations had shown the advantage of using solar panels, which reduced energy costs up to 61% in the process of desalination of seawater [
46]. Previously, the use of membrane crystallization together with membrane distillation with a porous condenser has not been investigated, not to mention the extraction of lithium from geothermal brines with high total salt content. In addition, it is of interest to carry out a full cycle of extraction of lithium from geothermal brines, from pre-preparation of geothermal brine to the production of commercial lithium chloride using promising processes such as membrane crystallization and membrane extraction. Before the implementation of the integrated technologies, the entire process should be modeled to check the feasibility of carrying out the proposed processes. Process simulation has become an established and widely used tool for performance calculation, design, and optimization of process parameters.
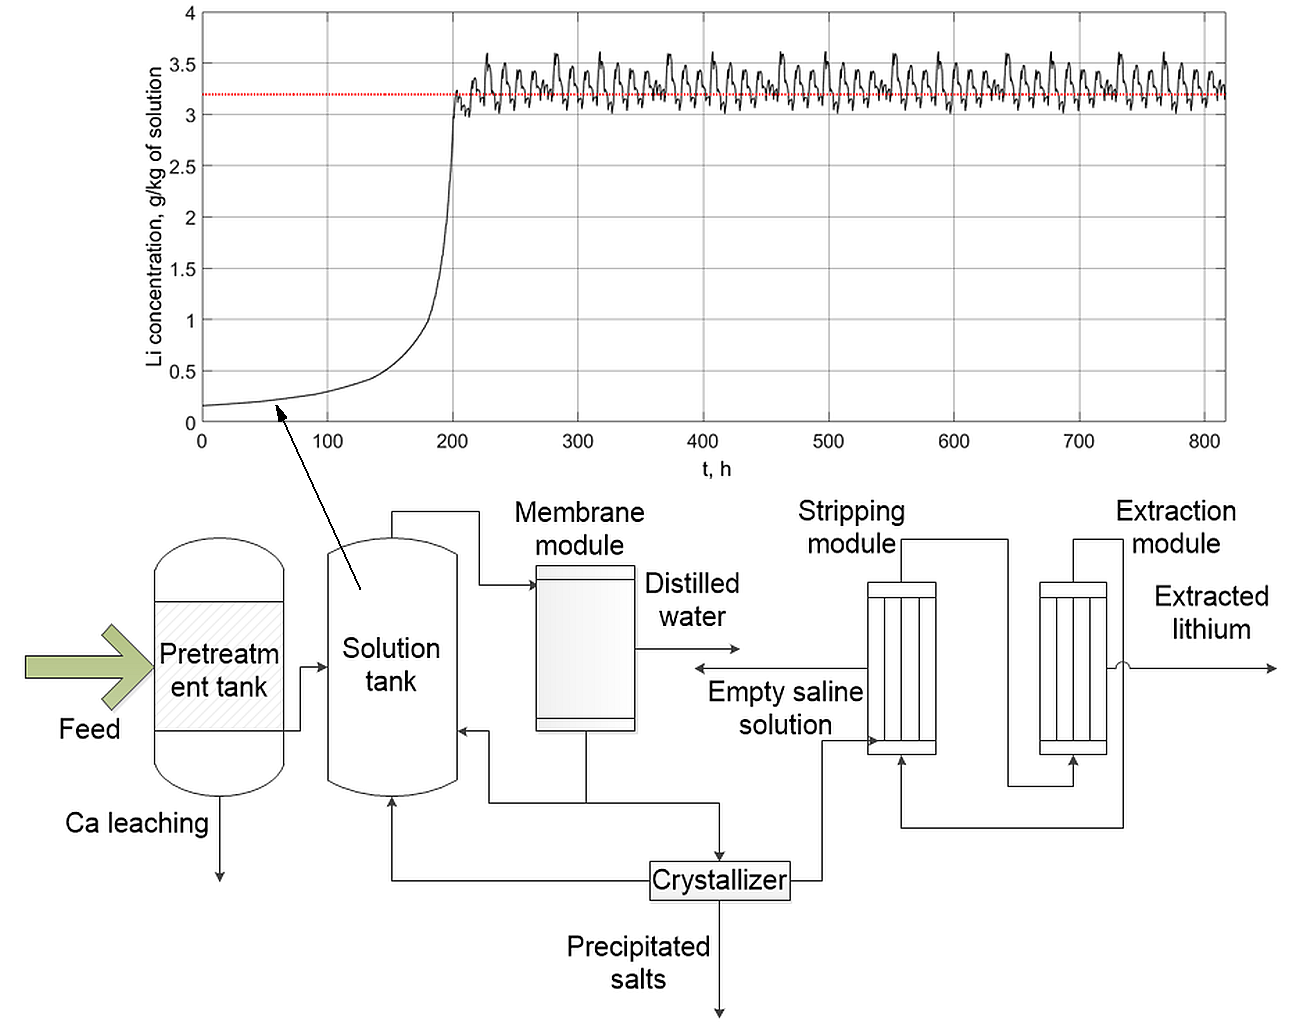
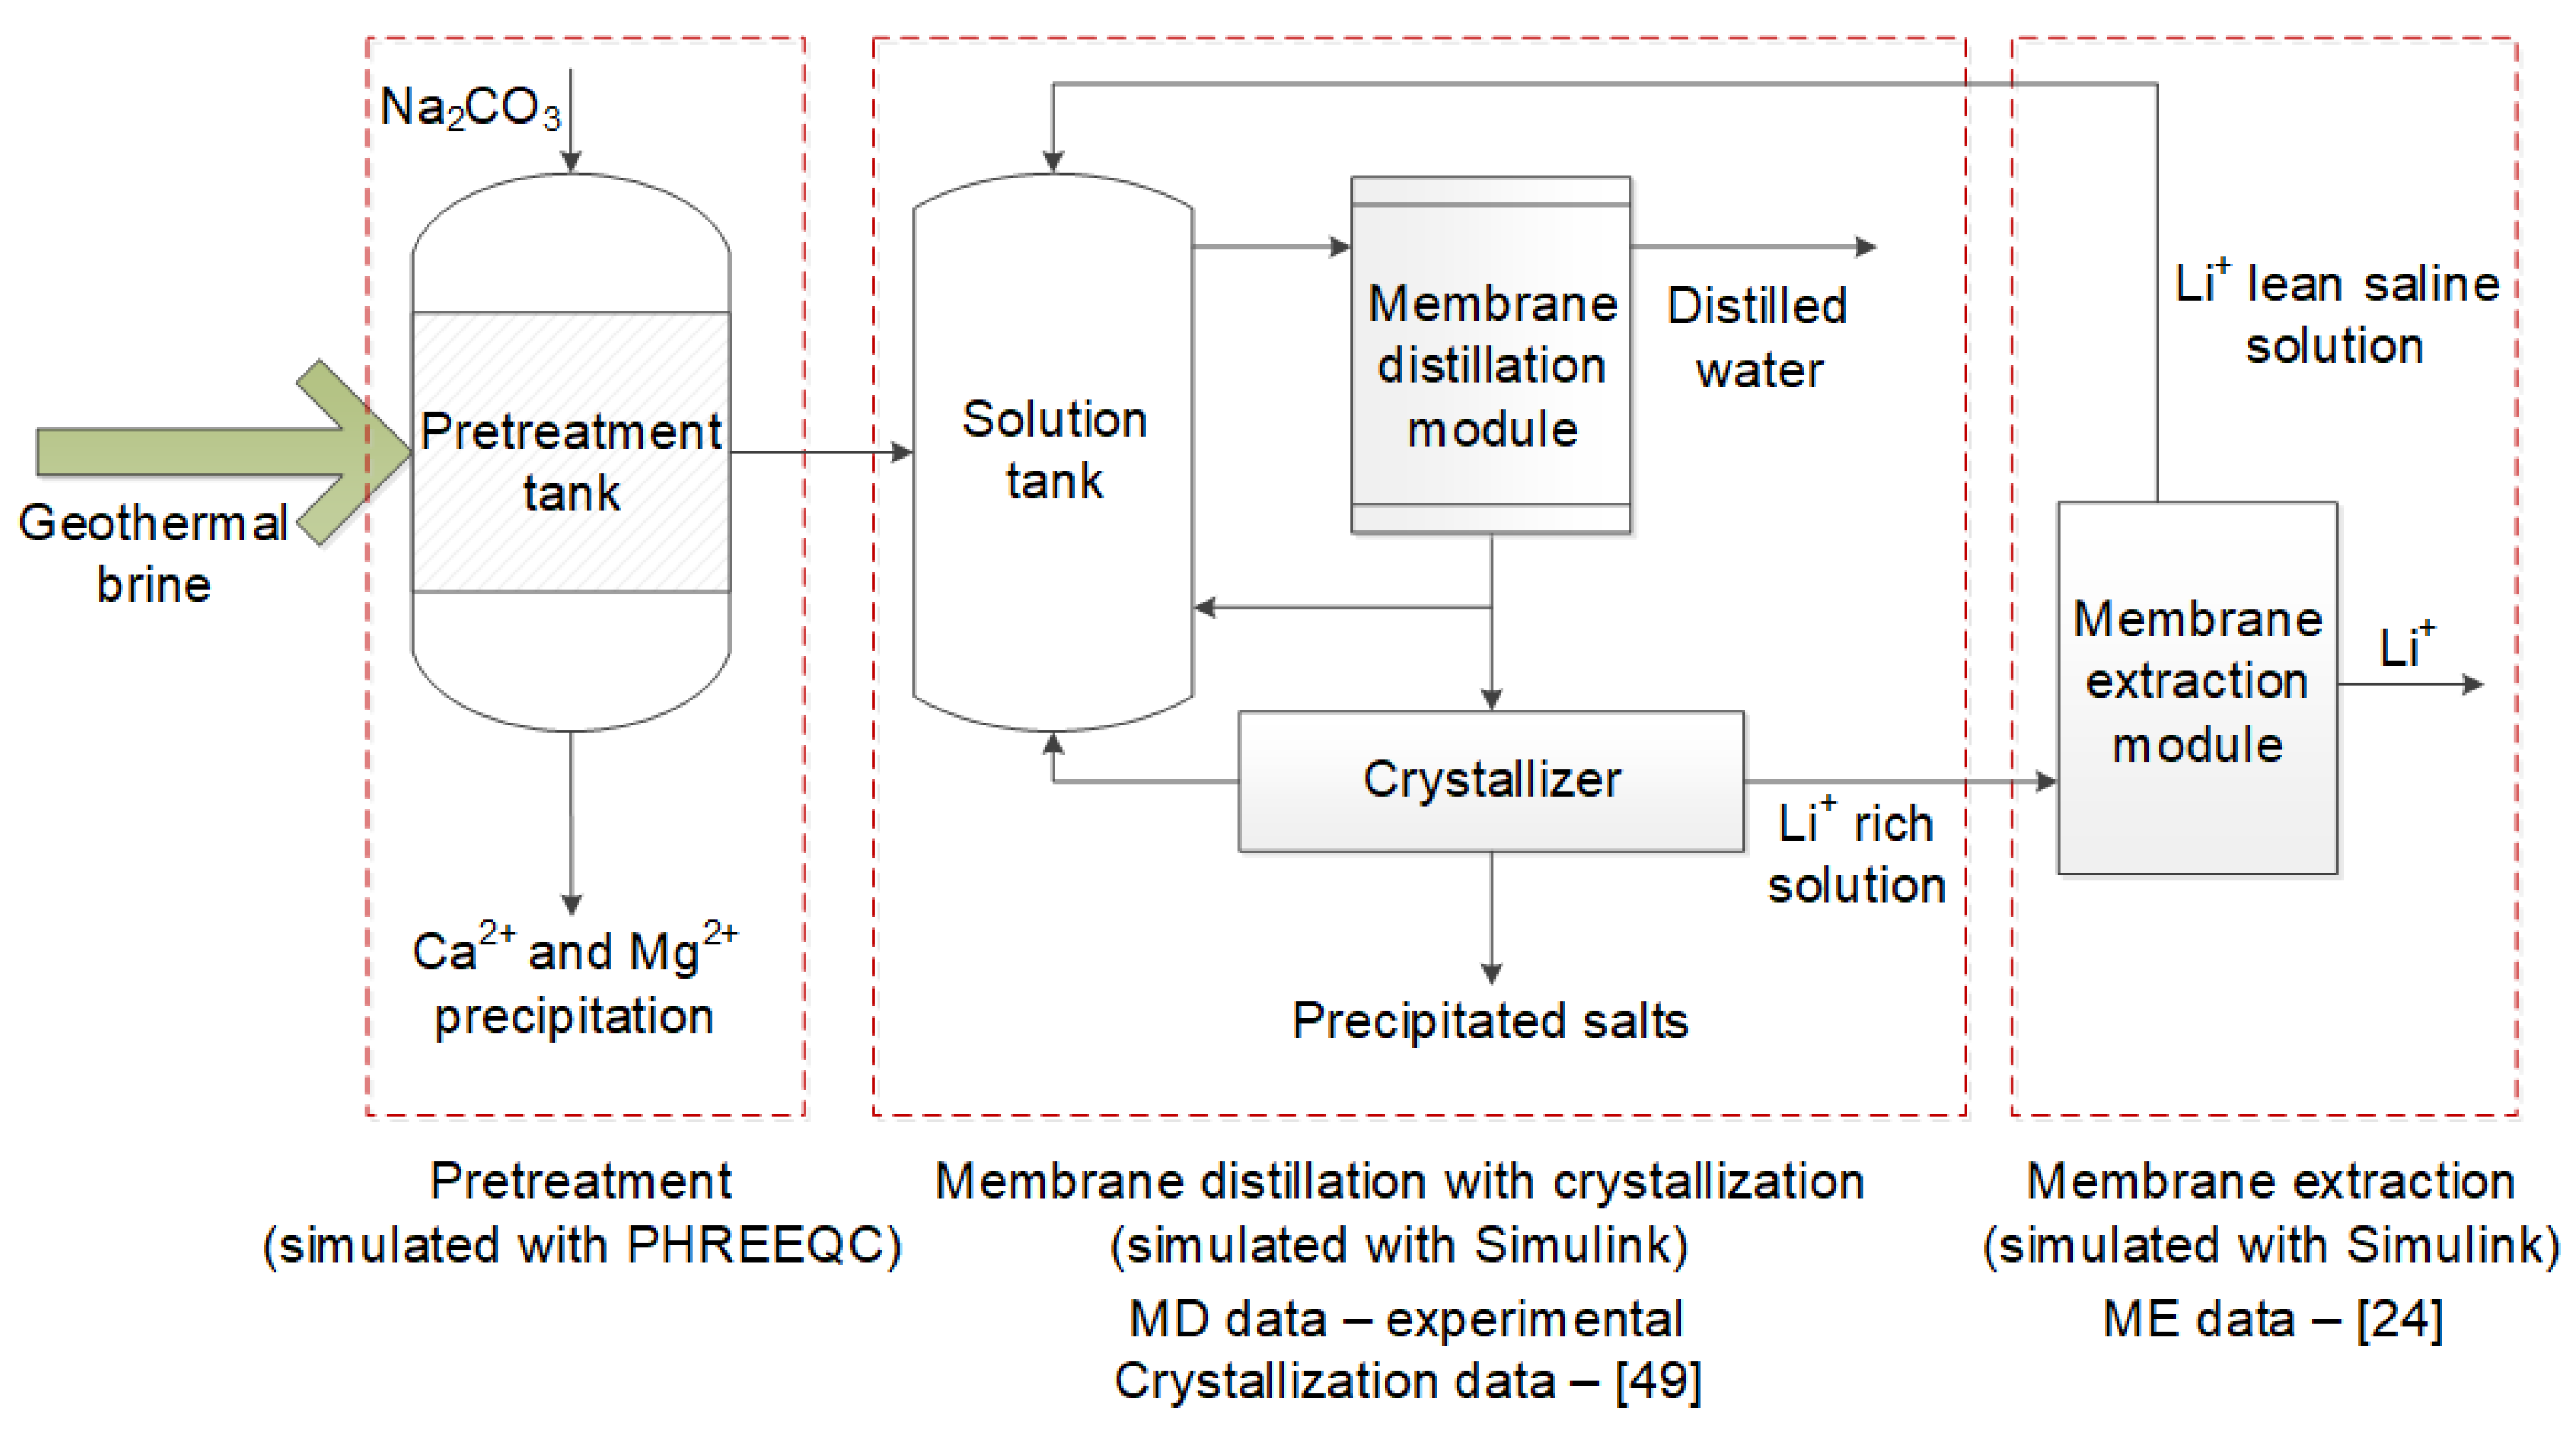
Therefore, the goal of this work was to simulate the operation of the lithium recovery process from geothermal brines with the primary focus on the performance of the membrane distillation unit used for salt concentration. The process consisted of three different stages as shown in
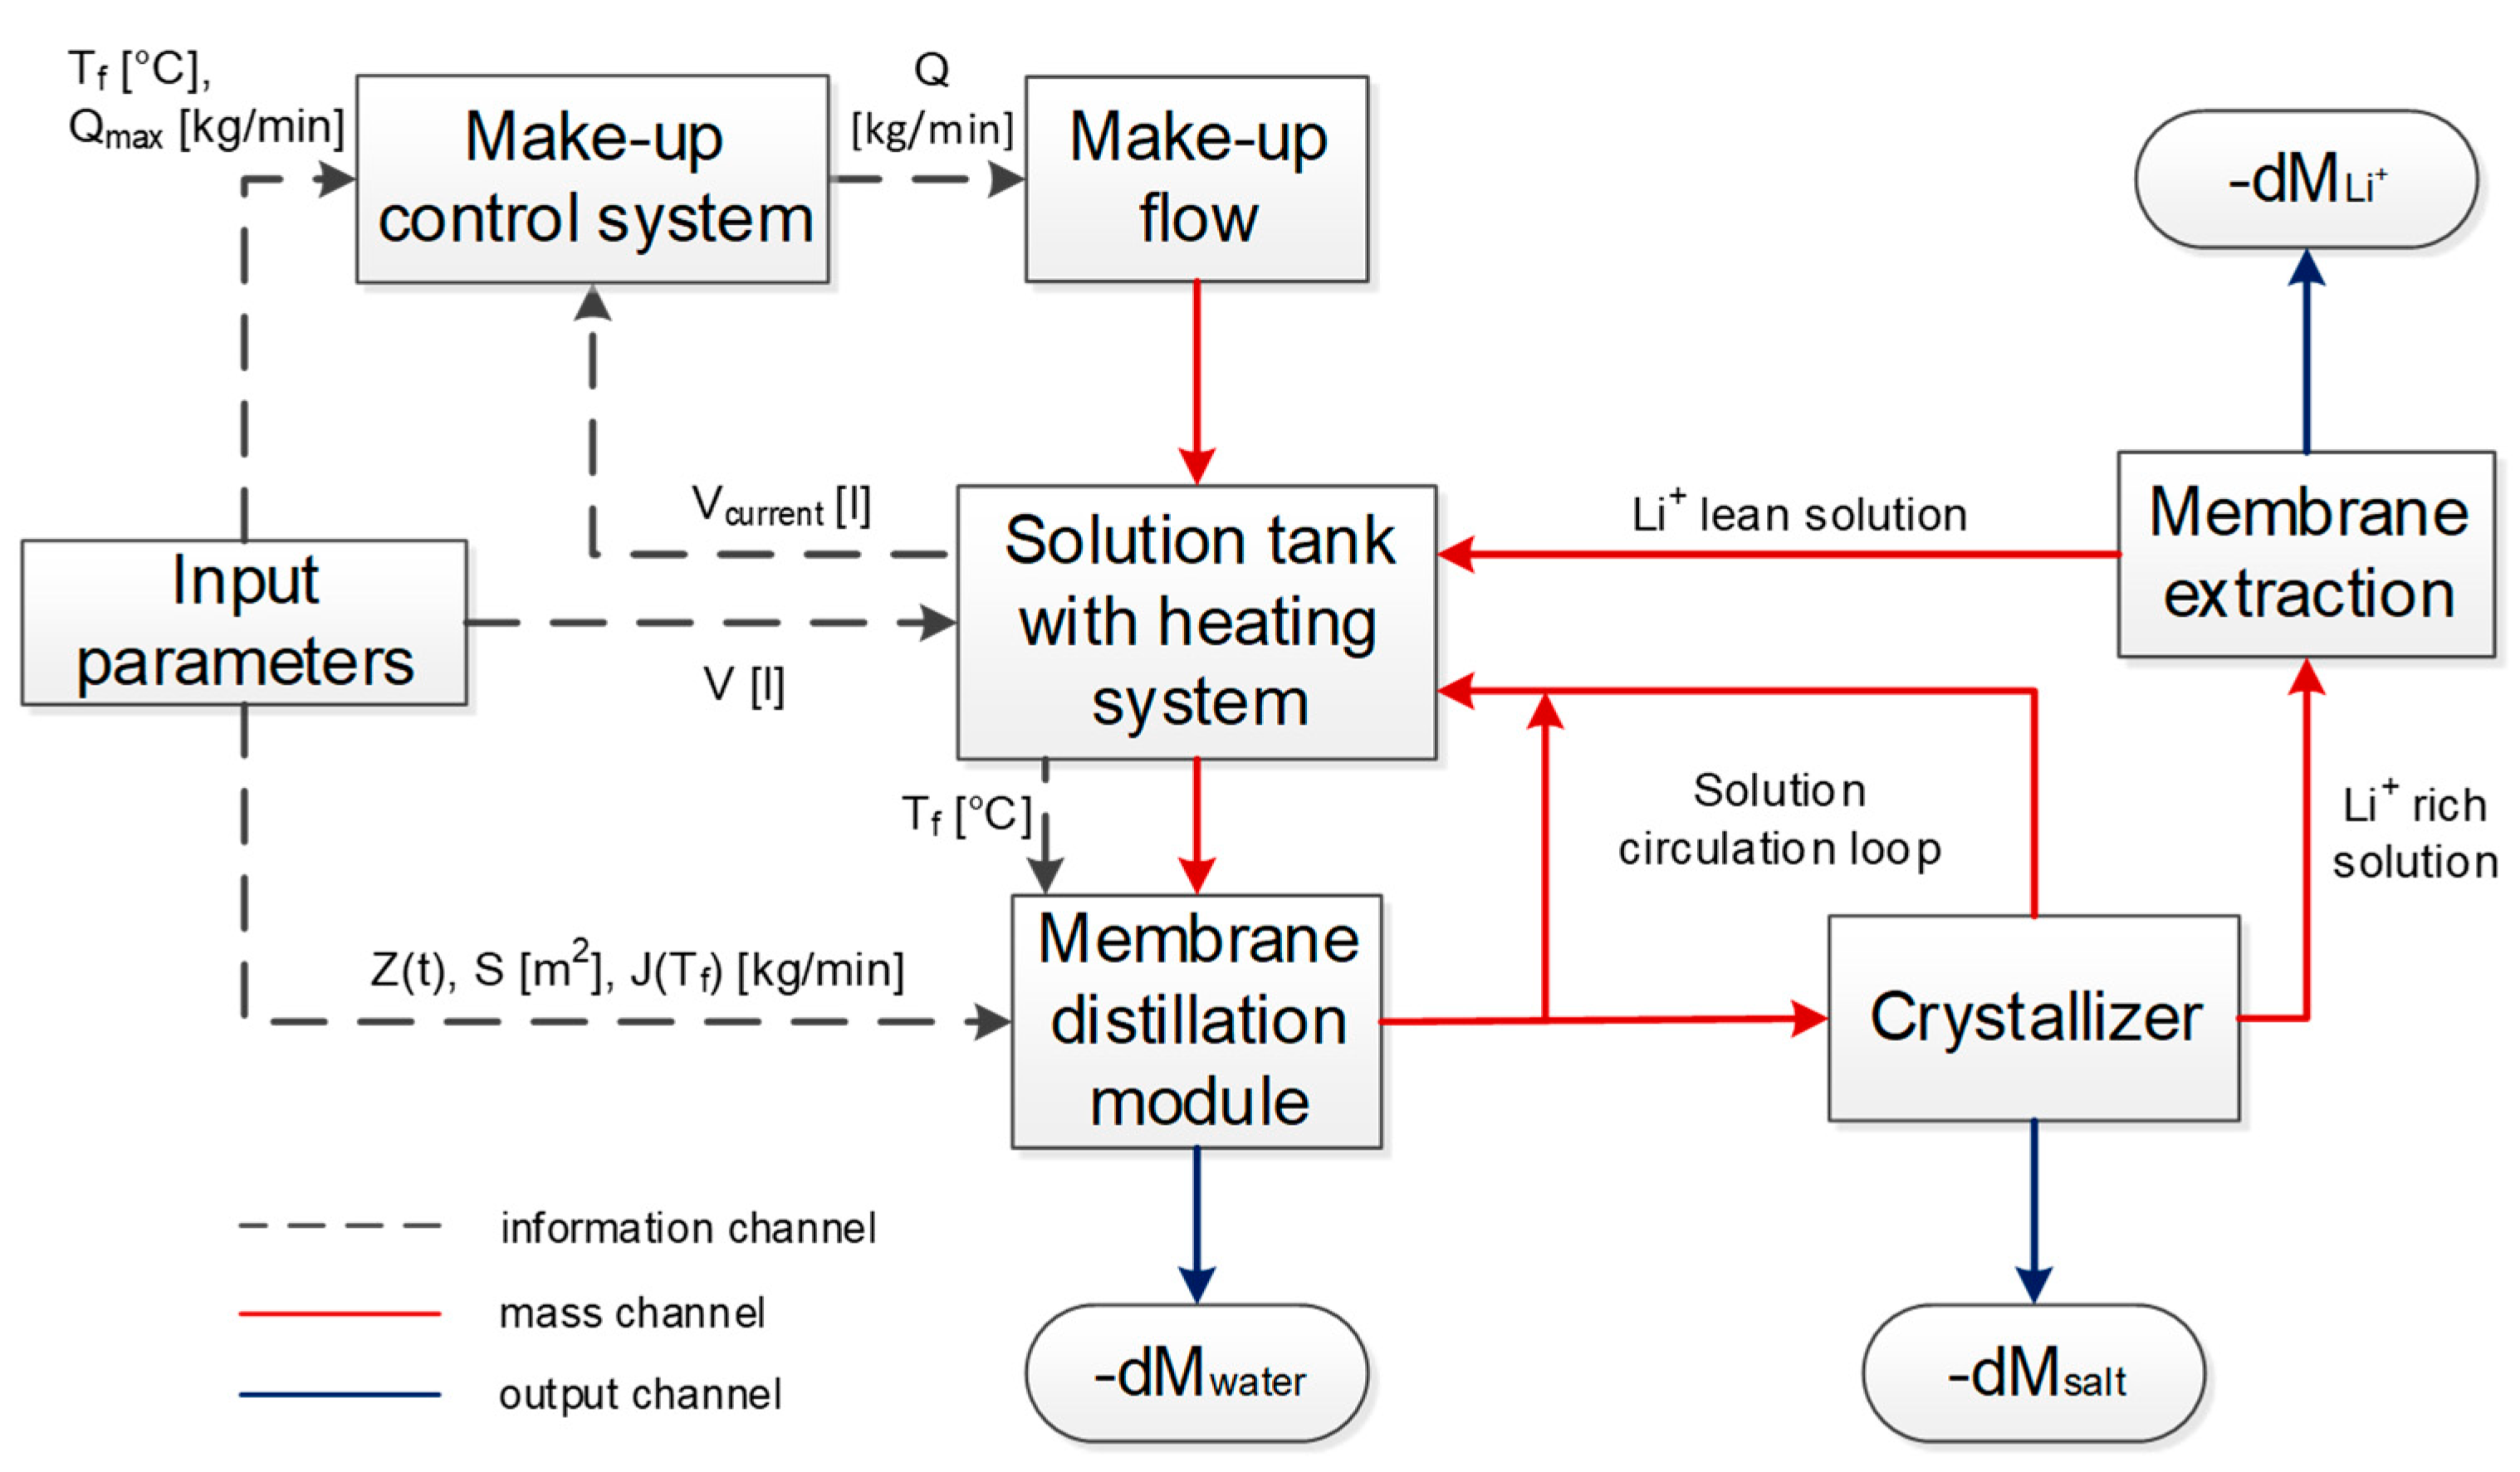
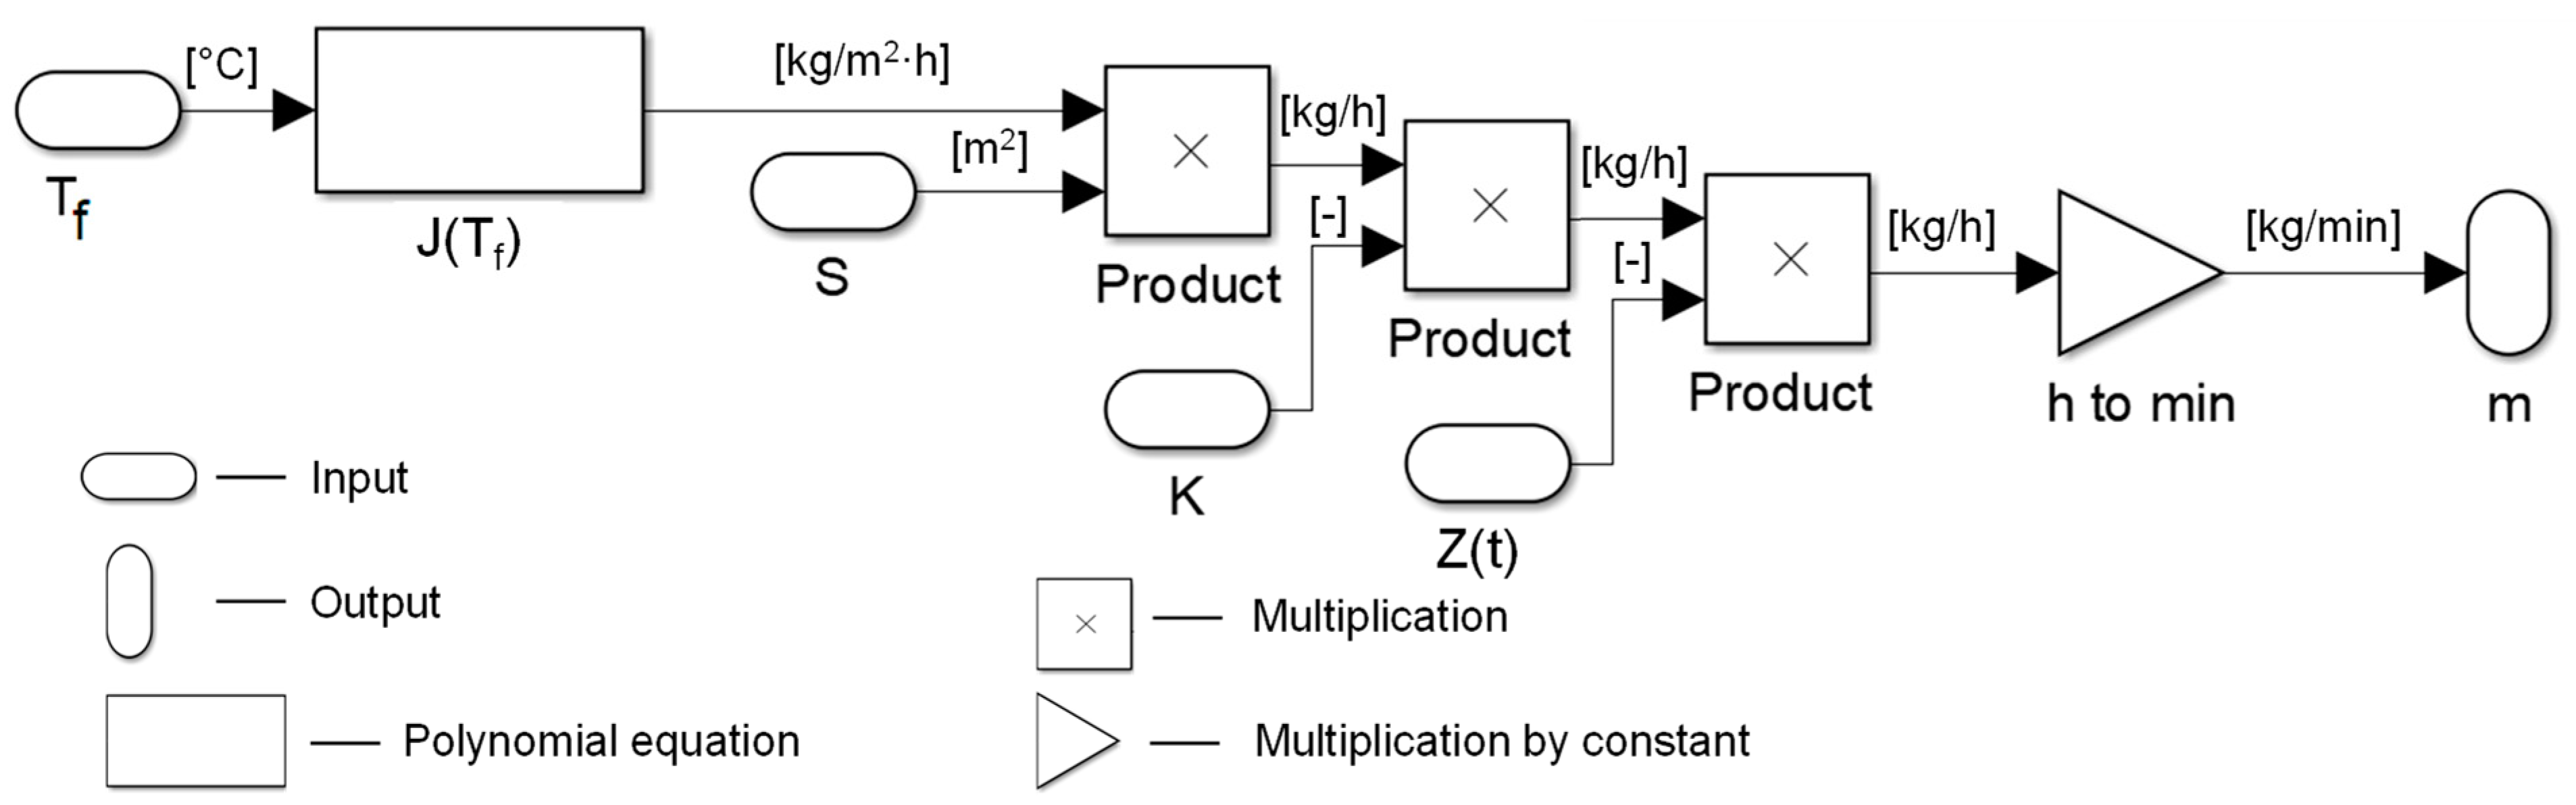
Figure 1: (i) removal of hardness ions from geothermal brine by leaching with sodium carbonate, (ii) concentration of a pre-treated solution by using air–gap membrane distillation equipped with membrane condenser (AGMD-MC), and (iii) membrane extraction of lithium ions. The composition of the model solution after sodium carbonate pre-treatment used as the feed for the stage of membrane distillation with crystallization was calculated with the PHREEQC program, and the performance of the last two stages was modeled using Simulink program. Simulink is an add-on to MATLAB and is a graphical programming environment for modeling the behavior of the system over time (dynamic modeling). Unlike classical programming languages and MATLAB itself, Simulink has a relatively low entry threshold because it does not require writing extensive program code; instead, graphic blocks are used to describe mathematical expressions [
46].
4. Conclusions
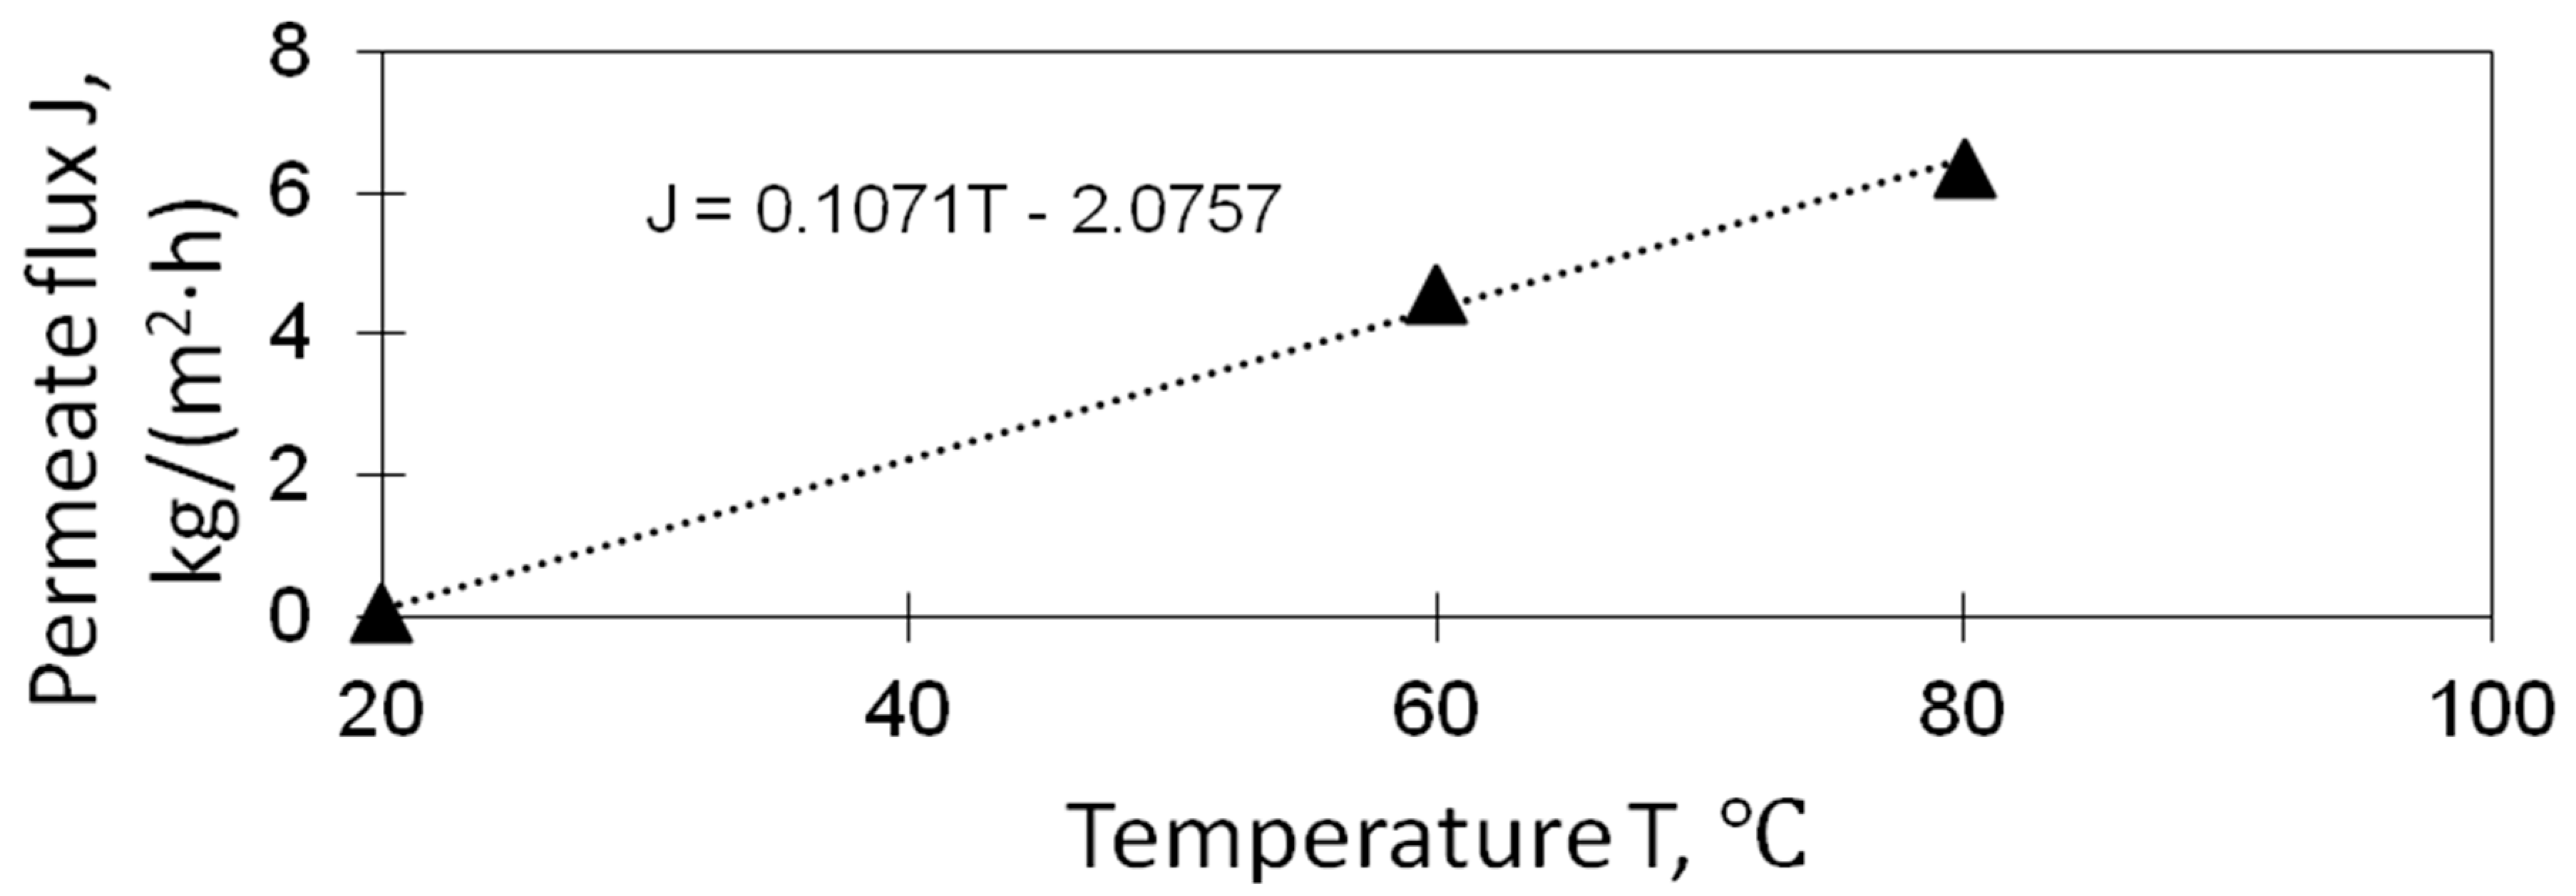
Lithium-rich geothermal waters are considered as an alternative source, and further concentration of lithium is required for its effective recovery. However, the high salinity of such geothermal brines including the presence of magnesium cations hinders their wide utilization. Since the concentration of brine solution would be attributed to the highest energy cost, the membrane distillation seems a promising approach since the low-grade heat (e.g., 60 °C) can be utilized. In this work, we have simulated a three-stage lithium recovery process including the brine softening by precipitation Ca2+/Mg2+ cations with sodium carbonate (calculated in PHREEQC), followed by an integrated system consisting of membrane distillation unit (water evaporation), crystallizer (NaCl precipitation), and membrane extraction (Li+ recovery), which was simulated in Simulink/MATLAB. Simulink/MATLAB allows for simulating the operation of different units integrated into one system in the real-time regime. The small membrane surface area of 2.5 m2 for the integrated system of 140 kg of saline solution was selected to accumulate a sufficient number of membrane replacements within two months of operation for the evaluation. Based on the obtained results, the following conclusions and comments can be made:
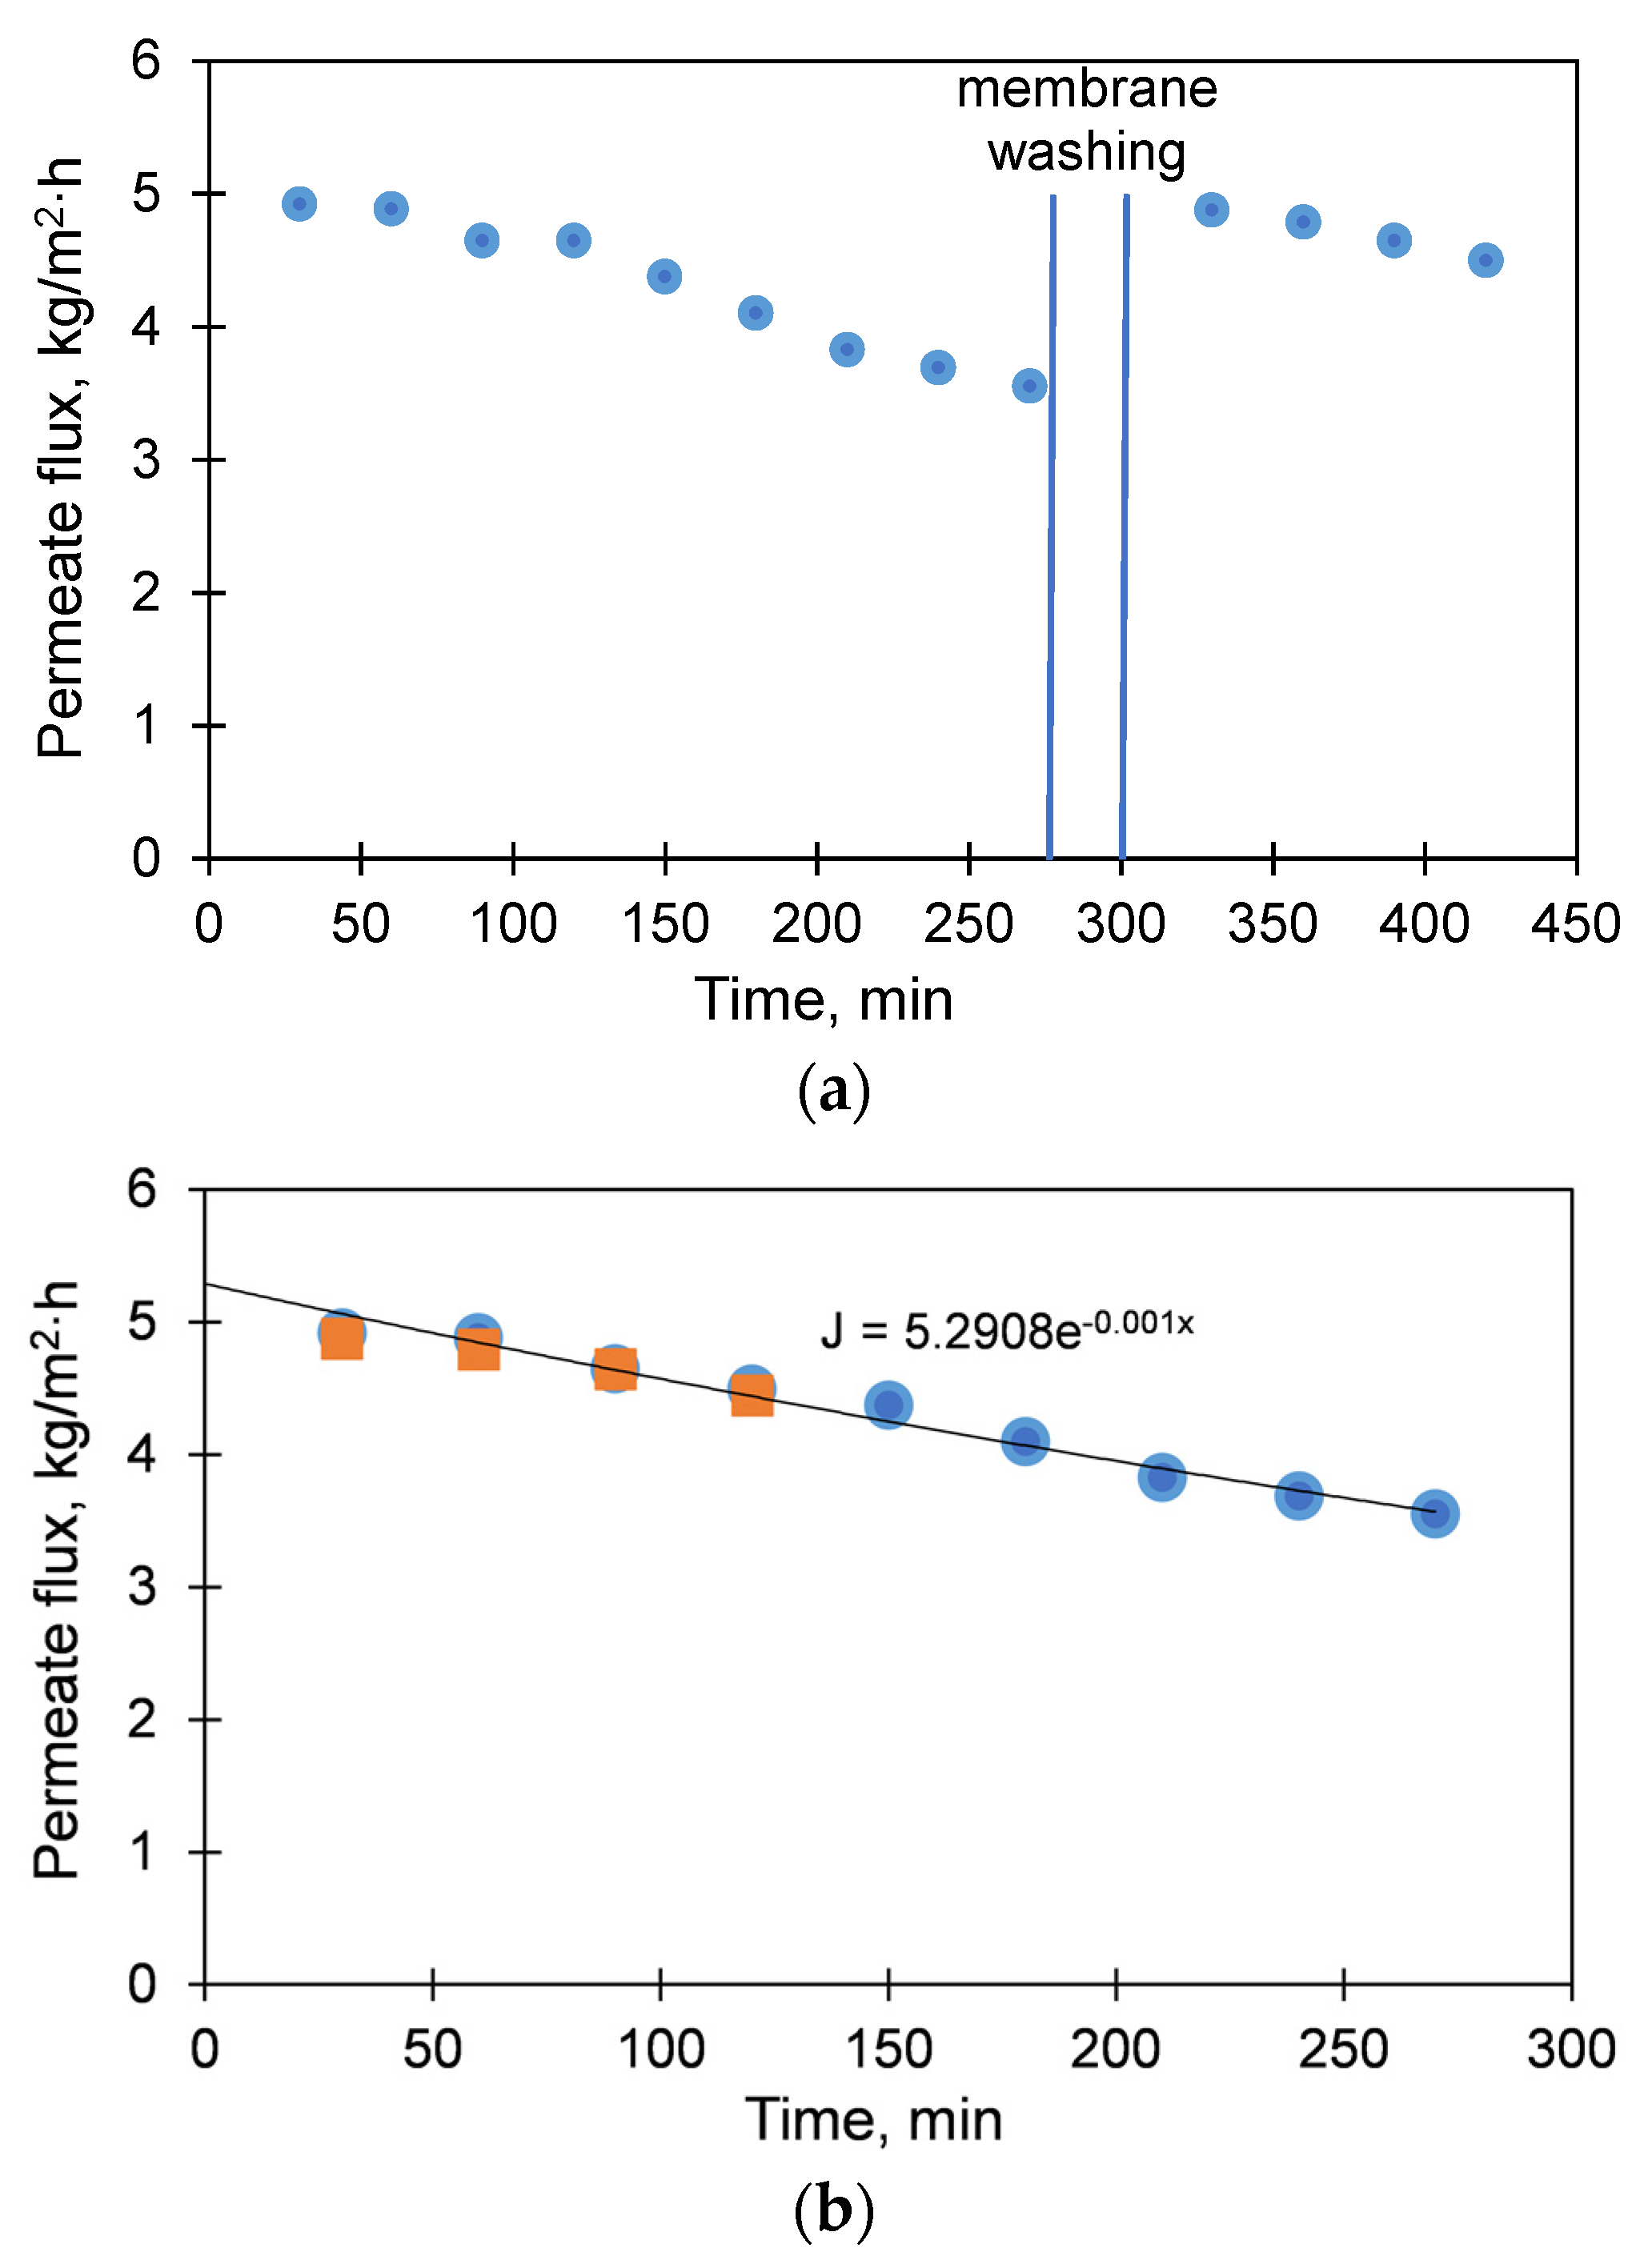
1. High robust, fouling resistance membranes are needed. The deterioration of membrane performance in time due to scaling/fouling plays a critical role in the performance of the system. For example, if the membranes undergo greater irreversible fouling resulting in the recovery ratio of water flux after its washing every 4.5 h at 95% from the previous value instead of 99%, then two months of operation would require 21 replacements of membrane modules instead of 4. The specific lithium recovery per square meter of membrane in the module is mainly determined by the recovery ratio, which defines the lifetime of the membrane module, rather than the run time of the module before washing.
2. Low cost membranes are required. The process simulation based on the experimental and literature data on the high salinity solutions with the membrane distillation revealed that the specific productivity is within the range of 9.9–880 g(Li+) per square meter of membranes in the module used before the replacement, which makes 0.053-4.7 kg in the form of lithium carbonate or 0.5-42 USD (lithium carbonate price—58.5 CNY/kg at China Spot on 18.02.2021). However, all direct and indirect costs must be accounted; for instance, the microfiltration, hydrophobic membrane MFFK-1 used in this study to carry out the membrane distillation experiments costs 1300 Rub/m2 (~17.5 USD/m2).
3. The increase of energy efficiency is needed. The mass-flow-rate of saline solution circulated to the crystallizer was set at its almost minimum value as 6.5 kg/min to enable its successful operation at the given parameters of the membrane distillation unit. In other words, the operation of the integrated system having 140 kg of saline solution in the loop, membrane module of 2.5 m2 for concentration of lithium presence from 0.11 up to 2.3 g/kg would be associated with the circulation of about of 259 tons of saline solution per month between the distillation unit (60 °C) and the crystallizer (15 °C) to a yield of up to 1.4 kg of lithium ions. Therefore, it will be critical to implement the effective heat recuperation, which will be complicated by the fact that the saline solution is near saturation or oversaturation with regard to its temperature.
4. To increase the attractiveness of the geothermal brines as an alternative lithium source, novel concentration methods of high saline solutions with high robustness to the scaling and fouling during the long-term operation are needed. For instance, the thin-film distillation coupled with membrane condenser for brine solutions concentration was recently proposed [
47]. In addition, lower temperature difference between different units of the integrated system might overcome the problem of salt precipitation and enable more effective heat recuperation.


 ,
, 


