
Removing of the Sulfur Compounds by Impregnated Polypropylene Fibers with Silver Nanoparticles-Cellulose Derivatives for Air Odor Correction

 , ,
, ,  , ,
, ,  , ,
, ,
Abstract
:
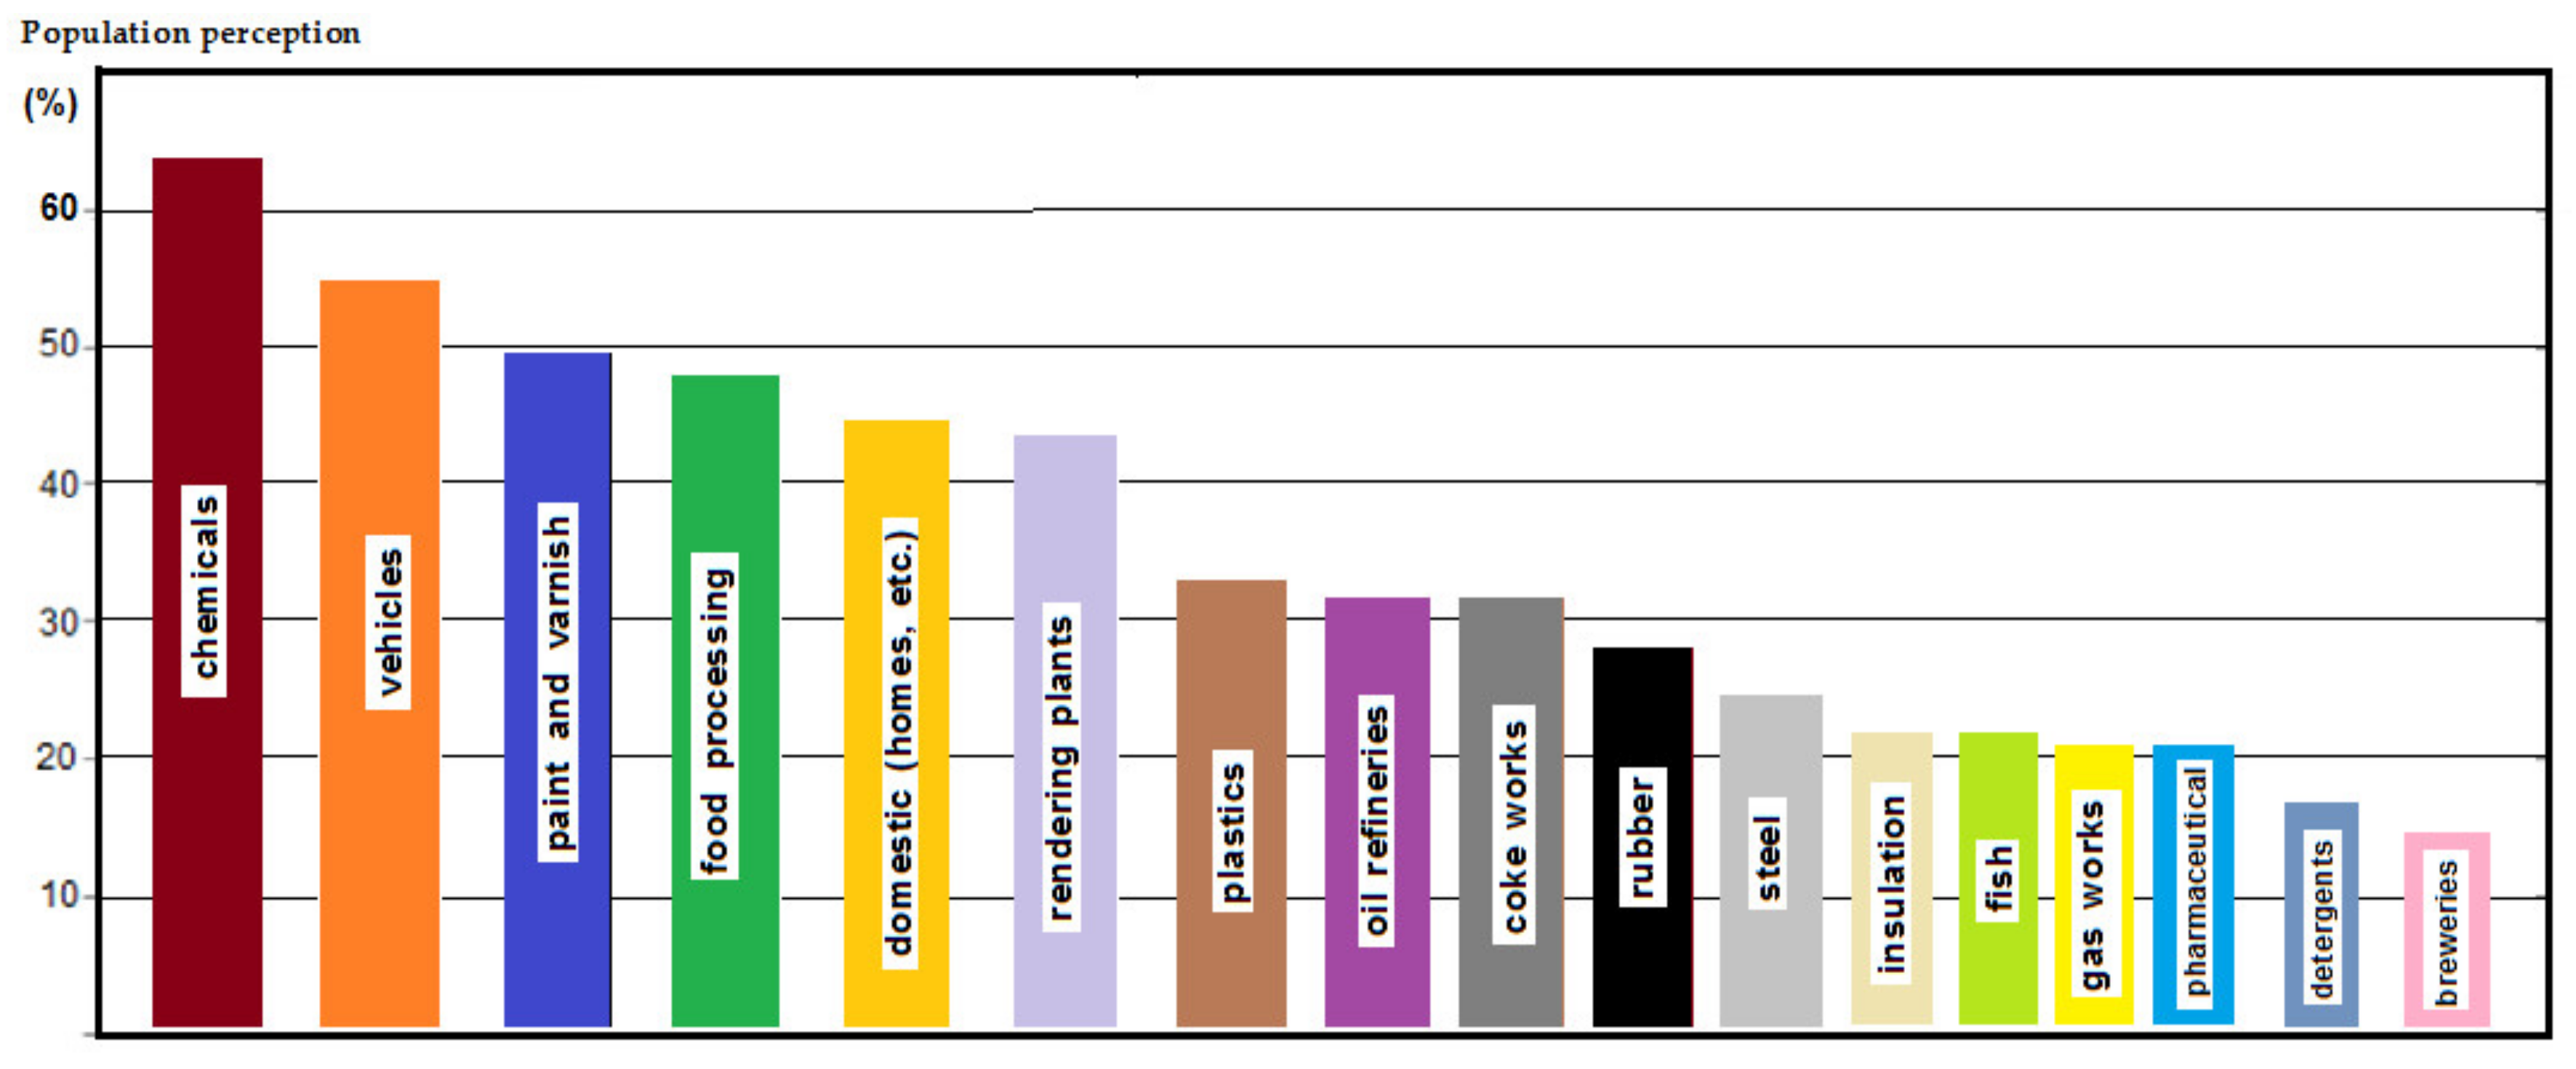
1. Introduction
- Relocation of polluting production units outside the localities;
- Giving up to polluting technologies;
- Improving production processes;
- Mandatory control of pollutant emissions and regulations regarding the allowed concentration levels;
- Reducing of greenhouse gas emissions;
- Promoting new technologies, with a tendency to allow only the implementation of clean or ecological/green technologies, which are more friendly to the environment;
- Use of recyclable materials, etc.
2. Materials and Methods
2.1. Materials
2.1.1. Chemicals
2.1.2. Membrane Support
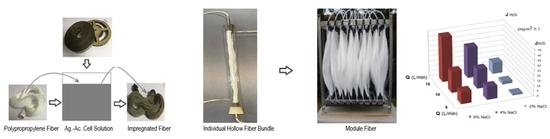
2.2. Impregnated Ag-Cellulose Acetate Polypropylene Membrane Preparation (Ag-Cell-Ac-PPM)
2.2.1. Obtaining Ag-Cellulose Acetate Recovered from Film Solutions
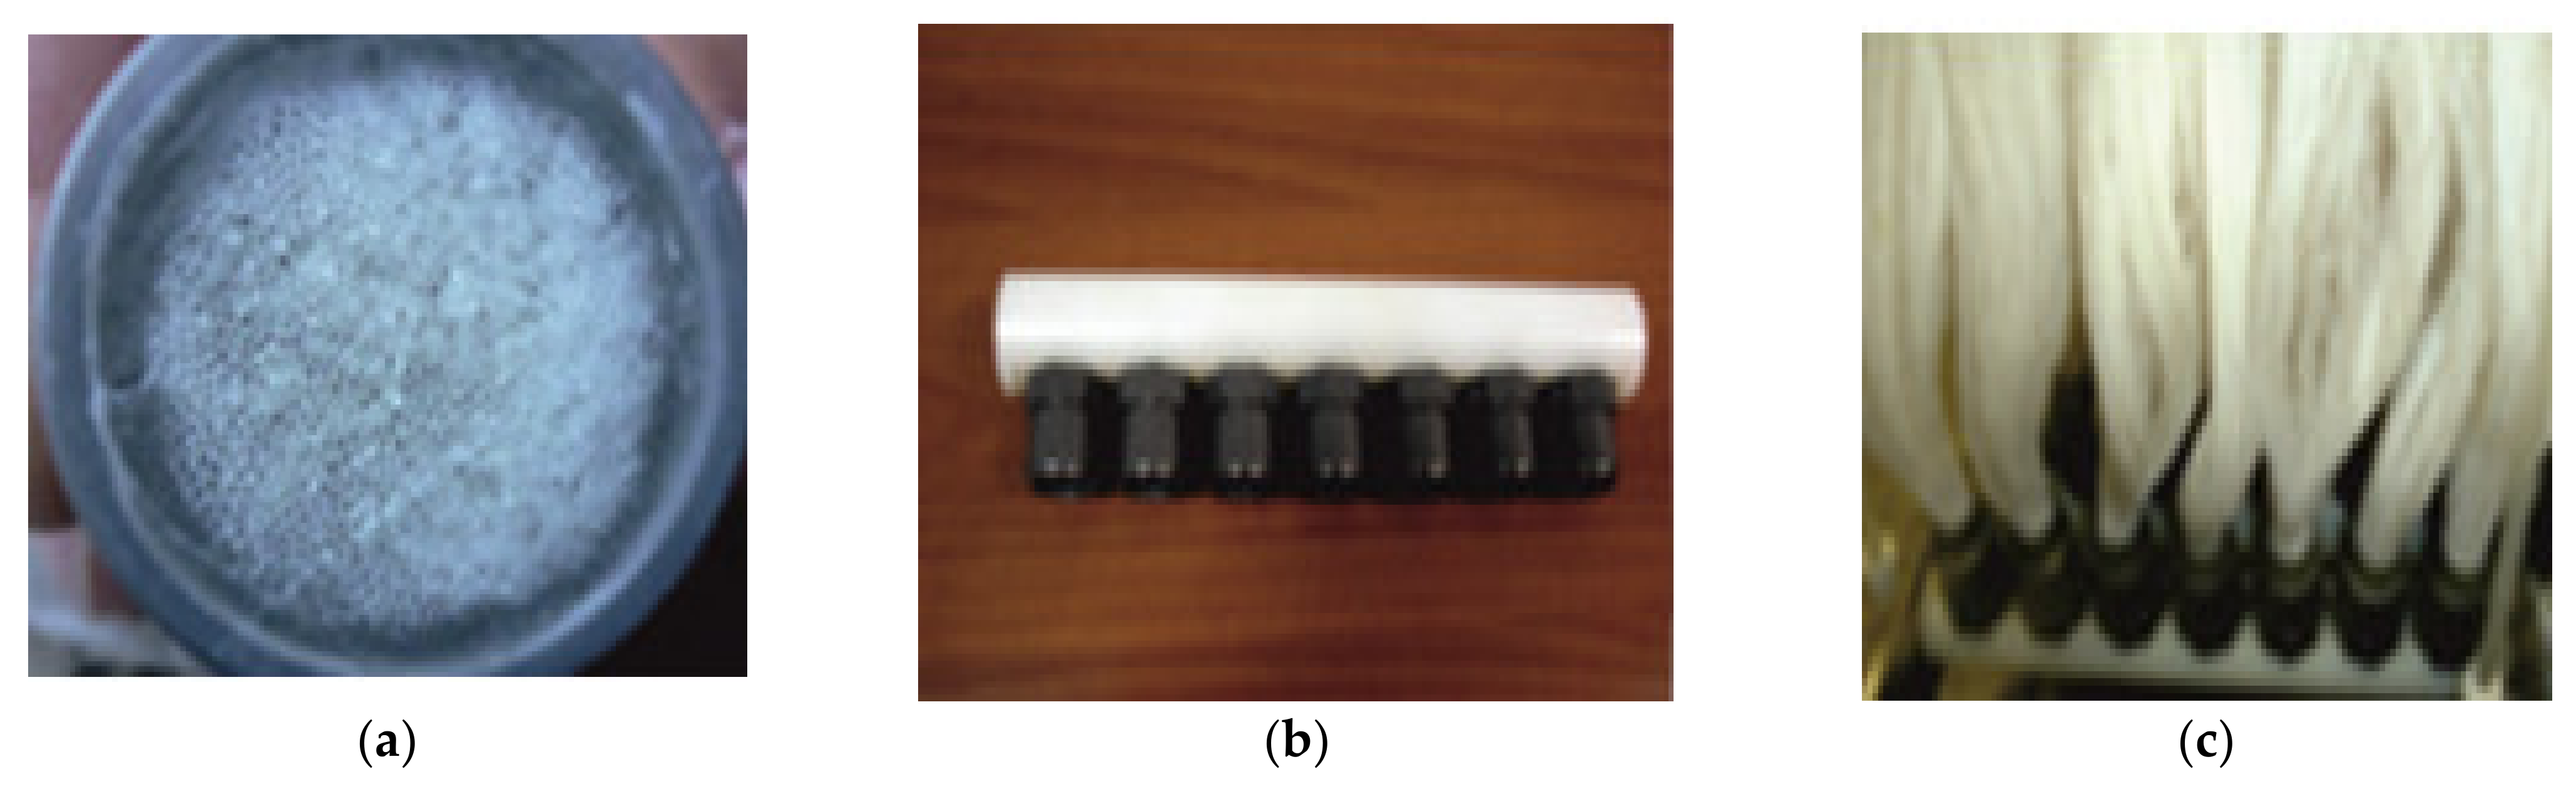
2.2.2. Obtaining Ag-Cellulose Acetate Impregnated on Polypropylene Fibers Membranes (Ag-Cell-Ac-PPM)
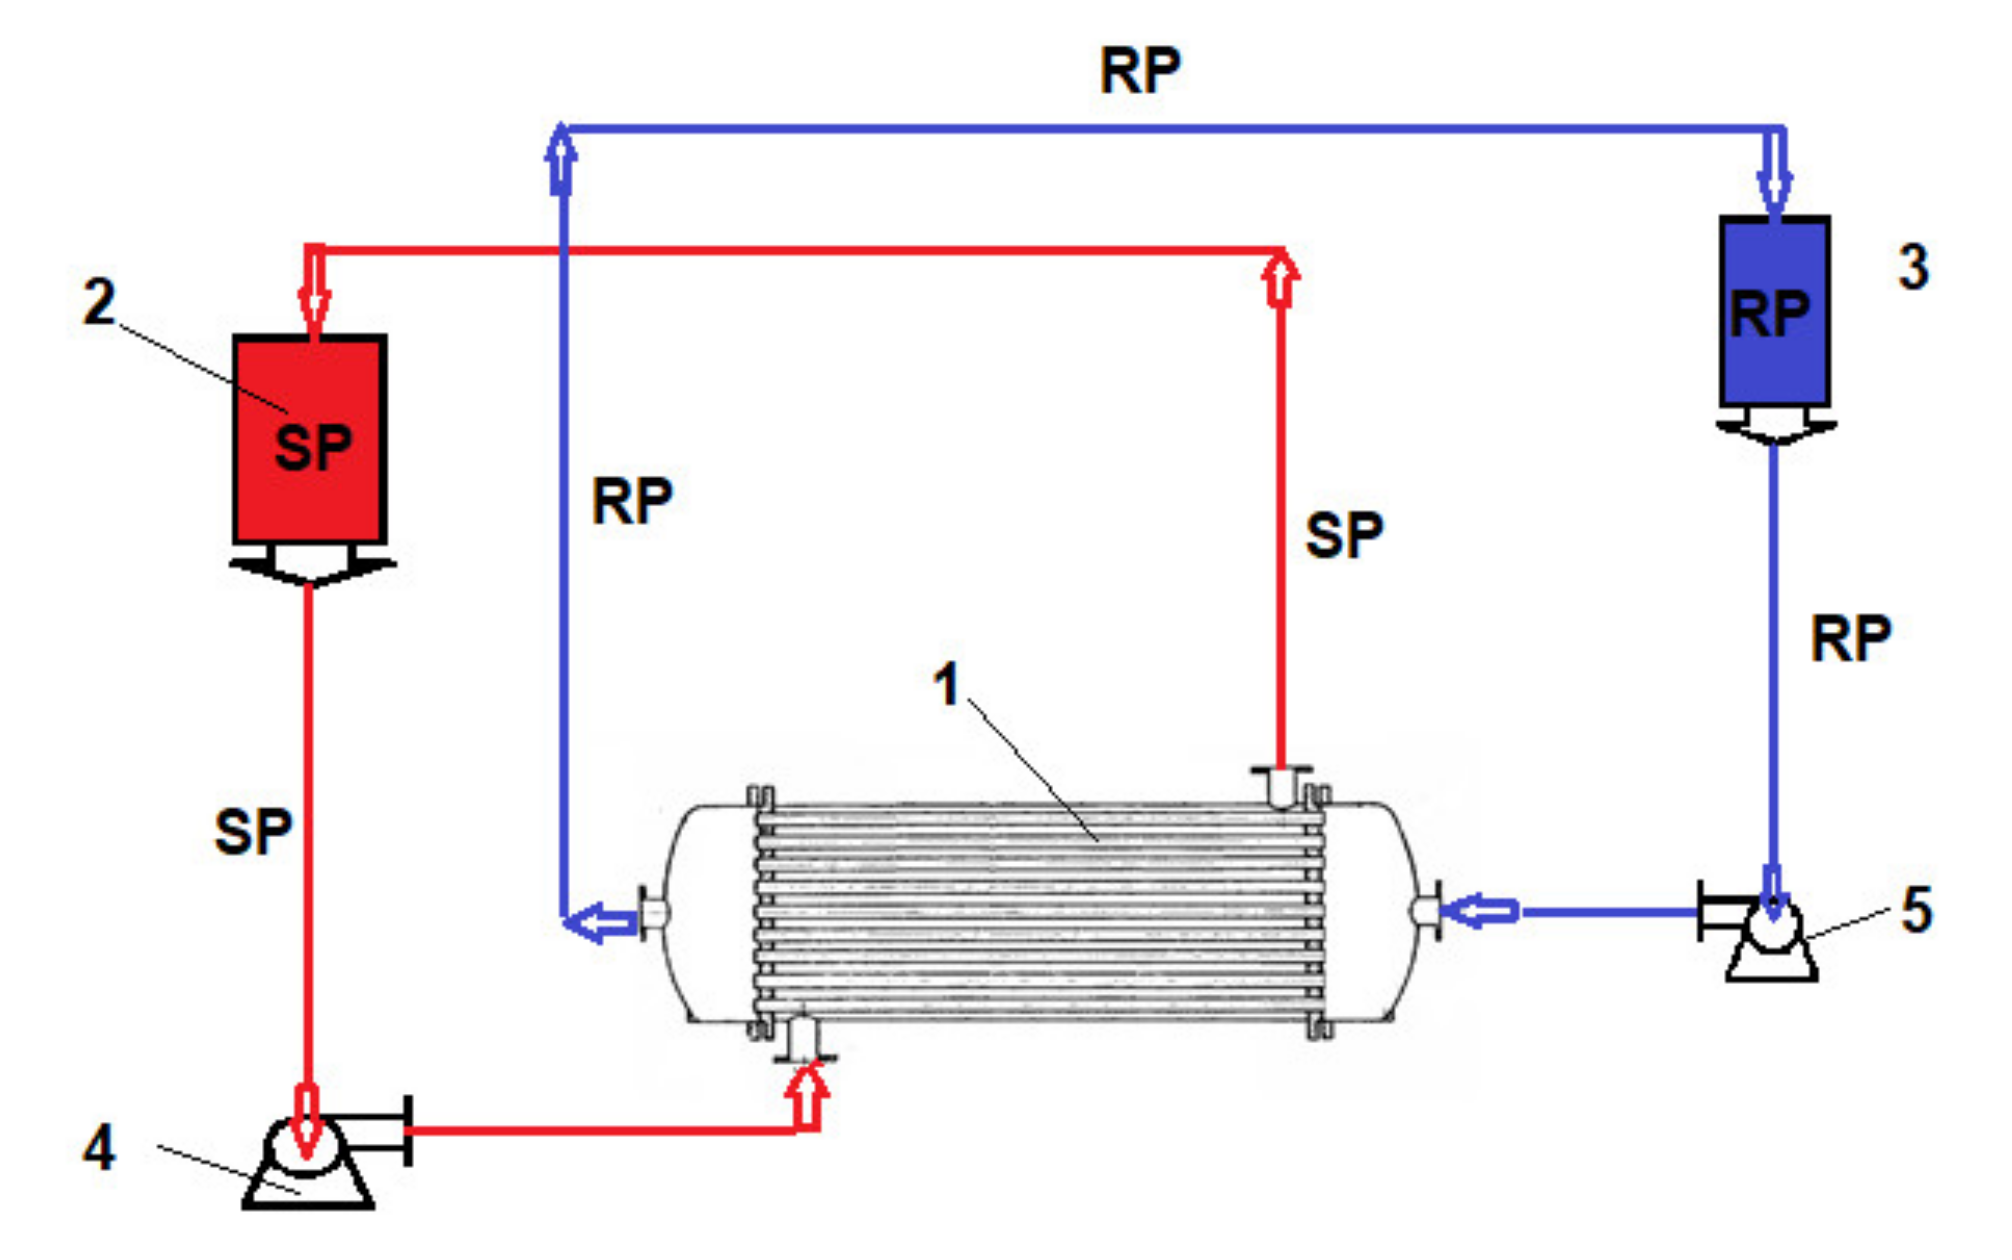
2.3. Permeation Procedures
2.4. Equipment
3. Results
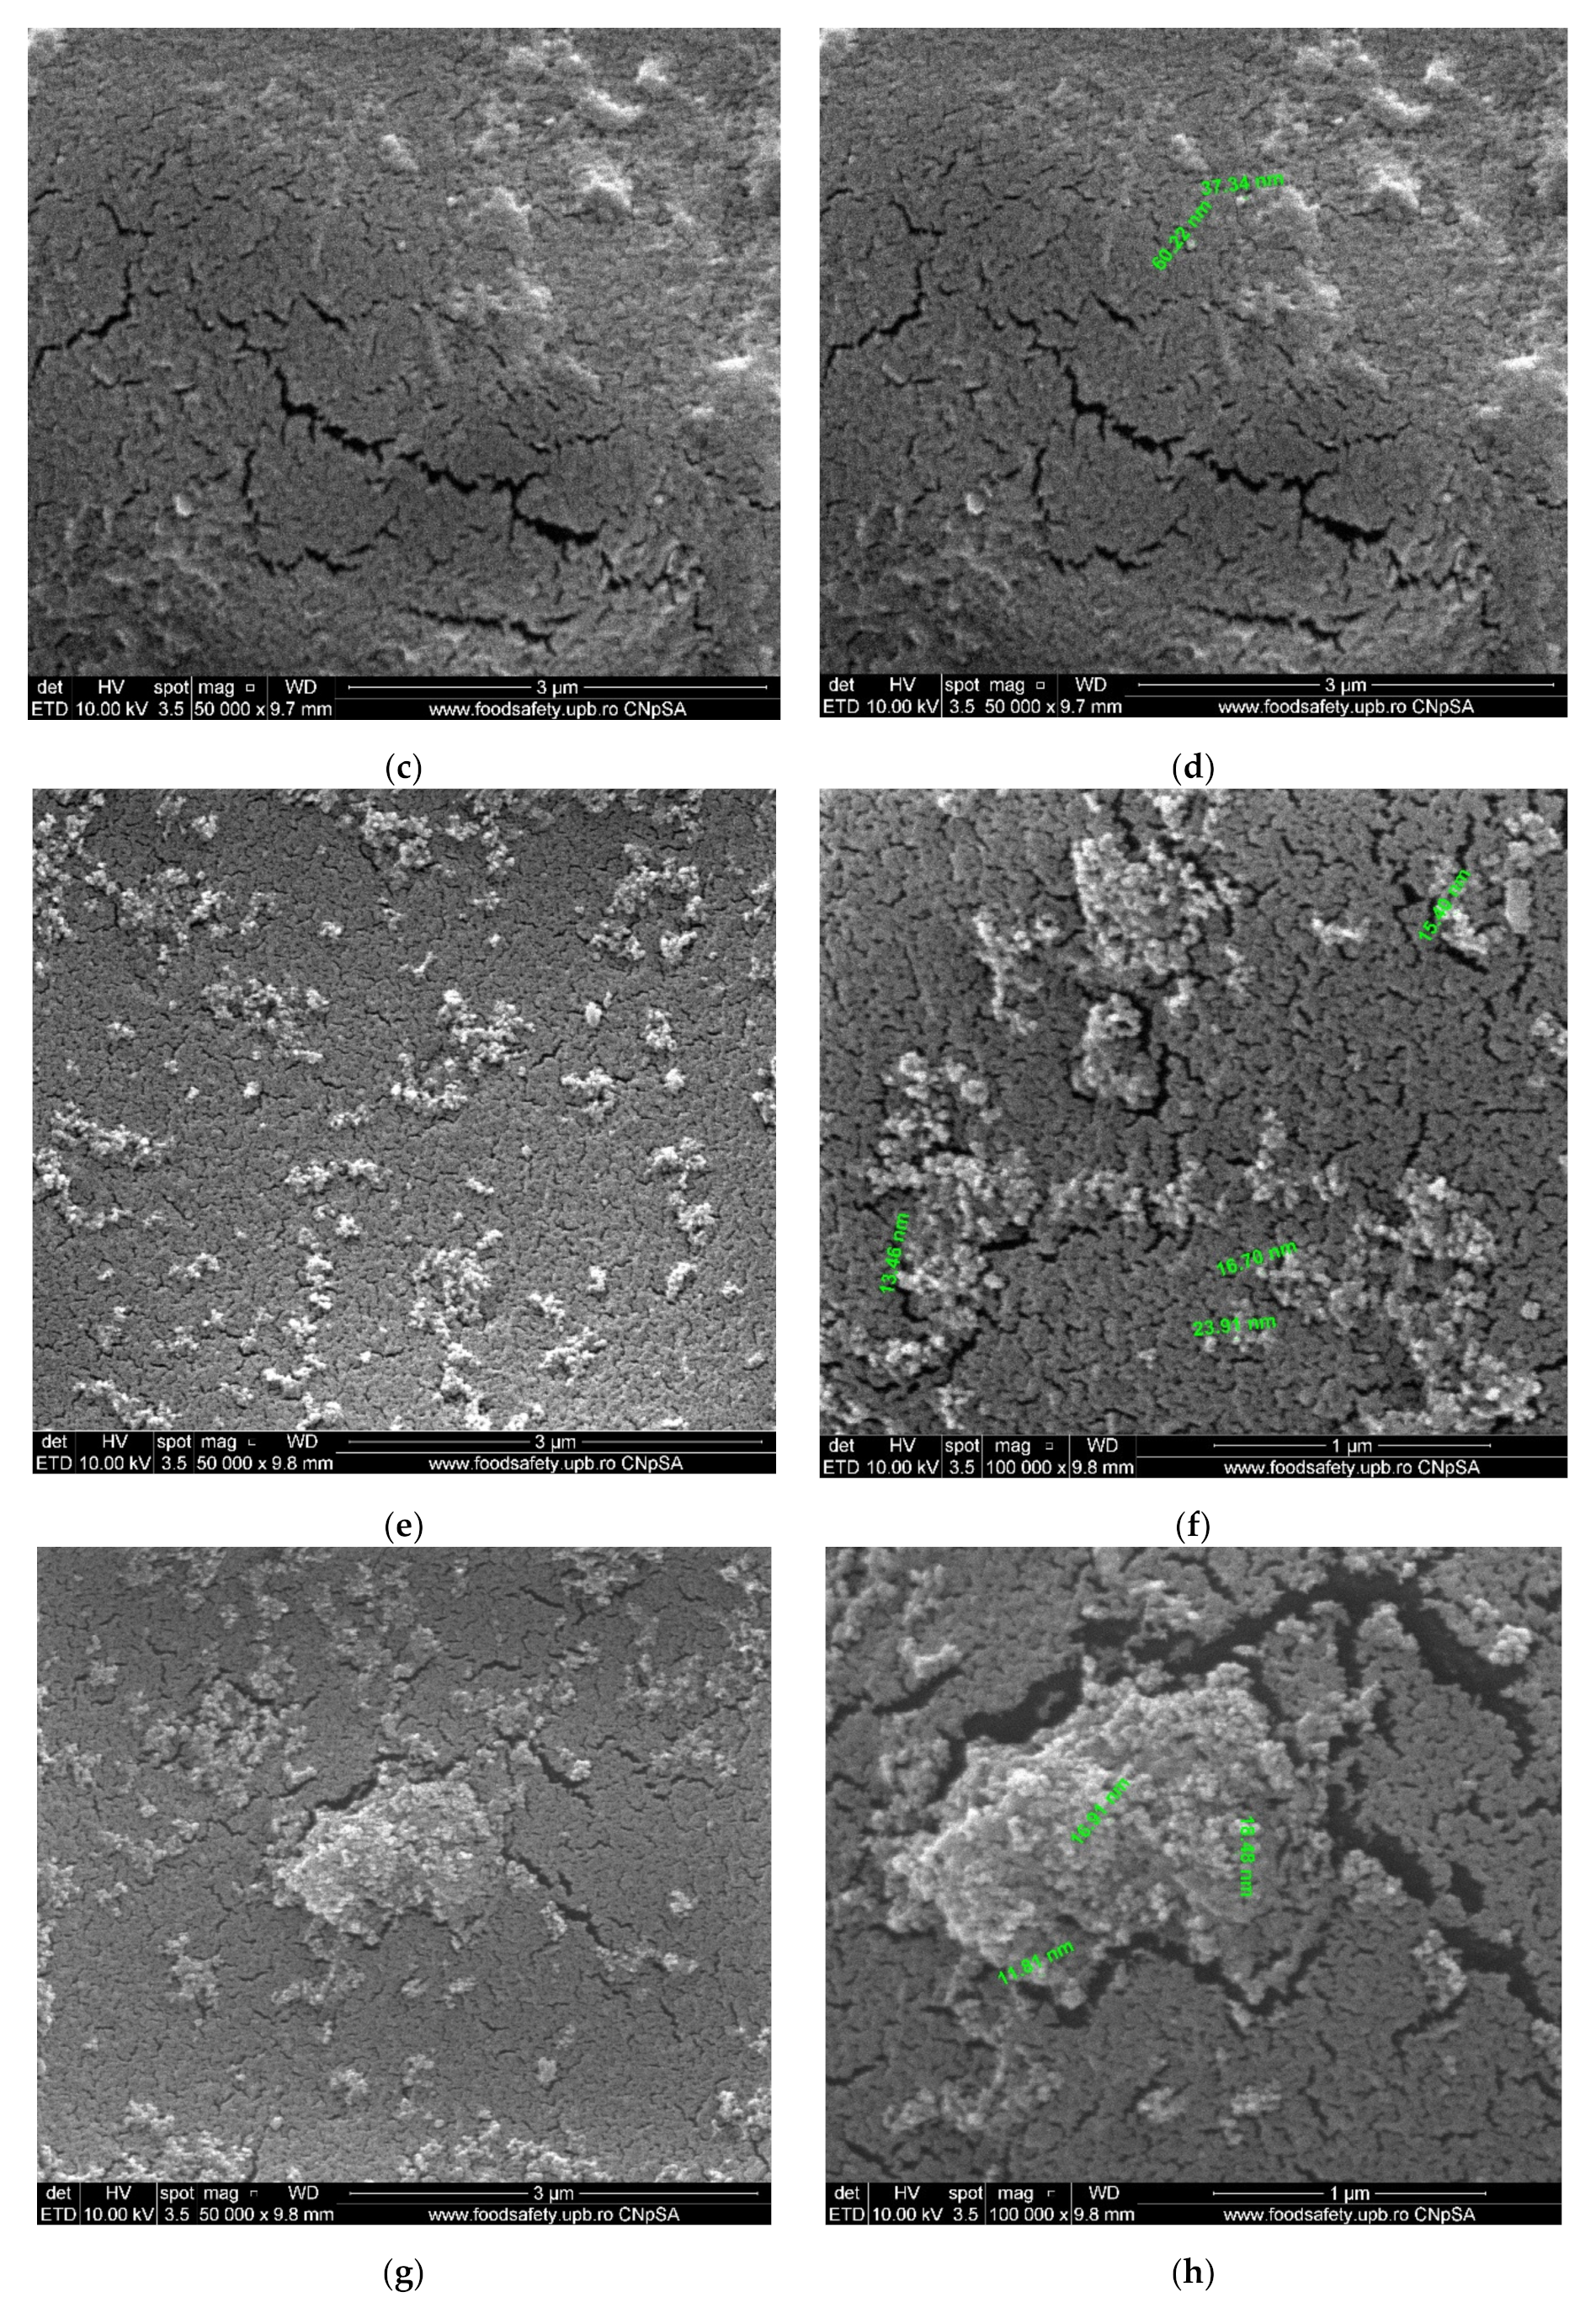
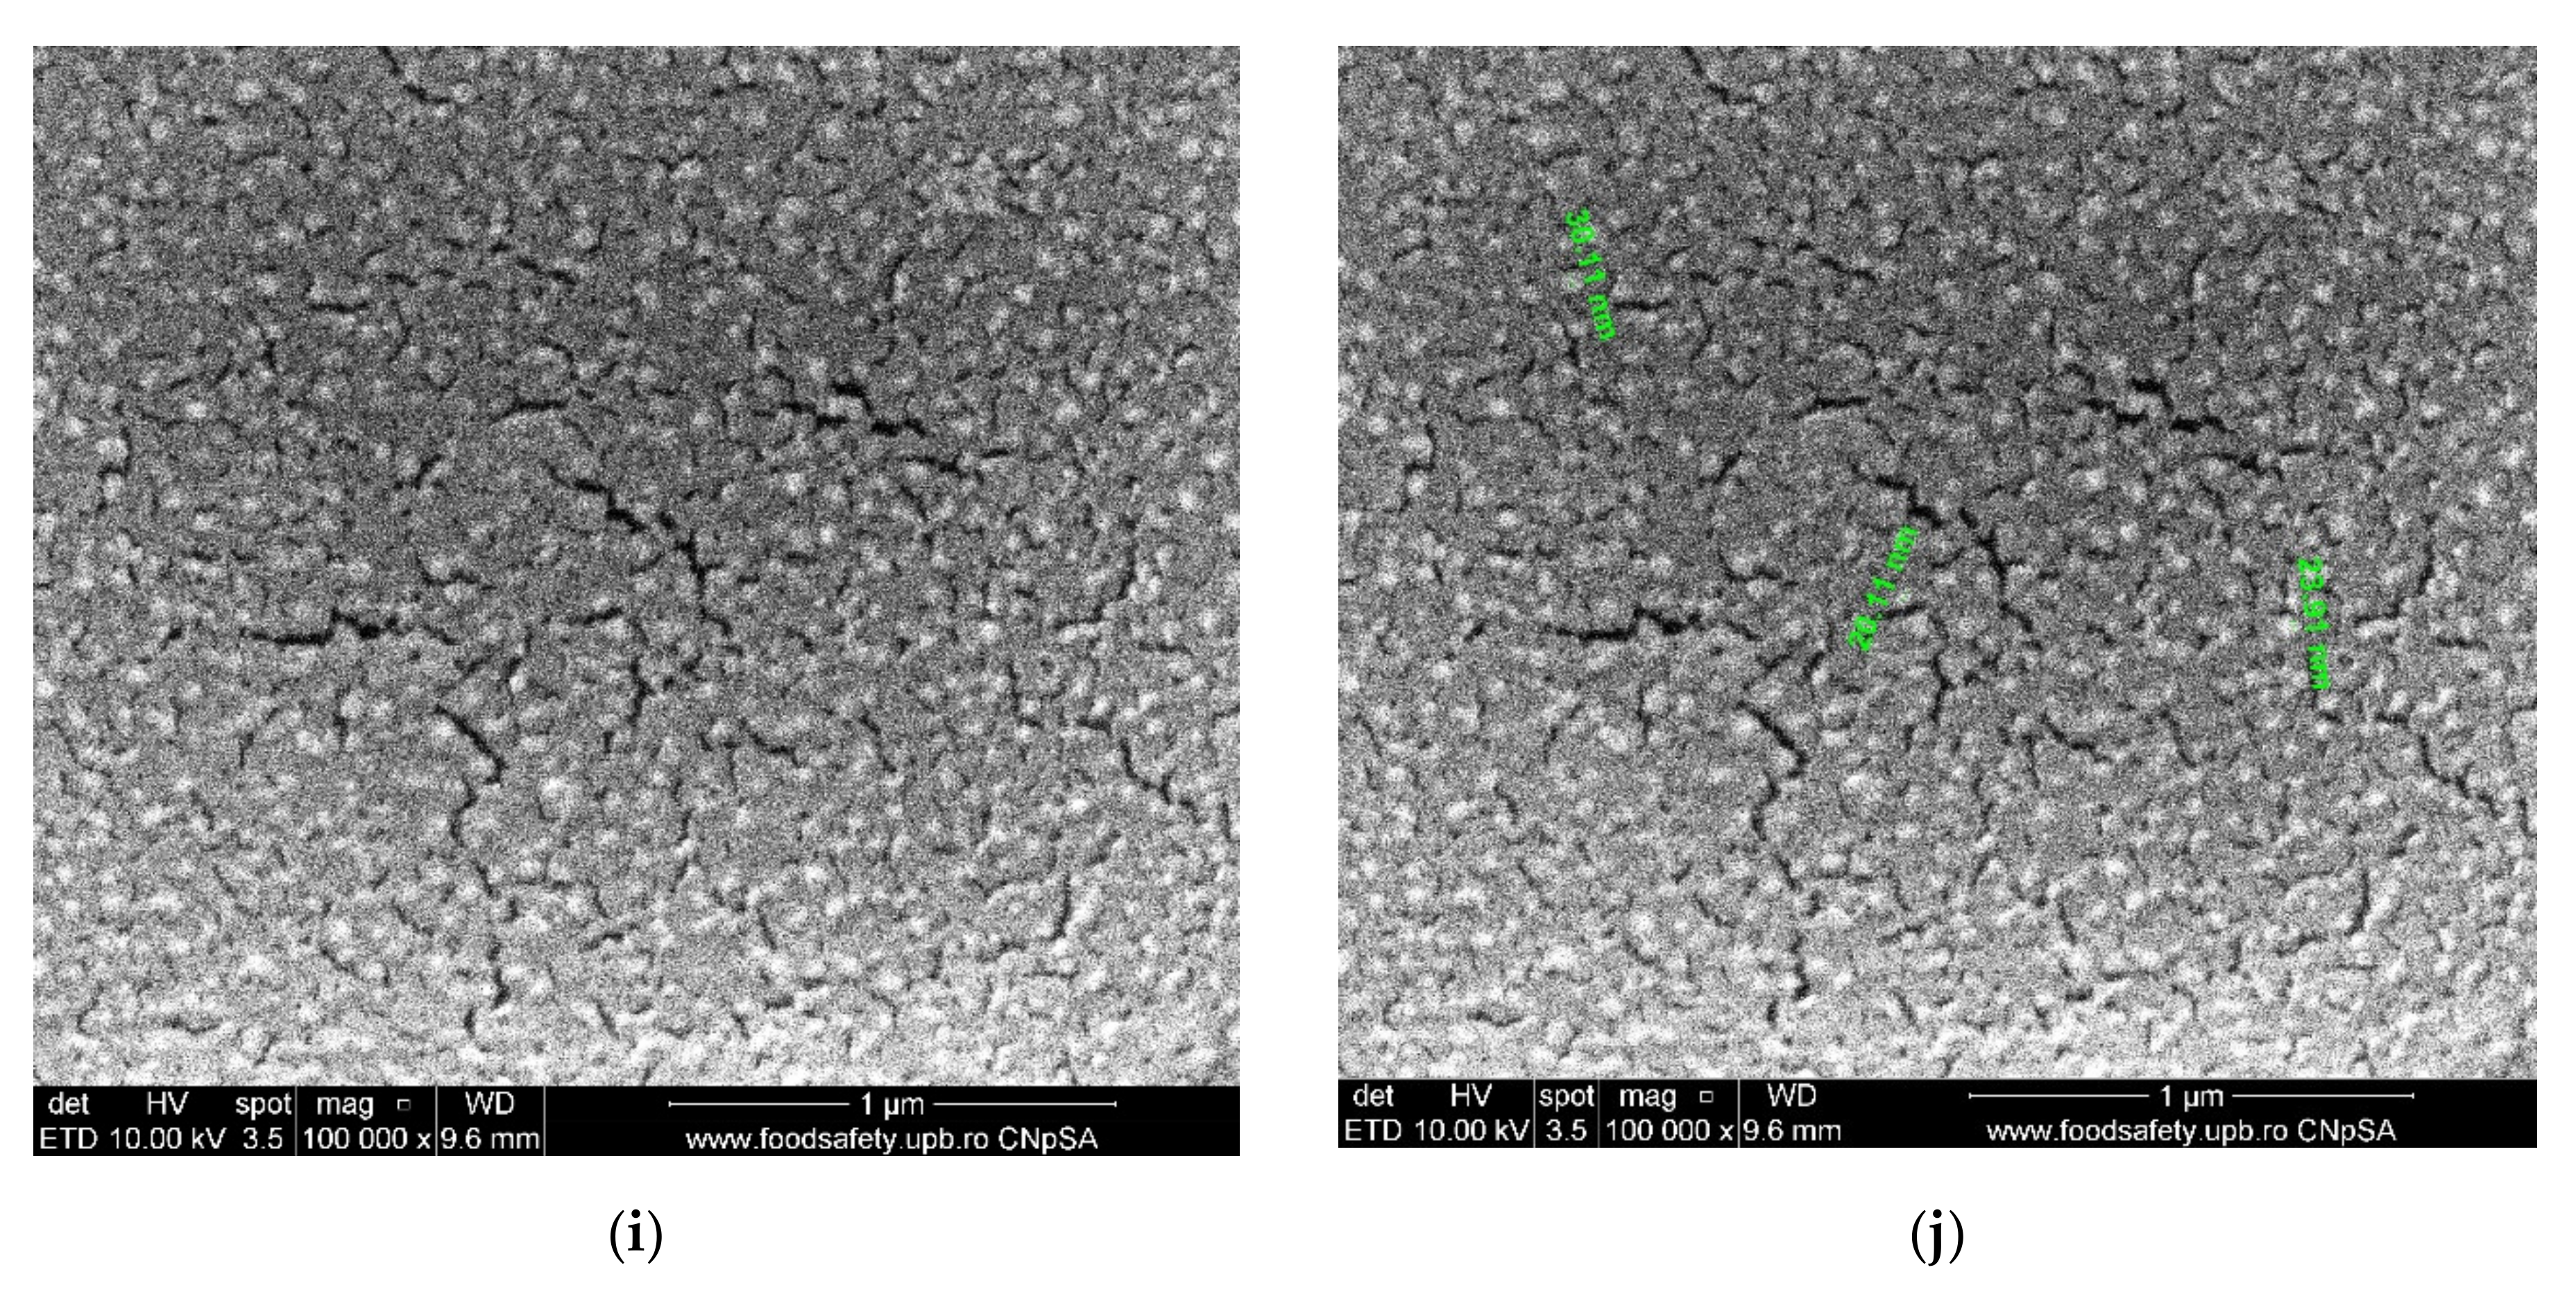
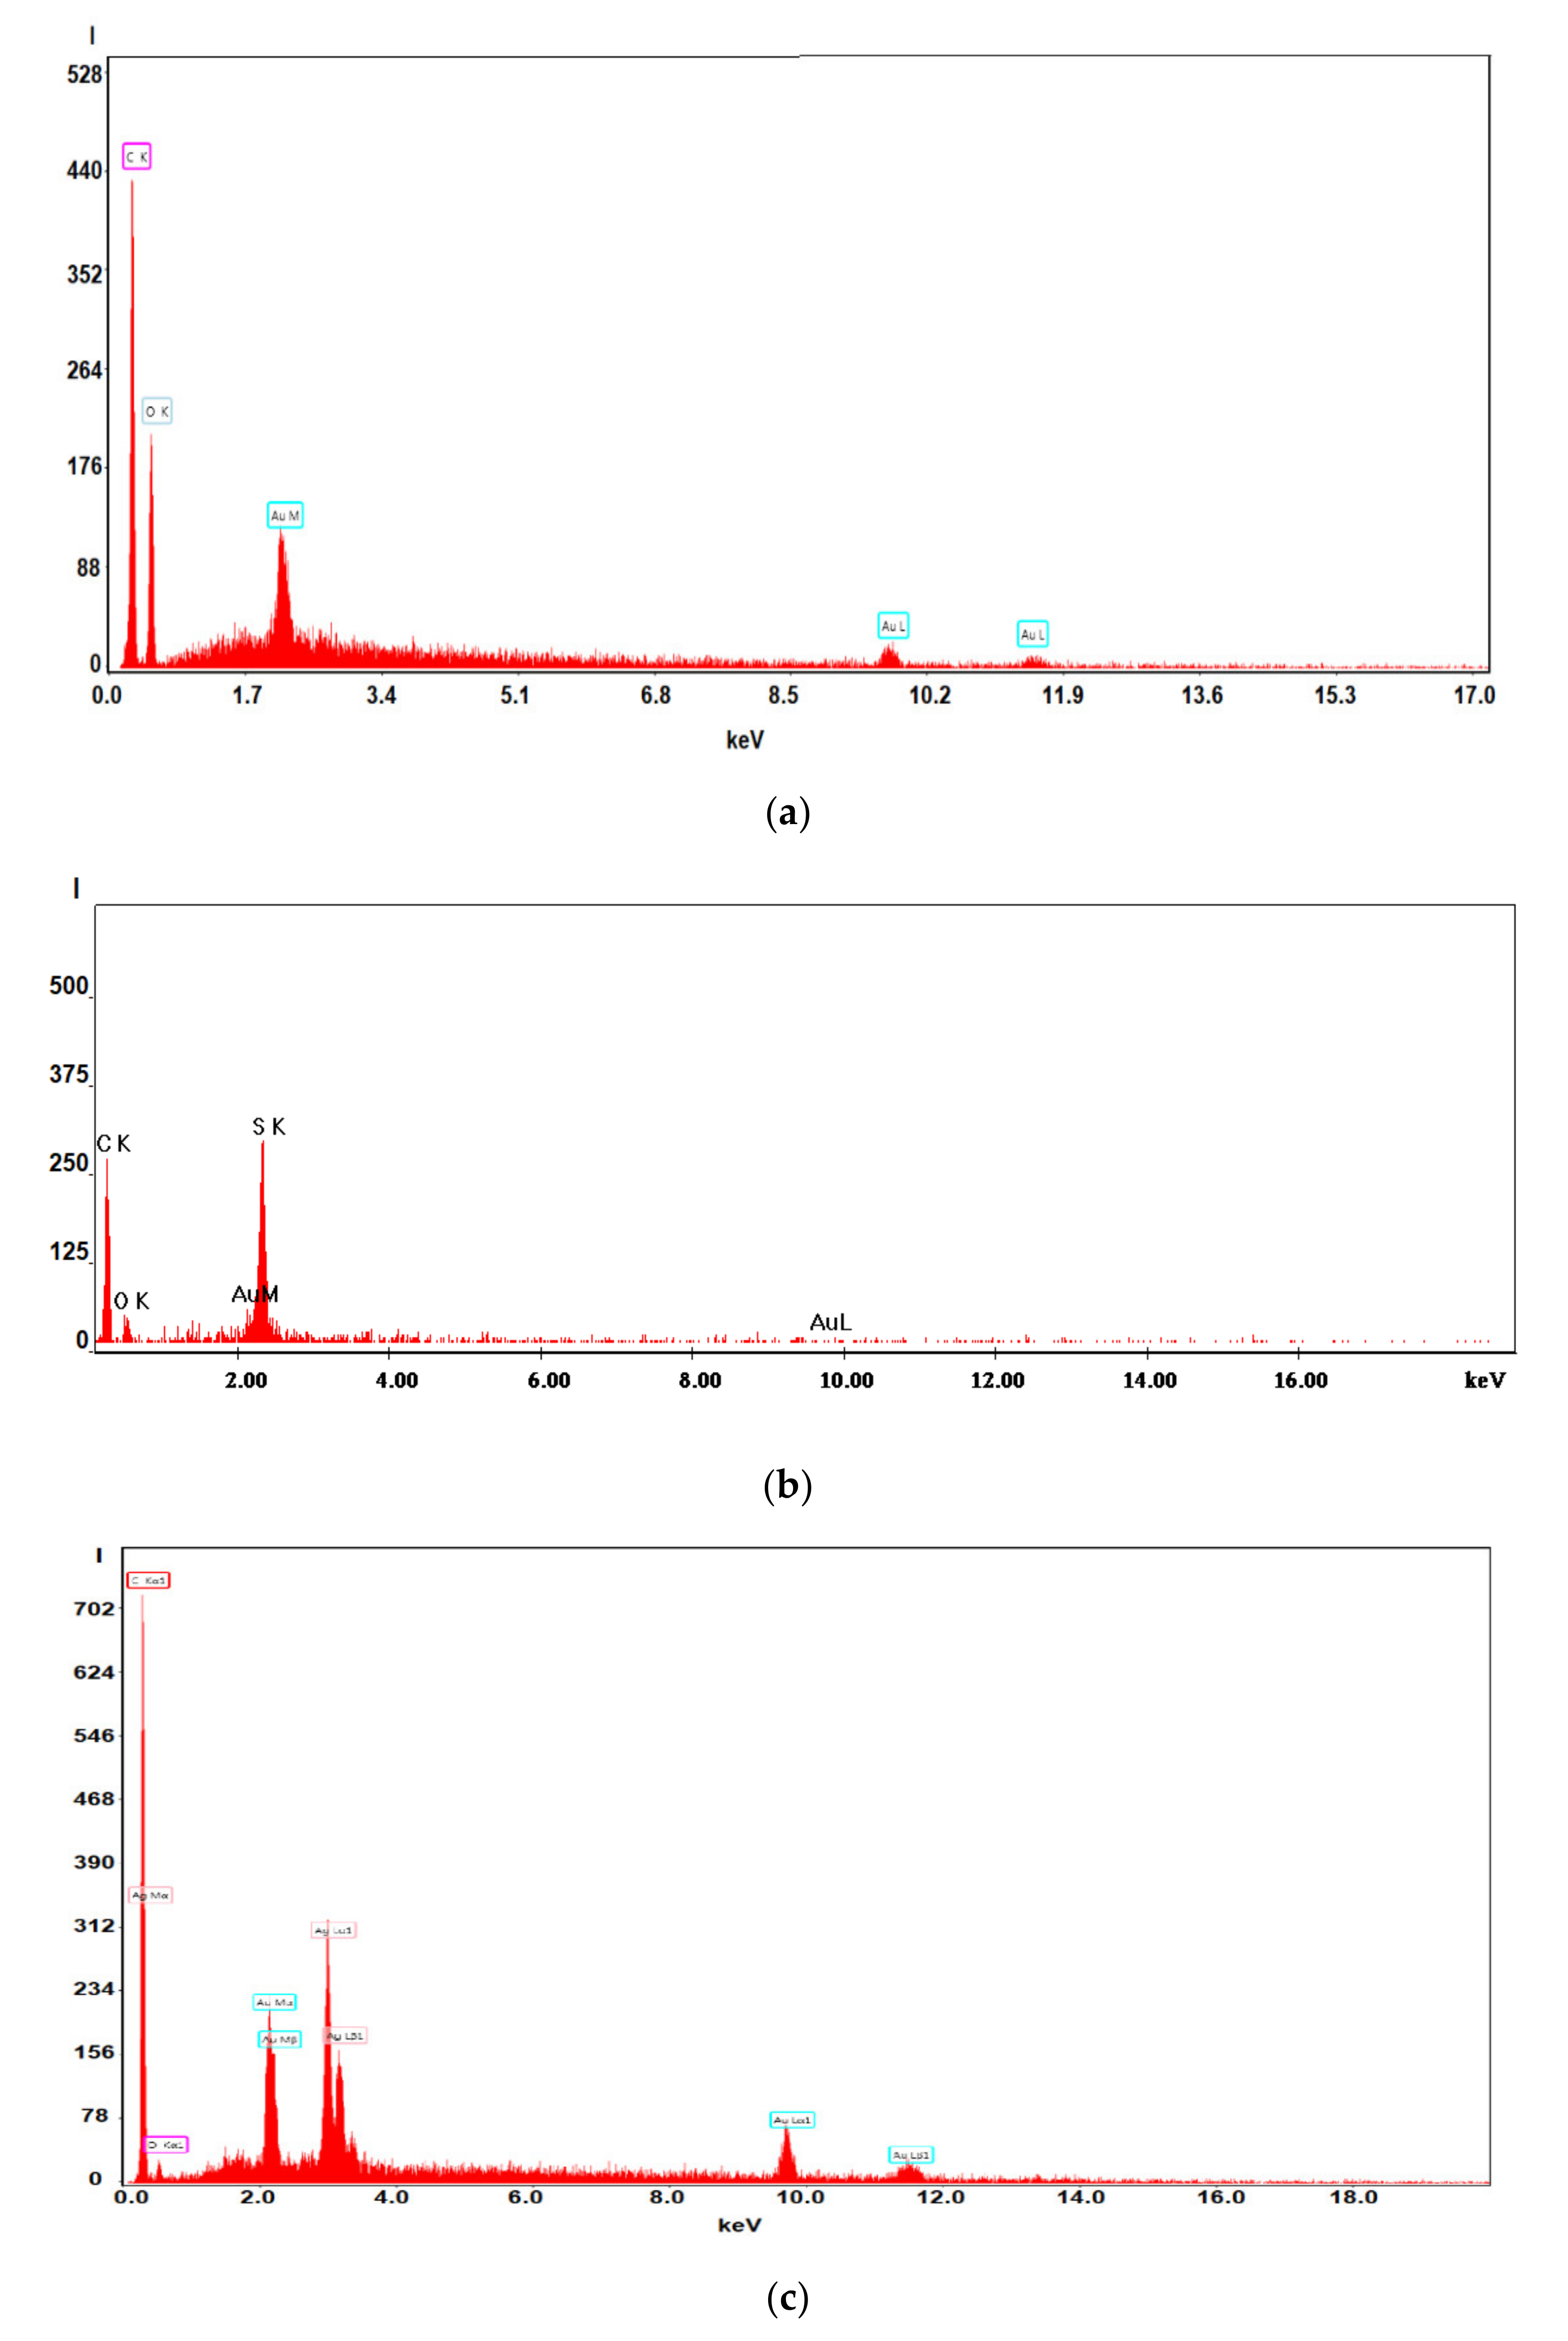
3.1. Scanning Electron Microscopy Studies (SEM and HFSEM and EDAX)
3.1.1. Movie Films (Ag-Cellulose Acetate)
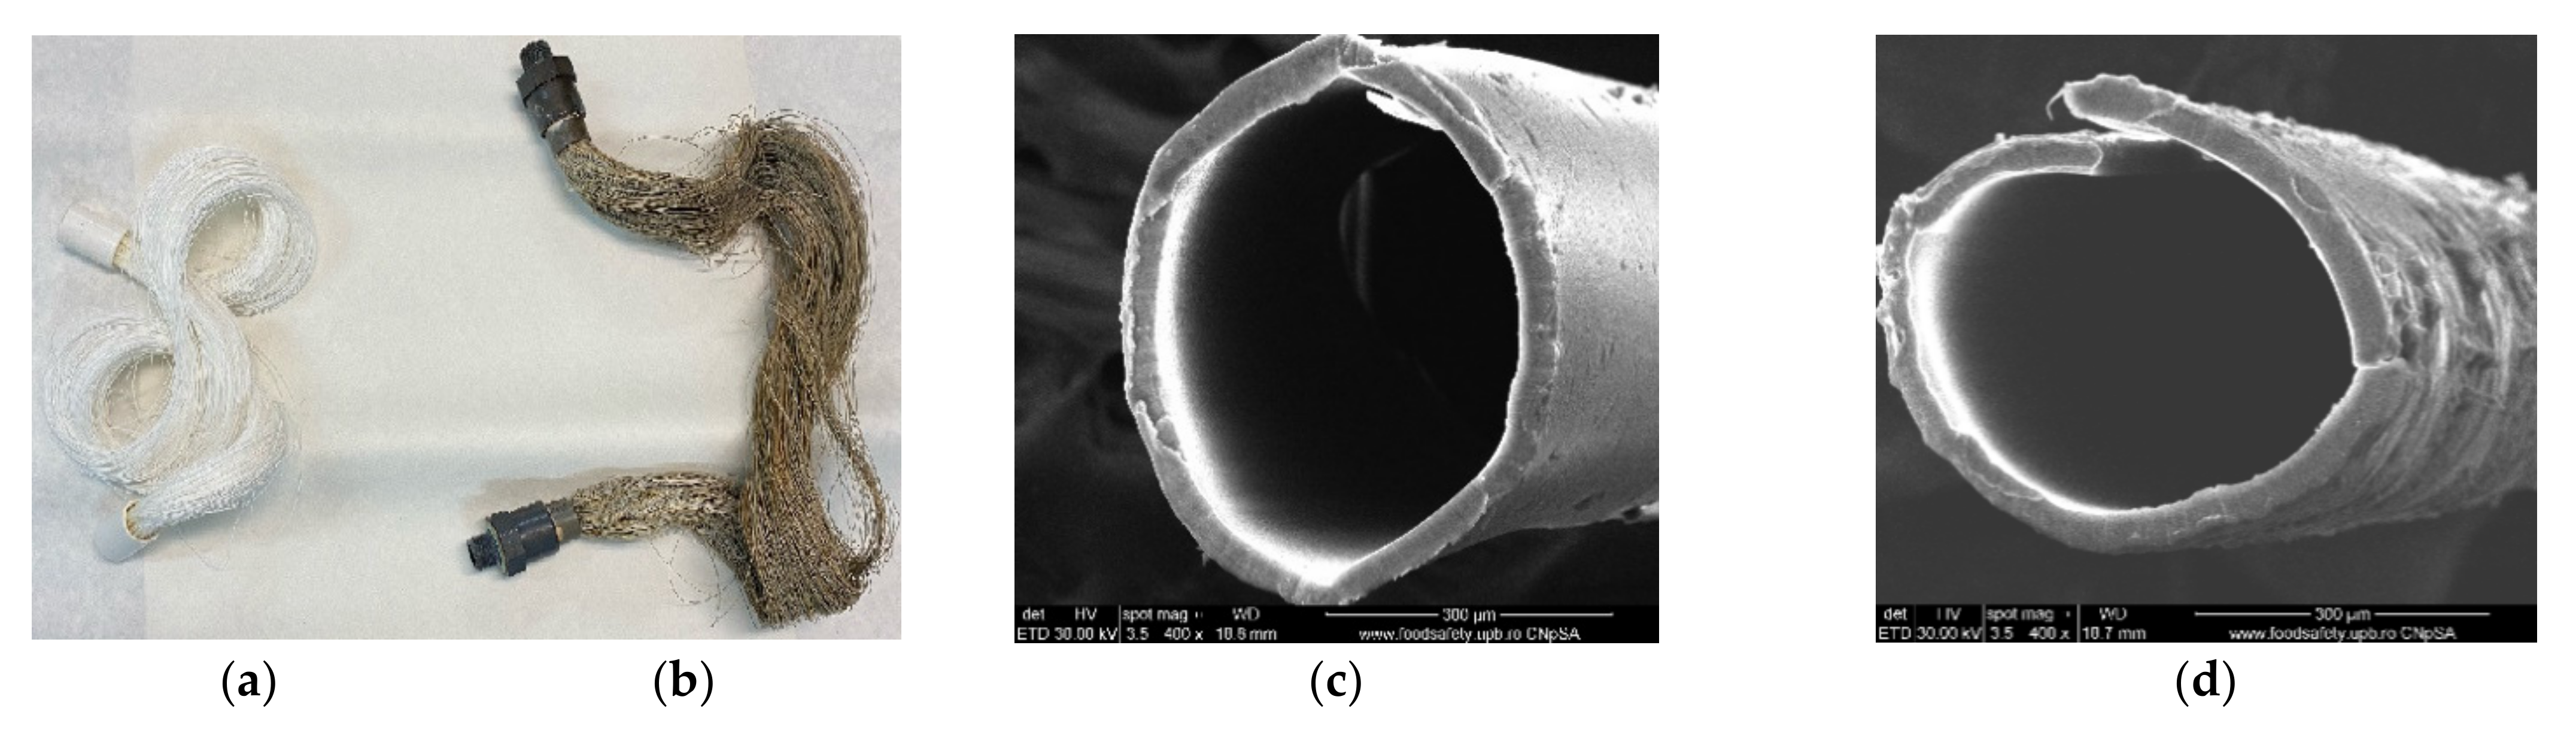
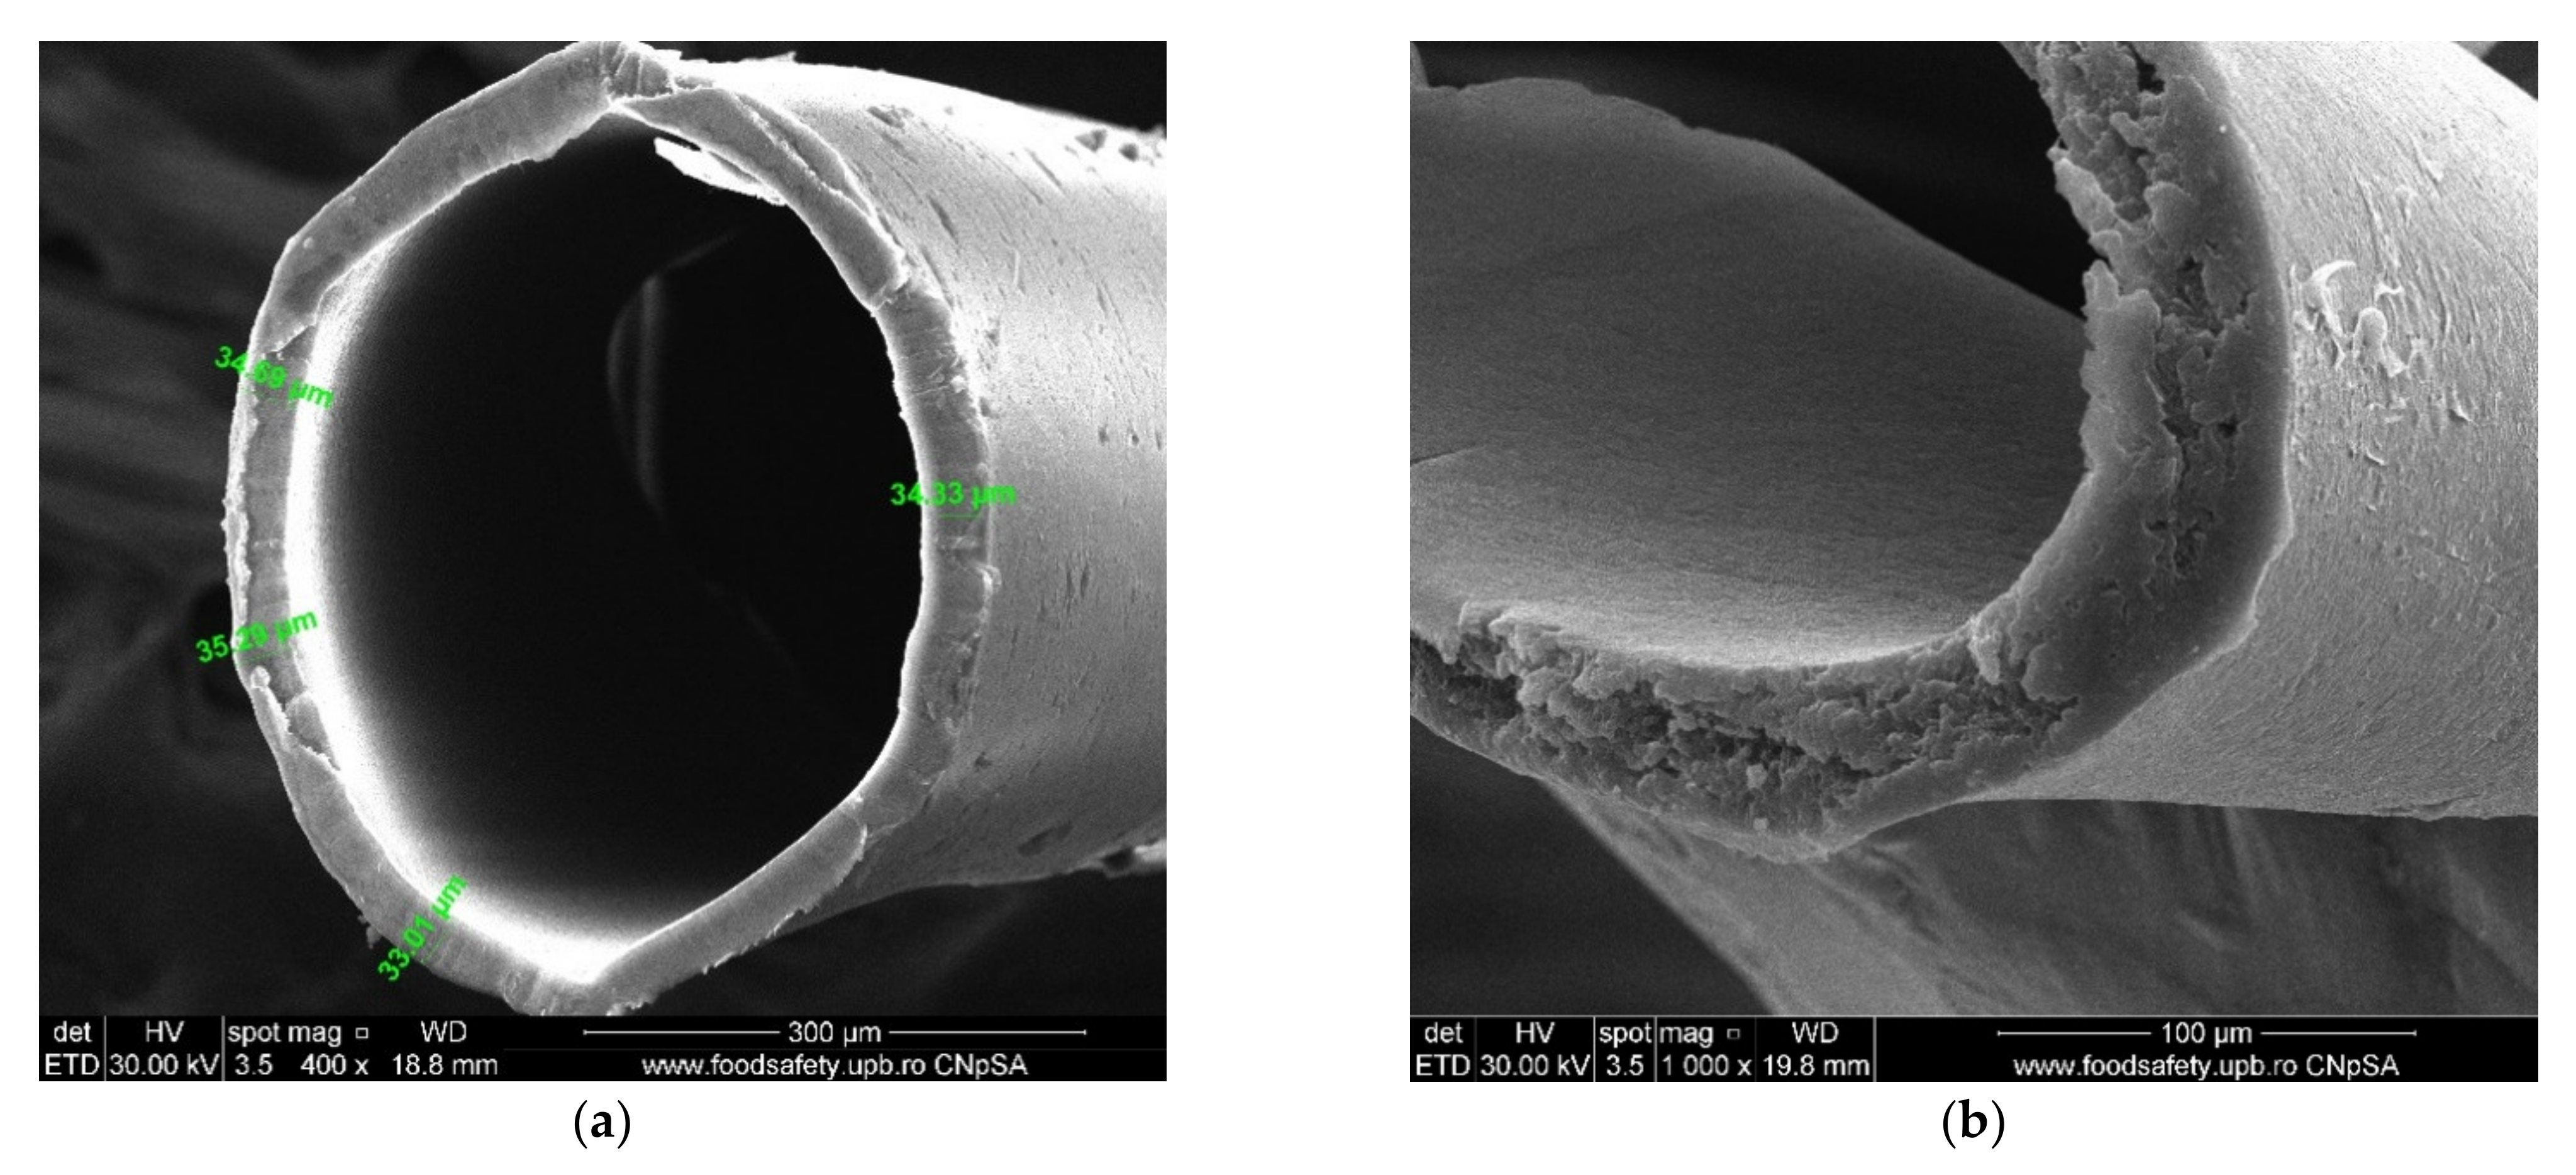
3.1.2. Membrane Characterization
3.2. Thermal Analysis
3.3. FTIR Analysis
3.4. Pollutant Removal Process Performance
4. Discussion
4.1. Membrane Materials Available for Study
4.1.1. Polypropylene Support Membranes
4.1.2. Used Photographic and Cinematographic Films
4.1.3. Membrane Characterization
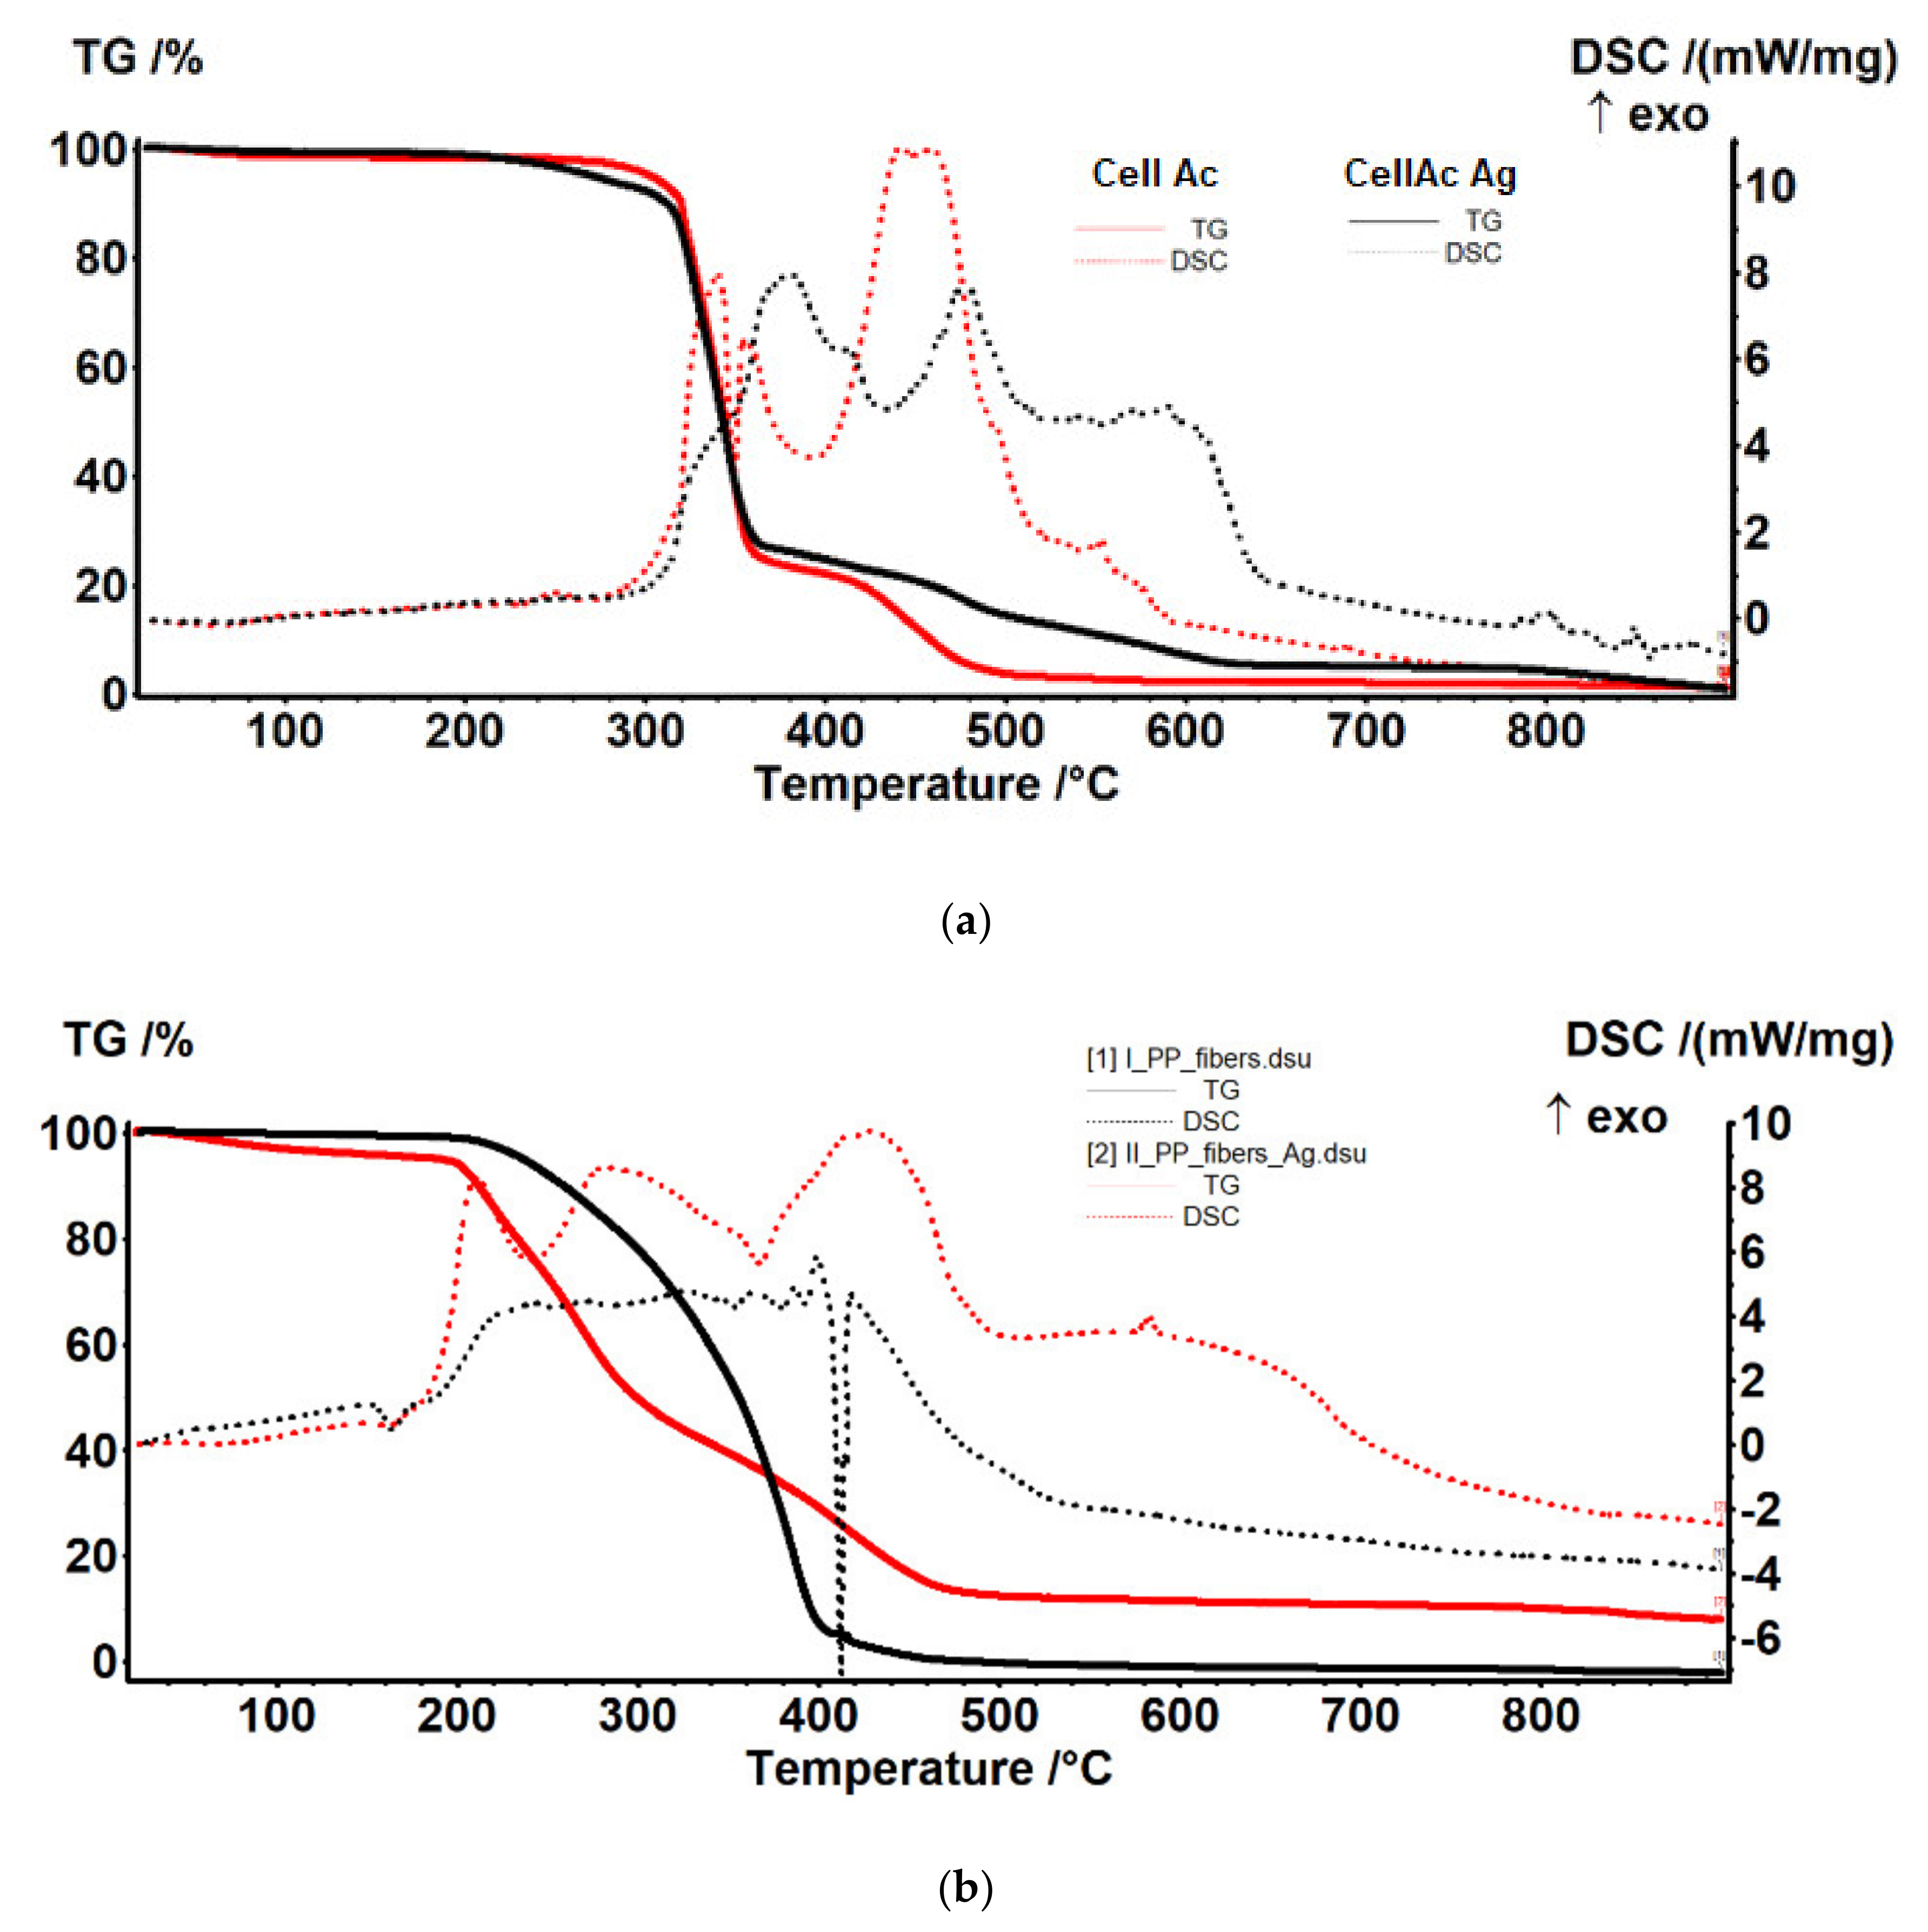
- The polypropylene support test (Figure 18a) was stable up to 200 °C. At 165 °C, an endothermic effect was recorded without weight loss, which corresponded to the melting of PP. After 200 °C the process of oxidative degradation took place, the weight loss recorded up to 410 °C being 93.79%. The process was accompanied by a series of superimposed exothermic effects, with peaks at 328, 364, or 399.1 °C. After the degradative oxidation, the carbon residue was burned during an exothermic process with a maximum value of 418 °C.
- The fibers impregnated with silver (Figure 18b) suffered a weight loss of 5.27% up to 195 °C (probably due to a precursor with which they were impregnated). The melting point was only 161 °C, lower than that of the impregnated fibers. The oxidative degradation started at 195 °C so that at 500 °C the sample lost 82.32% of its weight. The process was accompanied by three broad, intense, and partially overlapping exothermic effects, with peaks at 210.8, 282.2, and 430.9 °C. The carbon residue was burned after 500 °C, the process being accompanied by a wide exothermic effect, with a maximum value of 584.5 °C.

4.2. Removal of Foul-Smelling Pollutants
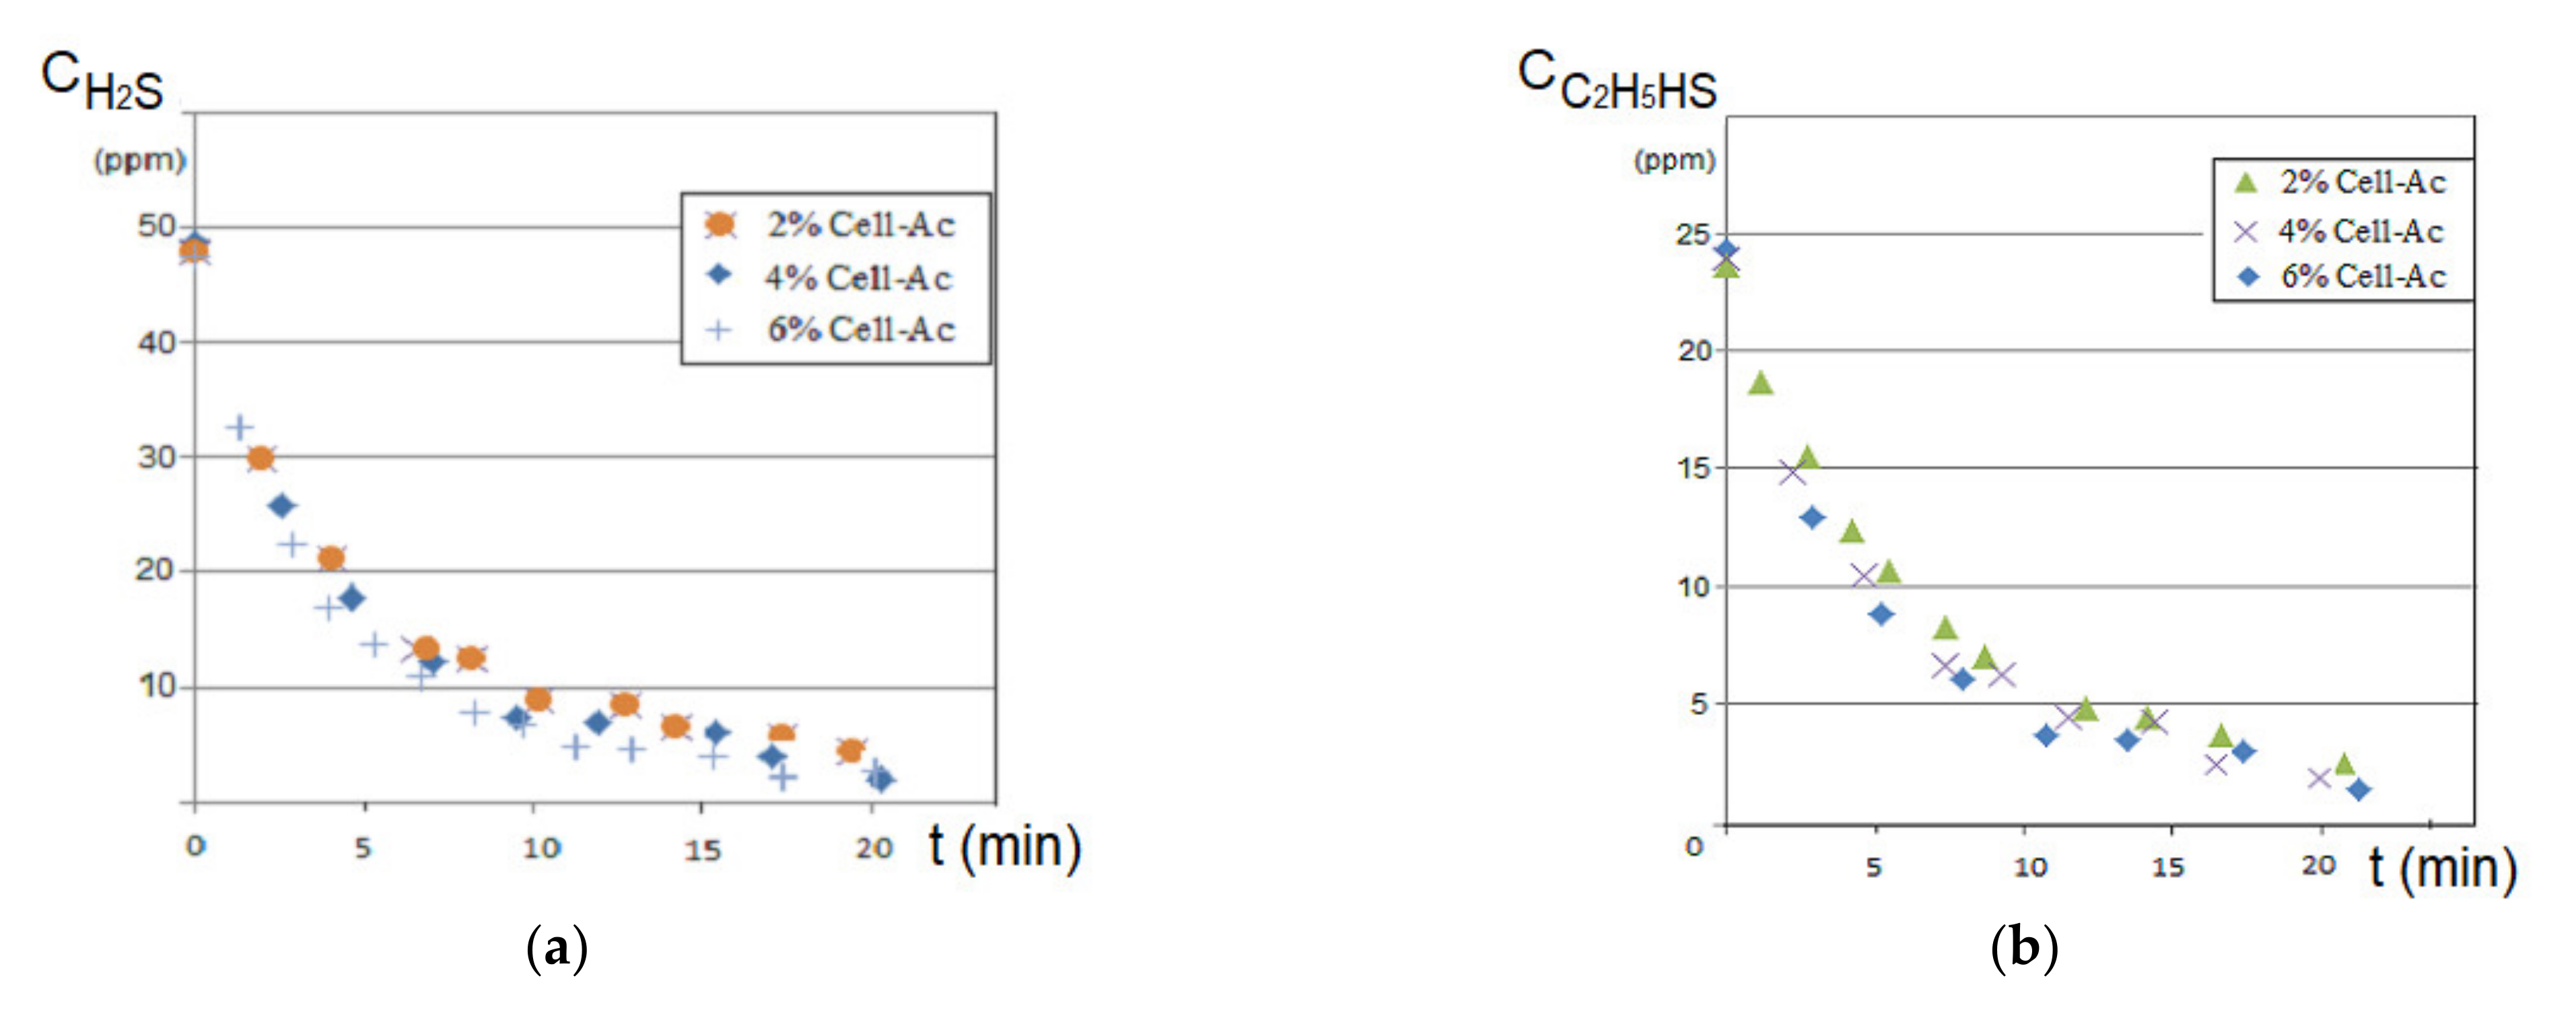
4.2.1. Removal of Hydrogen Sulfide and Ethanethiol from Synthetic Source Phases
4.2.2. The Influence of the Initial Cellulose Acetate Concentration
4.2.3. Influence of Recirculation Flow and Electrolyte Concentration (NaCl) for the Source Phase
- pH of the source phase: 5;
- pH of the receiving phase: 12;
- initial hydrogen sulfide concentration: 50 ppm;
- electrolyte concentration (NaCl): 6%;
- the initial concentration of the cellulose acetate solution: 6% (for Ag-Cell-Ac-PPM);
- the recirculation flow of the source phase: 15 L/min;
- receiving phase flow: 0.25 L/min.
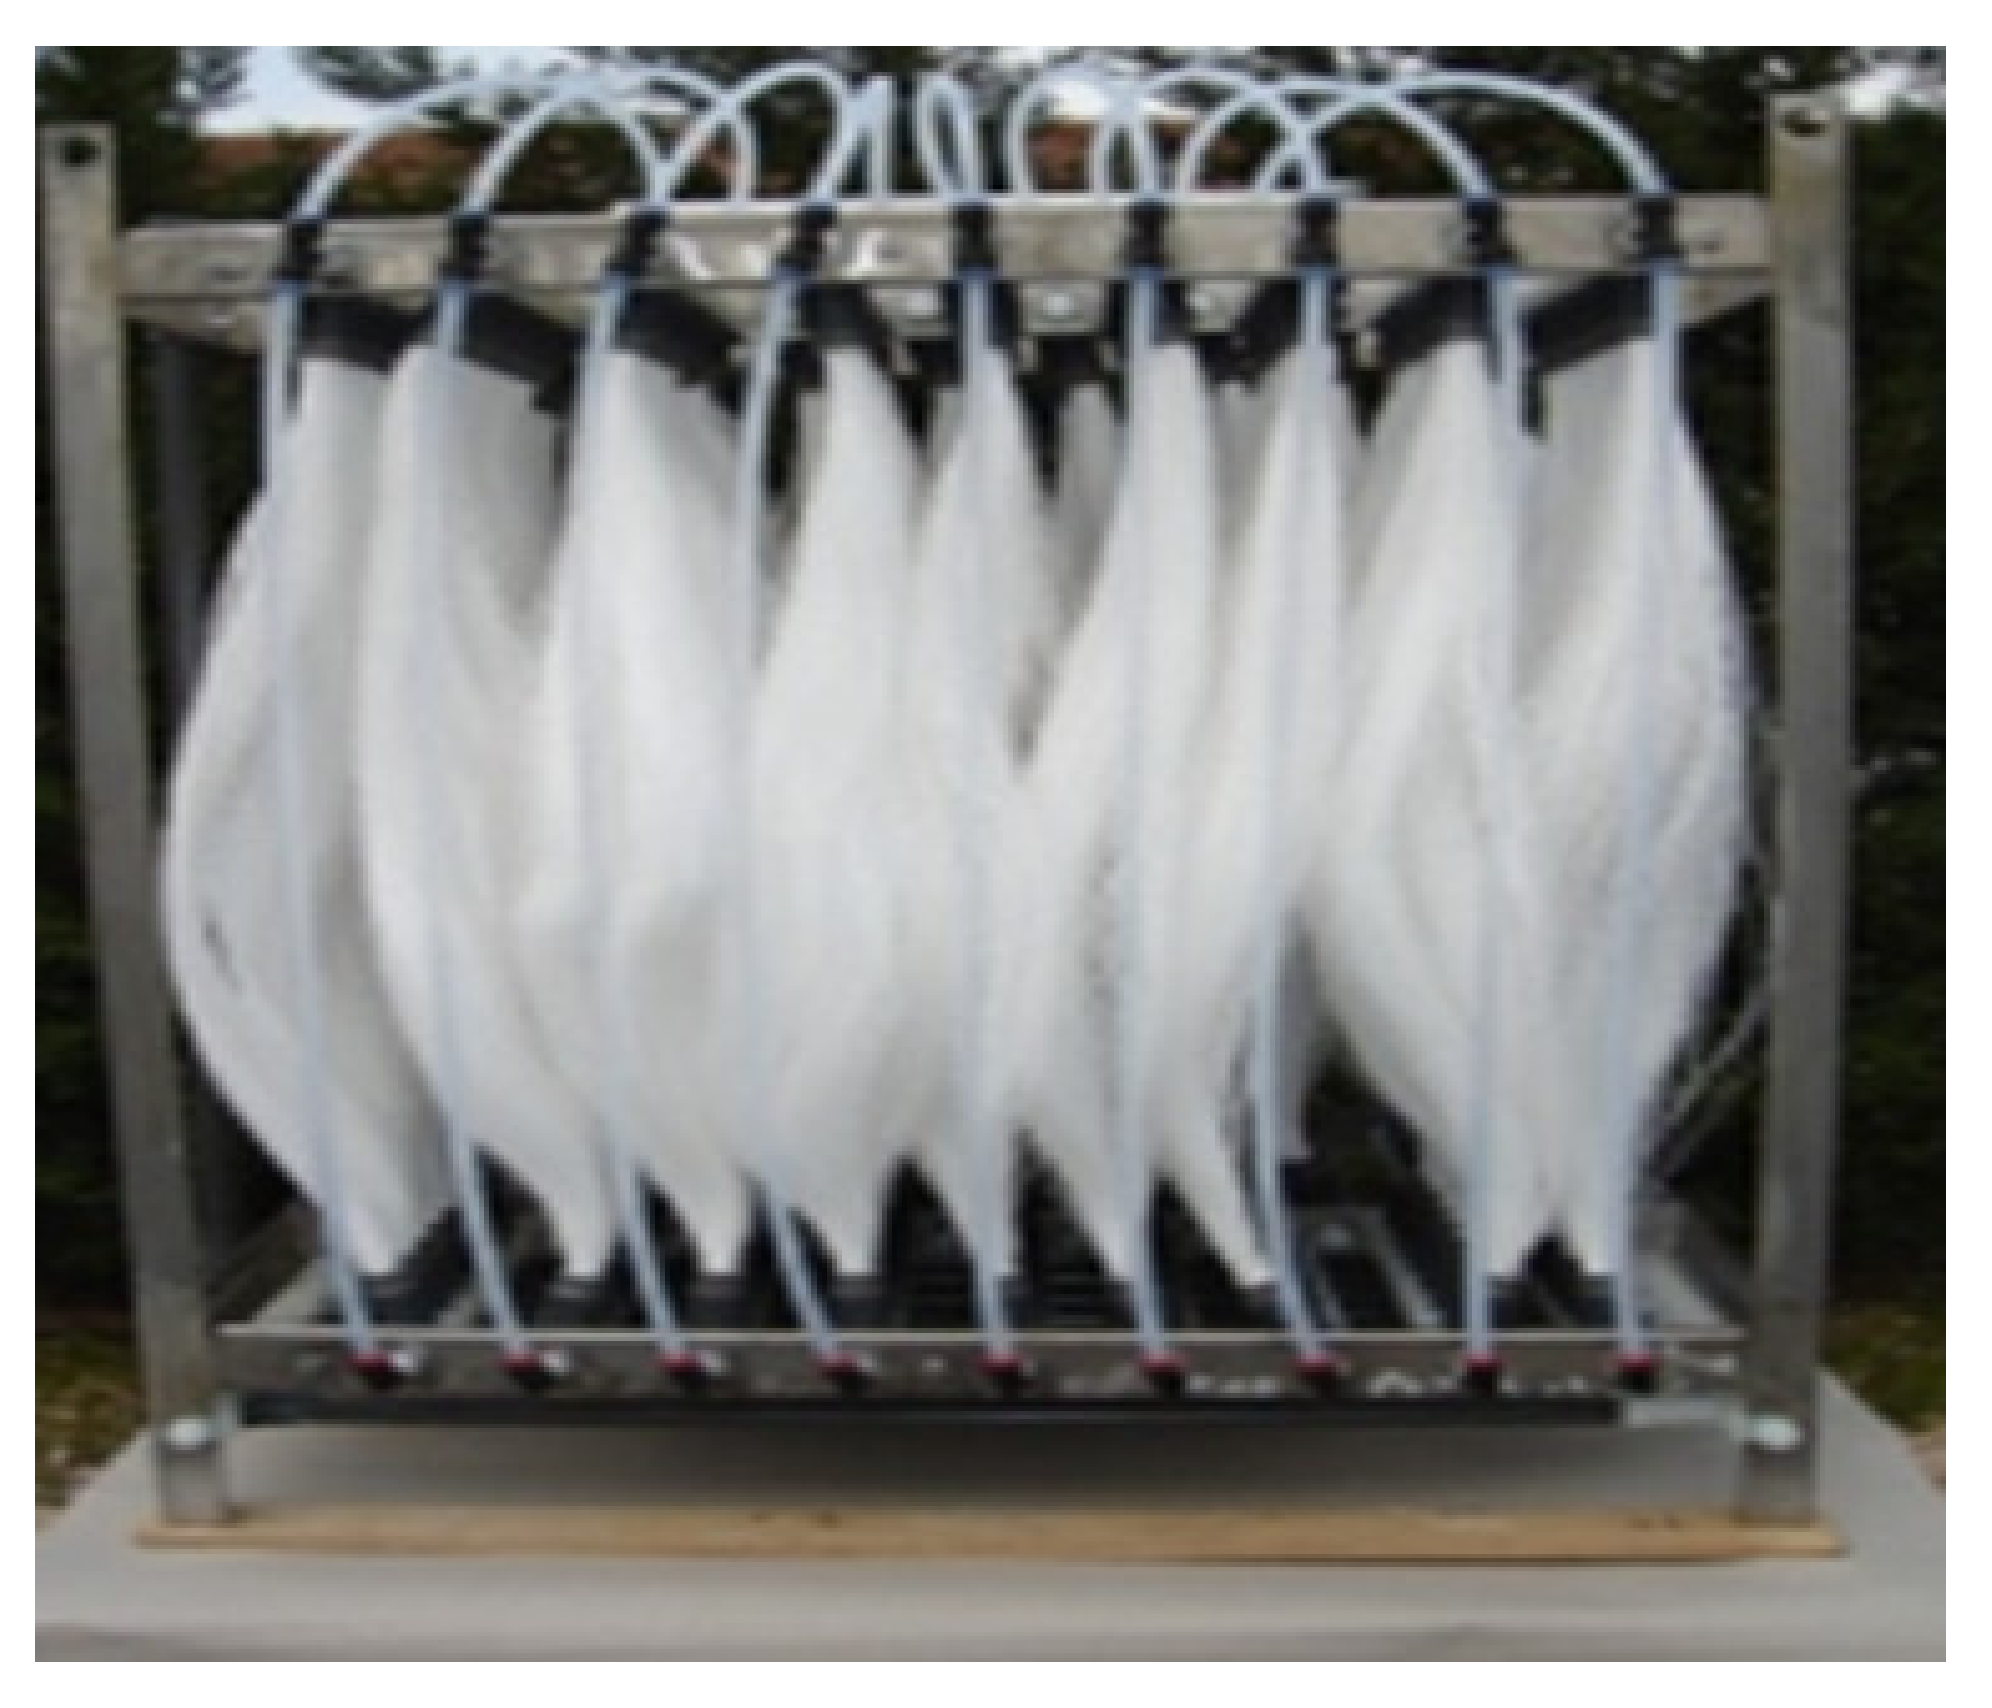
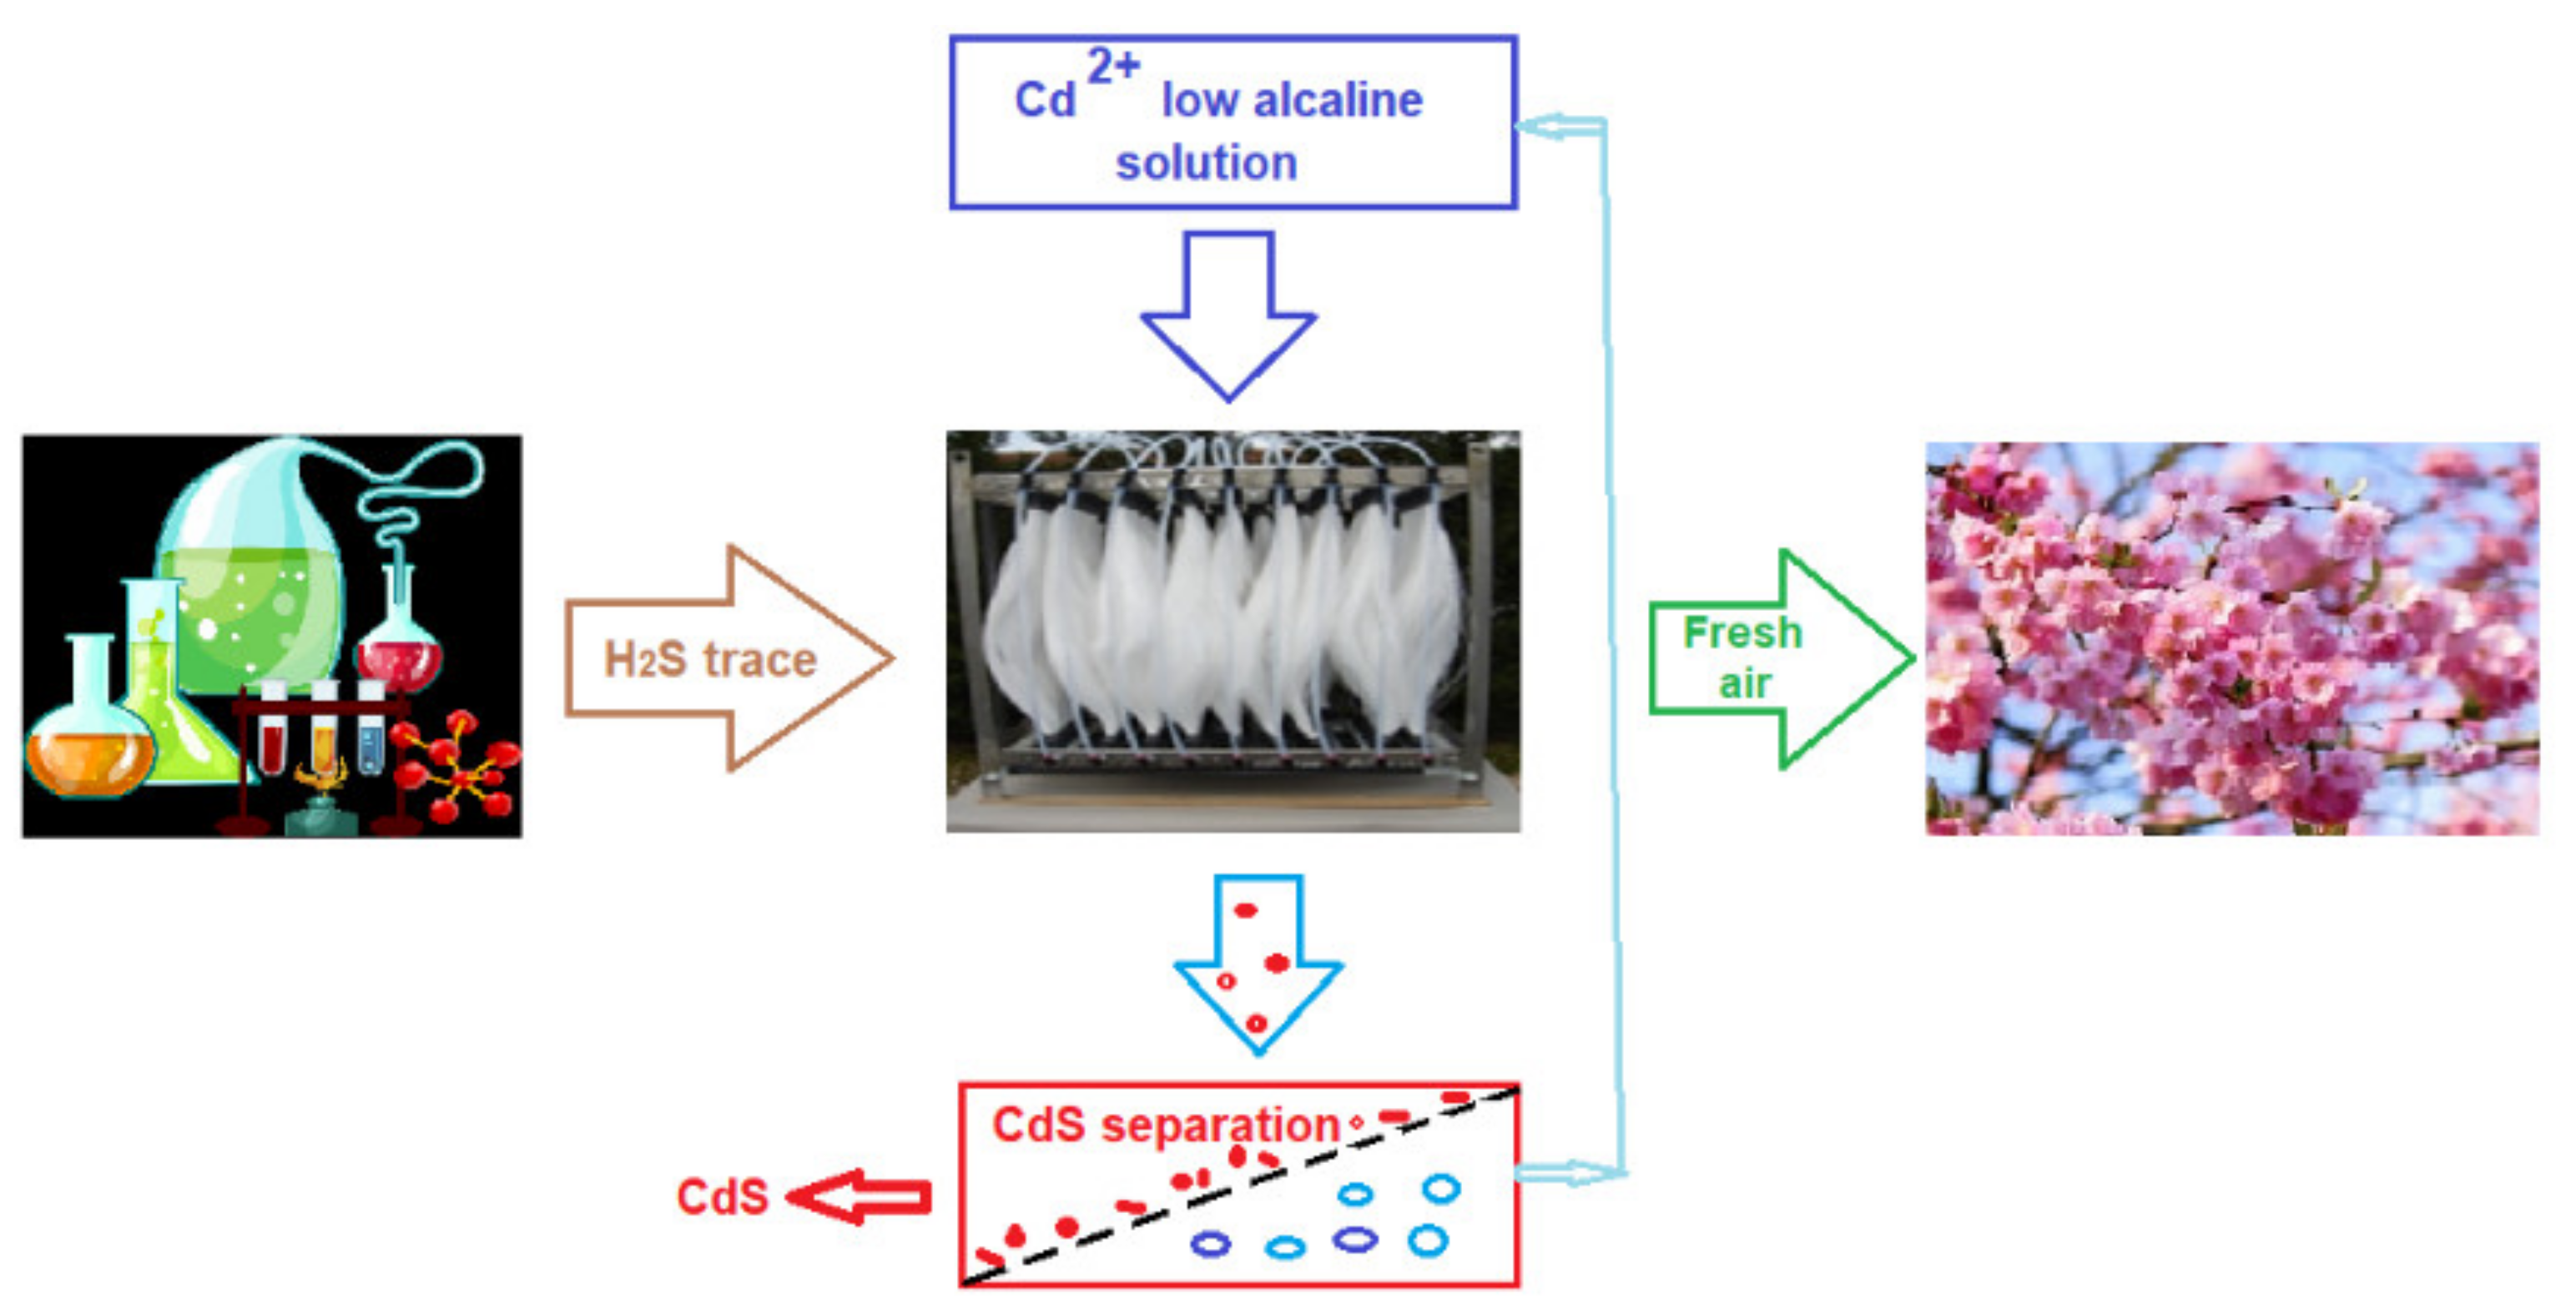
4.2.4. Initial Tests for Retaining Odor—Generating Pollutants at Pilot Level
5. Conclusions
Author Contributions
Funding
Institutional Review Board Statement
Informed Consent Statement
Acknowledgments
Conflicts of Interest
References
- Katz, M. Atmospheric pollution: A growing problem in public health. AJPH 1955, 45, 298–305. [Google Scholar] [CrossRef] [PubMed]
- Beck, J.F.; Cormier, F.; Donini, J.C. The combined toxicity of ethanol and hydrogen sulfide. Toxicol. Lett. 1979, 3, 311–313. [Google Scholar] [CrossRef]
- Layton, D.W.; Cederwall, R.T. Assessing and managing the risks of accidental releases of hazardous gas: A case study of natural gas wells contaminated with hydrogen sulfide. Environ. Int. 1986, 12, 519–532. [Google Scholar] [CrossRef]
- Alfonsin, C.; Lebrero, R.; Estrada, J.M.; Munoz, R.; Kraakman, N.J.R.; Feijo, G.; Moreira, M.T. Selection of odour removal technologies in wastewater treatment plants: A guideline based on life cycle assessment. Environ. Manag. 2015, 149, 77–84. [Google Scholar] [CrossRef] [PubMed]
- Manisalidis, I.; Stavropoulou, E.; Stavropoulos, A.; Bezirtzoglou, E. Environmental and Health Impacts of Air Pollution: A Review. Front. Public Health 2020, 8, 14. [Google Scholar] [CrossRef] [PubMed] [Green Version]
- Prada, M.; Prada, I.F.; Cristea, M.; Popescu, D.; Bungau, C.; Aleya, L.; Bungău, C.C. New solutions to reduce greenhouse gas emissions through energy efficiency of buildings of special importance—Hospitals. Sci. Total Environ. 2020, 718, 137466. [Google Scholar] [CrossRef] [PubMed]
- Bungau, C.C.; Prada, I.F.; Prada, M.; Bungau, C. Design and operation of construction: A healthy living environment-parametric studies and new solutions. Sustainability 2019, 11, 6824. [Google Scholar] [CrossRef] [Green Version]
- Li, F.; Liu, Y.; Lü, J.; Liang, L.; Harmer, P. Ambient air pollution in China poses a multifaceted health threat to outdoor physical activity. J. Epidemiol. Community Health 2015, 69, 201–204. [Google Scholar] [CrossRef] [Green Version]
- Portney, P.R. Air pollution policy. In Public Policies for Environmental Protection; Routledge: Abingdon, UK, 1990; pp. 13–125. [Google Scholar]
- Robinson, E.; Robbins, R.C. Gaseous sulfur pollutants from urban and natural sources. J. Air Pollut. Control Assoc. 1970, 20, 233–235. [Google Scholar] [CrossRef]
- Schnelle, K.B., Jr.; Dunn, R.F.; Ternes, M.E. Pollutant Removal Processes. In Air Pollution Control Technology Handbook; CRC Press: Boca Raton, FL, USA, 2016; Chapter 10; Volume 429 + xxvi pages, pp. 119–125. ISBN 9781138747661. [Google Scholar]
- Edelman, S. The Law of Federal Air Pollution Control. J. Air Pollut. Control Assoc. 1966, 16, 523–525. [Google Scholar] [CrossRef]
- Schiffman, S.S.; Williams, C.M. Science of Odor as a Potential Health Issue. J. Environ. Qual. 2005, 34, 129–138. [Google Scholar] [CrossRef] [PubMed]
- Bergen, J.V. Industrial Odor Control. J. Air Pollut. Control Assoc. 1958, 8, 101–111. [Google Scholar] [CrossRef] [Green Version]
- Ryltseva, Y.; Orlov, V. Measures to prevent sewerage odor emissions into the atmosphere. IOP Conf. Ser. Mater. Sci. Eng. 2020, 869, 042002. [Google Scholar] [CrossRef]
- Borisenko, A.V.; Gazaliev, A.M. Method for cleaning industrial gases from harmful impurities in a high-intensity electric field. J. Chem. Chem. Technol. 2006, 49, 118–119. [Google Scholar]
- Midha, V.; Dey, A. Biological treatment of tannery wastewater for sulfide removal. Int. J. Chem. Sci. 2008, 6, 472–486. [Google Scholar]
- Liu, Y.; Wu, C.; Zhou, X.; Zhu, D.Z.; Shi, H. Sulfide elimination by intermittent nitrate dosing in sewer sediments. J. Environ. Sci. 2015, 27, 259–265. [Google Scholar] [CrossRef]
- Li, J.; Ma, X.; Qu, G.; He, K. Efficient purification of hydrogen sulfide by synergistic effects of electrochemical and liquid phase catalysis. J. Sep. Pur. 2019, 218, 43–50. [Google Scholar] [CrossRef]
- Alcheikhhamdon, Y.; Hoorfar, M. Natural gas purification from acid gases using membranes: A review of the history, features, techno-commercial challenges, and process intensification of commercial membranes. J. Chem. Eng. Process. Process Intensif. 2017, 120, 105–113. [Google Scholar] [CrossRef]
- Wysocka, I.; Gębicki, J.; Namieśnik, J. Technologies for deodorization of malodorous gases. Environ. Sci. Pollut. R. 2019, 26, 9409–9434. [Google Scholar] [CrossRef] [Green Version]
- Kesting, R. Synthetic polymeric membranes. J. Colloid Interface Sci. 1988. [Google Scholar] [CrossRef]
- Baker, W. Membrane Technology and Applications, 3rd ed.; John Wiley & Sons Ltd.: Chichester, UK, 2012; pp. 148–149. ISBN 9780470743720. [Google Scholar]
- Mulder, M. Basic Principles of Membrane Technology; Kluwer Academic Publishers: Dordrecht, The Netherlands, 1996; ISBN 0792309782. [Google Scholar]
- Kammermeyer, K. Technical Gas Permeation Processes. Chem. Ing. Tech. 1976, 48, 672. [Google Scholar] [CrossRef]
- Baker, R.W. Membrane Transport Theory. In Membrane Technology and Applications; John Wiley & Sons Ltd: Hoboken, NJ, USA, 2012; ISBN 0-470-85445-6. [Google Scholar]
- Stannett, V.T.; Koros, W.J.; Paul, D.R.; Lonsdale, H.K.; Baker, R.W. Recent advances in membrane science and technology. In Chemistry; Springer: Berlin/Heidelberg, Germany, 1979; Volume 32. [Google Scholar] [CrossRef]
- Guizard, C.; Rios, G. Chapter 12 Transport and fouling phenomena in liquid phase separation with inorganic and hybrid membranes. Membr. Sci. Technol. 1996, 4, 569–618. [Google Scholar] [CrossRef]
- Merkel, T.C.; Freeman, B.D.; Spontak, R.J.; He, Z.; Pinnau, I.; Meakin, P.; Hill, A.J. Ultrapermeable, reverse-selective nanocomposite membranes. Science 2002, 296, 519–522. [Google Scholar] [CrossRef] [Green Version]
- Bazhenov, S.D.; Bildyukevich, A.V.; Volkov, A.V. Gas-liquid hollowfiber membrane contactors for different applications. Fibers 2018, 6, 76. [Google Scholar] [CrossRef] [Green Version]
- Drioli, E.; Stankiewicz, A.I.; Macedonio, F. Membrane engineering in process intensification—An overview. J. Membr. Sci. 2011, 380. [Google Scholar] [CrossRef]
- Iulianelli, A.; Drioli, E. Membrane engineering: Latest advancements in gas separation and pre-treatment processes, petrochemical industry and refinery, and future perspectives in emerging applications. Fuel Process. Technol. 2020, 206, 106464. [Google Scholar] [CrossRef]
- Mulder, M. The Use of Membrane Processes in Environmental Problems. An Introduction. In Membrane Processes in Separation and Purification; Crespo, J.G., Böddeker, K.W., Eds.; Springer: Dordrecht, The Netherlands, 1994; Volume 272. [Google Scholar] [CrossRef]
- Silva, A.F.R.; Ricci, B.C.; Koch, K.; Weißbach, M.; Amaral, M.C.S. Dissolved hydrogen sulfide removal from anaerobic bioreactor permeate by modified direct contact membrane distillation. Sep. Pur. Technol. 2020, 233, 116036. [Google Scholar] [CrossRef]
- Dardor, D.; Minier-Matar, J.; Janson, A.; AlShamari, E.; Adham, S. The effect of Hydrogen sulfide oxidation with ultraviolet light and aeration on sour water treatment via membrane contactors. Sep. Pur. Technol. 2020, 236, 116262. [Google Scholar] [CrossRef]
- Gabelman, A.; Hwang, S.T. Hollowfiber membrane contactors. J. Membr. Sci. 1999, 159, 61–106. [Google Scholar] [CrossRef]
- Tabe-Mohammadi, A. A Review of the Applications of Membrane Separation Technology in Natural Gas Treatment. Sep. Sci. Technol. 1999, 34, 2095–2111. [Google Scholar] [CrossRef]
- Rappert, S.; Muller, R. Odor compounds in waste gas emissions from agricultural operations and food industries. Waste Manag. 2005, 25, 887–907. [Google Scholar] [CrossRef] [PubMed]
- Krayzelova, L.; Bartacek, J.; Díaz, I.; Jeison, D.; Volcke, E.I.P.; Jenicek, P. Microaeration for hydrogen sulfide removal during anaerobic treatment: A review. Rev. Environ. Sci. Biotechnol. 2015, 14, 703–725. [Google Scholar] [CrossRef]
- Samimi, A.; Zarinabadi, S.; Bozorgian, A.; Amosoltani, A.; Esfahani, M.S.T.; Kavousi, M.K. Advances of Membrane Technology in Acid Gas Removal in Industries. Prog. Chem. Biochem. Res. 2020, 3, 46–54. [Google Scholar] [CrossRef]
- Pochwat, K.; Kida, M.; Ziembowicz, S.; Koszelnik, P. Odours in Sewerage—A Description of Emissions and of Technical Abatement Measures. Environments 2019, 6, 89. [Google Scholar] [CrossRef] [Green Version]
- Fang, J.J. Odor compounds from different sources of landfill: Characterization and source identification. Waste Manag. 2012, 32, 1401–1410. [Google Scholar] [CrossRef]
- Aatamila, M.; Verkasalo, P.K.; Korhonen, M.J.; Suominen, A.L.; Hirvonen, M.R.; Viluksela, M.K.; Nevalainen, A. Odour annoyance and physical symptoms among residents living near waste treatment centers. Environ. Res. 2011, 111, 164–170. [Google Scholar] [CrossRef]
- Zhang, L.; Sedlak, L.D. A framework for identifying characteristic odor compounds in municipal wastewater effluent. Water Res. 2012, 46, 5970–5980. [Google Scholar] [CrossRef]
- Hancock, J.T. Hydrogen sulfide and environmental stresses. Environ. Exp. Bot. 2019, 161, 50–56. [Google Scholar] [CrossRef]
- Antonelli, D.; Sabanchiev, A.; Rosner, E.; Turgeman, Y. Sewer gas induced myocardial toxicity. Harefuah 2014, 153, 378–379. [Google Scholar]
- Samuel, A.D.; Bungau, S.; Tit, D.M.; Melinte, C.E.; Purza, L.; Badea, G.E. Effects of long term application of organic and mineral fertilizers on soil enzymes. Rev. Chim. 2018, 69, 2608–2612. [Google Scholar] [CrossRef]
- Ginghina, R.E.; Bojin, D.; Tiganescu, T.V.; Petrea, N.; Bungau, S.; Mosteanu, D.-E. Research on the efficiency of testing a new adsorbent material with cellulose structure for the depollution of waste water. Mater. Plast. 2020, 57, 306–314. [Google Scholar] [CrossRef]
- Moisa, C.; Copolovici, L.; Bungau, S.; Pop, G.; Imbrea, I.; Lupitu, A.; Nemeth, S.; Copolovici, D. Wastes resulting from aromatic plants distillation—Bio-sources of antioxidants and phenolic compounds with biological active principles. Farmacia 2018, 66, 289–295. [Google Scholar]
- Available online: https://www.mediafax.ro/social/sarbatoare-cu-poluare-nordul-capitalei-cel-mai-irespirabil-loc-de-pe-planeta-indicele-nivelului-de-poluare-in-noaptea-de-craciun-19820504 (accessed on 4 February 2021).
- Available online: https://www.digi24.ro/stiri/sci-tech/natura-si-mediu/date-alarmante-poluarea-din-nordul-capitalei-a-atins-cote-mai-mari-decat-in-bangladesh-cea-mai-poluata-tara-din-lume-1423834 (accessed on 4 February 2021).
- Szałata, Ł. Impact of Implementing a Deodorization System on the Functioning of a Waste Management Plant. Sustainability 2020, 12, 5983. [Google Scholar] [CrossRef]
- Wiheeb, A.D.; Shamsudin, I.K.; Ahmad, M.A.; Murat, M.N.; Kim, J.; Othman, M.R. Present technologies for hydrogen sulfide removal from gaseous mixtures. Rev. Chem. Eng. 2013, 29, 449–470. [Google Scholar] [CrossRef]
- Bernardoa, P.; Drioli, E. Membrane Gas Separation Progresses for Process Intensification Strategy in the Petrochemical Industry. Pet. Chem. 2010, 50, 271–282. [Google Scholar] [CrossRef]
- Alqaheem, Y.; Alomair, A.; Vinoba, M.; Pérez, A. Polymeric Gas-Separation Membranes for Petroleum Refining. Int. J. Polym. Sci. 2017, 2017. [Google Scholar] [CrossRef]
- Adams, R.; Carson, C.; Ward, J.; Tannenbaum, R.; Koros, W. Metal organic framework mixed matrix membranes for gas separations. Micropor. Mesopor. Mater. 2010, 131, 13–20. [Google Scholar] [CrossRef]
- Quinn, R.; Appleby, J.B.; Pez, G.P. Hydrogen sulfide separation from gas streams using salt hydrate chemical absorbents and immobilized liquid membranes. Sep. Sci. Technol. 2002, 37, 627–638. [Google Scholar] [CrossRef]
- Sanip, S.M.; Ismail, A.F.; Goh, P.S.; Soga, T.; Tanemura, M.; Yasuhiko, H. Gas separation properties of functionalized carbon nanotubes mixed matrix membranes. Sep. Pur. Technol. 2011, 78, 208–213. [Google Scholar] [CrossRef]
- Bastani, D.; Esmaeili, N.; Asadollahi, M. Polymeric mixed matrix membranes containing zeolites as a filler for gas separation applications: A review. J. Ind. Eng. Chem. 2013, 19, 375–393. [Google Scholar] [CrossRef]
- Karimi, M.B.; Khanbabaei, G.; Sadeghi, G.M.M. Vegetable oil-based polyurethane membrane for gas separation. J. Membr. Sci. 2017, 527, 198–206. [Google Scholar] [CrossRef]
- Drioli, E.; Criscuoli, A.; Curcio, E. Membrane Contactors: Fundamentals, Applications and Potentialities; Elsevier: Amsterdam, The Netherlands, 2011. [Google Scholar]
- Esquiroz-Molina, A.; Georgaki, S.; Stuetz, R.; Jefferson, B.; McAdam, E.J. Influence of pH on gas phase controlled mass transfer in a membrane contactor for hydrogen sulphide absorption. J. Membr. Sci. 2013, 427, 276–282. [Google Scholar] [CrossRef]
- Uhlmann, D.; Smart, S.; da Costa, J.C.D. H2S stability and separation performance of cobalt oxide silica membranes. J. Membr. Sci. 2011, 380, 48–54. [Google Scholar] [CrossRef]
- Tilahun, I.; Bayrakdar, A.; Sahinkaya, E.; Çalli, B. Performance of polydimethylsiloxane membrane contactor process for selective hydrogen sulfide removal from biogas. Waste Manag. 2017, 61, 250–257. [Google Scholar] [CrossRef] [PubMed]
- Tilahun, I.; Sahinkaya, E.; Çalli, B. A hybrid membrane gas absorption and bio-oxidation process for the removal of hydrogen sulfide from biogas. Int. Biodeterior. Biodegrad. 2018, 127, 69–76. [Google Scholar] [CrossRef]
- Shah, M.S.; Tsapatsis, M.; Siepmann, J.I. Hydrogen Sulfide Capture: From Absorption in Polar Liquids to Oxide, Zeolite, and Metal-Organic Framework Adsorbents and Membranes. Chem. Rev. 2017, 117, 9755–9803. [Google Scholar] [CrossRef]
- Atlaskin, A.A.; Kryuchkov, S.S.; Yanbikov, N.R.; Smorodin, K.A.; Petukhov, A.N.; Trubyanov, M.M.; Vorotyntsev, V.M.; Vorotyntsev, I.V. Comprehensive experimental study of acid gases removal process by membrane-assisted gas absorption using imidazolium ionic liquids solutions absorbent. Sep. Pur. Technol. 2020, 239, 116578. [Google Scholar] [CrossRef]
- Cuevasanta, E.; Denicola, A.; Alvarez, B.; Möller, M.N. Solubility and Permeation of Hydrogen Sulfide in Lipid Membranes. PLoS ONE 2012, 7, e34562. [Google Scholar] [CrossRef] [PubMed]
- Mansourizadeh, A.; Ismail, A.F. Hollow fiber gas-liquid membrane contactors for acid gas capture: A review. J. Hazard. Mater. 2009, 171, 38–53. [Google Scholar] [CrossRef]
- Abdelnabi, M.M.; Cordova, K.E.; Abdulazeez, I.; Alloush, A.M.; Al-Maythalony, B.A.; Mankour, Y.; Alhooshani, K.; Saleh, T.A.; al Hamouz, O.C.S. A Novel Porous Organic Polymer for the Concurrent and Selective Removal of Hydrogen Sulfide and Carbon Dioxide from Natural Gas Streams. ACS Appl. Mater. Interfaces 2020, 12. [Google Scholar] [CrossRef] [PubMed]
- Zhang, L.; de Schryver, P.; de Gusseme, B.; de Muynck, W.; Boon, N.; Verstraete, W. Chemical and biological technologies for hydrogen sulfide emission control in sewer systems: A review. Water Res. 2008, 42. [Google Scholar] [CrossRef] [PubMed]
- Ghimpusan, M.; Nechifor, G.; Din, I.S.; Nechifor, A.C.; Passeri, P. Application of Hollow Fibre Membrane Bioreactor Instead of Granular Activated Carbon Filtration for Treatment of Wastewater from Car Dismantler Activity. Mater. Plast. 2016, 53, 578–584. [Google Scholar]
- Din, I.S.; Cimbru, A.M.; Rikabi, A.A.K.K.; Tanczos, S.K.; Ticu, S.; Nechifor, G. Iono-molecular Separation with Composite Membranes VI. Nitro-phenol separation through sulfonated polyether ether ketone on capillary polypropylene membranes. Rev. Chim. 2018, 69, 1603–1607. [Google Scholar] [CrossRef]
- Nafliu, I.M.; Al-Ani, H.N.A.; Grosu, A.R.; Albu, P.C.; Nechifor, G. Iono-molecular separation with composite membranes. VIII. Recuperative aluminium ions separation on capilary polypropylene S-EPDM composite membranes. Mater. Plast. 2019, 56, 32–36. [Google Scholar] [CrossRef]
- Shaw, J.A. Rapid determination of hydrogen sulfide and mercaptan sulfur. In gases and in aqueous solutions. Anal. Chem. 1940, 12, 668–671. [Google Scholar]
- Paré, J.P. A new tape reagent for the determination of hydrogen sulfide in air. J. Air Pollut. Control Assoc. 1966, 16, 325–327. [Google Scholar] [CrossRef]
- Natusch, D.F.S.; Sewell, J.R.; Tanner, R.L. Determination of hydrogen sulfide in air—An assessment of impregnated paper tape methods. Anal. Chem. 1974, 46, 410–415. [Google Scholar] [CrossRef]
- Windholz, M. (Ed.) Hydrogen sulfide. In Merck Index, 9th ed.; Merck & Co., Inc.: Rahway, NJ, USA, 1976; pp. 633–634. [Google Scholar]
- Van der Bruggen, B.; Vandecasteele, C.; van Gestel, T.; Doyen, W.; Leysen, R. A review of pressure-driven membrane processes in wastewater treatment and drinking water production. Environ. Prog. 2003, 22, 46–56. [Google Scholar] [CrossRef]
- Strathmann, H.; Giorno, L.; Drioli, E. Introduction to Membrane Science and Technology; Institute on Membrane Technology, CNR-ITMat University of Calabria: Rende, Italy, 2011; pp. 27–58. [Google Scholar]
- Damuchali, A.M.; Guo, H. Evaluation of a field olfactometer in odour concentration measurement. J. Biosyst. Eng. 2019, 187, 239–246. [Google Scholar] [CrossRef]
- Gallego, E.; Roca, F.J.; Perales, J.F.; Sanchez, G.; Esplugas, P. Characterization and determination of the odorous charge in the indoor air of a waste treatment facility through the evaluation of volatile organic compounds (VOCs) using TD-GC/MS. Waste Manag. 2012, 32, 2469–2481. [Google Scholar] [CrossRef]
- Ghimpusan, M.; Nechifor, G.; Nechifor, A.C.; Dima, S.O.; Passeri, P. Case studies on the physical-chemical parameters’ variation during three different purification approaches destined to treat wastewaters from food industry. J. Environ. Manag. 2017, 203, 811–816. [Google Scholar] [CrossRef] [PubMed]
- Grosu, A.R.; Nafliu, I.M.; Din, I.S.; Cimbru, A.M.; Nechifor, G. Neutralization with simultaneous separation of aluminum and copper ions from condensed water through capillary polypropylene and cellulose. UPB Sci. Bull. Ser. B Chem. Mater. Sci. 2020, 82, 25–34. [Google Scholar]
- Allen, J.T. The Industrial Context of Film Technology: Standardisation and Patents. In The Cinematic Apparatus; de Lauretis, T., Heath, S., Eds.; Palgrave Macmillan: London, UK, 1980. [Google Scholar] [CrossRef]
- Cilibertoa, E.; Gemmellaroa, P.; Iannusoa, V.; la Delfaa, S.; Ursoa, R.G.; Viscuso, E. Characterization and weathering of motion-picture films with support of cellulose nitrate, cellulose acetate and polyester. Procedia Chem. 2013, 8, 175–184. [Google Scholar] [CrossRef] [Green Version]
- Ahmad, I.R.; Cane, D.; Townsend, J.H.; Triana, C.; Mazzei, L.; Curran, K. Are we overestimating the permanence of cellulose triacetate cinematographic films? A mathematical model for the vinegar syndrome. Polym. Degrad. Stab. 2020, 172, 109050. [Google Scholar] [CrossRef]
- Camera Deputaților, Romania. Available online: http://www.cdep.ro/interpel/2017/r573B.pdf (accessed on 19 March 2021).


| Source | Gaseous Components | ||||||
|---|---|---|---|---|---|---|---|
| H2S | Mercaptans | NH3 | CH4 | SO2 | Phenols | Others | |
| Biogas: CH4, H2S, mercaptans | + | + | − | + | n/a | − | − |
| Pulp and paper: CH3SH; (CH3)2S; SO2 | + | + | − | n/a | + | − | − |
| Nitrogen-Phosphate based fertilizers: NH3; SO2; F2 | − | − | + | − | + | − | F2 |
| Pesticides: CH3CHO; NH3; H2S; phenols | + | − | + | − | − | + | CH3CHO |
| Raw hides and skins storage: NH3; H2S | + | − | + | − | − | − | n/a |
| Finishing operations: H2S; CH4 | + | − | − | + | − | − | − |
| Sugar and distillery bio-methanation: H2S; NH3 | + | − | + | − | − | − | − |
| Chemical: NH3; H2S; Cl2; mercaptans; phenols | + | + | + | − | − | + | Cl2 |
| Dye and dye intermediates: NH3; H2S; SO2; mercaptans | + | + | + | n/a | + | − | − |
| Bulk drugs, pharmaceuticals biological extracts: H2S, SO2, mercaptans | + | + | − | − | + | + | − |
| Wastewater treatment plant anaerobic decomposition: H2S; mercaptans | + | + | − | − | − | − | − |
| Waste resulting from plant distillation | + | + | + | n/a | n/a | + | |
| Municipal solid waste anaerobic decomposition: H2S, mercaptans | + | + | − | + | − | − | − |
| Waste storage effluent treatment plant: CH4, H2S, mercaptans | + | + | − | + | − | − | − |
| Material Membranes | Feed System | H2S | Refs. |
|---|---|---|---|
| Polymers | Solution/gases | removal | [34,53,54,55,56] |
| Metal organic framework | gases | removal | [57] |
| Salt hydrate chemical absorbents | gas streams | separation | [58] |
| Functionalized carbon nanotubes | gases | separation | [59] |
| Zeolites as a filler | gases | separation | [60] |
| Vegetable oil-polyurethane | gases | separation | [61] |
| Polymeric contactors | gases | removal | [62,63] |
| Cobalt oxide silica | gases | separation | [64] |
| Polydimethylsiloxane | biogas | removal | [65] |
| Hybrid membrane | biogas | removal | [66] |
| Various adsorbents | gases | capture | [67] |
| Imidazolium ionic liquids | acid gases | removal | [68] |
| Lipid | gases | permeation | [69] |
| Hollow fiber contactors | gases | removal | [70] |
| Porous Organic Polymer | natural gas | selective removal | [71] |
| Material | Porosity (%) | Dimension of Pore (µm) | External Diameter (mm) | Fascicle Dimensions (mm) | Filtration Surface (Fascicle) (m2) | pH | Tmax (°C) |
|---|---|---|---|---|---|---|---|
| Polypropylene (PP) | 40–50 | 0.002–0.2 | 0.45 | 25 × 750 | 1.0 | 1–14 | 50 |
| Cellulose Acetate Solution Concentration (%) | 2 | 4 | 6 |
|---|---|---|---|
| The amount of cellulose acetate in a bundle of composite membranes (g) | 8.41 + 0.22 | 15.16 + 0.34 | 23.63 + 0.45 |
| Membrane with Cell Ac Ag. (Ag-Cell-Ac-PPM) | Efficiency Extraction (%) | |
|---|---|---|
| Hydrogen Sulfide | Ethanethiol | |
| 2% | 89 ± 3 | 91 ± 2 |
| 4% | 91 ± 3 | 92 ± 2 |
| 6% | 94 ± 3 | 95 ± 2 |
Publisher’s Note: MDPI stays neutral with regard to jurisdictional claims in published maps and institutional affiliations. |
© 2021 by the authors. Licensee MDPI, Basel, Switzerland. This article is an open access article distributed under the terms and conditions of the Creative Commons Attribution (CC BY) license (https://creativecommons.org/licenses/by/4.0/).
Share and Cite
Nechifor, A.C.; Cotorcea, S.; Bungău, C.; Albu, P.C.; Pașcu, D.; Oprea, O.; Grosu, A.R.; Pîrțac, A.; Nechifor, G. Removing of the Sulfur Compounds by Impregnated Polypropylene Fibers with Silver Nanoparticles-Cellulose Derivatives for Air Odor Correction. Membranes 2021, 11, 256. https://0-doi-org.brum.beds.ac.uk/10.3390/membranes11040256
Nechifor AC, Cotorcea S, Bungău C, Albu PC, Pașcu D, Oprea O, Grosu AR, Pîrțac A, Nechifor G. Removing of the Sulfur Compounds by Impregnated Polypropylene Fibers with Silver Nanoparticles-Cellulose Derivatives for Air Odor Correction. Membranes. 2021; 11(4):256. https://0-doi-org.brum.beds.ac.uk/10.3390/membranes11040256
Chicago/Turabian StyleNechifor, Aurelia Cristina, Simona Cotorcea, Constantin Bungău, Paul Constantin Albu, Dumitru Pașcu, Ovidiu Oprea, Alexandra Raluca Grosu, Andreia Pîrțac, and Gheorghe Nechifor. 2021. "Removing of the Sulfur Compounds by Impregnated Polypropylene Fibers with Silver Nanoparticles-Cellulose Derivatives for Air Odor Correction" Membranes 11, no. 4: 256. https://0-doi-org.brum.beds.ac.uk/10.3390/membranes11040256