1. Introduction
Recently, the demand for the recovery of valuable solutes from organic solvents/water mixtures have increased in numerous areas, including chemical and pharmaceutical production [
1,
2]. For instance, organic solvents/water mixtures are used in the synthesis and purification processes of peptides [
3]. Since many of these peptides are heat-sensitive, the demand for non-heated concentration technology has increased.
Numerous studies on organic solvent nanofiltration (OSN) as a non-heated concentration technology have been reported [
4,
5]. OSN is regarded as an energy-efficient concentration method due to the absence of phase transition [
6]. Additionally, since OSN is a membrane technology, it is easier to scale up than the conventional distillation technologies [
1]. However, because OSN membranes separate solutes by size, it is difficult to concentrate valuable resources that are smaller than the membrane pore size without incurring losses, since they easily pass through the OSN membranes [
7,
8,
9].
Membrane distillation (MD) is one of the distillation technologies, in which water vapor and the vapor of organic solvents are permeated through a membrane using a vapor pressure difference across the membrane as the driving force [
10]. Theoretically, MD can separate any solutes from a solvent, as long as the solutes are non-volatile. Thus, MD can separate small solutes which cannot be separated using OSN. In addition, it is possible to concentrate the feed at temperatures below ambient temperature, if the vapor pressure difference between the feed and permeate sides of the membrane is sufficient. Additionally, MD shares many of the same advantages as other membrane technologies, including a simpler system and greater scalability than conventional distillation technologies.
Almost all MD operating conditions reported in previous studies report a feed temperature higher than 40 °C and a feed solution that did not contain any organic solvents [
11]. However, in applications such as chemical and pharmaceutical manufacturing processes, the operating temperature of the MD must be below ambient temperature to avoid the deterioration of valuable resources due to heat. In addition, organic solvents are frequently present in aqueous solutions. Thus, there are two challenges associated with applying MD technology to the process of chemical and pharmaceutical recovery. One issue is low vapor flux through the membrane as a result of a small vapor pressure difference caused by the low feed temperature. The other issue is membrane wetting caused by organic solvents. When the membrane is wet, liquids permeate through the membrane, resulting in the leak of solutes [
12].
The vapor flux of MD,
(kg/m
2·h) is proportional to the vapor pressure difference between the feed side and the permeation side and is given by Equation (1) [
13,
14].
Here,
(kg/m
2·h · kPa) is the vapor permeation coefficient.
(kPa) and
(kPa) are the saturated vapor pressures of the feed side and of the permeation side, respectively. (
−
) should be positive, since this is the driving force of vapor permeation. Equation (1) suggests that as the temperature of the feed decreases, it becomes more difficult to acquire enough vapor pressure difference, as the saturated vapor pressure decreases. Therefore, the vapor flux of MD will become extremely low under low feed temperature conditions. Only a few studies of MD operation at low feed temperatures have been reported so far [
14]. Furthermore, even if they were successful in MD operation, the vapor flux was extremely low. For example, Macedonio et al. performed direct contact MD (DCMD) operation at 30 °C and 25 °C for the feed and permeate, respectively [
13]. Additionally, they used the commercial polypropylene flat sheet membrane and obtained 0.2 kg/m
2∙h as the water vapor flux.
Membrane wetting is another severe problem in MD operation. Membrane wetting occurs when a transmembrane pressure becomes higher than the liquid entry pressure (LEP). LEP (MPa) is the pressure required for the liquid to penetrate into the membrane pore [
15]. LEP is given by Equation (2).
Here,
is a geometric factor determined by pore structure, for example,
= 1 for cylindrical pores.
is surface tension of a liquid,
a contact angle and
a maximum pore radius of membrane. In general, organic solvents decrease the surface tension of liquid in comparison with water, subsequently decreasing LEP [
14]. Thus, MD is difficult to be applied for recovering valuable solutes from organic solvent/water mixtures, since the membrane is easily wetted.
So far, few studies have been conducted that report the use of MD against organic solvent/water mixtures. In a few instances when an organic solvent/water mixture is used, the flux is extremely low as a result of improved LEP to avoid wetting. For example, Banat et al. performed an air gap MD (AGMD) operation using a polyvinylidene difluoride (PVDF) flat sheet membrane and treated an ethanol aqueous solution [
16]. They obtain approximately 1 kg/m
2∙h flux using 42 °C of 3.3 wt% EtOH aqueous solution as the feed. Additionally, Gupta et al. performed sweep gas MD (SGMD) using a composite membrane containing carbon nanotube to concentrate the iso-propanol aqueous solution [
17].
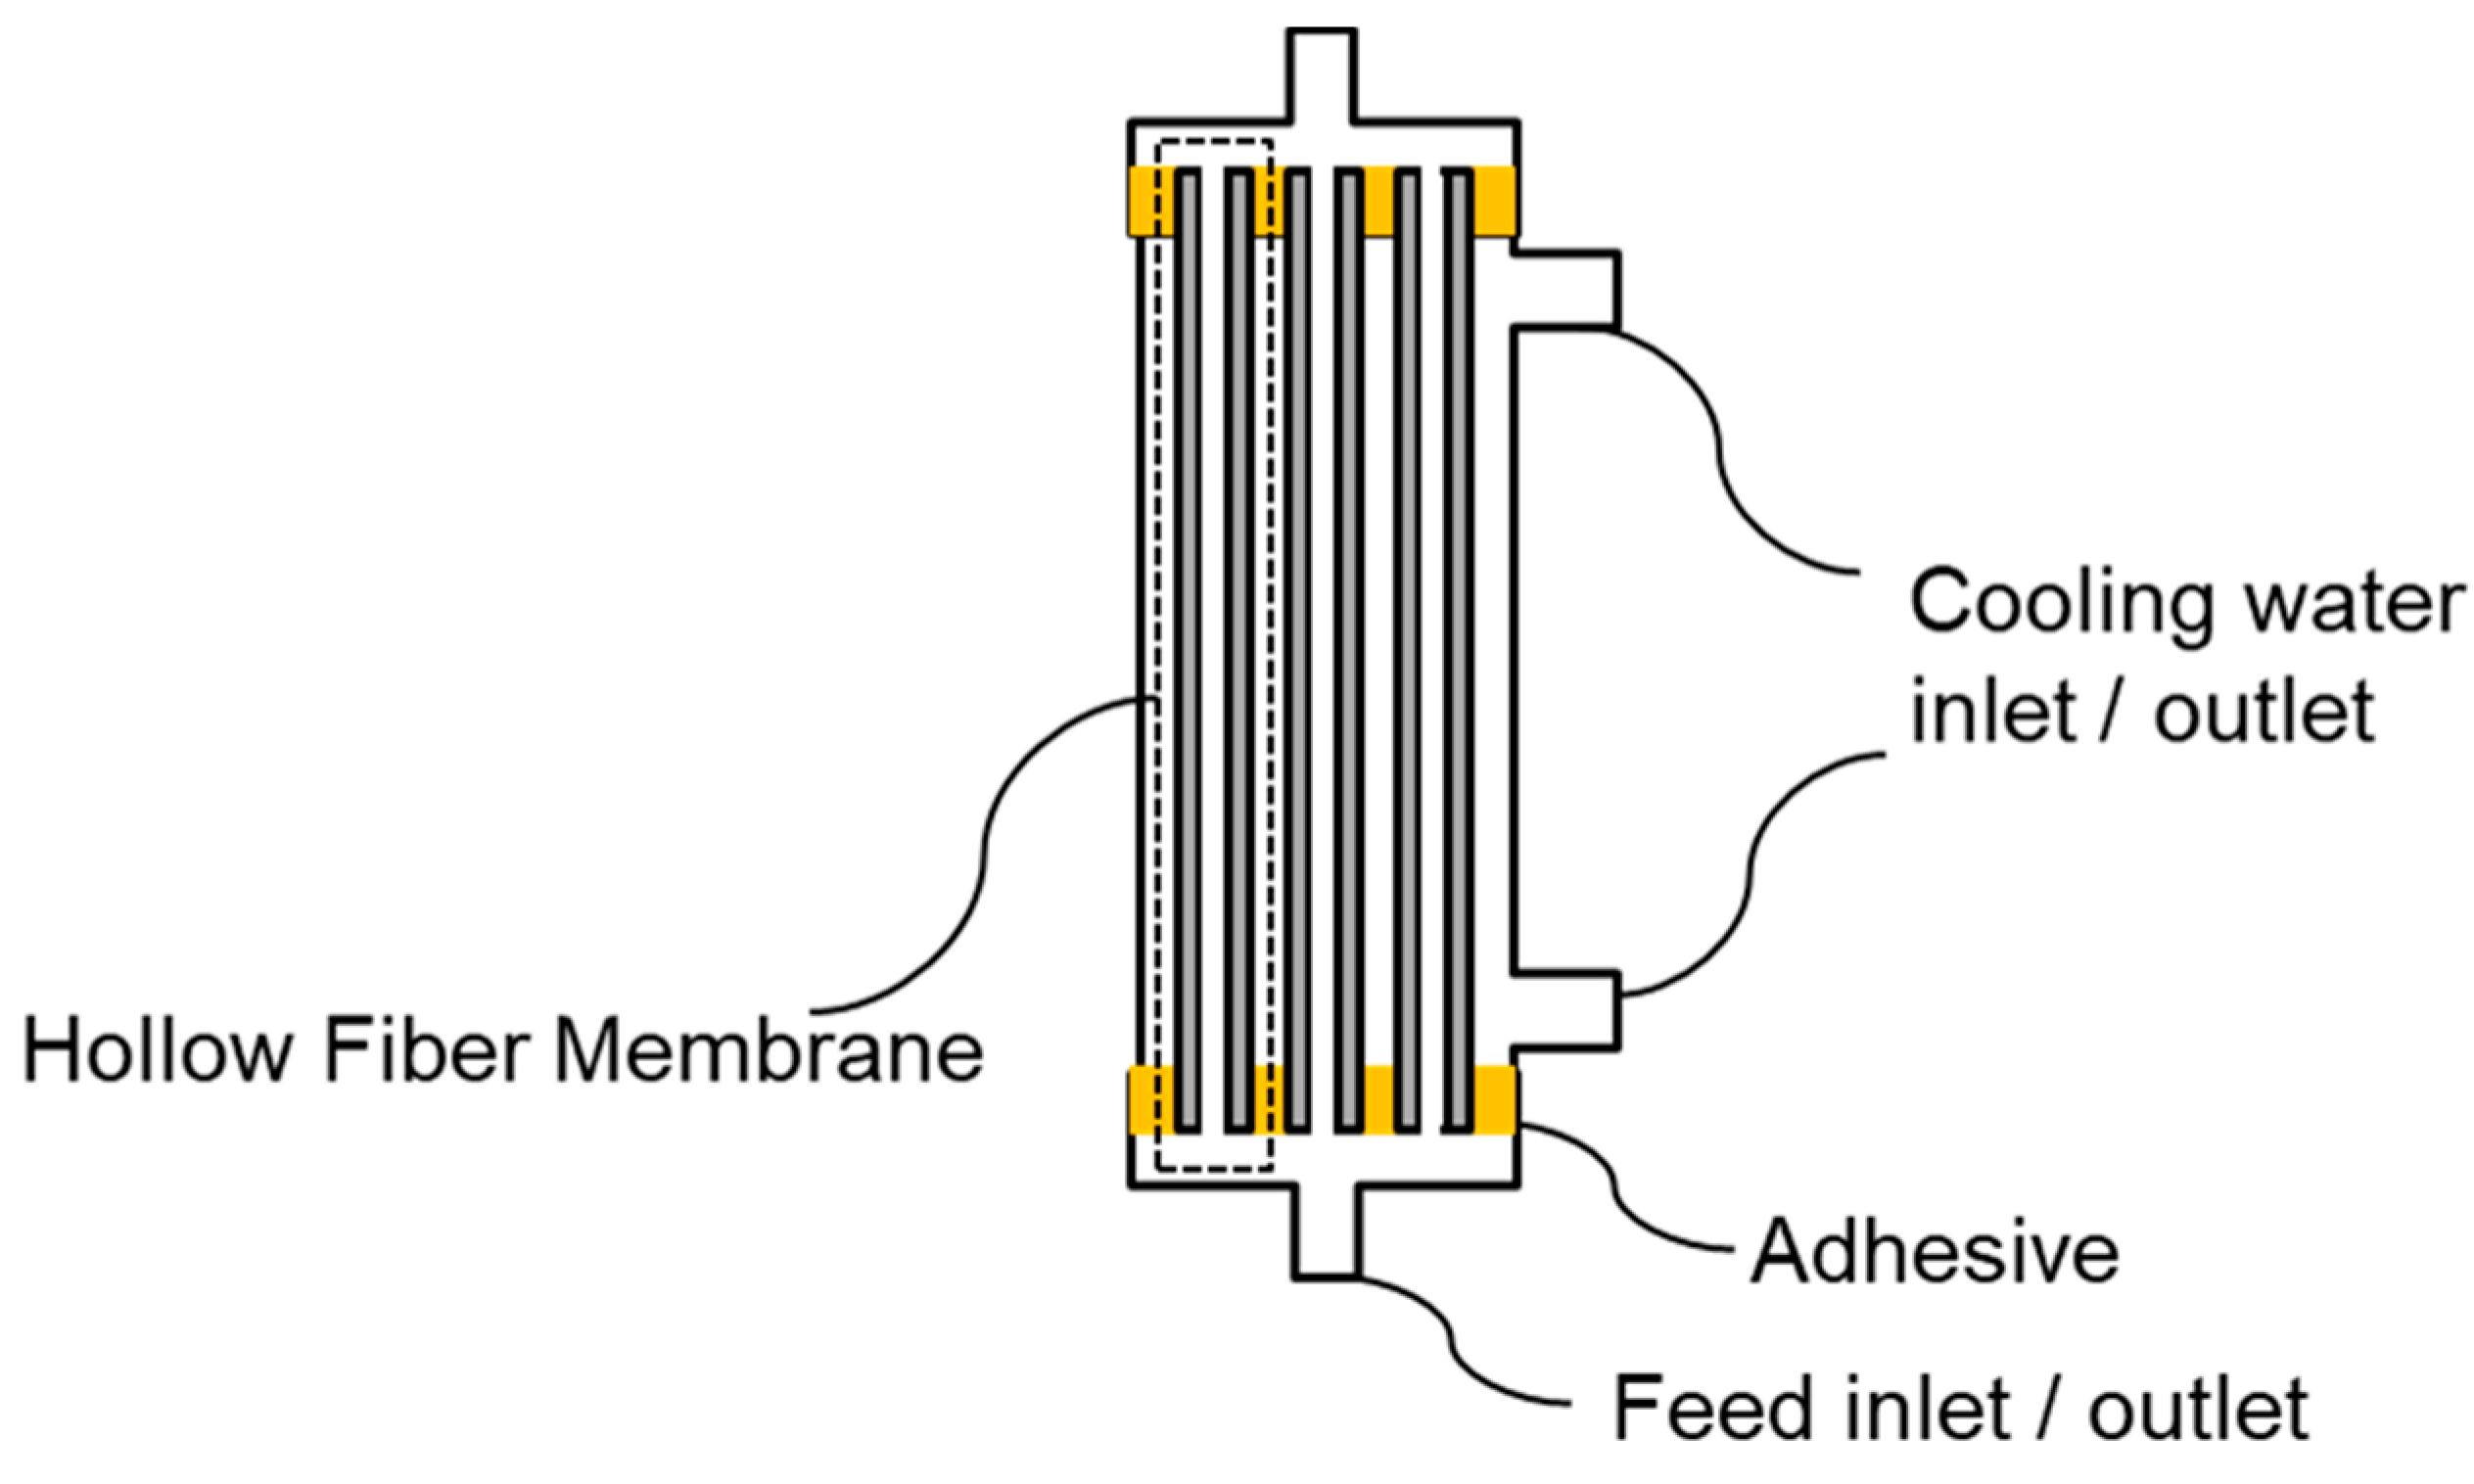
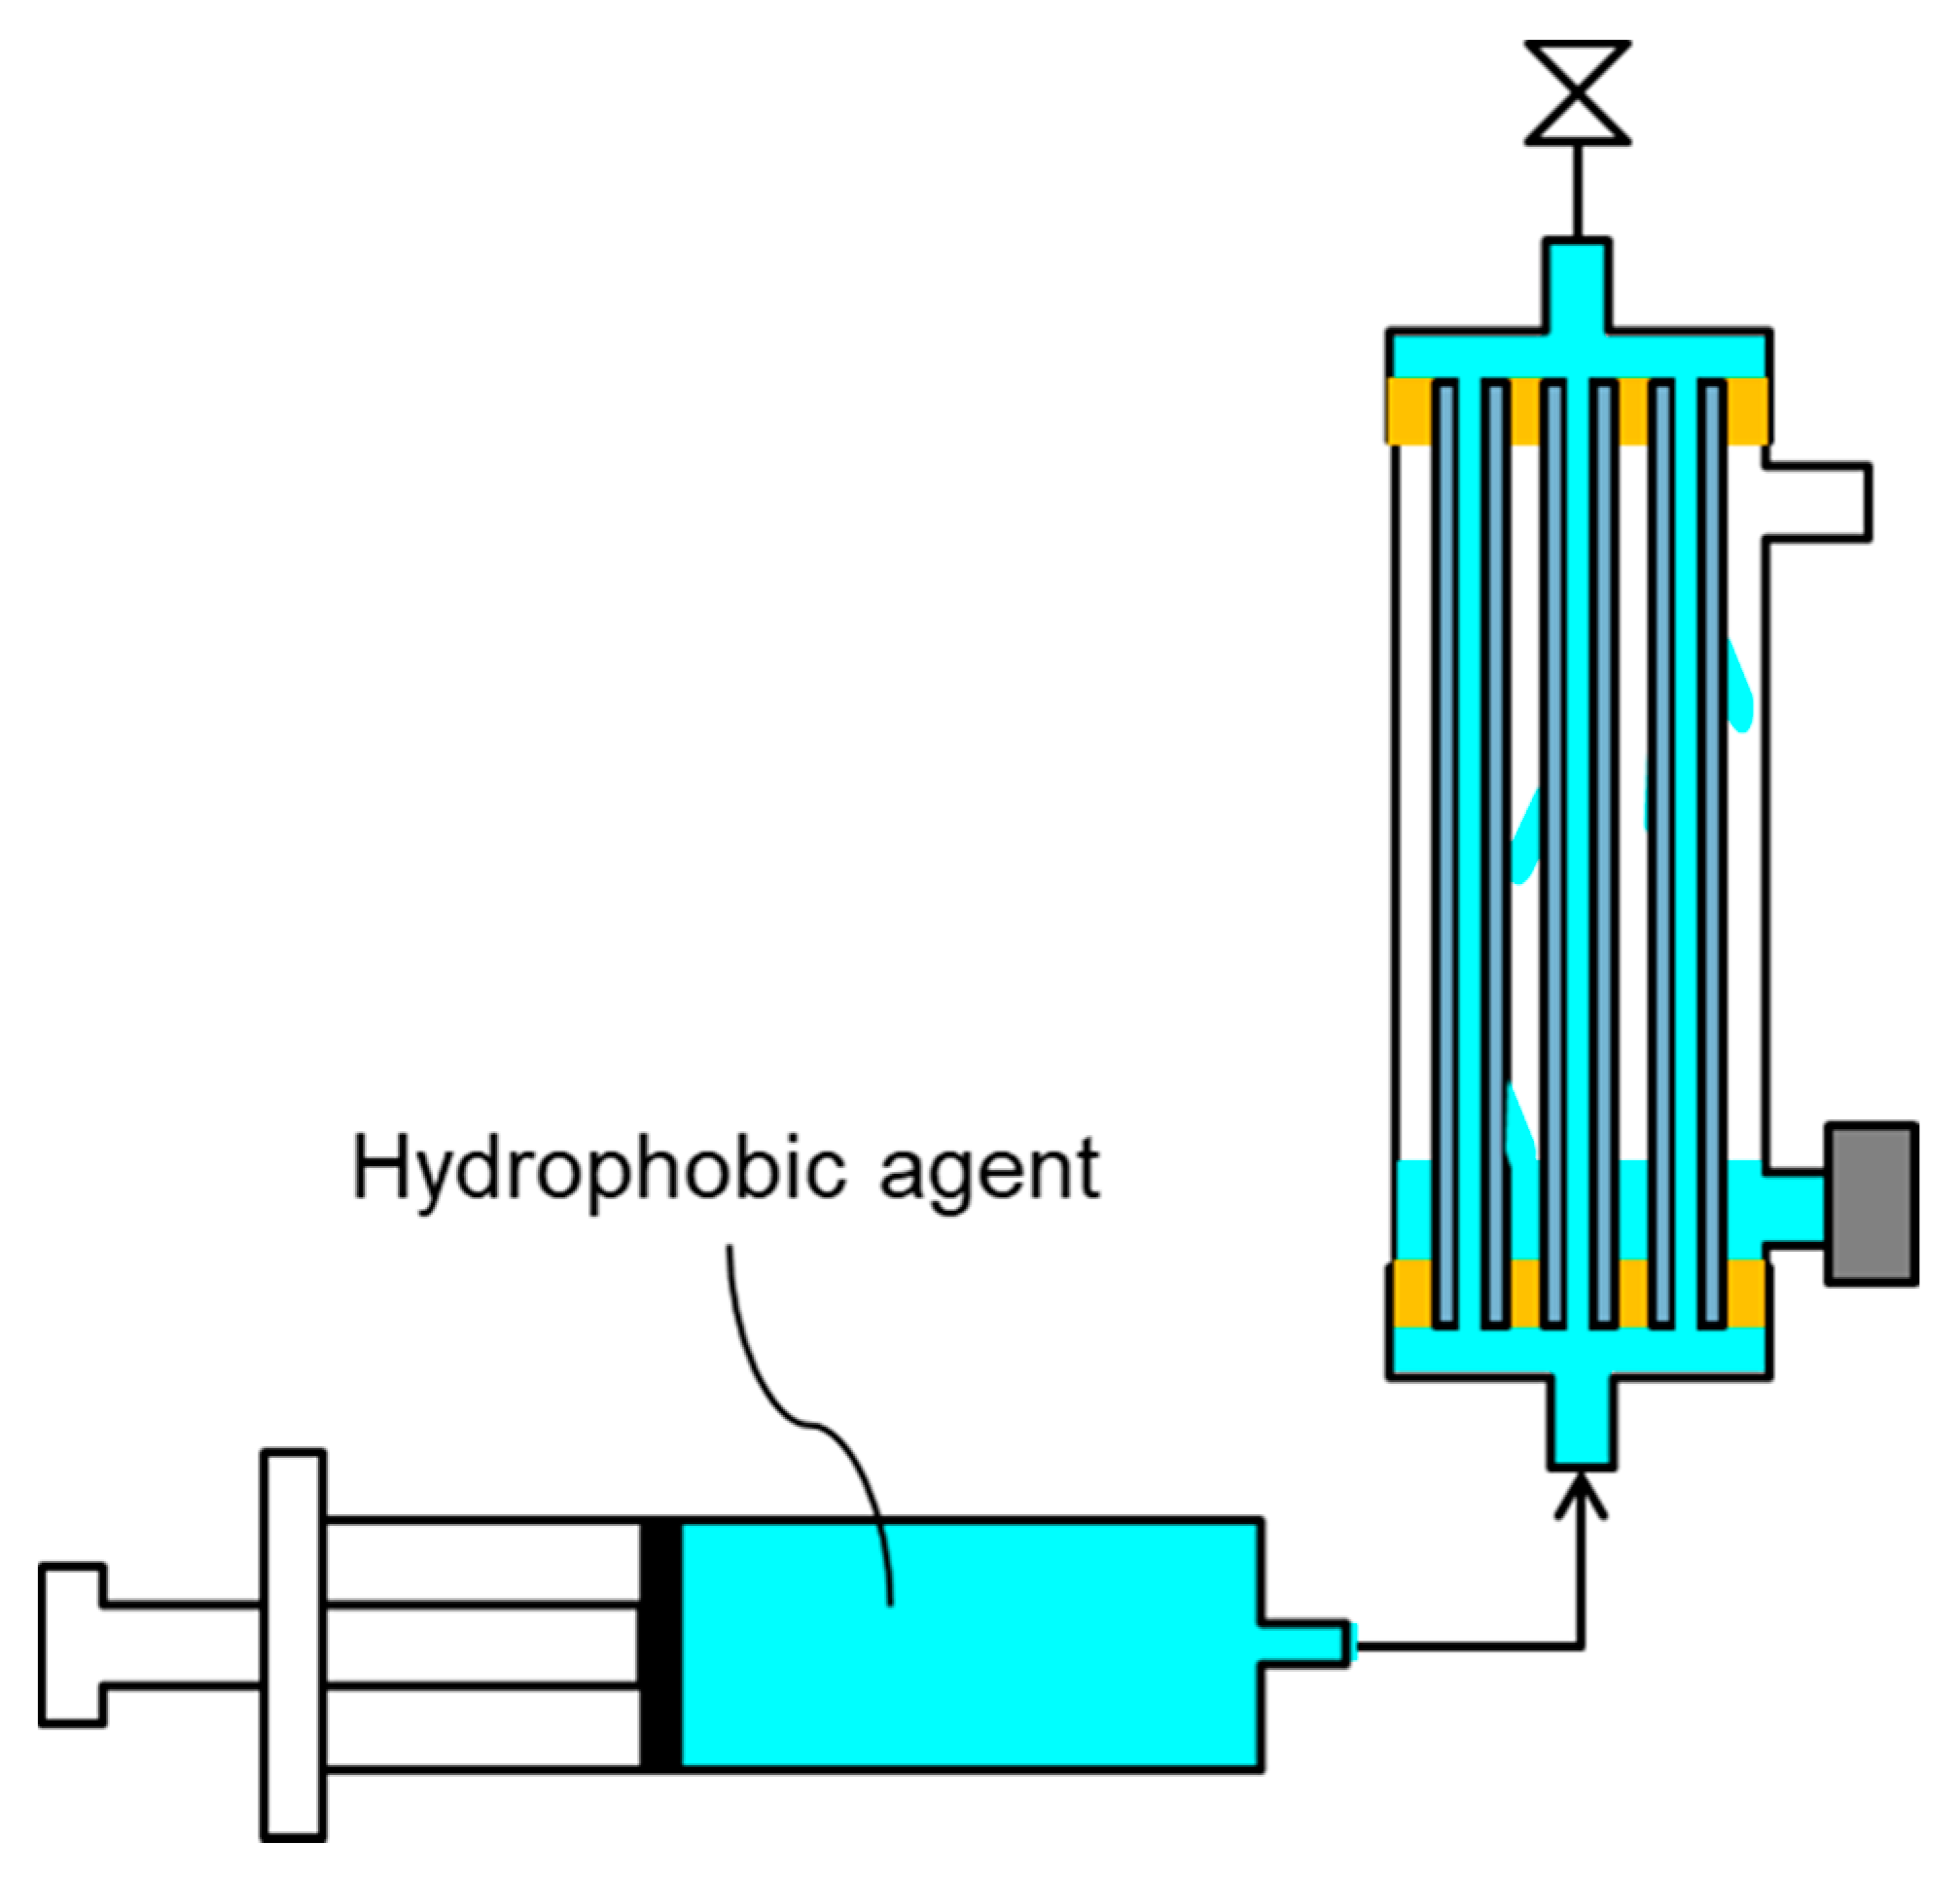
The current study attempts to improve vapor flux from two perspectives: the membrane and the MD operation method. Regarding MD membrane, a hydrophobized PVDF hollow fiber (HF) membrane with a high vapor flux and high LEP, fabricated in our previous study, was used as the MD membrane [
18]. It is expected that by using this membrane, the vapor will permeate efficiently even at low temperatures where the vapor pressure difference is low. Additionally, the membrane will scarcely become wet with the feed, which contains organic solvents, because the membrane will maintain sufficient LEP by the combination of high hydrophobicity and small maximum pore size, even if the surface tension of the feed aqueous solution becomes low due to the contained organic solvents.
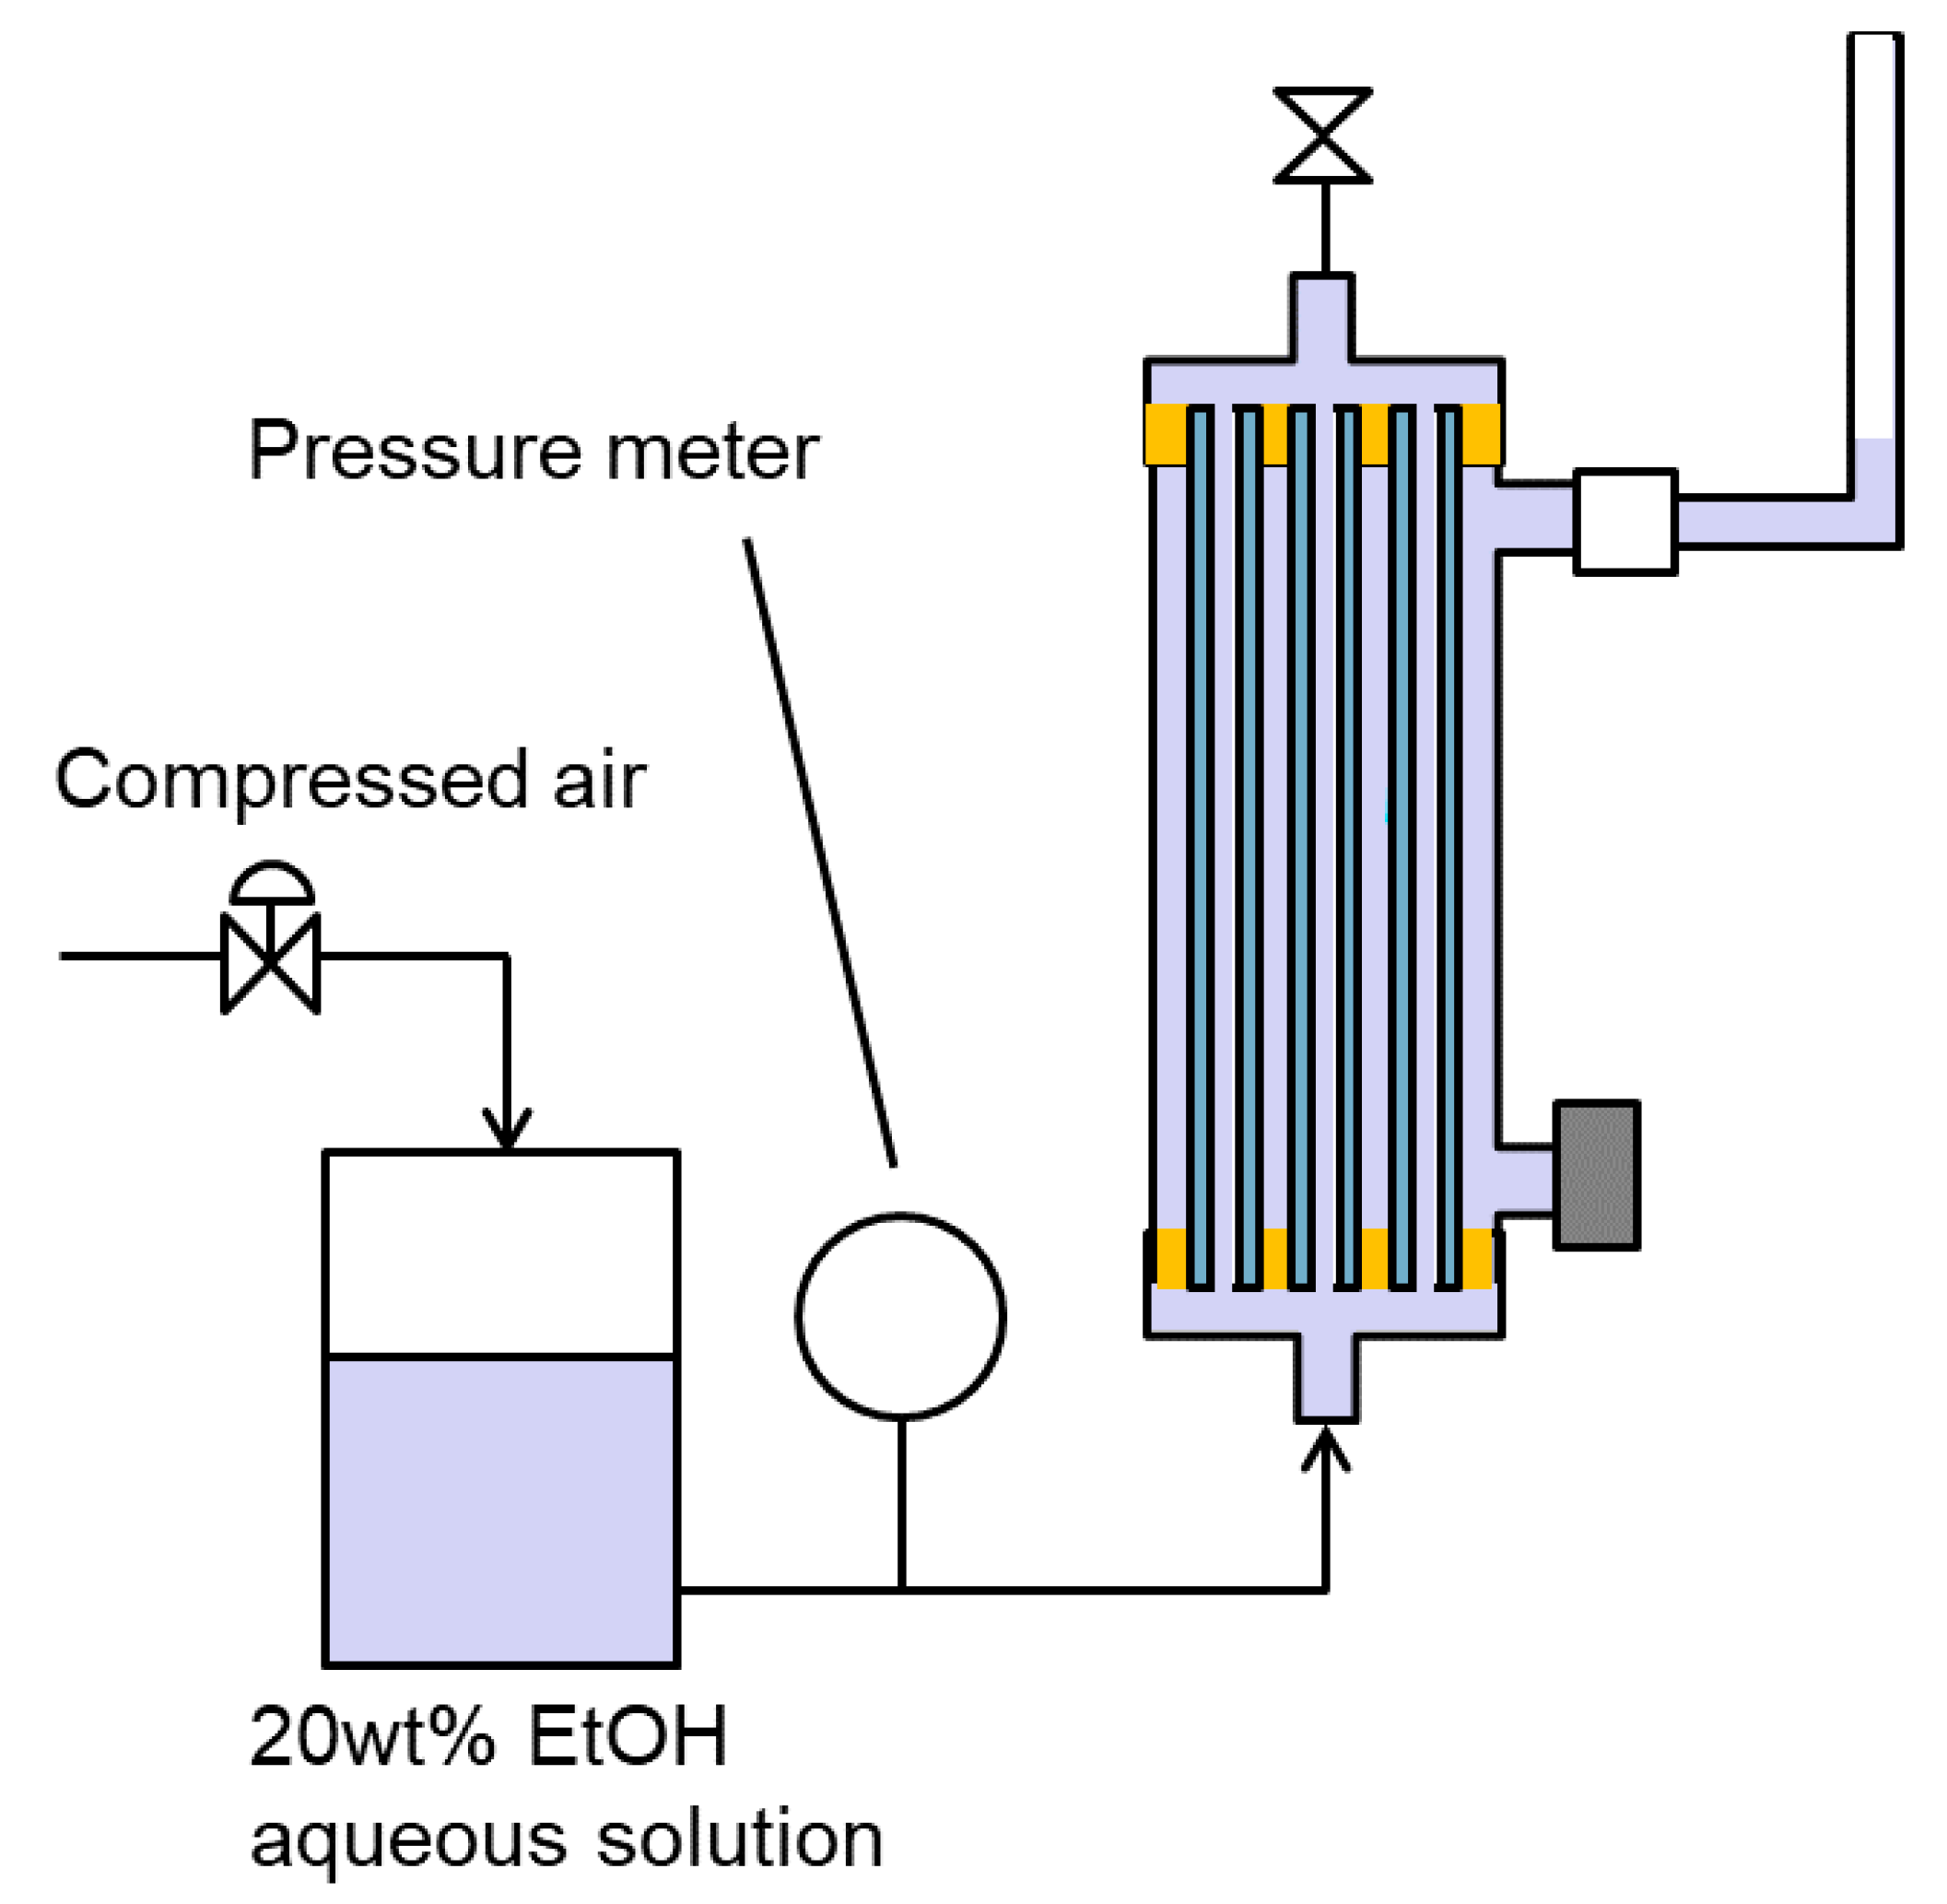
Regarding MD operation, it is important to choose the method that allows for a large vapor pressure difference across the membrane while reducing the transmembrane pressure simultaneously. MD is classified into several types based on the method of operation.
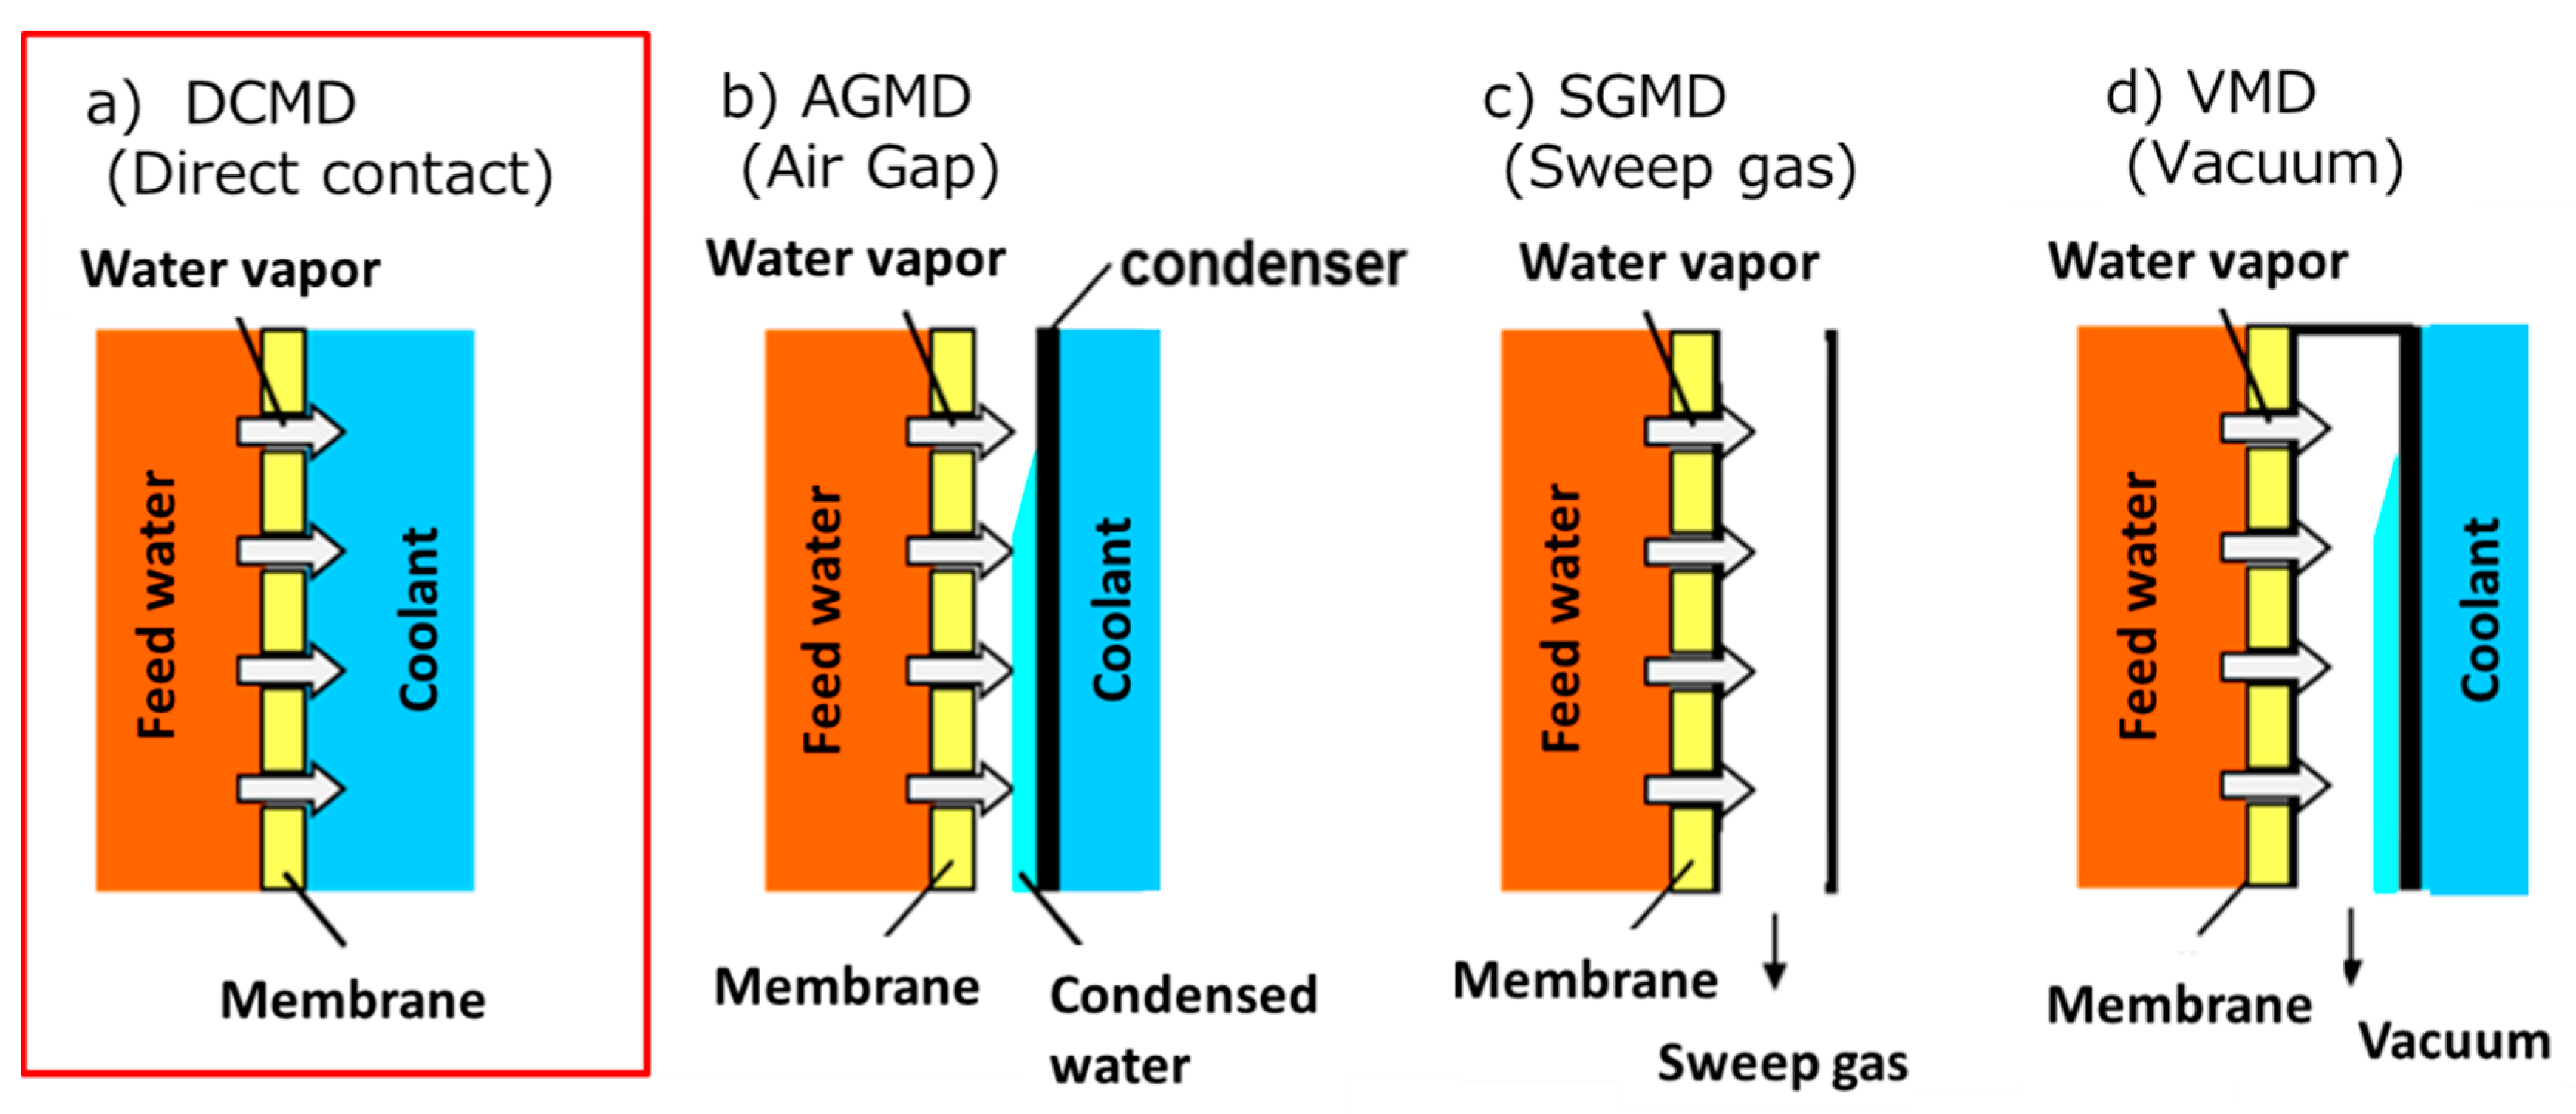
Figure 1 shows the schematics of typical MD setups [
19]. A direct contact MD (DCMD) (
Figure 1a) is the simplest MD operation method and has been used in numerous earlier studies [
10]. In DCMD, a feed water contacts with a coolant through a membrane and the pass where vapors permeate through is the shortest. Thus, the vapor flux of DCMD becomes very high. However, the heat efficiency is low because heat conduction is most likely to occur through the membrane, and temperature polarization reduces the flux [
20]. By creating an air gap between the membrane and the cooling section (
Figure 1b), an air gap MD (AGMD) suppresses heat conduction through the membrane [
21]. Thus, the heat efficiency is higher than DCMD. However, the vapor flux is lower than that of DCMD, because of a lower vapor pressure difference. To speed up a diffusion transfer of vapor, a sweep gas MD (SGMD) (
Figure 1c) and a vacuum MD (VMD) (
Figure 1d) are designed [
22,
23]. In SGMD, a sweep gas is flowed through the air gap part, while the air gap part is decompressed in VMD. Thus, by using SGMD or VMD, it is possible to achieve both high vapor flux and low heat conduction. However, VMD requires a high vacuum, and SGMD requires a large amount of dry air to be supplied.
As discussed above, while each process has merits and demerits, DCMD is chosen to recover valuable solutes from an organic solvent/water mixture because the high vapor flux can be obtained simply by flowing water that is cooler than the feed. In terms of membrane wetting, DCMD has a lower transmembrane pressure than other MD processes. Therefore, there is a high possibility that it can be operated even if the LEP decreases due to the organic solvent contained in the feed.
4. Conclusions
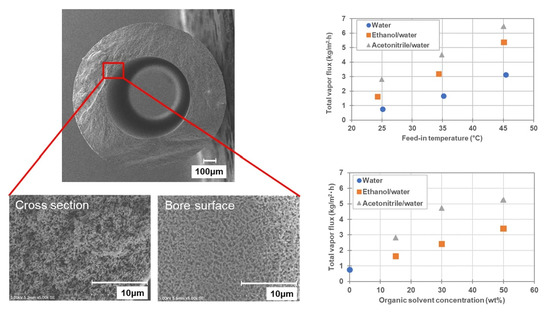
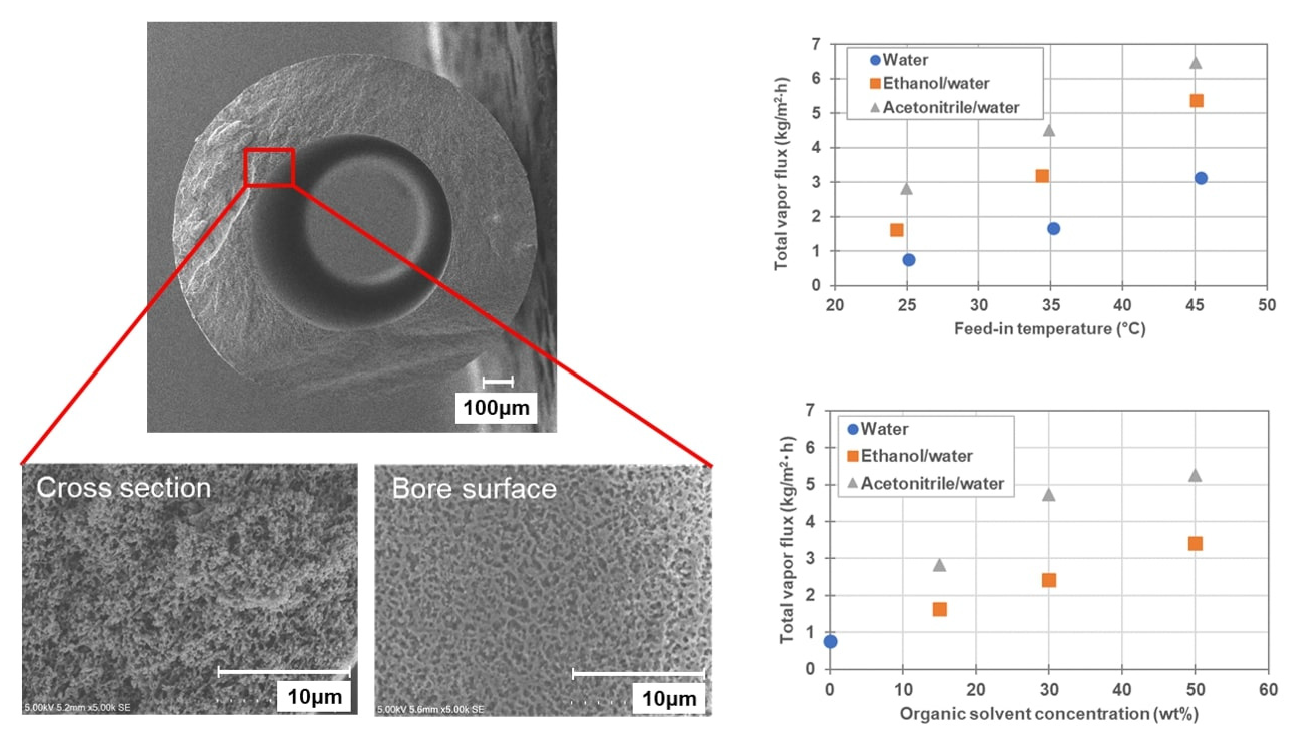
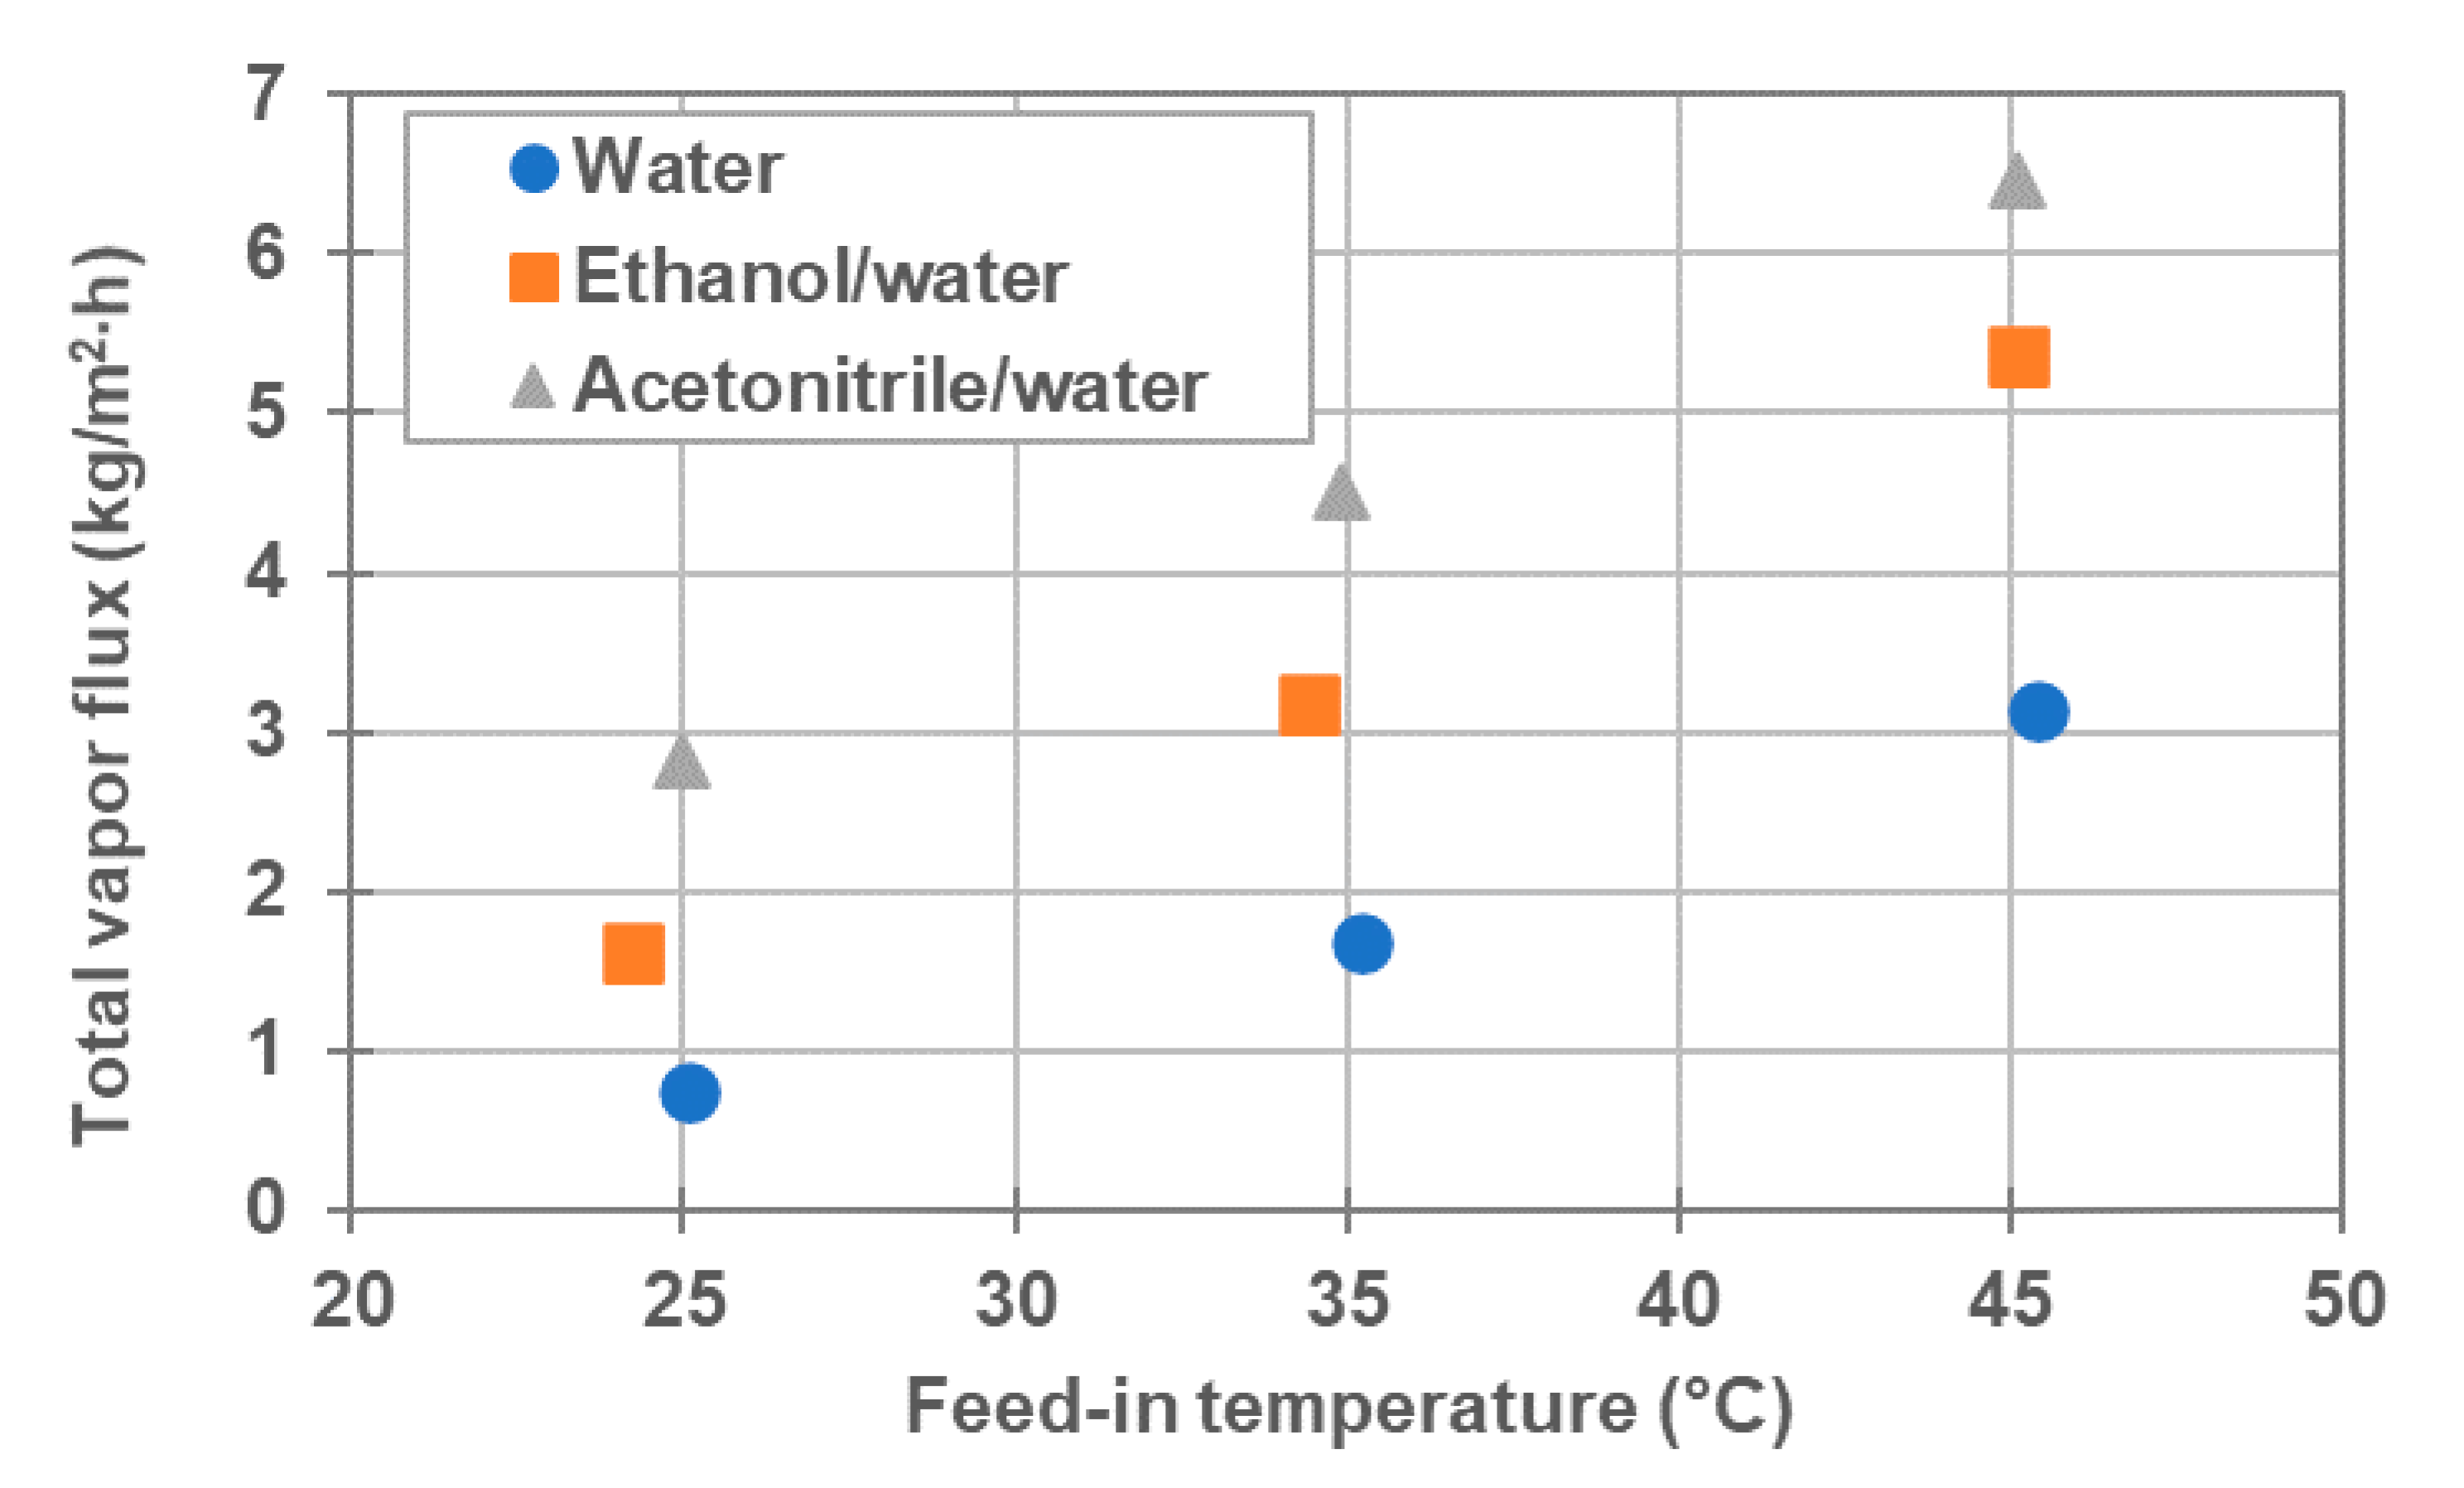
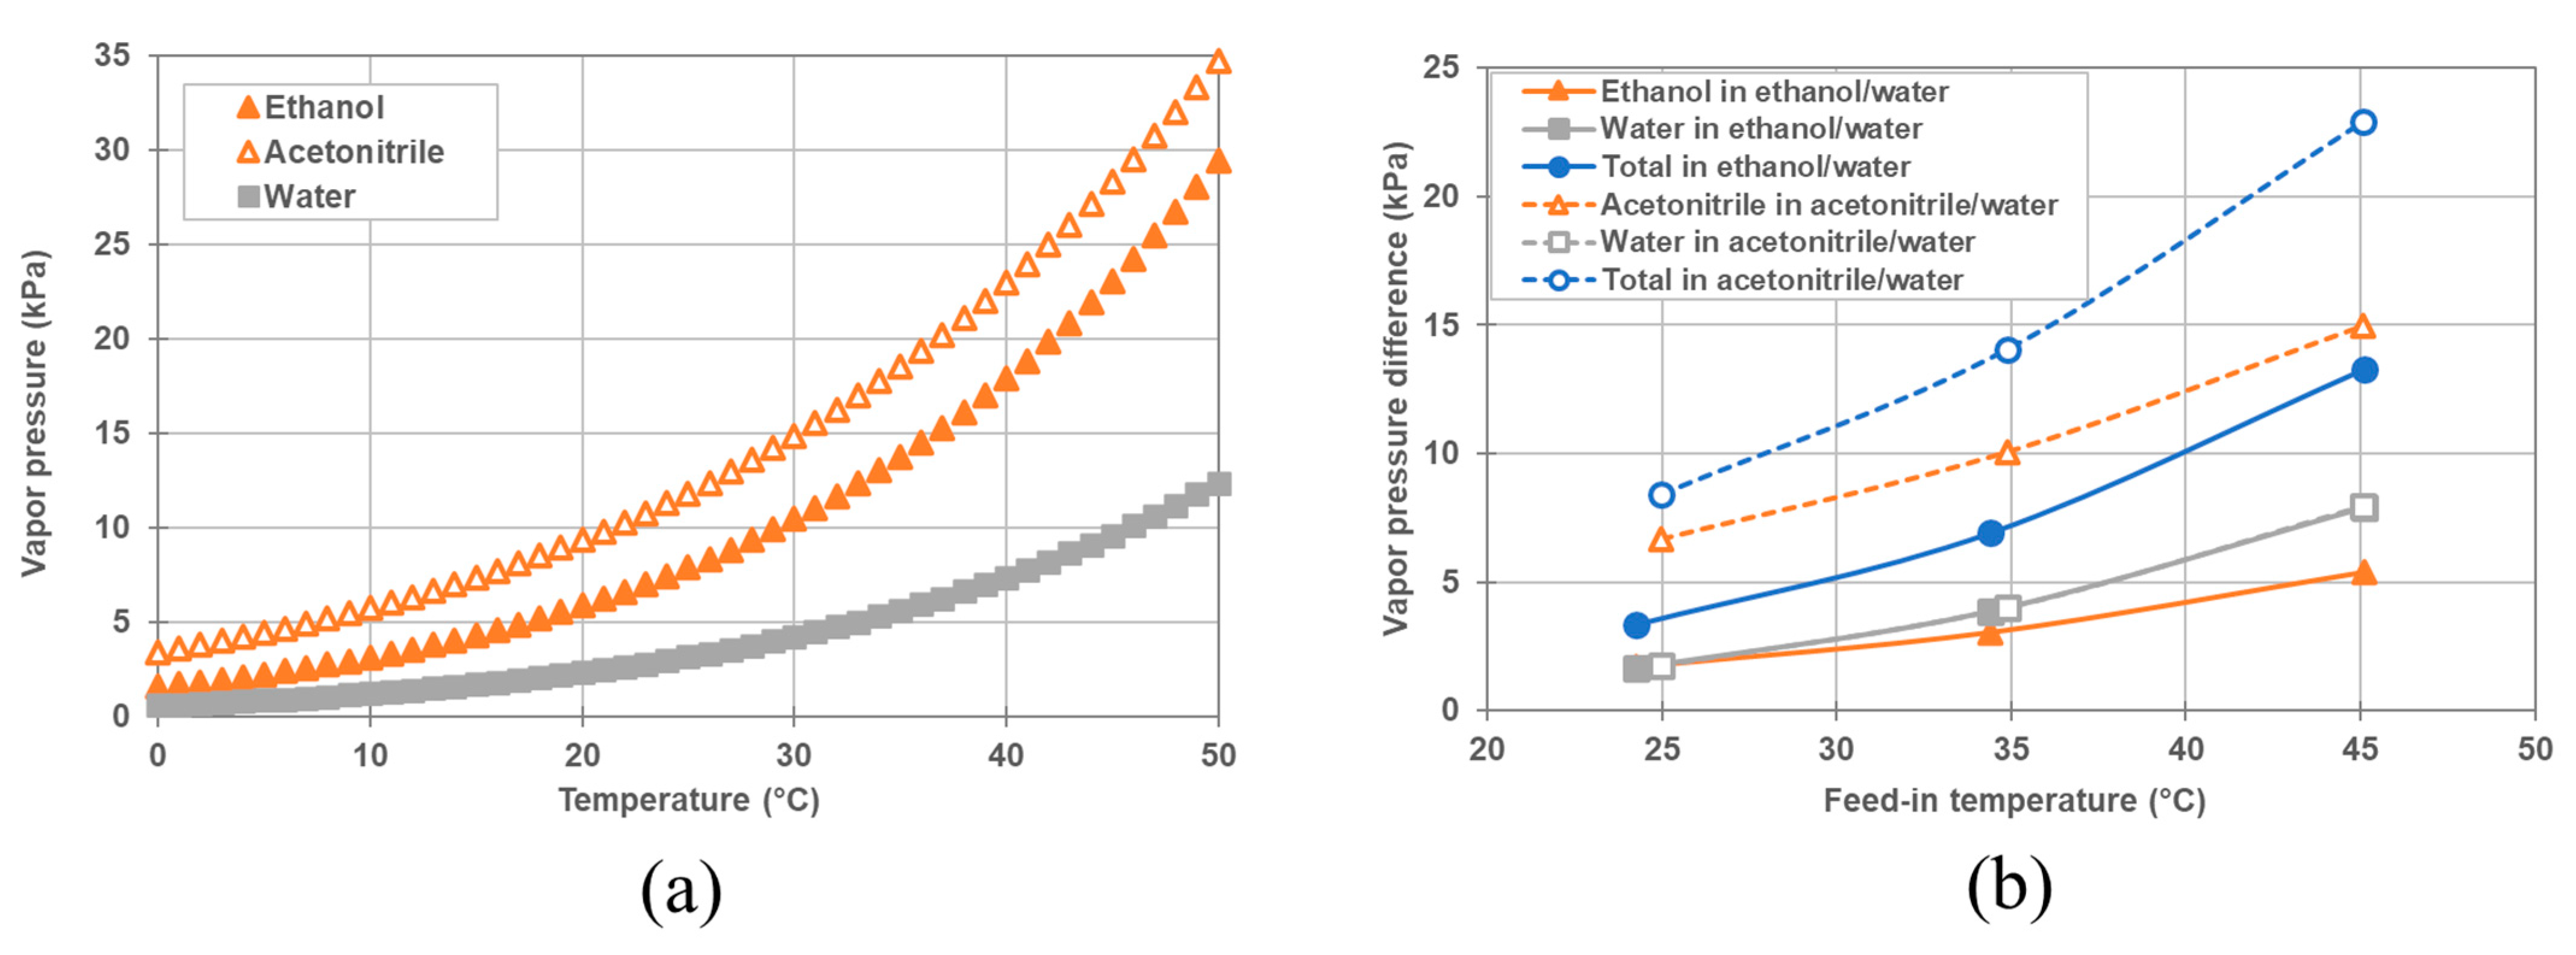
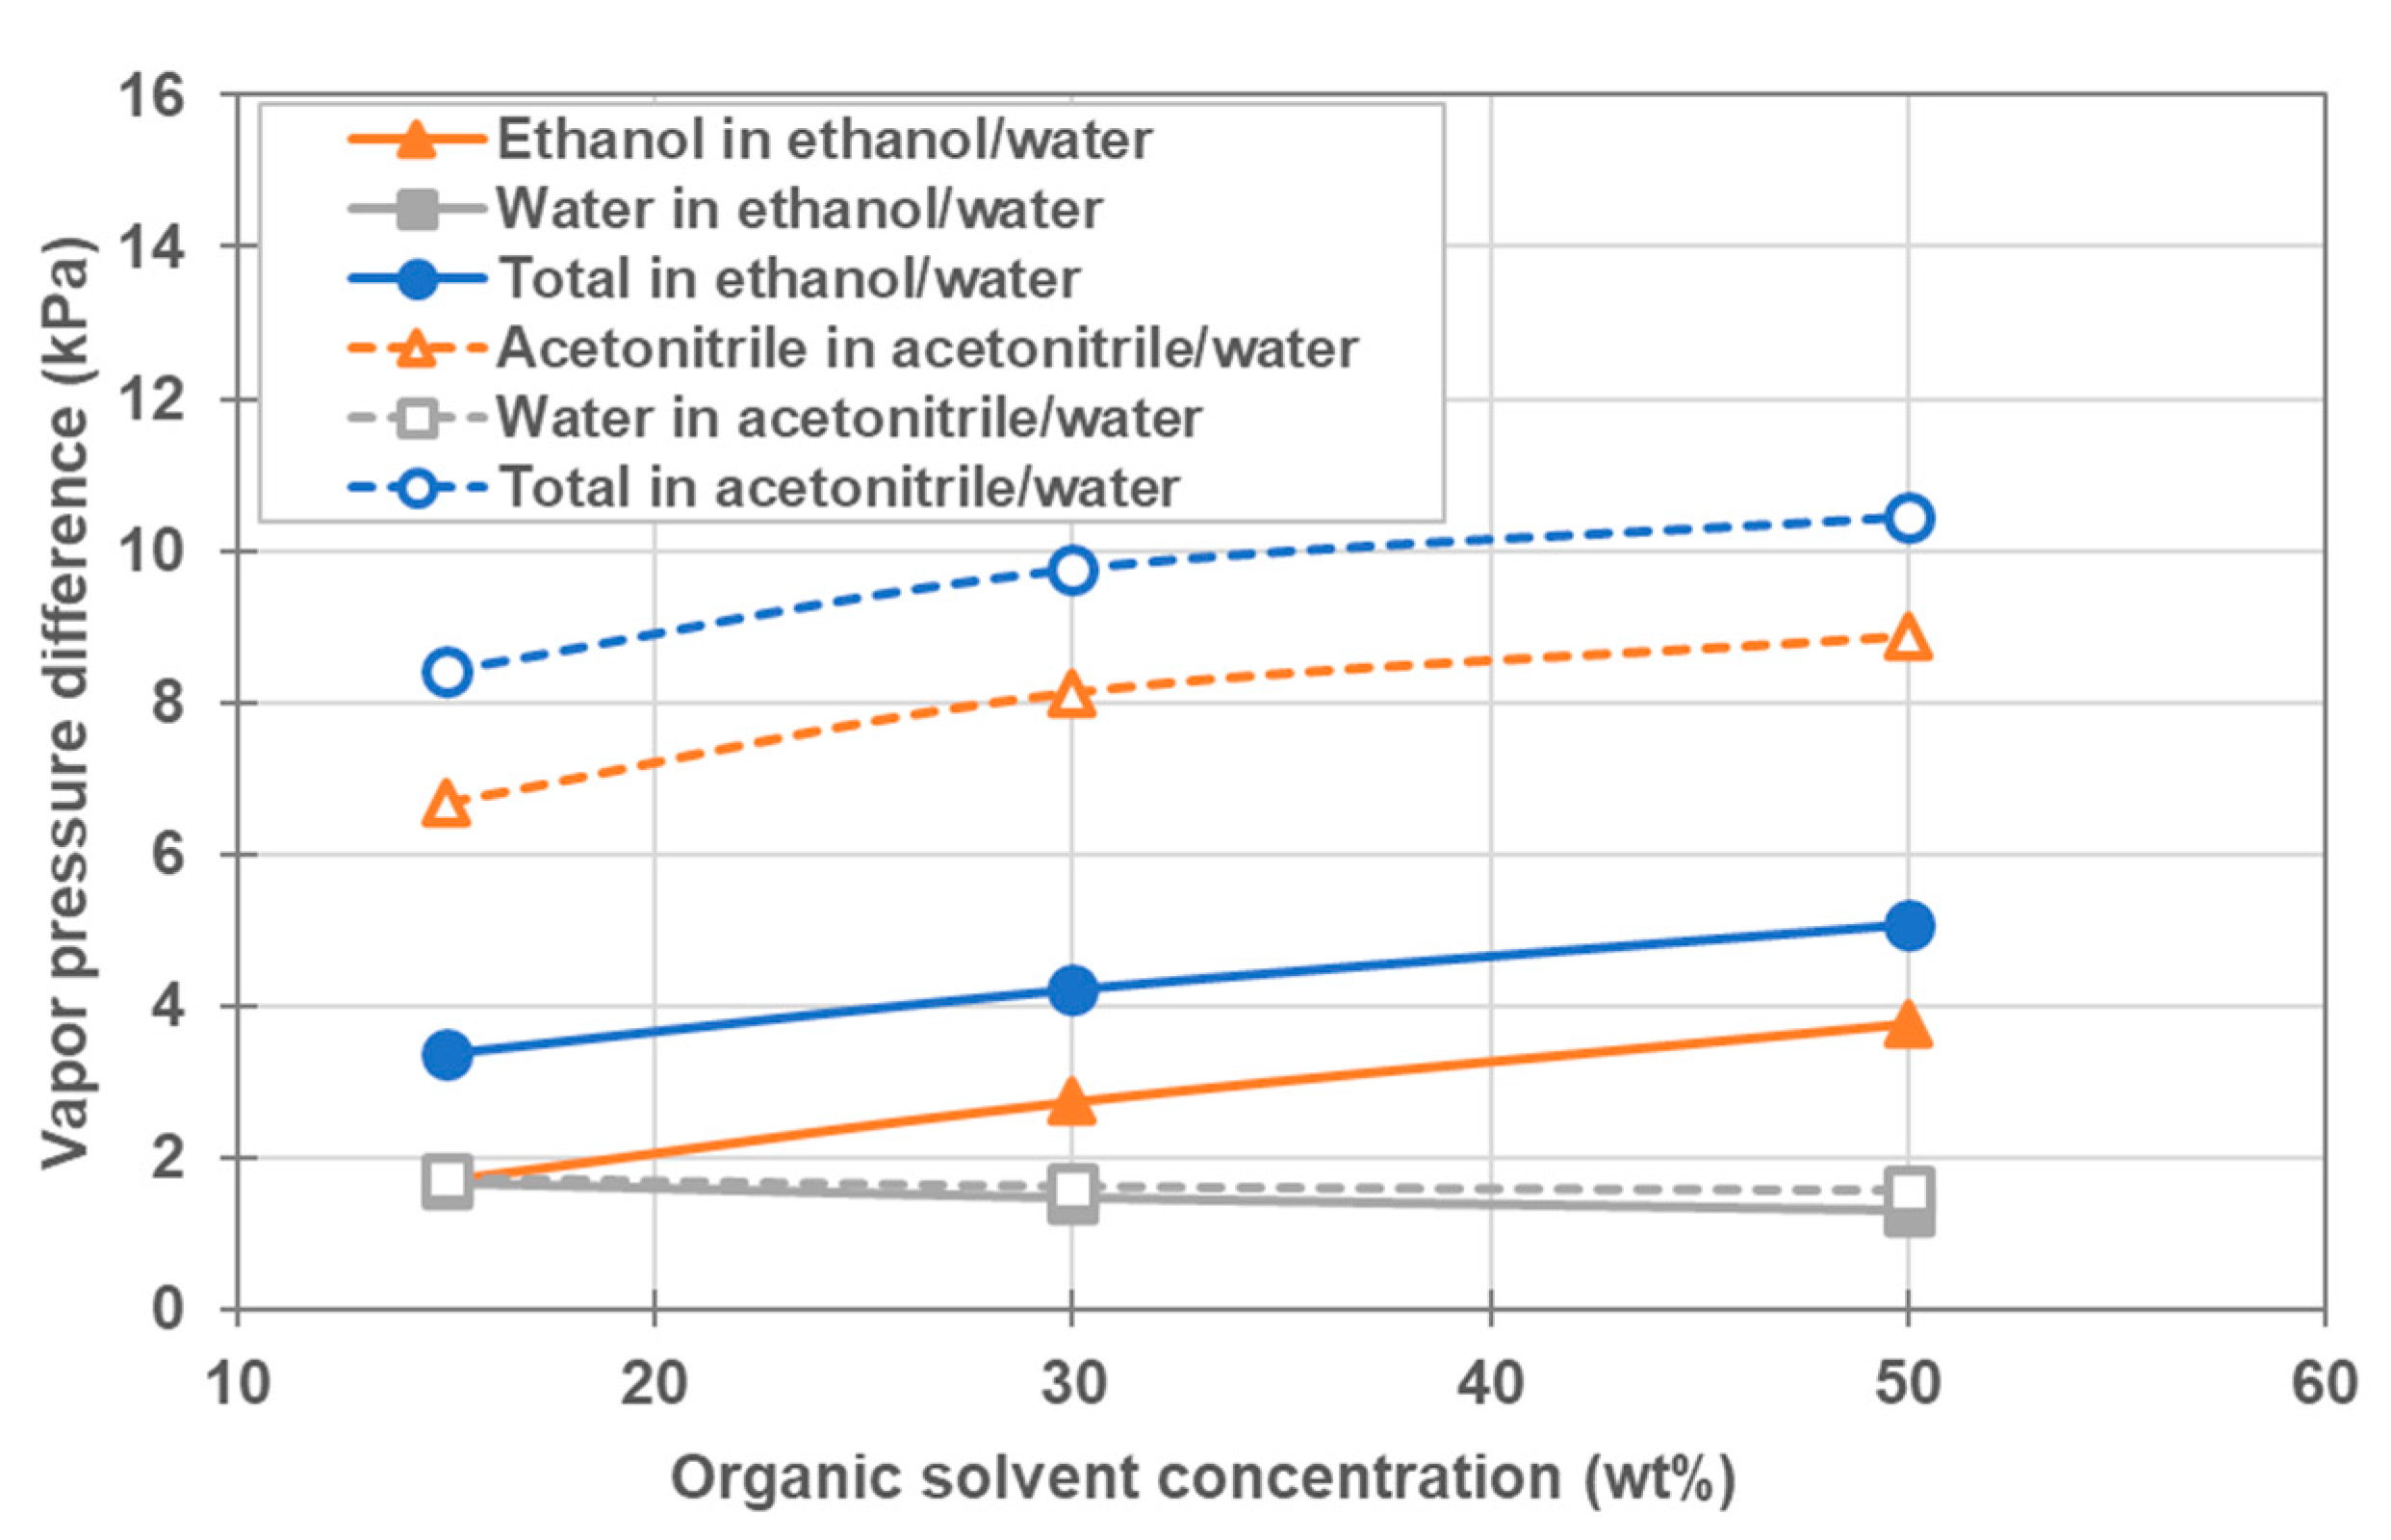
Recently, the demand for the recovery of valuable solutes from organic solvents/water mixtures has increased in various fields. Furthermore, due to the abundance of heat-sensitive valuable solutes, the demand for non-heated concentration technologies has increased. The current study investigated DCMD operation using hydrophobized PVDF HF membranes, to confirm a possibility of recovering heat-sensitive valuable solutes from organic solvents/water mixtures via MD as a non-heated process. At first, the possibility of DCMD operation at low feed temperature was evaluated using 1000 ppm NaCl aqueous solution as the feed, and it was confirmed DCMD could achieve 0.8 kg/m2·h of vapor flux even at feed and coolant temperatures of 25 °C and 10 °C, respectively. Furthermore, the NaCl retention ratio was observed to be >99.9%, indicating that it was possible to operate DCMD at low feed temperature. Subsequently, the recovery of solutes from organic solvent/water mixtures was evaluated using ethanol/water and acetonitrile/water mixtures containing 1000 ppm NaCl. As a result, it was confirmed that DCMD could be applied for the recovery of solutes from organic solvent/water mixtures without causing membrane wetting or solute leakage. The effect of feed temperature (25, 35, 45 °C) and concentration of organic solvents (15, 30, 50 wt%) were also investigated using ethanol/water and acetonitrile/water mixtures containing 1000 ppm NaCl. The total vapor flux, as well as the partial vapor flux of organic solvents simultaneously increased with the temperature and concentration of the organic solvents. These phenomena were qualitatively explained by changes in partial vapor pressure of organic solvent in the organic solvent/water mixtures. Additionally, there was no solute leakage under any of the conditions. Furthermore, investigations using SDS as a model valuable surface-active solute also demonstrated the possibility of recovering surface-active solutes from organic solvent/water mixtures via DCMD. These findings, therefore, indicate that DCMD with a hydrophobic hollow fiber membrane will be applied for the recovery of valuable solutes from organic solvent/water mixtures as a non-heated process even under harsh condition where surface active solutes are included in the feed.


