
Disturbances in White Matter Integrity in the Ultra-High-Risk Psychosis State—A Systematic Review

 , ,
, ,
Abstract
:1. Introduction
2. Materials and Methods
2.1. Literature Search
2.2. Inclusion and Exclusion Criteria
2.3. Data Extraction
2.4. Quality and Risk of Bias Assessment
3. Results
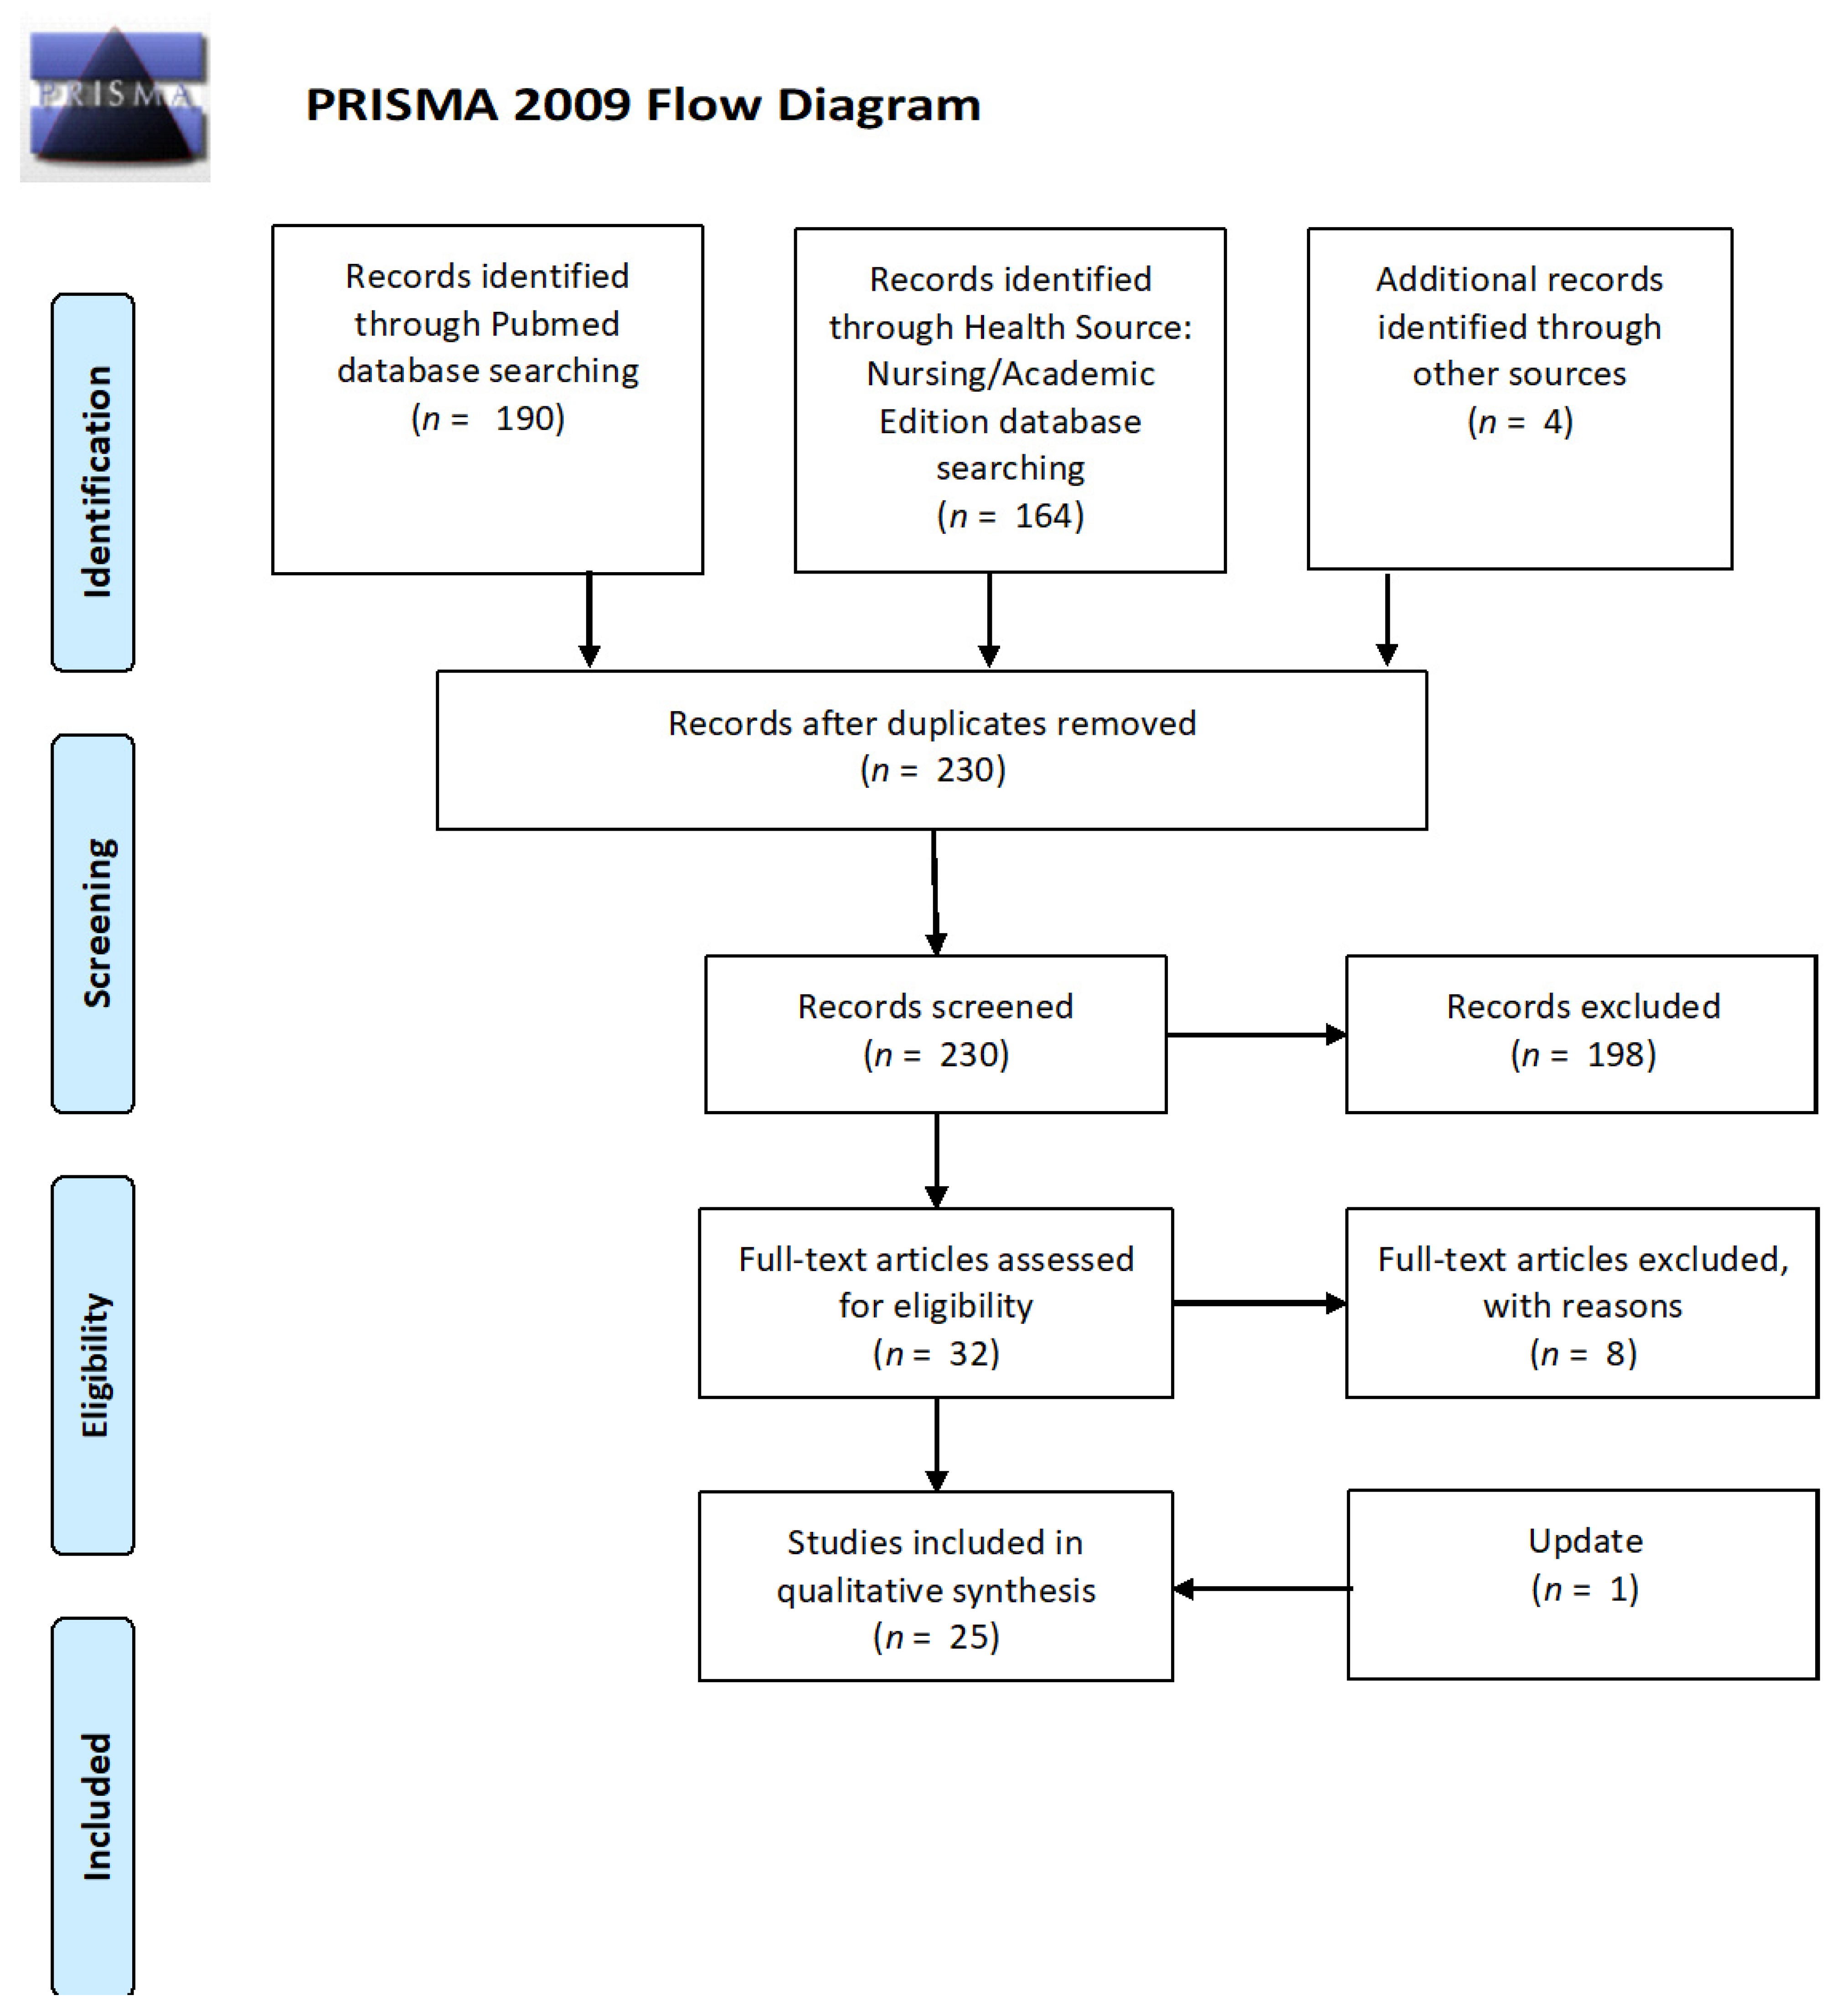
3.1. Search Results
3.1.1. Study Characteristics
3.1.2. Quality Assessment and Risk of Bias
3.2. Comparison of DTI Parameters
3.2.1. Fractional Anisotropy
3.2.2. Radial Diffusivity
3.2.3. Axial Diffusivity
3.2.4. Mean Diffusivity
3.2.5. Combination of DTI Indices
3.2.6. Other Parameters
3.3. DTI Indices and Psychopathological Symptoms
3.4. DTI and Socio-Cognitive Functioning
4. Discussion
5. Conclusions
Supplementary Materials
Author Contributions
Funding
Institutional Review Board Statement
Informed Consent Statement
Data Availability Statement
Conflicts of Interest
References
- Kendler, K.S. Kraepelin and the differential diagnosis of dementia praecox and manic-depressive insanity. Compr. Psychiatry 1986, 27, 549–558. [Google Scholar] [CrossRef]
- Bowie, C.R.; Harvey, P.D. Cognitive deficits and functional outcome in schizophrenia. Neuropsychiatr. Dis. Treat. 2006, 2, 531–536. [Google Scholar] [CrossRef] [Green Version]
- Fioravanti, M.; Bianchi, V.; Cinti, M.E. Cognitive deficits in schizophrenia: An updated metanalysis of the scientific evidence. BMC Psychiatry 2012, 12, 64. [Google Scholar] [CrossRef] [Green Version]
- Sachs, G. Facial recognition deficits and cognition in schizophrenia. Schizophr. Res. 2004, 68, 27–35. [Google Scholar] [CrossRef]
- Tyburski, E.; Pełka-Wysiecka, J.; Mak, M.; Samochowiec, A.; Bieńkowski, P.; Samochowiec, J. Neuropsychological profile of specific executive dysfunctions in patients with deficit and non-deficit schizophrenia. Front. Psychol. 2017, 8, 1–10. [Google Scholar] [CrossRef] [PubMed] [Green Version]
- Charlson, F.J.; Ferrari, A.J.; Santomauro, D.; Diminic, S.; Stockings, E.; Scott, J.G.; McGrath, J.; Whiteford, H. Global epidemiology and burden of schizophrenia: Findings from the global burden of disease study. Schizophr. Bull. 2018, 44, 1195–1203. [Google Scholar] [CrossRef] [PubMed]
- Knapp, M.; Mangalore, R.; Simon, J. The global costs of schizophrenia. Schizophr. Bull. 2004, 30, 279–293. [Google Scholar] [CrossRef] [PubMed]
- Auquier, P.; Lançon, C.; Rouillon, F.; Lader, M.; Holmes, C. Mortality in schizophrenia. Pharmacoepidemiol. Drug Saf. 2006, 15, 873–879. [Google Scholar] [CrossRef]
- McGrath, J.; Saha, S.; Chant, D.; Welham, J. Schizophrenia: A concise overview of incidence, prevalence, and mortality. Epidemiol. Rev. 2008, 30, 67–76. [Google Scholar] [CrossRef] [Green Version]
- Adamowicz, K.; Mazur, A.; Mak, M.; Samochowiec, J.; Kucharska-Mazur, J. Metabolic syndrome and cognitive functions in schizophrenia—Implementation of dietary intervention. Front. Psychiatry 2020, 11, 1–11. [Google Scholar] [CrossRef]
- Sheitman, B.; Lieberman, J. The natural history and pathophysiology of treatment resistant schizophrenia. J. Psychiatr. Res. 1998, 32, 143–150. [Google Scholar] [CrossRef]
- Yung, A.R.; McGorry, P.D.; McFarlane, C.A.; Jackson, H.J.; Patton, G.C.; Rakkar, A. Monitoring and care of young people at incipient risk of psychosis. Schizophr. Bull. 1996, 22, 283–303. [Google Scholar] [CrossRef] [Green Version]
- Addington, J.; Stowkowy, J.; Weiser, M. Screening tools for clinical high risk for psychosis. Early Interv. Psychiatry 2015, 9, 345–356. [Google Scholar] [CrossRef]
- Miller, T.J.; McGlashan, T.H.; Woods, S.W.; Stein, K.; Driesen, N.; Corcoran, C.; Hoffman, R.; Davidson, L. Symptom assessment in schizophrenic prodromal states. Psychiatr. Q. 1999, 70, 273–287. [Google Scholar] [CrossRef]
- Starkowska, A.; Tyburski, E.; Kucharska-Mazur, J.; Mak, M.; Samochowiec, J. Assessing self-reported clinical high risk symptoms: The psychometric properties of the polish version of the prodromal questionnaire-brief and a proposal for an alternative approach to scoring. Early Interv. Psychiatry 2020, 1–13. [Google Scholar] [CrossRef]
- Yung, A.R.; Yuen, H.P.; McGorry, P.D.; Phillips, L.; Kelly, D.; Dell’Olio, M.; Francey, S.M.; Cosgrave, E.M.; Killackey, E.; Stanford, C.; et al. Mapping the onset of psychosis: The comprehensive assessment of at-risk mental states. Aust. N. Z. J. Psychiatry 2005, 39, 964–971. [Google Scholar] [CrossRef]
- Gross, G.; Huber, G.; Klosterkotter, J.; Linz, M. Bonner Skala für die Beurteilung von Basissymptomen; Springer: Berlin/Heidelberg, Germany, 1987. [Google Scholar]
- Riecher-Rössler, A.; Aston, J.; Ventura, J.; Merlo, M.; Borgwardt, S.; Gschwandtner, U.; Stieglitz, R.-D. Das Basel Screening Instrument für Psychosen (BSIP): Entwicklung, Aufbau, Reliabilität und Validität. Fortschritte Neurol. Psychiatr. 2008, 76, 207–216. [Google Scholar] [CrossRef] [Green Version]
- Biomarkers Definitions Working Group. Biomarkers and surrogate endpoints: Preferred definitions and conceptual framework. Clin. Pharmacol. Ther. 2001, 69, 89–95. [Google Scholar] [CrossRef]
- Correll, C.U.; Hauser, M.; Auther, A.M.; Cornblatt, B.A. Research in people with psychosis risk syndrome: A review of the current evidence and future directions. J. Child Psychol. Psychiatry 2010, 51, 390–431. [Google Scholar] [CrossRef]
- Vitolo, E.; Tatu, M.K.; Pignolo, C.; Cauda, F.; Costa, T.; Ando’, A.; Zennaro, A. White matter and schizophrenia: A meta-analysis of voxel-based morphometry and diffusion tensor imaging studies. Psychiatry Res. Neuroimaging 2017, 270, 8–21. [Google Scholar] [CrossRef]
- Shizukuishi, T.; Abe, O.; Aoki, S. Diffusion tensor imaging analysis for psychiatric disorders. Magn. Reson. Med. Sci. 2013, 12, 153–159. [Google Scholar] [CrossRef] [PubMed] [Green Version]
- Andreasen, N.C. Schizophrenia: The fundamental questions. Brain Res. Rev. 2000, 31, 106–112. [Google Scholar] [CrossRef]
- Kelly, S.; Jahanshad, N.; Zalesky, A.; Kochunov, P.; Agartz, I.; Alloza, C.; Andreassen, O.; Arango, C.; Banaj, N.; Bouix, S.; et al. Widespread white matter microstructural differences in schizophrenia across 4322 individuals: Results from the ENIGMA Schizophrenia DTI Working Group. Mol. Psychiatry 2018, 23, 1261–1269. [Google Scholar] [CrossRef] [Green Version]
- Parnanzone, S.; Serrone, D.; Rossetti, M.C.; D’Onofrio, S.; Splendiani, A.; Micelli, V.; Rossi, A.; Pacitti, F. Alterations of cerebral white matter structure in psychosis and their clinical correlations: A systematic review of Diffusion Tensor Imaging studies. Riv. Psichiatr. 2017, 52, 49–66. [Google Scholar]
- Samartzis, L.; Dima, D.; Fusar-Poli, P.; Kyriakopoulos, M. White matter alterations in early stages of schizophrenia: A systematic review of diffusion tensor imaging studies. J. Neuroimaging 2014, 24, 101–110. [Google Scholar] [CrossRef]
- Vijayakumar, N.; Bartholomeusz, C.; Whitford, T.; Hermens, D.F.; Nelson, B.; Rice, S.; Whittle, S.; Pantelis, C.; McGorry, P.; Schäfer, M.R.; et al. White matter integrity in individuals at ultra-high risk for psychosis: A systematic review and discussion of the role of polyunsaturated fatty acids. BMC Psychiatry 2016, 16, 1–11. [Google Scholar] [CrossRef] [PubMed]
- Addington, J.; Cornblatt, B.A.; Cadenhead, K.S.; Cannon, T.D.; McGlashan, T.H.; Perkins, D.O.; Seidman, L.J.; Tsuang, M.T.; Walker, E.F.; Woods, S.W.; et al. At clinical high risk for psychosis: Outcome for nonconverters. Am. J. Psychiatry 2011, 168, 800–805. [Google Scholar] [CrossRef] [Green Version]
- Moher, D.; Liberati, A.; Tetzlaff, J.; Altman, D.G. The PRISMA Group PRISMA 2009 Flow Diagram. PLoS Med. 2009, 6, e1000097. [Google Scholar] [CrossRef]
- Chapman, L.J.; Chapman, J.P.; Raulin, M.L. Body-image aberration in schizophrenia. J. Abnorm. Psychol. 1978, 87, 399–407. [Google Scholar] [CrossRef] [PubMed]
- Eckblad, M.; Chapman, L.J. Magical ideation as an indicator of schizotypy. J. Consult. Clin. Psychol. 1983, 51, 215–225. [Google Scholar] [CrossRef]
- Tang, Y.; Pasternak, O.; Kubicki, M.; Rathi, Y.; Zhang, T.; Wang, J.; Li, H.; Woodberry, K.A.; Xu, L.; Qian, Z.; et al. Altered cellular white matter but not extracellular free water on diffusion MRI in individuals at clinical high risk for psychosis. Am. J. Psychiatry 2019, 176, 820–828. [Google Scholar] [CrossRef]
- Bloemen, O.J.N.; De Koning, M.B.; Schmitz, N.; Nieman, D.; Becker, H.E.; De Haan, L.; Dingemans, P.; Linszen, D.H.; Van Amelsvoort, T.A.M.J. White-matter markers for psychosis in a prospective ultra-high-risk cohort. Psychol. Med. 2009, 40, 1297–1304. [Google Scholar] [CrossRef]
- Carletti, F.; Woolley, J.B.; Bhattacharyya, S.; Perez-Iglesias, R.; Poli, P.F.; Valmaggia, L.; Broome, M.R.; Bramon, E.; Johns, L.; Giampietro, V.; et al. Alterations in white matter evident before the onset of psychosis. Schizophr. Bull. 2012, 38, 1170–1179. [Google Scholar] [CrossRef]
- Epstein, K.A.; Cullen, K.R.; Mueller, B.A.; Robinson, P.; Lee, S.; Kumra, S. White matter abnormalities and cognitive impairment in early-onset schizophrenia-spectrum disorders. J. Am. Acad. Child Adolesc. Psychiatry 2014, 53, 362–372.e2. [Google Scholar] [CrossRef] [Green Version]
- Fitzsimmons, J.; Rosa, P.; Sydnor, V.J.; Reid, B.E.; Makris, N.; Goldstein, J.M.; Mesholam-Gately, R.I.; Woodberry, K.; Wojcik, J.; McCarley, R.W.; et al. Cingulum bundle abnormalities and risk for schizophrenia. Schizophr. Res. 2020, 215, 385–391. [Google Scholar] [CrossRef]
- Jacobson, S.; Kelleher, I.; Harley, M.; Murtagh, A.; Clarke, M.; Blanchard, M.; Connolly, C.; O’Hanlon, E.; Garavan, H.; Cannon, M. Structural and functional brain correlates of subclinical psychotic symptoms in 11–13 year old schoolchildren. NeuroImage 2010, 49, 1875–1885. [Google Scholar] [CrossRef]
- Karlsgodt, K.H.; Niendam, T.A.; Bearden, C.E.; Cannon, T.D. White matter integrity and prediction of social and role functioning in subjects at ultra-high risk for psychosis. Biol. Psychiatry 2009, 66, 562–569. [Google Scholar] [CrossRef] [Green Version]
- Katagiri, N.; Pantelis, C.; Nemoto, T.; Zalesky, A.; Hori, M.; Shimoji, K.; Saito, J.; Ito, S.; Dwyer, D.B.; Fukunaga, I.; et al. A longitudinal study investigating sub-threshold symptoms and white matter changes in individuals with an ‘at risk mental state’ (ARMS). Schizophr. Res. 2015, 162, 7–13. [Google Scholar] [CrossRef]
- Krakauer, K.; Ebdrup, B.H.; Glenthøj, B.; Raghava, J.M.; Nordholm, D.; Randers, L.; Rostrup, E.; Nordentoft, M. Patterns of white matter microstructure in individuals at ultra-high-risk for psychosis: Associations to level of functioning and clinical symptoms. Psychol. Med. 2017, 47, 2689–2707. [Google Scholar] [CrossRef]
- Krakauer, K.; Nordentoft, M.; Glenthøj, B.; Raghava, J.M.; Nordholm, D.; Randers, L.; Glenthøj, L.B.; Ebdrup, B.H.; Rostrup, E. White matter maturation during 12 months in individuals at ultra-high-risk for psychosis. Acta Psychiatr. Scand. 2017, 137, 65–78. [Google Scholar] [CrossRef]
- Kristensen, T.D.; Mandl, R.C.W.; Raghava, J.M.; Jessen, K.; Jepsen, J.R.M.; Fagerlund, B.; Glenthøj, L.B.; Wenneberg, C.; Krakauer, K.; Pantelis, C.; et al. Widespread higher fractional anisotropy associates to better cognitive functions in individuals at ultra-high risk for psychosis. Hum. Brain Mapp. 2019, 40, 5185–5201. [Google Scholar] [CrossRef] [PubMed]
- Rigucci, S.; Santi, G.; Corigliano, V.; Imola, A.; Rossi-Espagnet, C.; Mancinelli, I.; De Pisa, E.; Manfredi, G.; Bozzao, A.; Carducci, F.; et al. White matter microstructure in ultra-high risk and first episode schizophrenia: A prospective study. Psychiatry Res. Neuroimaging 2016, 247, 42–48. [Google Scholar] [CrossRef] [PubMed]
- Saito, J.; Hori, M.; Nemoto, T.; Katagiri, N.; Shimoji, K.; Ito, S.; Tsujino, N.; Yamaguchi, T.; Shiraga, N.; Aoki, S.; et al. Longitudinal study examining abnormal white matter integrity using a tract-specific analysis in individuals with a high risk for psychosis. Psychiatry Clin. Neurosci. 2017, 71, 530–541. [Google Scholar] [CrossRef]
- Straub, K.T.; Hua, J.P.; Karcher, N.R.; Kerns, J.G. Psychosis risk is associated with decreased white matter integrity in limbic network corticostriatal tracts. Psychiatry Res. Neuroimaging 2020, 301, 111089. [Google Scholar] [CrossRef] [PubMed]
- Wang, C.; Ji, F.; Hong, Z.; Poh, J.; Krishnan, R.; Lee, J.; Rekhi, G.; Keefe, R.S.E.; Adcock, R.A.; Wood, S.J.; et al. Disrupted salience network functional connectivity and white-matter microstructure in persons at risk for psychosis: Findings from the LYRIKS study. Psychol. Med. 2016, 46, 2771–2783. [Google Scholar] [CrossRef] [Green Version]
- Bakker, G.; Caan, M.W.A.; Schluter, R.S.; Bloemen, O.J.N.; Alves, F.D.S.; De Koning, M.B.; Boot, E.; Vingerhoets, W.A.M.; Nieman, D.; De Haan, L.; et al. Distinct white-matter aberrations in 22q11.2 deletion syndrome and patients at ultra-high risk for psychosis. Psychol. Med. 2016, 46, 2299–2311. [Google Scholar] [CrossRef]
- Von Hohenberg, C.C.; Pasternak, O.; Kubicki, M.; Ballinger, T.; Vu, M.-A.; Swisher, T.; Green, K.; Giwerc, M.; Dahlben, B.; Goldstein, J.M.; et al. White matter microstructure in individuals at clinical high risk of psychosis: A whole-brain diffusion tensor imaging study. Schizophr. Bull. 2013, 40, 895–903. [Google Scholar] [CrossRef]
- Mittal, V.A.; Dean, D.J.; Bernard, J.A.; Orr, J.; Pelletier-Baldelli, A.; Carol, E.E.; Gupta, T.; Turner, J.; Leopold, D.R.; Robustelli, B.L.; et al. Neurological soft signs predict abnormal cerebellar-thalamic tract development and negative symptoms in adolescents at high risk for psychosis: A longitudinal perspective. Schizophr. Bull. 2014, 40, 1204–1215. [Google Scholar] [CrossRef]
- Peters, B.D.; De Haan, L.; Dekker, N.; Blaas, J.; Becker, H.E.; Dingemans, P.M.; Akkerman, E.M.; Majoie, C.B.; Van Amelsvoort, T.; Heeten, G.J.D.; et al. White matter fibertracking in first-episode schizophrenia, schizoaffective patients and subjects at ultra-high risk of psychosis. Neuropsychobiology 2008, 58, 19–28. [Google Scholar] [CrossRef] [PubMed]
- Peters, B.D.; Dingemans, P.M.; Dekker, N.; Blaas, J.; Akkerman, E.; van Amelsvoort, T.A.; Majoie, C.B.; Heeten, G.J.D.; Linszen, D.H.; de Haan, L. White matter connectivity and psychosis in ultra-high-risk subjects: A diffusion tensor fiber tracking study. Psychiatry Res. Neuroimaging 2010, 181, 44–50. [Google Scholar] [CrossRef]
- Whitford, T.J.; Oestreich, L.K.L.; Ford, J.M.; Roach, B.J.; Loewy, R.L.; Stuart, B.K.; Mathalon, D.H. Deficits in cortical suppression during vocalization are associated with structural abnormalities in the arcuate fasciculus in early illness schizophrenia and clinical high risk for psychosis. Schizophr. Bull. 2017, 44, 1312–1322. [Google Scholar] [CrossRef]
- Schmidt, A.; Lenz, C.; Smieskova, R.; Harrisberger, F.; Walter, A.; Riecher-Rössler, A.; Simon, A.; Lang, U.E.; McGuire, P.; Fusar-Poli, P.; et al. Brain diffusion changes in emerging psychosis and the impact of state-dependent psychopathology. Neurosignals 2015, 23, 71–83. [Google Scholar] [CrossRef] [PubMed]
- Bernard, J.; Orr, J.; Mittal, V. Abnormal hippocampal–thalamic white matter tract development and positive symptom course in individuals at ultra-high risk for psychosis. NPJ Schizophr. 2015, 1, 15009. [Google Scholar] [CrossRef]
- León-Ortiz, P.; Reyes-Madrigal, F.; Kochunov, P.; Gómez-Cruz, G.; Moncada-Habib, T.; Malacara, M.; Mora-Durán, R.; Rowland, L.M.; De La Fuente-Sandoval, C. White matter alterations and the conversion to psychosis: A combined diffusion tensor imaging and glutamate 1H MRS study. Schizophr. Res. 2020. [Google Scholar] [CrossRef] [PubMed]
- Kay, S.R.; Fiszbein, A.; Opler, L.A. The positive and negative syndrome scale (PANSS) for schizophrenia. Schizophr. Bull. 1987, 13, 261–276. [Google Scholar] [CrossRef]
- Andreasen, N.C. The scale for the assessment of negative symptoms (SANS): Conceptual and theoretical foundations. Br. J. psychiatry 1989, 1989, 49–58. [Google Scholar] [CrossRef]
- Bernard, J.A.; Orr, J.; Mittal, V. Cerebello-thalamo-cortical networks predict positive symptom progression in individuals at ultra-high risk for psychosis. NeuroImage Clin. 2017, 14, 622–628. [Google Scholar] [CrossRef]
- Jones, S.H.; Thornicroft, G.; Coffey, M.; Dunn, G. A brief mental health outcome scale. Br. J. Psychiatry 1995, 166, 654–659. [Google Scholar] [CrossRef]
- Goldman, H.H.; Skodol, A.; Lave, T.R. Revising axis V for DSM-IV: A review of measures of social functioning. Am. J. Psychiatry 1992, 149, 1148–1156. [Google Scholar] [CrossRef]
- Wilson, B.A.; Alderman, N.; Burgess, P.W.; Emslie, H.; Evans, J.J. Behavioural Assessment of the Dysexecutive Syndrome; Thames Val Test Co.: Bury St Edmunds, UK; Cognição: Rio de Janeiro, Brazil, 1996. [Google Scholar]
- Buchanan, R.W.; Heinrichs, D.W. The neurological evaluation scale (NES): A structured instrument for the assessment of neurological signs in schizophrenia. Psychiatry Res. 1989, 27, 335–350. [Google Scholar] [CrossRef]
- Podwalski, P.; Szczygieł, K.; Tyburski, E.; Sagan, L.; Misiak, B.; Samochowiec, J. Magnetic resonance diffusion tensor imaging in psychiatry: A narrative review of its potential role in diagnosis. Pharmacol. Rep. 2021, 73, 43–56. [Google Scholar] [CrossRef]
- Kennedy, K.; Raz, N. Aging white matter and cognition: Differential effects of regional variations in diffusion properties on memory, executive functions, and speed. Neuropsychology 2009, 47, 916–927. [Google Scholar] [CrossRef] [PubMed] [Green Version]
- Madden, D.J.; Bennett, I.J.; Song, A.W. Cerebral white matter integrity and cognitive aging: Contributions from diffusion tensor imaging. Neuropsychol. Rev. 2009, 19, 415–435. [Google Scholar] [CrossRef] [PubMed] [Green Version]
- Fusar-Poli, P.; Bonoldi, I.; Yung, A.R.; Borgwardt, S.; Kempton, M.J.; Valmaggia, L.; Barale, F.; Caverzasi, E.; McGuire, P. Predicting psychosis. Arch. Gen. Psychiatry 2012, 69, 220–229. [Google Scholar] [CrossRef] [Green Version]
- Pettersson-Yeo, W.; Benetti, S.; Marquand, A.; Acqua, F.D.; Williams, S.C.R.; Allen, P.; Prata, D.; McGuire, P.; Mechelli, A. Using genetic, cognitive and multi-modal neuroimaging data to identify ultra-high-risk and first-episode psychosis at the individual level. Psychol. Med. 2013, 43, 2547–2562. [Google Scholar] [CrossRef] [Green Version]
- Camchong, J.; Lim, K.O.; Sponheim, S.R.; Iii, A.W.M.; Macdonald, A.W. Frontal white matter integrity as an endophenotype for schizophrenia: Diffusion tensor imaging in monozygotic twins and patients’ nonpsychotic relatives. Front. Hum. Neurosci. 2009, 3, 35. [Google Scholar] [CrossRef] [PubMed] [Green Version]
- Domen, P.A.; Michielse, S.; Gronenschild, E.; Habets, P.; Roebroeck, A.; Schruers, K.; Van Os, J.; Marcelis, M. Microstructural white matter alterations in psychotic disorder: A family-based diffusion tensor imaging study. Schizophr. Res. 2013, 146, 291–300. [Google Scholar] [CrossRef] [PubMed]
- Hoptman, M.J.; Nierenberg, J.; Bertisch, H.C.; Catalano, D.; Ardekani, B.; Branch, C.; DeLisi, L. A DTI study of white matter microstructure in individuals at high genetic risk for schizophrenia. Schizophr. Res. 2008, 106, 115–124. [Google Scholar] [CrossRef]
- Maniega, S.M.; Lymer, G.K.S.; Bastin, M.; Marjoram, D.; Job, D.; Moorhead, T.W.J.; Owens, D.G.; Johnstone, E.C.; McIntosh, A.M.; Lawrie, S.M. A diffusion tensor MRI study of white matter integrity in subjects at high genetic risk of schizophrenia. Schizophr. Res. 2008, 106, 132–139. [Google Scholar] [CrossRef]
- Koivukangas, J.; Björnholm, L.; Tervonen, O.; Miettunen, J.; Nordström, T.; Kiviniemi, V.; Mäki, P.; Jääskeläinen, E.; Mukkala, S.; Moilanen, I.; et al. White matter structure in young adults with familial risk for psychosis—The Oulu Brain and Mind Study. Psychiatry Res. Neuroimaging 2015, 233, 388–393. [Google Scholar] [CrossRef] [PubMed]
- Bopp, M.H.A.; Zöllner, R.; Jansen, A.; Dietsche, B.; Krug, A.; Kircher, T.T. White matter integrity and symptom dimensions of schizophrenia: A diffusion tensor imaging study. Schizophr. Res. 2017, 184, 59–68. [Google Scholar] [CrossRef] [PubMed]
- Chawla, N.; Deep, R.; Khandelwal, S.K.; Garg, A. Reduced integrity of superior longitudinal fasciculus and arcuate fasciculus as a marker for auditory hallucinations in schizophrenia: A DTI tractography study. Asian J. Psychiatry 2019, 44, 179–186. [Google Scholar] [CrossRef] [PubMed]
- McCarthy-Jones, S.; Oestreich, L.K.; Whitford, T.J. Reduced integrity of the left arcuate fasciculus is specifically associated with auditory verbal hallucinations in schizophrenia. Schizophr. Res. 2015, 162, 1–6. [Google Scholar] [CrossRef] [PubMed] [Green Version]
- Fusar-Poli, P.; Cappucciati, M.; Borgwardt, S.; Woods, S.W.; Addington, J.; Nelson, B.; Nieman, D.; Stahl, D.R.; Rutigliano, G.; Riecher-Rössler, A.; et al. Heterogeneity of psychosis risk within individuals at clinical high risk. JAMA Psychiatry 2016, 73, 113–118. [Google Scholar] [CrossRef] [PubMed]
- Fusar-Poli, P.; Deste, G.; Smieskova, R.; Barlati, S.; Yung, A.R.; Howes, O.; Stieglitz, R.-D.; Vita, A.; McGuire, P.; Borgwardt, S. Cognitive functioning in prodromal psychosis. Arch. Gen. Psychiatry 2012, 69, 562–571. [Google Scholar] [CrossRef] [PubMed]
- Chan, C.T.; Abdin, E.; Subramaniam, M.; Tay, S.A.; Lim, L.K.; Verma, S. Two-year clinical and functional outcomes of an Asian cohort at ultra-high risk of psychosis. Front. Psychiatry 2019, 9, 758. [Google Scholar] [CrossRef] [PubMed] [Green Version]
- Zhang, T.; Xu, L.; Tang, X.; Wei, Y.; Hu, Q.; Hu, Y.; Cui, H.; Tang, Y.; Hui, L.; Li, C.; et al. Real-world effectiveness of antipsychotic treatment in psychosis prevention in a 3-year cohort of 517 individuals at clinical high risk from the SHARP (ShangHai At Risk for Psychosis). Aust. N. Z. J. Psychiatry 2020, 54, 696–706. [Google Scholar] [CrossRef]
- O’Donoghue, B.; Nelson, B.; Yuen, H.P.; Lane, A.; Wood, S.; Thompson, A.; Lin, A.; McGorry, P.; Yung, A.R. Social environmental risk factors for transition to psychosis in an Ultra-High Risk population. Schizophr. Res. 2015, 161, 150–155. [Google Scholar] [CrossRef]
- Mohammad, S.A.; Sakr, H.M.; Bondok, S.M.Y.; Mahmoud, D.A.M.; Azzam, H.M.; Effat, S. Fronto-temporal connectivity in never-medicated patients with first-episode schizophrenia: A DTI study. Egypt. J. Radiol. Nucl. Med. 2016, 47, 255–262. [Google Scholar] [CrossRef] [Green Version]
- Szeszko, P.R.; Tan, E.T.; Uluğ, A.M.; Kingsley, P.B.; Gallego, J.A.; Rhindress, K.; Malhotra, A.K.; Robinson, D.G.; Marinelli, L. Investigation of superior longitudinal fasciculus fiber complexity in recent onset psychosis. Prog. Neuro-Psychopharmacol. Biol. Psychiatry 2018, 81, 114–121. [Google Scholar] [CrossRef]
- Johns, L.C.; van Os, J. The continuity of psychotic experiences in the general population. Clin. Psychol. Rev. 2001, 21, 1125–1141. [Google Scholar] [CrossRef]
- Nuevo, R.; Chatterji, S.; Verdes, E.; Naidoo, N.; Arango, C.; Ayuso-Mateos, J.L. The continuum of psychotic symptoms in the general population: A cross-national study. Schizophr. Bull. 2012, 38, 475–485. [Google Scholar] [CrossRef] [Green Version]
- Fusar-Poli, P.; Schultze-Lutter, F.; Cappucciati, M.; Rutigliano, G.; Bonoldi, I.; Stahl, D.; Borgwardt, S.; Riecher-Rössler, A.; Addington, J.; Perkins, D.O.; et al. The dark side of the moon: Meta-analytical impact of recruitment strategies on risk enrichment in the clinical high risk state for psychosis. Schizophr. Bull. 2016, 42, 732–743. [Google Scholar] [CrossRef]
- Wiltink, S.; Velthorst, E.; Nelson, B.; McGorry, P.M.; Yung, A.R. Declining transition rates to psychosis: The contribution of potential changes in referral pathways to an ultra-high-risk service. Early Interv. Psychiatry 2013, 9, 200–206. [Google Scholar] [CrossRef]
- Andreasen, N.C.; Nopoulos, P.; Magnotta, V.; Pierson, R.; Ziebell, S.; Ho, B.-C. Progressive brain change in schizophrenia: A Prospective longitudinal study of first-episode schizophrenia. Biol. Psychiatry 2011, 70, 672–679. [Google Scholar] [CrossRef] [Green Version]
- Peters, B.D.; Karlsgodt, K. White matter development in the early stages of psychosis. Schizophr. Res. 2015, 161, 61–69. [Google Scholar] [CrossRef] [Green Version]
- Nc, A. The lifetime trajectory of schizophrenia and the concept of neurodevelopment. Dialogues Clin. Neurosci. 2010, 12, 409–415. [Google Scholar] [CrossRef]
- Leung, A.; Chue, P. Sex differences in schizophrenia, a review of the literature. Acta Psychiatr. Scand. 2000, 401, 3–38. [Google Scholar] [CrossRef]
- Shahab, S.; Stefanik, L.; Foussias, G.; Lai, M.-C.; Anderson, K.K.; Voineskos, A.N. Sex and diffusion tensor imaging of white matter in schizophrenia: A systematic review plus meta-analysis of the corpus callosum. Schizophr. Bull. 2017, 44, 203–221. [Google Scholar] [CrossRef] [Green Version]
- Szeszko, P.R.; Robinson, D.G.; Ikuta, T.; Peters, B.D.; Gallego, J.; Kane, J.; Malhotra, A.K. White matter changes associated with antipsychotic treatment in first-episode psychosis. Neuropsychopharmacology 2014, 39, 1324–1331. [Google Scholar] [CrossRef] [Green Version]


| No. | Authors | Sample | Mean Age | Sex (M/F) | UHR Diagnostic Tool | DTI Parameters (Field Strength, TR—Repetition Time, TE—Echo Time, Number of Slices, Matrix Size, Voxel Size) | Motion Control Reported (Y—Yes, N—No) | Type of Study | WM Alterations UHR vs. HC | WM Association with Psychopathology |
|---|---|---|---|---|---|---|---|---|---|---|
| 1 | Peters et al., 2008 | 10 UHR 10 HC | 21.2 ± 3.0 21.1 ± 2.8 | 10/0 10/0 | SIPS, 2 BS | 3 T; TE = 94 ms, TR = 4831—6248 ms image matrix 256 × 256, resolution 3 × 3.5 × 2.2 mm3 | N | Cross-sectional | No significant differences in FA | |
| 2 | Karlsgodt et al., 2009 | 36 UHR 25 HC | 17.02 ± 3.37 17.96 ± 3.40 | 27/9 12/13 | SIPS | 1.5 T; TR = 9.5 s, TE = 77 ms, 75 contiguous 2 mm slices, matrix 128 × 96, voxel size 2 × 2 × 2 mm3 | Y | Longitudinal | ↓FA in SLF (fronto-parietal junction) no age-related ↑ FA in hippocampus (temporal lobe) or ILF | Correlation between FA in right ILF and right hippocampus and negative symptoms, but no positive symptoms ↓ FA in the hippocampus and ILF was a predictor of deterioration in social functioning |
| 3 | Peters et al., 2010 | 17 UHR 7 UHR-P 10 UHR-NP 10 HC | 22.6 ± 3.9 21.2 ± 3.2 21.1 ± 2.8 | 7/0 10/0 10/0 | SIPS, 2 BS | 3 T; TR = 8872 ms, TE = 51 ms, 48 continuous slices, slice thickness 3 mm, acquisition matrix 112 × 112; voxel size 2 × 2 × 3 mm3 | N | Longitudinal | No significant differences in FA | |
| 4 | Bloemen et al., 2010 | 37 UHR 10 UHR-P 27 UHR-NP 10 HC | 20.7 ± 4.3 18.9 ± 4.0 22.7 ± 3.9 | 8/2 18/9 8/2 | SIPS | 3 T, 48 continuous 3 mm slices, 2 × 2 × 3 mm3 | N | Longitudinal | ↓ FA bilaterally in the superior frontal lobes (SLF, ILF, IFOF) UHR-P vs. UHR-NP: ↓ FA laterally to the right putamen (in UF, IFOF, SLF) ↓ FA in the left superior temporal lobe (SLF, IFO, ILF) ↑ FA in the left medial temporal lobe (PTR, IFO, ILF) | Lower FA in the right upper temporal lobe correlated with greater positive symptom severity Lower FA in the left medial temporal lobe was associated with greater positive symptom severity in UHR-P |
| 5 | Jacobson et al., 2010 | 11 UHR 14 HC | 12.2 ± 0.6 12.5 ± 0.4 | 4/7 3/11 | APSS, SIPS | 3 T; TR = 12,343 ms, TE = 52 ms, matrix size 150 mm, voxel size 0.9 × 0.9 × 0.9 mm3 | Y | Cross-sectional | ↓ FA in IFOF ↓ FA in the CG (left parahippocampal gyrus) ↓ FA in ILF (left superior temporal gyrus) | |
| 6 | Carletti et al., 2012 | 32 UHR 8 UHR-P 24 UHR-NP 32 HC | 23.4 ± 3.8 25.9 ± 5 | 19/13 28/5 | CAARMS | 1.5 T; RT = 15 R-R intervals; TE = 107 ms; 60 contiguous 2.5 mm slices, matrix size 96 × 96, voxel size 1.875 × 1.875 × 2.5 mm3 | Y | Longitudinal | ↓ FA in left SLF, ILF, IFOF, PTR, retrolenticular IC, splenium and body of CC, in the left posterior and superior corona radiata ↓ FA in the right EC, retrolenticular part of the right IC, right posterior corona radiata ↑ RD in the right inferior cerebellar peduncle, bilaterally the medial lemniscus, in the right corticospinal tract, in the middle cerebellar peduncle, superior cerebellar peduncle, cerebral peduncle, left UF, left ILF, left IFOF, bilateral EC, right IC, retrolenticular left IC, right IFOF, bilateral PTR, splenium and body of CC, bilateral SLF, posterior and superior corona radiata ↓ AD in the middle cerebellar peduncle, left corticospinal tract ↑ AD in the right UF, right EC, retrolenticular part of the right IC, right fornix, right ILF and IFOF, splenium and body of CC No significant baseline differences between UHR-P and UHR-NP After 28 months: ↓ FA in UHR-P versus UHR-NP in the left anterior limb of the IC, left part of corona radiata, frontal part of CC | |
| 7 | Mittal et al., 2014 | 33 UHR 35 HC | 18.52 ± 2.06 17.77 ± 2.71 | 20/13 15/20 | SIPS | 3 T; TR = 9600 ms; TE = 86 mm; 72 slices; voxel size 2 × 2 × 2 mm3 | Y | Longitudinal | No significant baseline differences in the cerebellothalamic tracts ↓ FA in the cerebellar-thalamic tracts after 12 months (in HC: ↑ FA) | UHR: significantly more neurological soft signs |
| 8 | Epstein et al., 2014 | 21 UHR 55 HC | 16.1 ± 3.3 16.5 ± 2.6 | 18/3 27/28 | SIPS | 3 T; TR = 8500 ms, TE = 98 ms, 64 slices, voxel size = 2 × 2 × 2 mm3 | Y | Cross-sectional | ↓FA bilaterally in the corticospinal tract, ILF, IFOF | UHR: neurocognitive deficits restricted to executive function and motor dexterity, less severe than in schizophrenia Lower FA in the left ILF and IFOF correlated with poorer cognitive performance |
| 9 | von Hohenberg et al., 2014 | 28 UHR 1 UHR-P 27 UHR-NP 34 HC | 20.6 ± 3.9 20.4 ± 4.0 | 14/10 16/18 | SOPS, BSABS | 3 T; TR = 9400 ms, TE = 84 ms, 75 contiguous axial slices matrix size = 128 × 128, voxel resolution 2 × 2 × 2 mm3 | Y | Longitudinal | Changes in RD and MD lateralized to the right: ↑ MD in the right hemisphere (mainly SLF, superior and posterior corona radiata, PTR, posterior IC, splenium and body of CC, fornix, but also anterior limb of IC and cerebral peduncle) ↑ RD in PTR ↓ FA not statistically significant No significant changes in AD | |
| 10 | Bernard et al., 2015 | 26 UHR 21 HC | 18.73 ± 1.78 17.71 ± 2.65 | 17/9 8/13 | SIPS | 3 T; TR = 9600 ms; TE = 86 mm; 72 slices; voxel size 2 × 2 × 2 mm3 | Y | Longitudinal | Higher baseline FA in UHR in the hippocampal-thalamic tract FA changes not statistically significant (↓ FA in left hemisphere after 12 months) | Higher baseline FA correlated with positive symptom severity after 12 months |
| 11 | Schmidt et al., 2015 | 28 UHR 24 HC | 25.42 ± 6.74 27.75 ± 4.59 | 18/6 10/14 | BSIP, BPRS | 3 T; TR = 9200 ms, TE = 95 ms, 54 axial slices, voxel resolution 2.5 × 2.5 × 2.5 mm3 | Y | Cross-sectional | ↑ FA in various regions of the brain; mostly right ATR, IFOF, SLF, UF, forceps major ↓ MD in various regions of the brain, esp. left SLF, ILF, IFOF, right ILF | FA positive correlation with (+) symptom severity in right SLF |
| 12 | Katagiri et al., 2015 | 41 UHR 7 UHR-P 34 UHR-NP 11 UHR-NN 23 UHR-NA 16 HC | 20.71 ± 5.53 24.18 ± 7.88 23.35 ± 6.49 23.19 ± 2.86 | 1/6 9/25 8/8 | SIPS/ SOPS | 3 T; TR = 7668 ms, TE = 100 ms, matrix size 128 × 128; voxel resolution 1.02 × 1.02 × 5 mm3 | Y | Longitudinal | ↓ FA in genu and body of CC | UHR-NP: Change in FA correlates with changes in (+) symptom severity |
| 13 | Bakker et al., 2016 | 23 UHR 33 HC | 24.3 ± 3.1 26.2 ± 5.5 | 15/8 22/11 | SIPS | 3 T; TR = 4834, TE = 94 ms, matrix size 112 × 112; 38 continuous slices; voxel size 2.05 × 2.05 × 3 mm3 | Y | Cross-sectional | ↑ AD bilaterally in ATR, left IFOF, left SLF, splenium and body of CC, and superior corona radiata ↑ RD and MD Areas of ↓ MD in CG No significant changes in FA | No links between FA, AD and RD and (+) or (-) symptom severity |
| 14 | Rigucci et al., 2016 | 27 UHR 10 UHR-P 17 UHR-NP 26 HC | 23.2 ± 3.2 21.3 ± 2.6 24 ± 2.3 | 6/4 11/6 18/8 | SIPS | 1.5 T, TR = 9400 ms; TE = 9 ms; matrix size = 128 × 128; section thickness = 1.9 mm3 | Y | Longitudinal | UHR-P: ↓ FA in left SLF and ILF, splenium and body of CC, forceps major, left corticospinal tract, left ATR, left IFOF ↑ RD in splenium and body of CC, forceps major, bilaterally ATR, corona radiata, right cortical-spinal tract Changes in MD and AD not statistically significant | |
| 15 | Wang et al., 2016 | 87 UHR 10 UHR-P 69 UHR-NP 37 HC | 21.5 ± 3.6 22.3 ± 4.0 | 58/29 20/17 | CAARMS | 3 T, TR = 9600, TE = 107 ms, voxel size = 2.0 × 2.0 × 2.0 mm3 | Y | Longitudinal | ↓ FA in left cingulum, left CC, left UF, forceps minor, left IFOF, left SLF, left ATR ↓ AD in the CG and CC bilaterally No significant differences in MD or RD | ↓ FA in left IFOF, left UF and left ATR correlated with greater symptom severity |
| 16 | Krakauer et al., 2017 | 45 UHR 45 HC | 23.71 ± 4.65 23.80 ± 5.15 | 22/23 22/23 | CAARMS | 3T, TR = 7035 ms; TE = 68 ms, matrix size = 128 × 128 × 75; voxel dimensions = 1.88 × 1.88 × 2 mm3 | Y | Cross-sectional | ↓ FA in ILF, IFOF, ATR No significant changes in AD, MO, or RD Multivariate analysis of PLSC: - ↓ FA, AD and MO, ↑ RD in widespread regions of the brain | SOFAS correlate + with FA in left ILF and AD in left IFOF and right SLF, and with MO in right IFOF, left SLF, right ATR Multivariate analysis of PLSC: - more (+) and (-) symptoms and low levels of functioning associated with ↓ FA, AD, MO and ↑ RD; inverse correlation in several areas |
| 17 | Bernard et at., 2017 | 26 UHR 24 HC | 18.65 ± 1.74 17.83 ± 2.50 | 18/8 11/13 | SIPS | 3 T; TR = 9600 ms; TE = 86 mm; 72 slices; voxel size 2 × 2 × 2 mm3 | Y | Longitudinal | ↑ FA in UHR at baseline | Positive correlation between FA and symptom severity (+) in thalamo-motor tract No other correlations |
| 18 | Saito et al., 2017 | 46 UHR 7 UHR-P 39 UHR-NP 16 HC | 22.93 ± 6.46 23.19 ± 2.86 | 13/33 8/8 | SIPS/ SOPS | 1.5 T; TR = 7668 ms, TE = 100 ms, number of slices = 30; matrix size, 128 × 128; voxel resolution 1.02 × 1.02 × 5 mm3 | N | Longitudinal | ↓ FA in CC (greater in UHR-NP) | ↓ FA in genu of CC correlates with (-) symptom severity |
| 19 | Krakauer et al., 2018 | 30 UHR 23 HC | 24.07 ± 5.12 24.48 ± 5.81 | 13/17 13/10 | CAARMS | 3 T; TR = 7035 ms, TE = 68 msAcquired matrix size = 128 × 99 × 75; voxel dimensions = 1.88 × 2.41 × 2 mm3 | Y | Longitudinal | ↓ FA in left corticospinal tract, right thalamic radiation, left SLF After 12 months: No significant inter-group differences in FA changes, but ↑FA in SLF in UHR, in UF in HC | Positive correlation between FA change and age in SLF (but not in HC) No significant correlations between baseline FA and (+) or (-) symptom severity or level of functioning (SOFAS) after 12 months No significant correlation between change in FA and (+) symptom severity or level of functioning (SOFAS) Positive correlation between change in FA and (-) symptoms in left IFOF, anterior thalamic radiation and SLF |
| 20 | Whitford et al., 2018 | 40 UHR 59 HC | 20.3 ± 4.0 21.4 ± 5.9 | 25/15 33/26 | SIPS | 3 T; TR = 9000 ms, TE = 84 ms, slices = 72; matrix = 128 mm × 128 mm, voxel size = 2 × 2 × 2 mm3 | Y | Cross-sectional | No significant differences in FA or RD in arcuate fasciculus or pyramidal tract | |
| 21 | Kristensen et al., 2019 | 116 UHR 49 HC | 23.8 ± 4.2 24.4 ± 3.4 | 55/61 22/27 | CAARMS | 3 T; TR = 7058 ms; TE = 68 ms, acquisition matrix = 128 × 99 × 75; voxel dimensions = 1.88 × 2.41 × 2 mm3 | Y | Cross-sectional | Focal↓ FA, esp. in right SLF and CG ROI analysis: ↓ FA in right ATR, right fornix, stria terminalis, right SLF, and left tapetum | PLSC: Trend-level interaction between FA and cognitive performance Higher FA correlated with better cognitive performance (but not in HC) |
| 22 | Tang et al., 2019 | 50 UHR 50 HC | 19.7 ± 4.6 19.2 ± 3.9 | 30/20 30/20 | SIPS | 3 T; TR = 15,800 ms, TE = 109 ms, 70 contiguous axial slices, voxel size = 2 × 2 × 2 mm3 | Y | Cross-sectional | Globally ↓ FA ↓ FA in cellular tissue ↓ ADt No significant changes in FW No significant FA in cellular tissue or FW changes between UHR-P and UHR-NP TBSS: No significant changes in FW ↓FA in cellular tissue in CC, right anterior, superior, and posterior corona radiata, right and left SLF No significant differences in AD and RD in cellular tissue No significant differences between UHR-P and UHR-NP | Negative correlation between social functioning and FA as well as FA, AD, or RD in cellular tissue No correlation between FW and poorer social functioning No correlation between other clinical symptoms and FA, FW, or FA, AD, or RD in cellular tissue Positive correlation of FA in cellular tissue with age in HC, but not in UHR TBSS: No correlation between FA in cellular tissue and clinical symptoms, except for a significant correlation between FA in cellular tissue and deterioration in social functioning |
| 23 | Fitzsimmons et al., 2020 | 20 UHR 23 HC | 21.08 ± 4.25 21.3 ± 3.67 | 13/7 12/11 | SIPS | 3 T; TR = 9400 ms, TE = 84 ms, 75 contiguous axial slices, matrix size = 128 × 128, voxel size = 2 × 2 × 2 mm3 | Y | Cross-sectional | ↓ FA in CG ↑ RD in CG ↑ trace of diffusion tensor in CG No significant difference in AD | No significant links between DTI and symptoms |
| 24 | Straub et al., 2020 | 18 UHR 19 HC | 18.33 ± 0.59 18.39 ± 0.60 | 6/12 5/14 | Wisconsin schizotypy scales, SIPS/ SOPS | 3 T; TR = 5,400 ms, TE = 95 ms, 38 contiguous axial slices, voxel size of 1.6 × 1.6 × 3.0 mm3 | Y | Cross-sectional | ↓ FA in limbic network; ↓ in anterior right EC and right orbitofrontal-cortex-adjacent tracts No significant ↓FA in fronto-parietal cortex, anterior limb of IC, anterior corona radiata, EC, or forceps minor | Negative correlation between ↓FA in limbic network and (+) symptom severity |
| 25 | León-Ortiz et al., 2020 | 33 UHR 38 HC | 19.55 ± 4.14 20.92 ± 3.37 | 26/7 28/10 | SIPS | 3 T; TR = 12,000 ms, TE = 70 ms, 60 slices, matrix 128 × 128; slice thickness = 2.6 mm | Y | Longitudinal | ↓ FA in UHR-P in PTR, but not in UHR-NP |
| DTI Parameter | SZ | UHR |
|---|---|---|
| FA | ↓ in SLF, ILF, IFOF, CB, CC, UF, AF, IC, fornix, corona radiata | ↓ in SLF, ILF, IFOF, CB, CC, UF, PTR, ATR, EC, IC, forceps minor ↑ SLF, IFOF, UF, ATR, forceps minor |
| AD | ↑ UF, fornix, corona radiata | ↓ UF, fornix, CG, CC, cerebellar peduncle, corticospinal tract ↑ ILF, IFOF, CC, EC, IC |
| RD | ↑ CC, UF, corona radiata, CB, fornix | ↑ CC, UF, corona radiata, SLF, ILF, IFOF, EC, IC, PTR, CG, medial lemniscus, cerebellar peduncle, cerebral peduncle |
| MD | ↑ ILF, AF, CC, UF, fornix | ↑ SLF, corona radiata, PTR, IC, CC, CG, IC, cerebral peduncle ↓ SLF, ILF, IFOF |
Publisher’s Note: MDPI stays neutral with regard to jurisdictional claims in published maps and institutional affiliations. |
© 2021 by the authors. Licensee MDPI, Basel, Switzerland. This article is an open access article distributed under the terms and conditions of the Creative Commons Attribution (CC BY) license (https://creativecommons.org/licenses/by/4.0/).
Share and Cite
Waszczuk, K.; Rek-Owodziń, K.; Tyburski, E.; Mak, M.; Misiak, B.; Samochowiec, J. Disturbances in White Matter Integrity in the Ultra-High-Risk Psychosis State—A Systematic Review. J. Clin. Med. 2021, 10, 2515. https://0-doi-org.brum.beds.ac.uk/10.3390/jcm10112515
Waszczuk K, Rek-Owodziń K, Tyburski E, Mak M, Misiak B, Samochowiec J. Disturbances in White Matter Integrity in the Ultra-High-Risk Psychosis State—A Systematic Review. Journal of Clinical Medicine. 2021; 10(11):2515. https://0-doi-org.brum.beds.ac.uk/10.3390/jcm10112515
Chicago/Turabian StyleWaszczuk, Katarzyna, Katarzyna Rek-Owodziń, Ernest Tyburski, Monika Mak, Błażej Misiak, and Jerzy Samochowiec. 2021. "Disturbances in White Matter Integrity in the Ultra-High-Risk Psychosis State—A Systematic Review" Journal of Clinical Medicine 10, no. 11: 2515. https://0-doi-org.brum.beds.ac.uk/10.3390/jcm10112515