The Comparative Clinical Performance of Four SARS-CoV-2 Rapid Antigen Tests and Their Correlation to Infectivity In Vitro

 , , , , and
Abstract
:1. Introduction
2. Materials and Methods
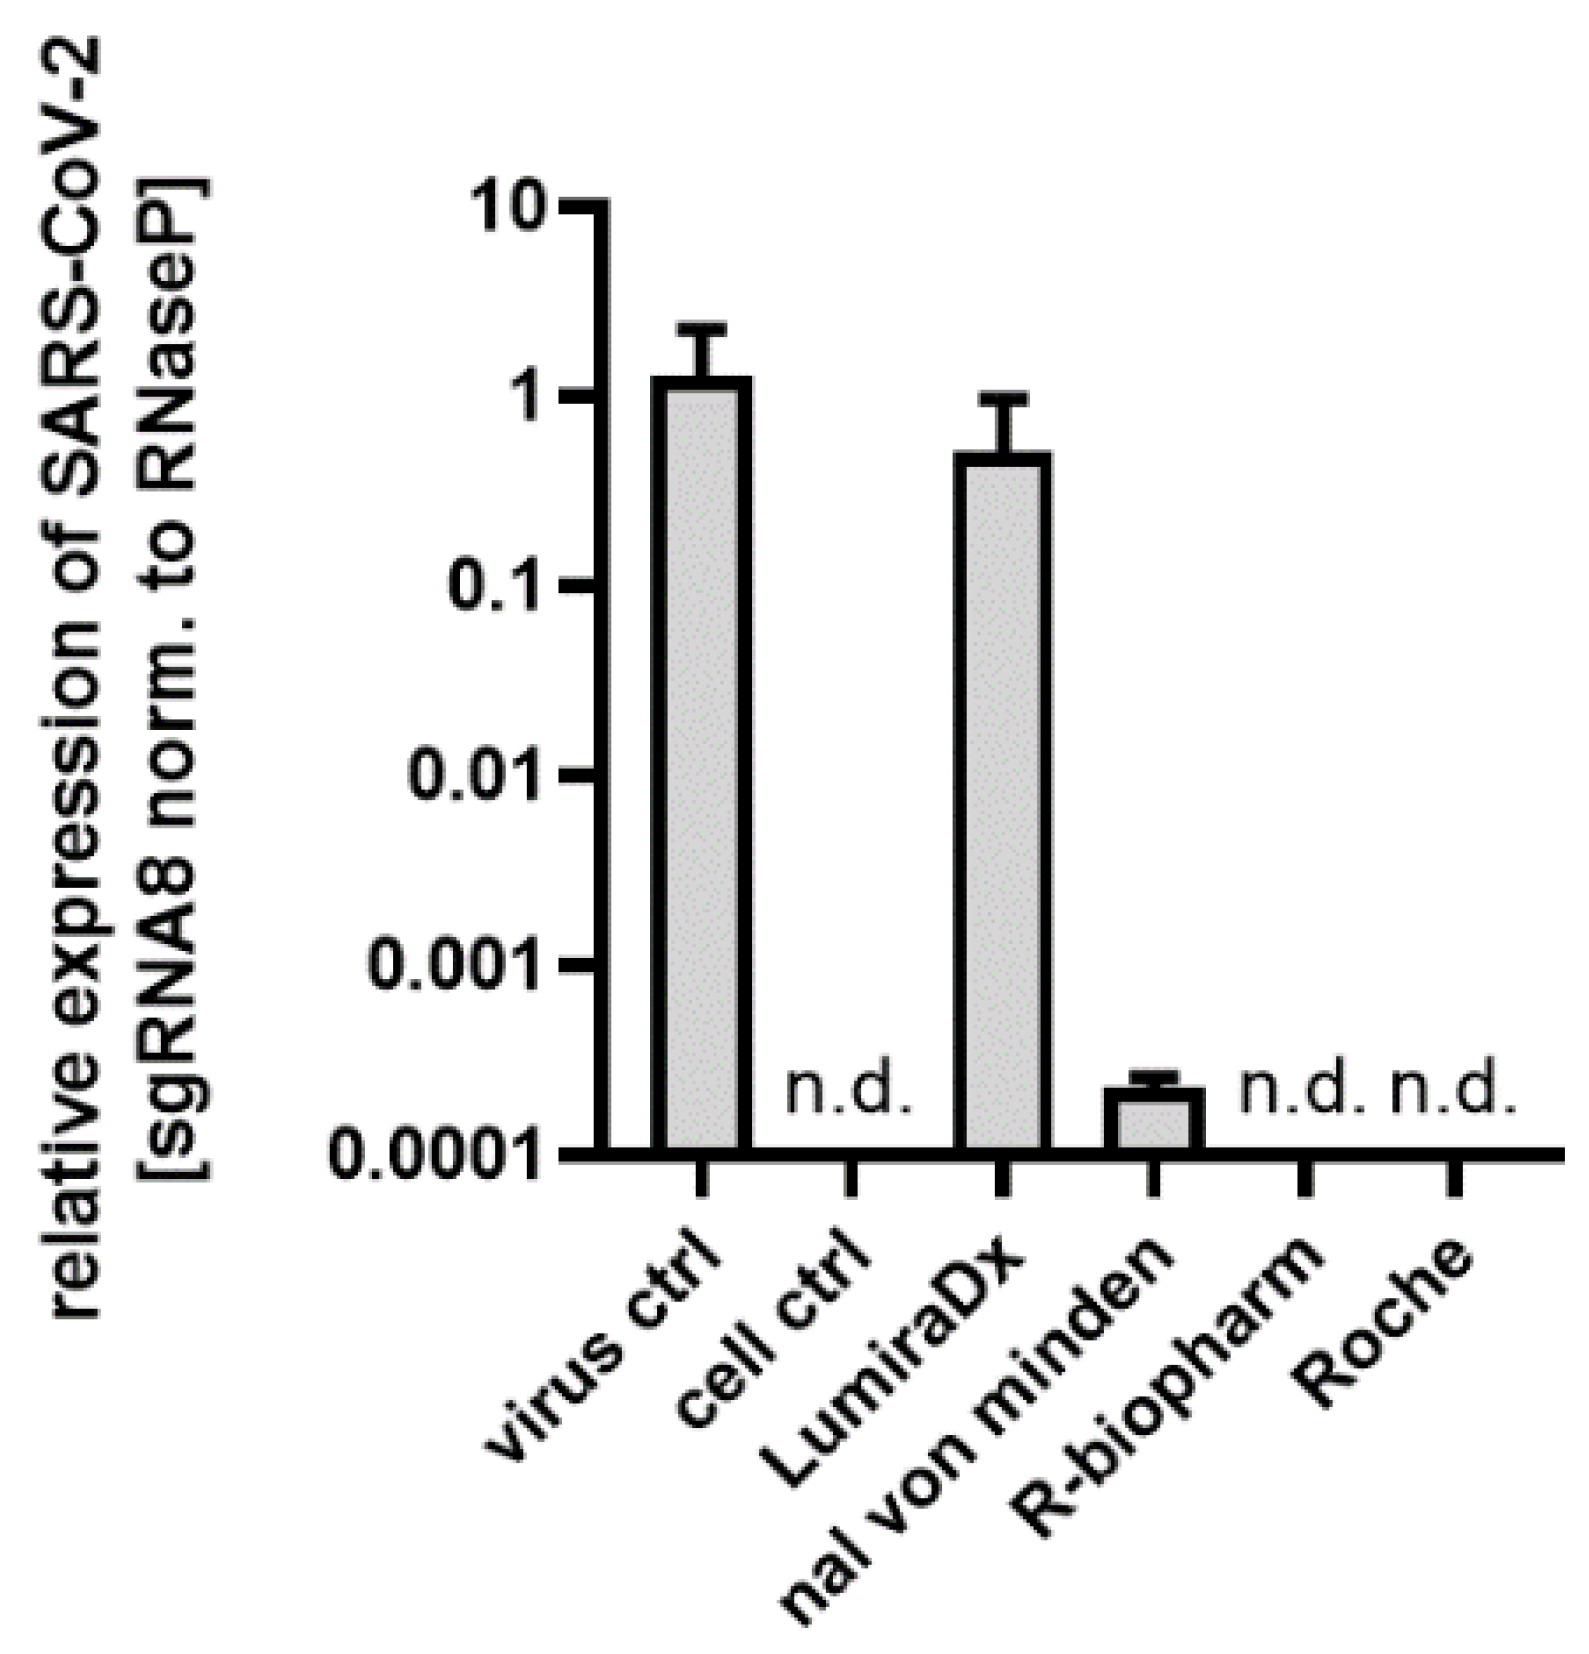
2.1. rRT-PCR Analysis of Clinical Swab Samples and Intracellular RNA from Infected Cells
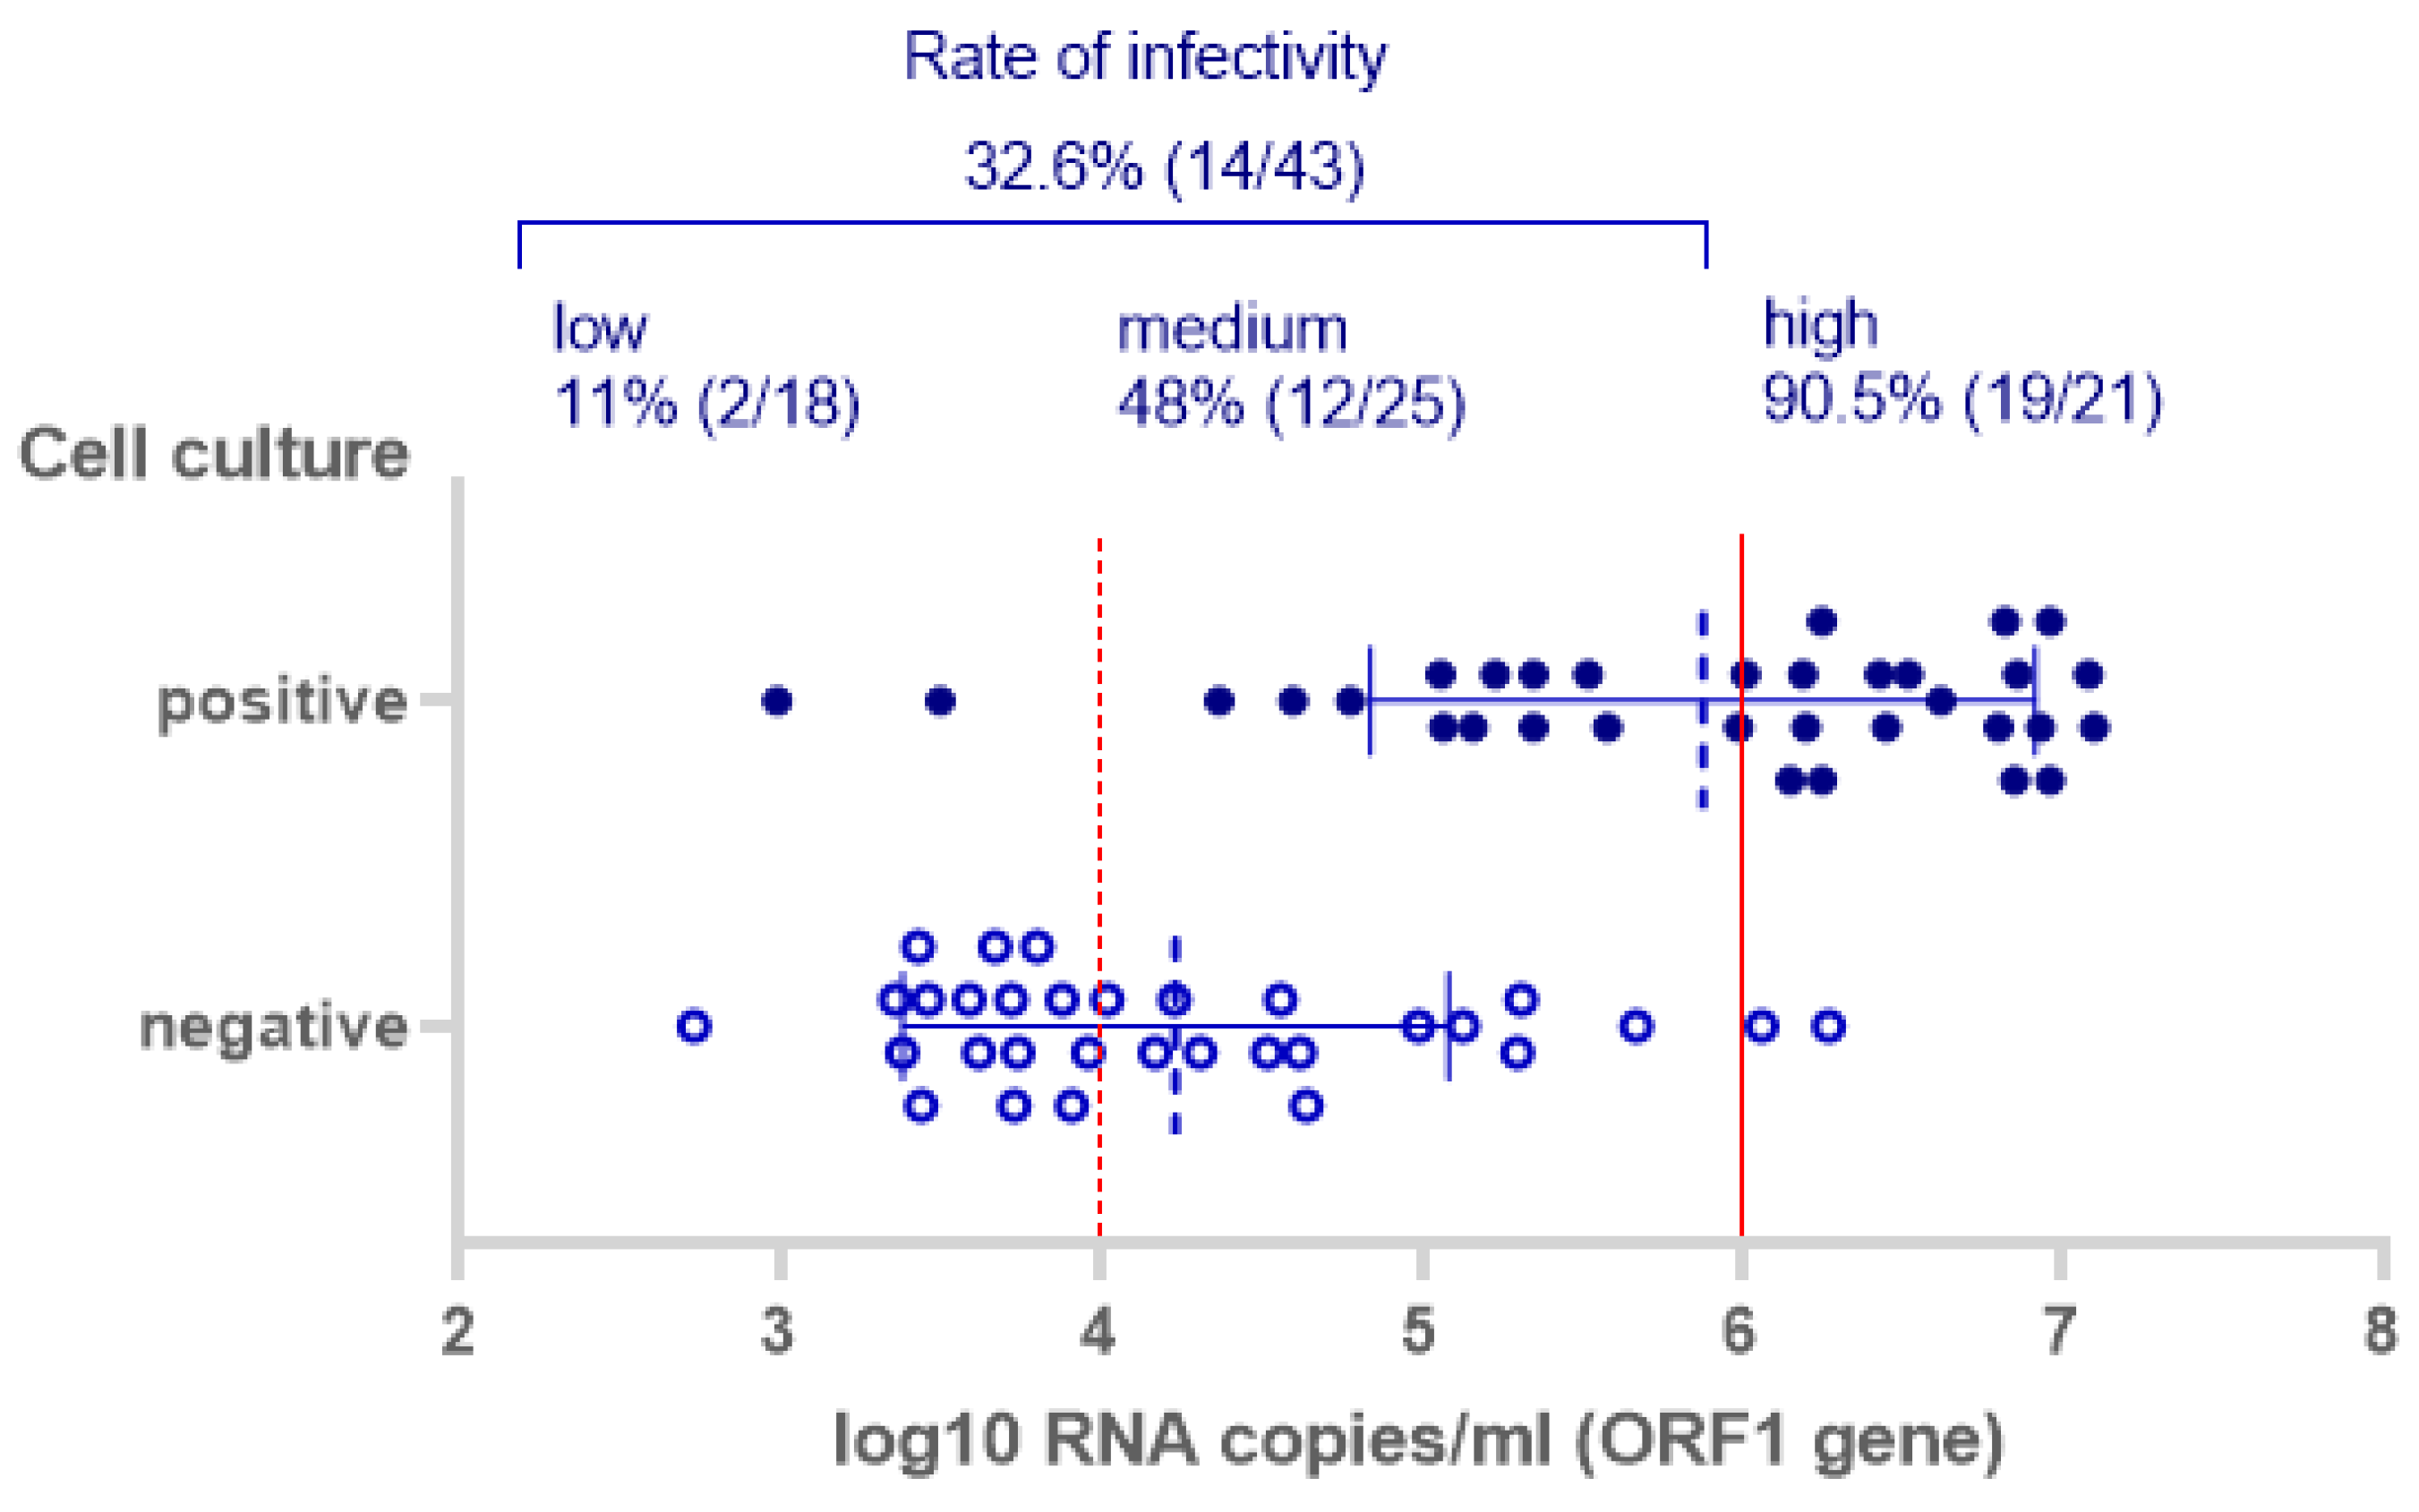
2.2. Defining an rRT-PCR CT-Value Range for Potential Infectious Samples
2.3. Chemical Inactivation of Cell Culture Supernatants
2.4. Antigen-Detecting Rapid Diagnostic Tests (Ag-RDTs)
2.5. Cell Culture and Detection of Infectious Virus
2.6. Statistical Analysis
3. Results
4. Discussion
Supplementary Materials
Author Contributions
Funding
Institutional Review Board Statement
Informed Consent Statement
Data Availability Statement
Conflicts of Interest
References
- Mathuria, J.P.; Yadav, R.; Rajkumar. Laboratory diagnosis of SARS-CoV-2—A review of current methods. J. Infect. Public Health 2020, 13, 901–905. [Google Scholar] [CrossRef] [PubMed]
- Loeffelholz, M.J.; Tang, Y.-W. Laboratory diagnosis of emerging human coronavirus infections—The state of the art. Emerg. Microbes Infect. 2020, 9, 747–756. [Google Scholar] [CrossRef] [PubMed]
- WHO. WHO Coronavirus Disease (COVID-19) Dashboard. Available online: https://covid19.who.int/ (accessed on 14 December 2020).
- Manabe, Y.C.; Sharfstein, J.S.; Armstrong, K. The Need for More and Better Testing for COVID-19. JAMA 2020. [Google Scholar] [CrossRef] [PubMed]
- FIND. SARS-CoV-2 Diagnostic Pipeline. Available online: https://www.finddx.org/covid-19/pipeline/?avance=Commercialized&type=Rapid+diagnostic+tests&test_target=Antigen&status=all§ion=immunoassays&action=default#diag_tab (accessed on 21 December 2020).
- Linares, M.; Pérez-Tanoira, R.; Carrero, A.; Romanyk, J.; Pérez-García, F.; Gómez-Herruz, P.; Arroyo, T.; Cuadros, J. Panbio antigen rapid test is reliable to diagnose SARS-CoV-2 infection in the first 7 days after the onset of symptoms. J. Clin. Virol. 2020, 133, 104659. [Google Scholar] [CrossRef] [PubMed]
- Nalumansi, A.; Lutalo, T.; Kayiwa, J.; Watera, C.; Balinandi, S.; Kiconco, J.; Nakaseegu, J.; Olara, D.; Odwilo, E.; Serwanga, J.; et al. Field Evaluation of the Performance of a SARS-CoV-2 Antigen Rapid Diagnostic Test in Uganda using Nasopharyngeal Samples. Int. J. Infect. Dis. 2020. [Google Scholar] [CrossRef]
- Mak, G.C.K.; Lau, S.S.Y.; Wong, K.K.Y.; Chow, N.L.S.; Lau, C.S.; Lam, E.T.K.; Chan, R.C.W.; Tsang, D.N.C. Analytical sensitivity and clinical sensitivity of the three rapid antigen detection kits for detection of SARS-CoV-2 virus. J. Clin. Virol. 2020, 104684. [Google Scholar] [CrossRef]
- Cerutti, F.; Burdino, E.; Milia, M.G.; Allice, T.; Gregori, G.; Bruzzone, B.; Ghisetti, V. Urgent need of rapid tests for SARS CoV-2 antigen detection: Evaluation of the SD-Biosensor antigen test for SARS-CoV-2. J. Clin. Virol. 2020, 132, 104654. [Google Scholar] [CrossRef]
- Scohy, A.; Anantharajah, A.; Bodéus, M.; Kabamba-Mukadi, B.; Verroken, A.; Rodriguez-Villalobos, H. Low performance of rapid antigen detection test as frontline testing for COVID-19 diagnosis. J. Clin. Virol. 2020, 129, 104455. [Google Scholar] [CrossRef]
- Lambert-Niclot, S.; Cuffel, A.; Le Pape, S.; Vauloup-Fellous, C.; Morand-Joubert, L.; Roque-Afonso, A.-M.; Le Goff, J.; Delaugerre, C. Evaluation of a Rapid Diagnostic Assay for Detection of SARS-CoV-2 Antigen in Nasopharyngeal Swabs. J. Clin. Microbiol. 2020, 58. [Google Scholar] [CrossRef]
- Mertens, P.; de Vos, N.; Martiny, D.; Jassoy, C.; Mirazimi, A.; Cuypers, L.; van den Wijngaert, S.; Monteil, V.; Melin, P.; Stoffels, K.; et al. Development and Potential Usefulness of the COVID-19 Ag Respi-Strip Diagnostic Assay in a Pandemic Context. Front. Med. 2020, 7, 225. [Google Scholar] [CrossRef]
- Porte, L.; Legarraga, P.; Vollrath, V.; Aguilera, X.; Munita, J.M.; Araos, R.; Pizarro, G.; Vial, P.; Iruretagoyena, M.; Dittrich, S.; et al. Evaluation of a novel antigen-based rapid detection test for the diagnosis of SARS-CoV-2 in respiratory samples. Int. J. Infect. Dis. 2020, 99, 328–333. [Google Scholar] [CrossRef] [PubMed]
- Toptan, T.; Eckermann, L.; Pfeiffer, A.E.; Hoehl, S.; Ciesek, S.; Drosten, C.; Corman, V.M. Evaluation of a SARS-CoV-2 rapid antigen test: Potential to help reduce community spread? J. Clin. Virol. 2020, 104713. [Google Scholar] [CrossRef]
- Wölfel, R.; Corman, V.M.; Guggemos, W.; Seilmaier, M.; Zange, S.; Müller, M.A.; Niemeyer, D.; Jones, T.C.; Vollmar, P.; Rothe, C.; et al. Virological assessment of hospitalized patients with COVID-2019. Nature 2020, 581, 465–469. [Google Scholar] [CrossRef] [PubMed] [Green Version]
- Albert, E.; Torres, I.; Bueno, F.; Huntley, D.; Molla, E.; Fernández-Fuentes, M.Á.; Martínez, M.; Poujois, S.; Forqué, L.; Valdivia, A.; et al. Field evaluation of a rapid antigen test (Panbio™ COVID-19 Ag Rapid Test Device) for COVID-19 diagnosis in primary healthcare centres. Clin. Microbiol. Infect. 2020. [Google Scholar] [CrossRef] [PubMed]
- Basile, K.; McPhie, K.; Carter, I.; Alderson, S.; Rahman, H.; Donovan, L.; Kumar, S.; Tran, T.; Ko, D.; Sivaruban, T.; et al. Cell-based culture of SARS-CoV-2 informs infectivity and safe de-isolation assessments during COVID-19. Clin Infect Dis 2020. [Google Scholar] [CrossRef] [PubMed]
- Toptan, T.; Hoehl, S.; Westhaus, S.; Bojkova, D.; Berger, A.; Rotter, B.; Hoffmeier, K.; Cinatl, J.; Ciesek, S.; Widera, M. Optimized qRT-PCR Approach for the Detection of Intra- and Extra-Cellular SARS-CoV-2 RNAs. Int. J. Mol. Sci. 2020, 21, 4396. [Google Scholar] [CrossRef]
- WHO. Molecular Assays to Diagnose COVID-19: Summary Table of Available Protocols. Available online: https://www.who.int/docs/default-source/coronaviruse/whoinhouseassays.pdf?sfvrsn=de3a76aa_2 (accessed on 21 December 2020).
- Westhaus, S.; Widera, M.; Rabenau, H.F.; Hoehl, S.; Bojkova, D.; Cinatl, J.; Ciesek, S. Evaluation of stability and inactivation methods of SARS-CoV-2 in context of laboratory settings. bioRxiv 2020. [Google Scholar] [CrossRef]
- Cohen, J. Weighted kappa: Nominal scale agreement with provision for scaled disagreement or partial credit. Psychol. Bull. 1968, 70, 213–220. [Google Scholar] [CrossRef]
- Landis, J.R.; Koch, G.G. The measurement of observer agreement for categorical data. Biometrics 1977, 33, 159–174. [Google Scholar] [CrossRef] [Green Version]
- Corman, V.M.; Haage, V.C.; Bleicker, T.; Schmidt, M.L.; Mühlemann, B.; Zuchowski, M.; Jó Lei, W.K.; Tscheak, P.; Möncke-Buchner, E.; Müller, M.A.; et al. Comparison of seven commercial SARS-CoV-2 rapid Point-of-Care Antigen tests. medRxiv 2020. [Google Scholar] [CrossRef]
- WHO. Antigen-Detection in the Diagnosis of SARS-CoV-2 Infection Using Rapid Immunoassays: Interim Guidance. Available online: https://www.who.int/publications/i/item/antigen-detection-in-the-diagnosis-of-sars-cov-2infection-using-rapid-immunoassays (accessed on 21 December 2020).
- Perera, R.A.P.M.; Tso, E.; Tsang, O.T.Y.; Tsang, D.N.C.; Fung, K.; Leung, Y.W.Y.; Chin, A.W.H.; Chu, D.K.W.; Cheng, S.M.S.; Poon, L.L.M.; et al. SARS-CoV-2 Virus Culture and Subgenomic RNA for Respiratory Specimens from Patients with Mild Coronavirus Disease. Emerg. Infect. Dis. 2020, 26, 2701–2704. [Google Scholar] [CrossRef] [PubMed]
- WHO. COVID-19 Target Product Profiles for Priority Diagnostics to Support Response to the COVID-19 Pandemic v.1.0. Available online: https://www.who.int/publications/m/item/covid-19-target-product-profiles-for-priority-diagnostics-to-support-response-to-the-covid-19-pandemic-v.0.1 (accessed on 21 December 2020).
- La Scola, B.; Le Bideau, M.; Andreani, J.; van Hoang, T.; Grimaldier, C.; Colson, P.; Gautret, P.; Raoult, D. Viral RNA load as determined by cell culture as a management tool for discharge of SARS-CoV-2 patients from infectious disease wards. Eur J. Clin. Microbiol Infect. Dis 2020, 39, 1059–1061. [Google Scholar] [CrossRef] [PubMed]
- Van Kampen, J.J.; van de Vijver, D.A.; Fraaij, P.L.; Haagmans, B.L.; Lamers, M.M.; Okba, N.; van den Akker, J.P.; Endeman, H.; Gommers, D.A.; Cornelissen, J.J.; et al. Shedding of infectious virus in hospitalized patients with coronavirus disease-2019 (COVID-19): Duration and key determinants. medRxiv 2020. [Google Scholar] [CrossRef]
- WHO. Criteria for Releasing COVID-19 Patients from Isolation. Available online: https://www.who.int/publications/i/item/criteria-for-releasing-covid-19-patients-from-isolation (accessed on 8 January 2021).
- CDC. Duration of Isolation and Precautions for Adults with COVID-19. Available online: https://www.cdc.gov/coronavirus/2019-ncov/hcp/duration-isolation.html (accessed on 8 January 2021).
- Pekosz, A.; Cooper, C.K.; Parvu, V.; Li, M.; Andrews, J.C.; Manabe, Y.C.; Kodsi, S.; Leitch, J.; Gary, D.S.; Roger-Dalbert, C. Antigen-based testing but not real-time PCR correlates with SARS-CoV-2 virus culture. medRxiv 2020. [Google Scholar] [CrossRef]
- Sia, S.F.; Yan, L.-M.; Chin, A.W.H.; Fung, K.; Choy, K.-T.; Wong, A.Y.L.; Kaewpreedee, P.; Perera, R.A.P.M.; Poon, L.L.M.; Nicholls, J.M.; et al. Pathogenesis and transmission of SARS-CoV-2 in golden hamsters. Nature 2020, 583, 834–838. [Google Scholar] [CrossRef]
- Hoehl, S.; Schenk, B.; Rudych, O.; Göttig, S.; Foppa, I.; Kohmer, N.; Karaca, O.; Toptan, T.; Ciesek, S. At-home self-testing of teachers with a SARS-CoV-2 rapid antigen test to reduce potential transmissions in schools. medRxiv 2020. [Google Scholar] [CrossRef]
- ECDC. Options for the Use of Rapid Antigen Tests for COVID-19in the EU/EEA and the UK. Available online: https://www.ecdc.europa.eu/sites/default/files/documents/Options-use-of-rapid-antigen-tests-for-COVID-19.pdf (accessed on 8 January 2021).
- Larremore, D.B.; Wilder, B.; Lester, E.; Shehata, S.; Burke, J.M.; Hay, J.A.; Tambe, M.; Mina, M.J.; Parker, R. Test sensitivity is secondary to frequency and turnaround time for COVID-19 screening. Sci. Adv. 2020. [Google Scholar] [CrossRef]
- Mina, M.J.; Parker, R.; Larremore, D.B. Rethinking Covid-19 Test Sensitivity—A Strategy for Containment. N. Engl. J. Med. 2020. [Google Scholar] [CrossRef]


| RIDA®QUICK SARS-CoV-2 Antigen (R-Biopharm) | SARS-CoV-2 Rapid Antigen Test (Roche) | NADAL® COVID-19 Ag Test (Nal von Minden) | SARS-CoV-2 Ag Test (LumiraDx) | |||
|---|---|---|---|---|---|---|
| rRT-PCR (Target Gene) | ORF1 | |||||
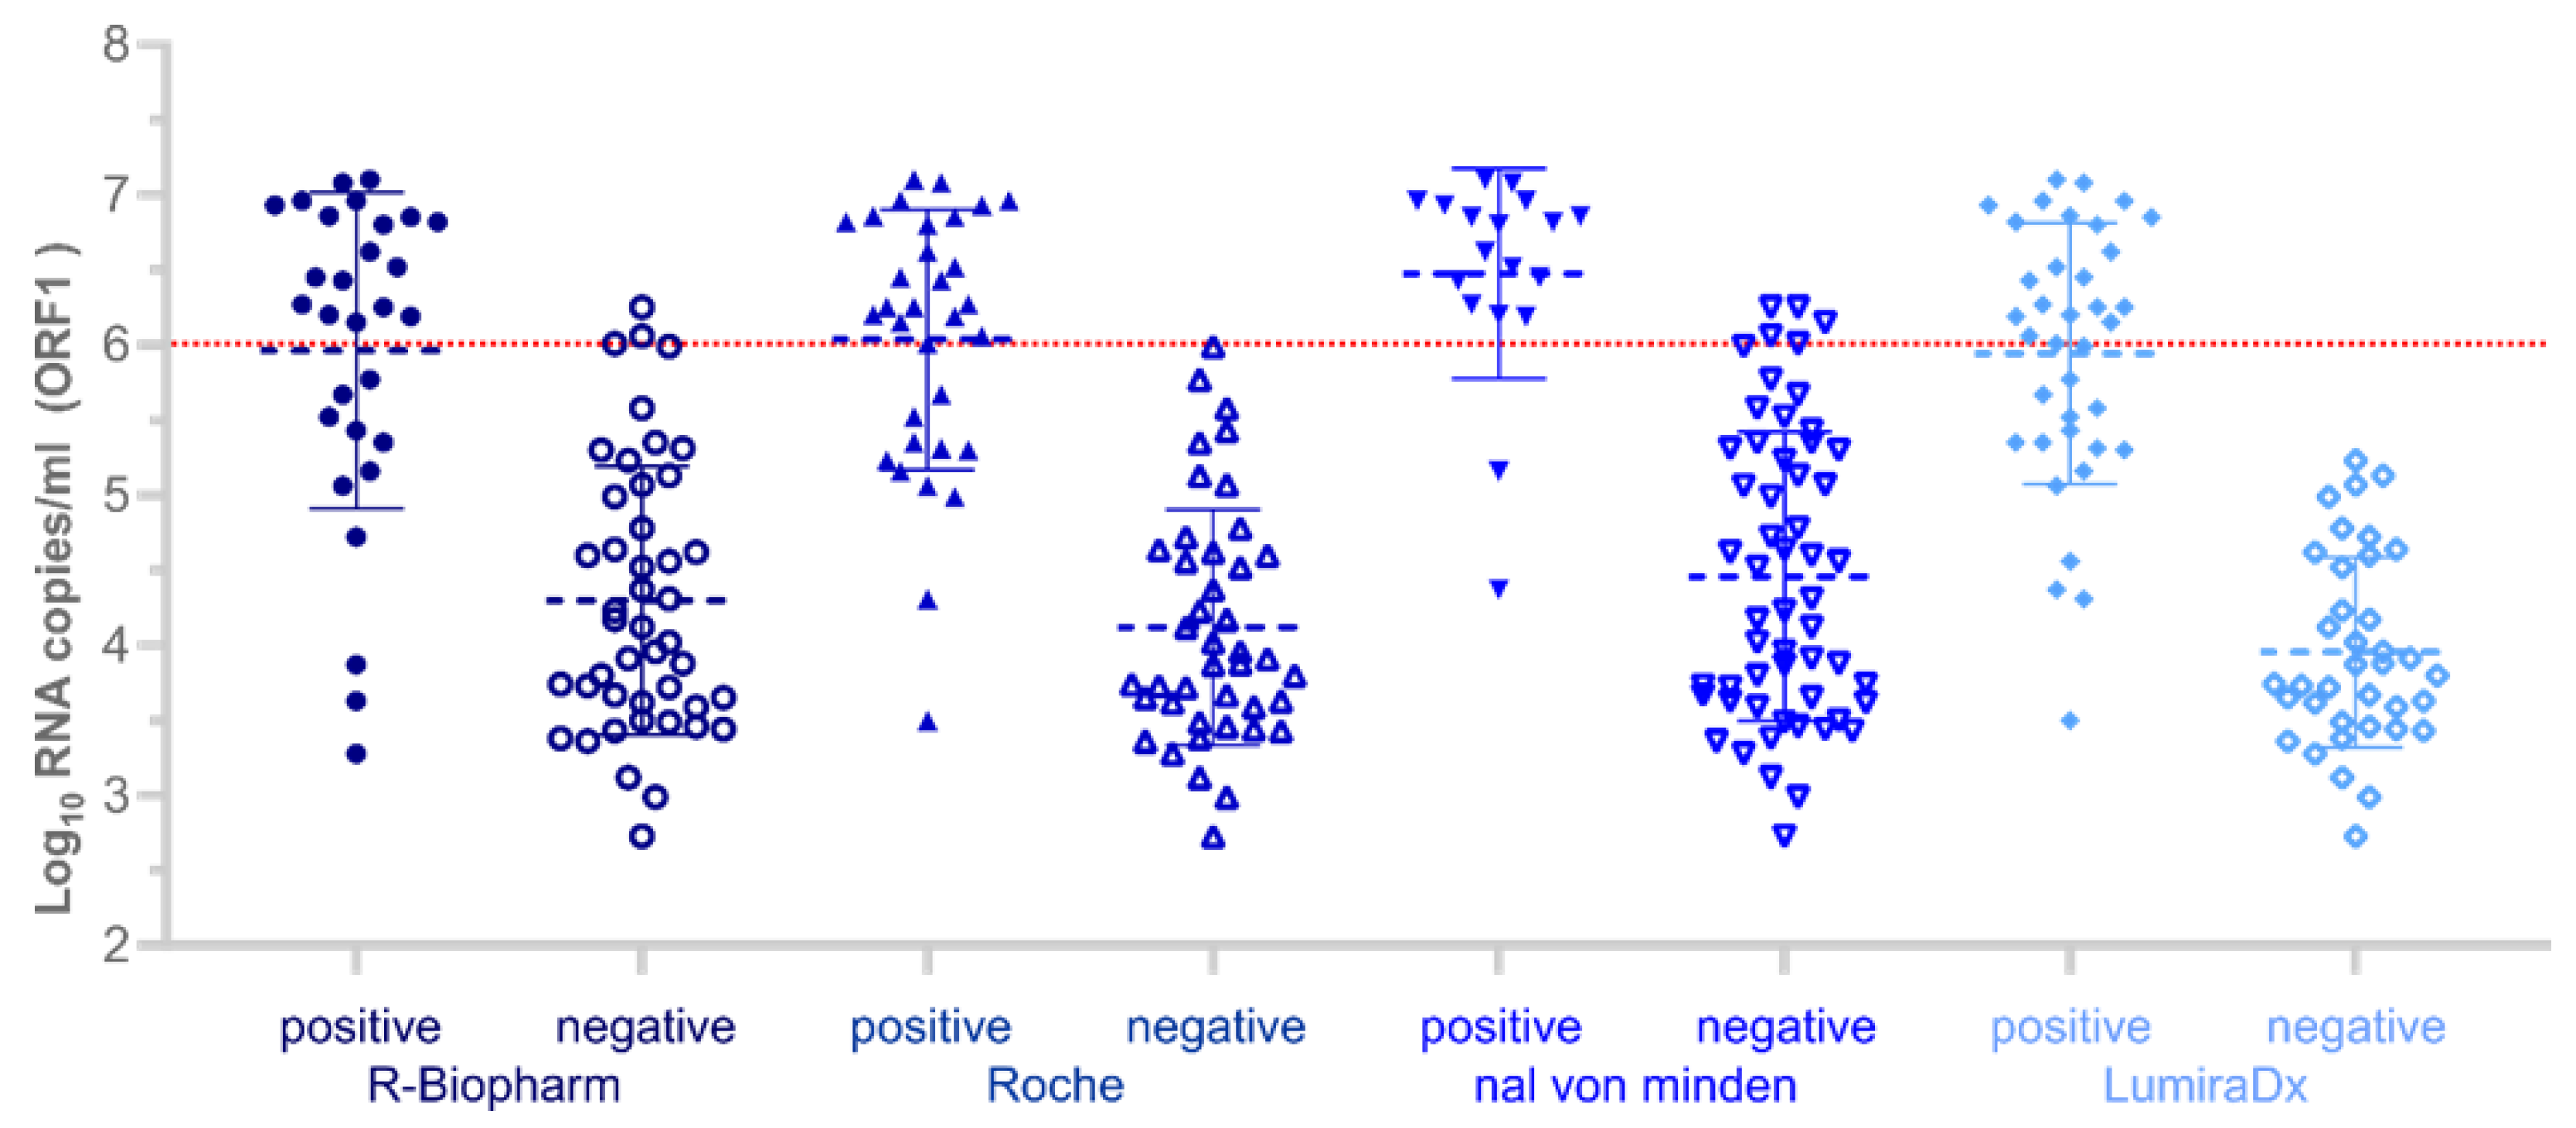
| (1) Sensitivity | rRT-PCR positive all samples | n = 74 | 39.2% (29/74) (28–51.2% 95% CI) | 43.2% (32/74) (37.8–55.3% 95% CI) | 24.3% (18/74) (15.1–35.7% 95% CI) | 50% (37/74) (38.1–61.9% 95% CI) |
| ≥6 log10 RNA copies/mL | n = 21 | 85.7% (18/21) | 100% (21/21) | 76.2% (16/21) | 100% (21/21) | |
| (2) Specificity | rRT-PCR negative | n = 26 | 96.2% (25/26) (80.4–99.9% 95% CI) | 100% (26/26) (86.8–100% 95% CI) | 100% (26/26) (86.8–100% 95% CI) | 100% (26/26) (86.8–100% 95% CI) |
| Ag-RDT | Positive Test with 50% Probability (Values in log10 RNA/mL) | Positive Test with 95% Probability (Values in log10 RNA/mL) |
|---|---|---|
| R-Biopharm | 5.43 (4.997–5.858) | 7.415 (6.499–8.475) |
| Roche | 5.196 (4.869–5.54) | 6.564 (5.874–7.239) |
| Nal von Minden | 6.099 (5.778–6.427) | 7.263 (6.631–7.935) |
| LumiraDx | 4.875 (4.578–5.169) | 5.979 (5.41–6.539) |
| Cell Culture | RIDA®QUICK SARS-CoV-2 Antigen (R-Biopharm) | SARS-CoV-2 Rapid Antigen Test (Roche) | NADAL® COVID-19 Ag Test (Nal von Minden) | SARS-CoV-2 Ag Test (LumiraDx) | |
|---|---|---|---|---|---|
| (1) Sensitivity | n = 34 | 61.8% (21/34) (43.6–77.8% 95% CI) | 70.6% (24/34) (52.5–84.9% 95% CI) | 50% (17/34) (32.4–67.6% 95% CI) | 82.4% (28/34) (65.5–93.2% 95% CI) |
| (2) Specificity | n = 31 | 93.6% (29/31) (78.6–99.2% 95% CI) | 77.4% (24/31) (58.9–90.4% 95% CI) | 96.8% (30/31) (83.3–99.9% 95% CI) | 77.4% (24/31) (58.9–90.4% 95% CI) |
| RIDA®QUICK SARS-CoV-2 Antigen (R-Biopharm) | SARS-CoV-2 Rapid Antigen Test (Roche) | NADAL® COVID-19 Ag Test (Nal von Minden) | SARS-CoV-2 Ag Test (LumiraDx) | |
|---|---|---|---|---|
| weighted kappa | 0.545 | 0.478 | 0.457 | 0.599 |
| standard error | 0.097 | 0.108 | 0.095 | 0.099 |
| 95% CI | 0.354–0.735 | 0.266–0.690 | 0.270–0.644 | 0.404–0.794 |
Publisher’s Note: MDPI stays neutral with regard to jurisdictional claims in published maps and institutional affiliations. |
© 2021 by the authors. Licensee MDPI, Basel, Switzerland. This article is an open access article distributed under the terms and conditions of the Creative Commons Attribution (CC BY) license (http://creativecommons.org/licenses/by/4.0/).
Share and Cite
Kohmer, N.; Toptan, T.; Pallas, C.; Karaca, O.; Pfeiffer, A.; Westhaus, S.; Widera, M.; Berger, A.; Hoehl, S.; Kammel, M.; et al. The Comparative Clinical Performance of Four SARS-CoV-2 Rapid Antigen Tests and Their Correlation to Infectivity In Vitro. J. Clin. Med. 2021, 10, 328. https://0-doi-org.brum.beds.ac.uk/10.3390/jcm10020328
Kohmer N, Toptan T, Pallas C, Karaca O, Pfeiffer A, Westhaus S, Widera M, Berger A, Hoehl S, Kammel M, et al. The Comparative Clinical Performance of Four SARS-CoV-2 Rapid Antigen Tests and Their Correlation to Infectivity In Vitro. Journal of Clinical Medicine. 2021; 10(2):328. https://0-doi-org.brum.beds.ac.uk/10.3390/jcm10020328
Chicago/Turabian StyleKohmer, Niko, Tuna Toptan, Christiane Pallas, Onur Karaca, Annika Pfeiffer, Sandra Westhaus, Marek Widera, Annemarie Berger, Sebastian Hoehl, Martin Kammel, and et al. 2021. "The Comparative Clinical Performance of Four SARS-CoV-2 Rapid Antigen Tests and Their Correlation to Infectivity In Vitro" Journal of Clinical Medicine 10, no. 2: 328. https://0-doi-org.brum.beds.ac.uk/10.3390/jcm10020328