Article

Individual-Level and Neighborhood-Level Factors Associated with Longitudinal Changes in Cardiometabolic Measures in Participants of a Clinic-Based Care Coordination Program: A Secondary Data Analysis

1
Department of Wellness and Preventive Medicine, Cleveland Clinic Community Care Institute, Cleveland, OH 44104, USA
2
Department of Family and Community Medicine, University of Missouri, Columbia, MO 65212, USA
3
Biostatistics and Research Design Unit, School of Medicine, University of Missouri, Columbia, MO 65211, USA
4
Center for Applied Research and Engagement Systems (CARES), University of Missouri, Columbia, MO 65211, USA
5
Department of Physical Medicine and Rehabilitation, University of Missouri, Columbia, MO 65211, USA
6
Brown School, Washington University in St. Louis, St. Louis, MO 63130, USA
7
Division of General Medical Sciences, School of Medicine, Washington University in St. Louis, St. Louis, MO 63130, USA
*
Author to whom correspondence should be addressed.
These authors contributed equally to this work.
J. Clin. Med. 2022, 11(10), 2897; https://0-doi-org.brum.beds.ac.uk/10.3390/jcm11102897
Submission received: 1 May 2022 / Revised: 17 May 2022 / Accepted: 18 May 2022 / Published: 20 May 2022
(This article belongs to the Section Cardiology)

Abstract

:
Background: Identifying individual and neighborhood-level factors associated with worsening cardiometabolic risks despite clinic-based care coordination may help identify candidates for supplementary team-based care. Methods: Secondary data analysis of data from a two-year nurse-led care coordination program cohort of Medicare, Medicaid, dual-eligible adults, Leveraging Information Technology to Guide High Tech, High Touch Care (LIGHT2), from ten Midwestern primary care clinics in the U.S. Outcome Measures: Hemoglobin A1C, low-density-lipoprotein (LDL) cholesterol, and blood pressure. Multivariable generalized linear regression models assessed individual and neighborhood-level factors associated with changes in outcome measures from before to after completion of the LIGHT2 program. Results: 6378 participants had pre-and post-intervention levels reported for at least one outcome measure. In adjusted models, higher pre-intervention cardiometabolic measures were associated with worsening of all cardiometabolic measures. Women had worsening LDL-cholesterol compared with men. Women with pre-intervention HbA1c > 6.8% and systolic blood pressure > 131 mm of Hg had worse post-intervention HbA1c and systolic blood pressure compared with men. Adding individual’s neighborhood-level risks did not change effect sizes significantly. Conclusions: Increased cardiometabolic risks and gender were associated with worsening cardiometabolic outcomes. Understanding unresolved gender-specific needs and preferences of patients with increased cardiometabolic risks may aid in tailoring clinic-community-linked care planning.

1. Introduction

Cardiovascular disease (CVD) is the leading cause of death in the U.S., and cardiometabolic risk factors for CVD are prevalent and well-known [1,2]. Despite the availability of effective treatments, significant disparities in CVD and cardiometabolic outcomes persist [3,4,5,6]. Care coordination can reduce fragmentation in care, and team-based care with community-based support can help address behavioral and social determinants of cardiometabolic risks [7,8,9,10,11,12]. However, most primary care practices do not have the time or resources to offer widespread care coordination, individual-level social and behavior risk screenings, and team-based care [13,14,15,16,17,18]. Tailoring team-based approaches to high-burden communities, people living in poverty, or those with low literacy is recommended for reducing CVD disparities [11]. Support outside busy clinic workflows needs to be tailored to individuals who do not benefit from clinic-based interventions. Advances in geospatial technologies have increased electronic health record (EHR) access to community-level geocoded data for social and behavioral risks associated with each patient’s residential address [19]. Identifying clinical, sociodemographic, and community-level factors that predict an individual’s health outcomes after participating in clinic-based interventions can help identify potential candidates for supplementary clinic-community linked interventions [20,21]. We found no studies examining patient-level moderating factors of cardiometabolic outcomes with nurse-led care coordination. Hence, we aimed to identify patients’ clinical, sociodemographic, and neighborhood-level factors associated with less improvement or worsening cardiometabolic outcomes despite participation in a 2-year clinic-based nurse-led care coordination program.

2. Materials and Methods

We performed a secondary analysis of data from a prospective cohort of University of Missouri Healthcare (MUHC) system patients enrolled in the Leveraging Information Technology to Guide High Tech, High Touch Care (LIGHT2) project from 1 July 2013 to 30 June 2015 [22]. The University of Missouri institutional review board determined the LIGHT2 program to be a quality improvement activity not requiring institutional review board review. We used the Strengthening the Reporting of Observational Studies in Epidemiology (STROBE) reporting guidelines for this study [23].

2.1. Study Design and Setting
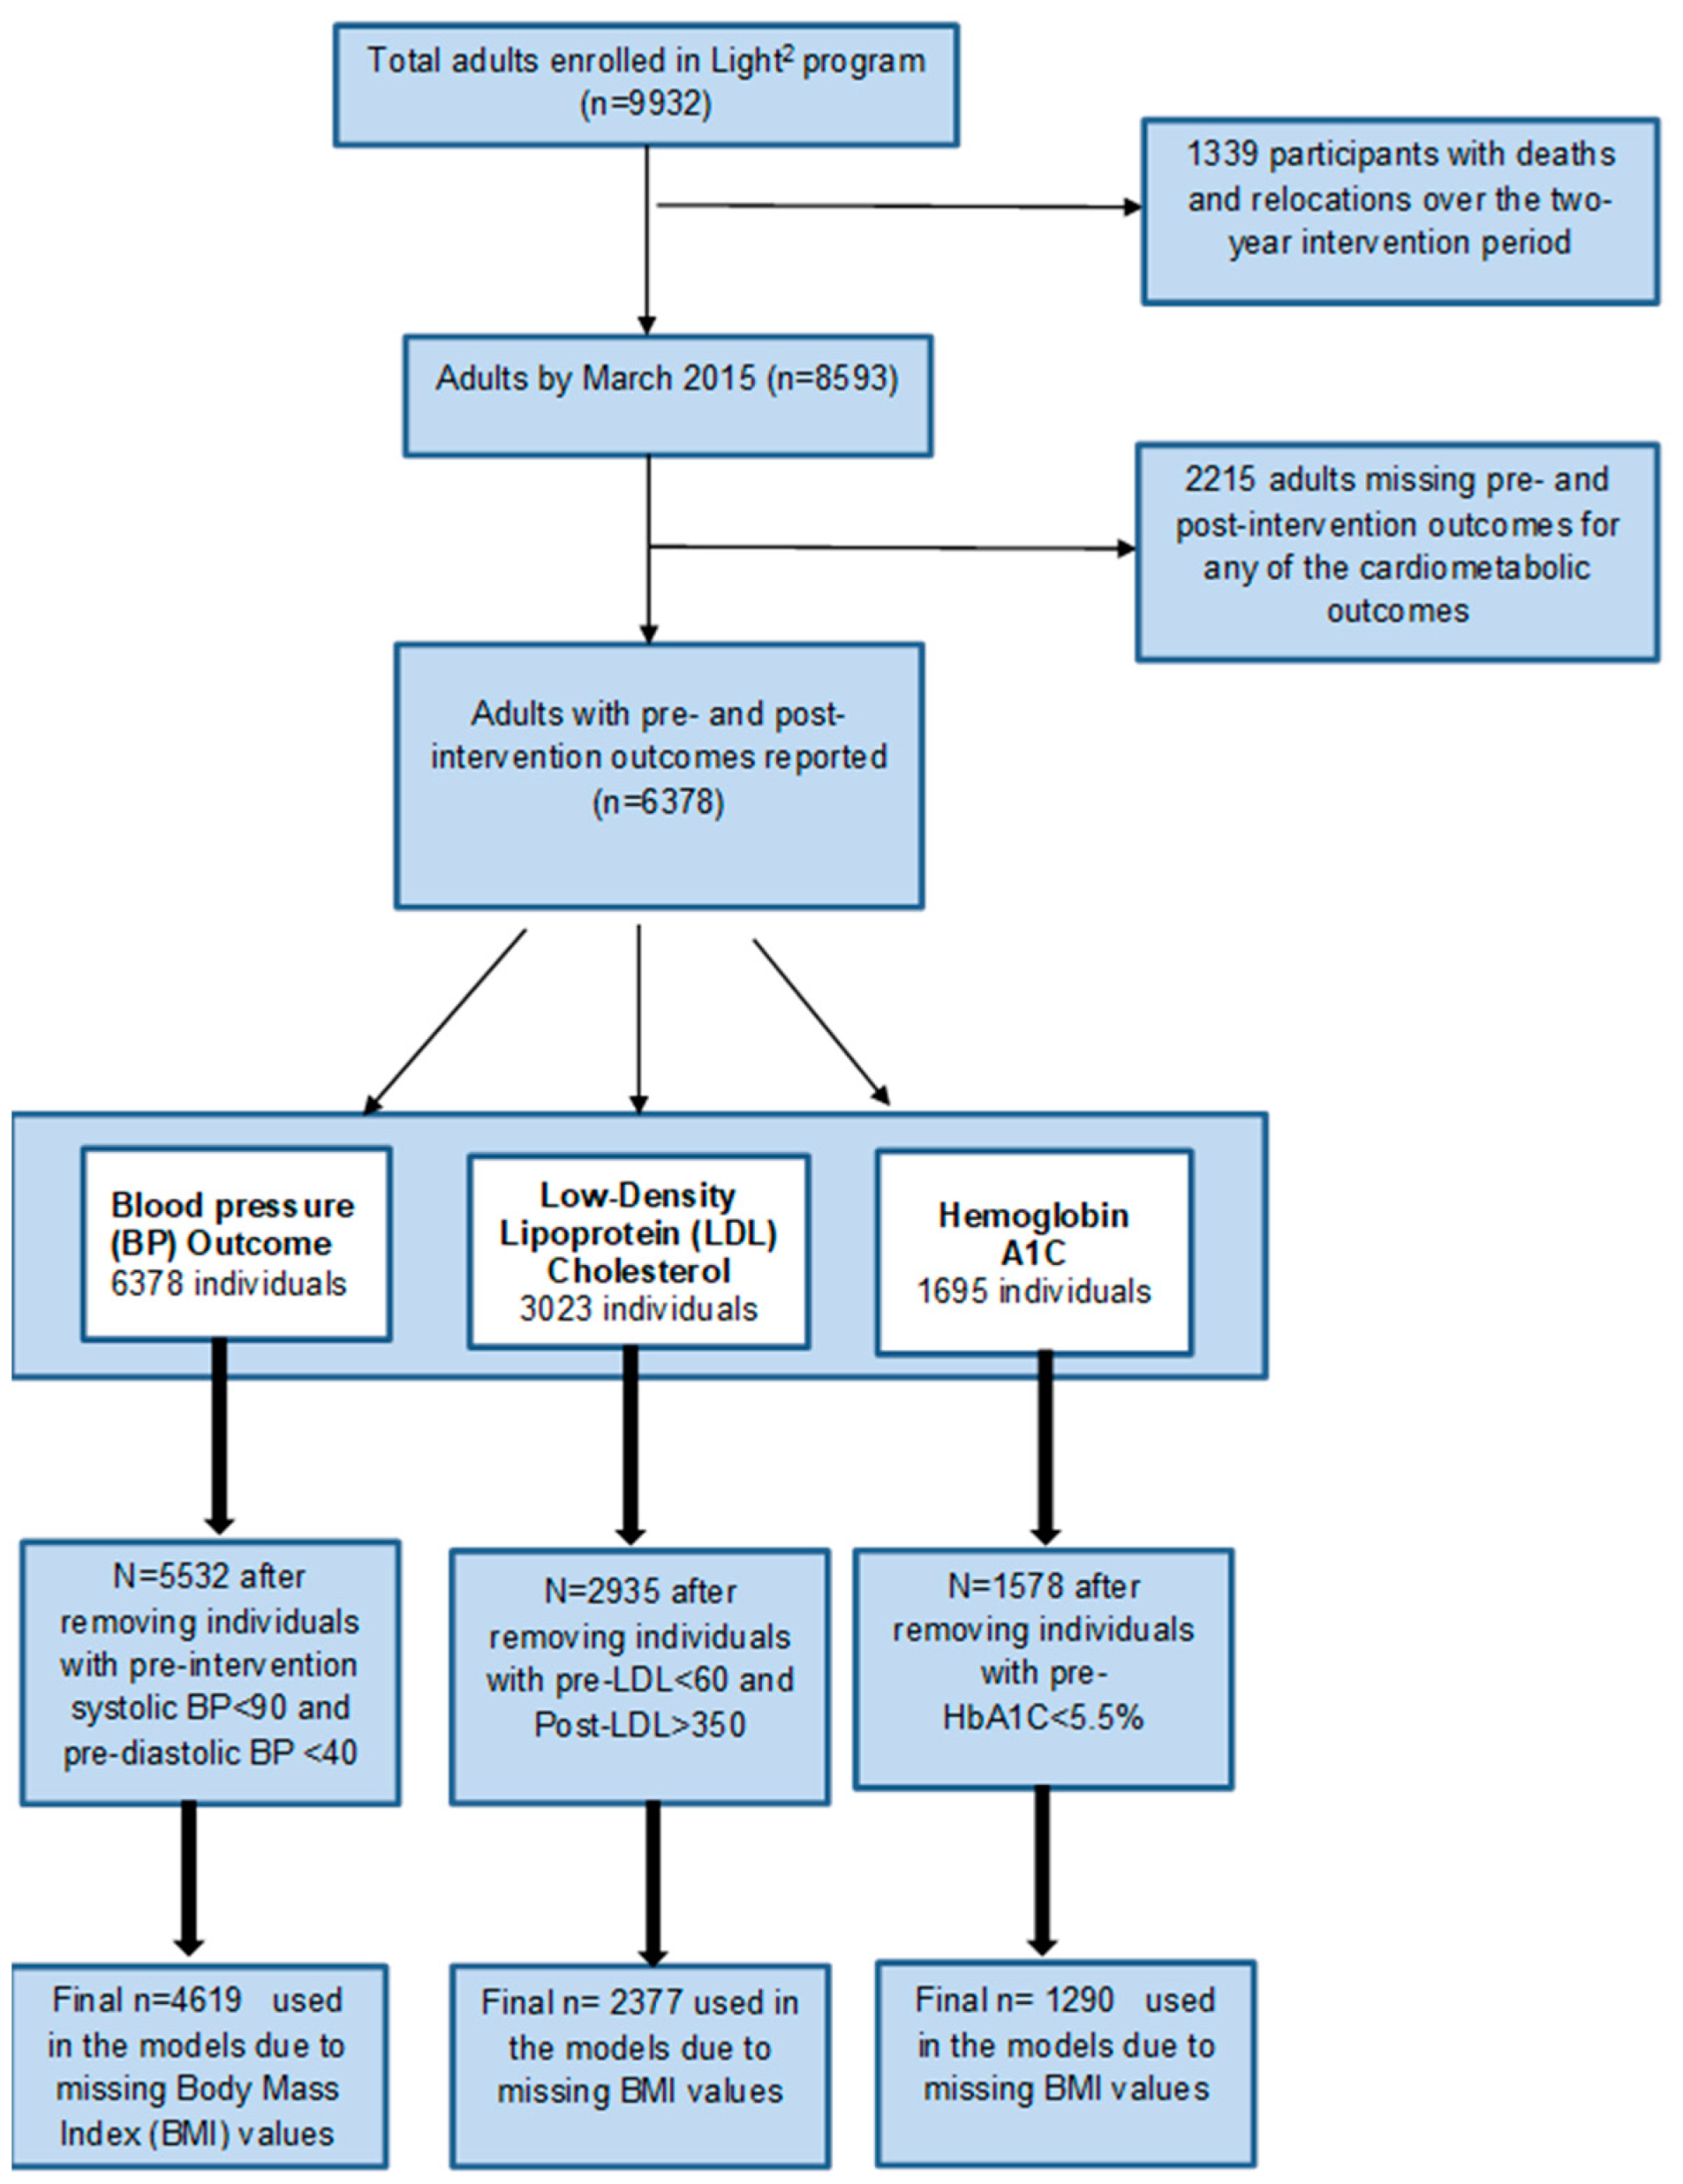
Funded with a Centers for Medicare and Medicaid Services (CMS) innovation award, the LIGHT2 program was a combination of information technology components (High Tech) and health care coordination by nurse care managers (High Touch) [22] (pp. 231–292), [24]. The High-Tech component included dashboards and a patient portal for communication with physicians and nurse care managers. The High Touch component was care coordination provided by nurse care managers; 25 nurse care managers worked in 10 family and community medicine and internal medicine clinics providing services. Patients were assigned tiers based on their chronic disease diagnoses and health care utilization in the previous 12 months [25]. Nurse care managers provided as-needed education and support for patients regarding new chronic disease diagnoses or worsening of chronic conditions. A documentation system measuring the frequency and time of nurse care manager contacts was created using the Agency of Healthcare Research and Quality (AHRQ) care coordination atlas [24,26]. The study compiled data on claims and participants’ EHR data, including healthcare utilization, clinic visits, basic demographic data, diagnosis, labs, and nurse care coordination contacts, along with geocoded patient addresses. Cohort recruitment started in February 2013; 9932 participants were recruited by July 2013. Deaths and relocations decreased the number of participants to 8593 by March 2015. The goals of the LIGHT2 intervention were to achieve net cost savings, increase preventive service use, and improve the management of chronic diseases. The final evaluation of the program showed higher spending and inpatient admissions than the comparison group [22] (pp. 231–292). Nominal improvements were seen for chronic disease management across all tiers. In higher-risk tiers, patients’ Hba1c control improved from 18% to 12% but worsened slightly in low-risk tiered patients from 9% to 10%. The LDL cholesterol did not change in the high-risk tiers, whereas for patients in low-risk tiers, LDL cholesterol controls improved from 60% to 71%. Hypertension control worsened in low-risk tiered patients by 23% and in high-risk tiered patients by 29% [22]. The cardiometabolic measures monitored during the LIGHT2 intervention were hemoglobin A1C (HbA1C), blood pressure (B.P.), and low density-lipoprotein (LDL) cholesterol. Primary results showed minimal changes in cardiometabolic outcomes. Detailed results of primary outcomes, nurse care coordination implementation and fidelity of LIGHT2 have been previously published [22] (pp. 231–292), [24].

2.2. Participants

The participants were all Medicare, Medicaid, or dual-eligible patients receiving primary care services in any of 10 family and community medicine or internal medicine clinics in the MUHC system during the project period. Because we examined factors associated with a change in cardiometabolic measures, we included only participants with at least one of the three outcomes, HbA1C, LDL cholesterol, or B.P. reported before and after the intervention completion.

2.3. Outcomes

We extracted HbA1C, BP, and LDL-cholesterol levels before and after the LIGHT2 program. The recruitment was complete, and the care coordination documentation system was implemented on 1 July 2013. We used measures reported within 6 months before that date or before the first nurse care manager contact within the first 3 months of the intervention as the pre-intervention values. For post-intervention measures, we used the values reported within 6 months after the intervention completion date. If there were no values reported in the 6 months after the completion of the intervention, we used the last reported value within the last 3 months of the intervention. We used the average of the last two reported B.P. readings if there were multiple readings in the defined pre-intervention and post-intervention time-period. Individuals with very low pre-intervention values were not included in the analyses. More specifically, if pre-intervention LDL < 60 mg/dL, pre-intervention HbA1C < 5.5%, pre-intervention diastolic B.P. < 40 mm of Hg, and pre-intervention systolic B.P. < 90 mm of Hg, individuals were excluded from the respective analysis. We also excluded individuals with two extremely high values (above 350) of post-intervention LDL cholesterol from the analysis for LDL-cholesterol outcomes. The population was comprised of 6378 individuals after exclusions.

2.4. Variables

Factors that affect the effectiveness of health interventions: We included clinical and geospatial variables accounting for the majority of the National Academy of Medicine (NAM) recommended social and behavioral domains and measures that influence health outcomes and effectiveness of treatments [27,28]. We identified clinical, sociodemographic, and area-level proxy variables that can be easily extracted from routinely collected clinical and sociodemographic data in the EHR. The variables included for NAM recommended domains were: (1) race and ethnicity, which was extracted at the individual-level from EHR; (2) education, which is also a proxy for health literacy, was extracted at the neighborhood level; (3) financial resource strain was extracted as poverty and access to healthy food at the neighborhood level; (4) stress and depression were denoted by the presence of mood disorders at an individual level from EHR; (5) physical activity opportunities were extracted at neighborhood level; (6) tobacco and alcohol status was extracted at individual level from EHR; (7) social connections and isolation were measured by marital status at individual level in EHR and neighborhood-level social capital; and (8) intimate partner violence was measured by neighborhood-level domestic violence injury rates.
Clinical and sociodemographic variables: We included basic demographic data such as age, sex, and race/ethnicity. We extracted smoking and alcohol use status as of the first day of the intervention. We extracted the total number of comorbidities, nurse care manager contacts, and presence or absence of a mood disorder reported as of the last day of the intervention based on the International Classification of Diseases, Ninth Revision, Clinical Modification diagnosis codes (ICD 9 codes). As baseline cardiometabolic measures, including body mass index (BMI), are used by clinicians for CVD risk stratification, we adjusted for baseline values of cardiometabolic measures. As the LIGHT2 program was focused on nurse-led care coordination for healthcare utilization and chronic disease management, we adjusted for health resource utilization, nurse care manager contacts, and the number of comorbidities. We defined high-resource healthcare utilizers as individuals with four or more emergency room visits or two or more inpatient encounters in the previous 12 months.
Geospatial variables: The patient’s residential address and primary care physician’s (PCP) clinic addresses were geocoded using ArcGIS Online World Geocoding Service [29]. We included neighborhood-level measures of poverty, education, social capital, domestic violence injury rates, access to healthy food and physical activity, and driving distance to primary care clinics. If a patient was seen at two or more primary care clinic locations during the intervention period, we coded the distance to the clinic as missing to avoid misattributions. For calculating the travel distance to the closest grocery store from patients’ geocoded address, supermarket locations were obtained from the Reference USA US Businesses dataset [30,31]. The neighborhood-level poverty was extracted using the percentage of population <200% federal poverty level (FPL) and was extracted at the census-tract level, and the percentage of the population without high a school diploma was determined at the census-block group level [32]. Neighborhood social capital for patients’ ZIP-code level was assessed using the number of civic or social organizations per capita, obtained by summarizing data from the 2017 U.S. Census Bureau ZIP code Business Patterns [33]. Domestic violence injury rates were extracted at the ZIP-code level of the patient’s geocoded address. To assess opportunities for physical activity, we generated WalkScore™ values for each patient’s census block [34]. The visual assessment found that the WalkScore™ dataset did not represent physical activity opportunities in areas with networks of unpaved trails, such as our local county and rural areas; hence, we excluded these measures. See Supplementary File S1 for a detailed description of methods used for determining neighborhood-level social risks in our analysis.

2.5. Statistical Methods

After adjusting for covariates, we examined post-intervention HbA1C, LDL, and B.P. controlling for pre-intervention values (from before the 1 July 2013 nurse-led care coordination start date to after the end of the project in June 2015). A dataset was created with de-identified records for each patient containing their clinical and sociodemographic information and geocoded residential addresses. Geocoded residential addresses of patients were used to extract neighborhood-level variables. The data analysis was conducted on data between November 2019 and October 2020. We fitted a separate generalized linear model (GLM) for each of these measures as the dependent variable. We adjusted for covariates, including pre-intervention measures and pre-intervention body mass index (BMI). The GLM model assumptions were checked. Using the Pearson correlation between continuous variables, we chose one variable from each group of variables. Variance Inflation Factors (VIF) were calculated as 1/(type I tolerance) of the GLM model for categorical variables, and a cutoff point of 5 was used. The overall fit of the models was assessed using the coefficient of determinations (R2). The R2 value shows the percentage of variance in the dependent variable that is predictable from the independent variables collectively and gives the strength of the relationship. Although there is no standard for acceptable R2, it is suggested that the R2 values of 0.02, 0.13, 0.26 correspond to small, medium, and large effect sizes, respectively [35]. We report statistical significance at p < 0.05. The analysis was performed using SAS software.
Model 1: Included covariates readily available in the clinical chart as follows: age, gender, race/ethnicity, marital status, smoking status, alcohol use, healthcare utilization 12 months before the study’s start date, pre-intervention cardiometabolic measure levels, pre-intervention BMI, presence of mood disorder, total number of chronic health conditions, and total number of nurse care manager contacts during the study period. Significant interactions between the covariates and the pre-intervention values were included in the model.
Model 2: Included the covariates in Model 1 and also included neighborhood-level measures of poverty, education, social capital, and domestic violence injury rates.
Model 3: Included the covariates in Model 2 and added physical determinants of access to healthy food (grocery store) and healthcare (PCP clinic location) from the patient’s geocoded address.
Parsimonious Model: We used a backward-selection technique, with a level of significance of 0.05 to obtain a parsimonious model. Parsimonious models achieve better predictability and desired level of goodness of fit with as few explanatory variables as possible.
At the census-block group level, we noted collinearity among the percentage of the population below 200% of the FPL and the Area Deprivation Index [36]. Thus, we included only the percentage of the population below 200% of the FPL in our models. We dichotomized driving time to PCP clinic location to 30 min or less and over 30 min, as Health Professional Shortage Area (HPSA) designation utilizes driving time of more than 30 to 40 min to the nearest source of care as one of the scoring criteria [37]. Based on frequency distributions and outliers, we represented the percentage of the population without a high school diploma and the number of nurse care manager contacts as categorical variables by quartiles.
Sensitivity analysis: We performed two additional analyses for each outcome: (1) We fitted a mixed-effects model to test for random variability across clinics. (2) We fitted a mixed-effects model to test for random variability across all included patients’ census tracts (137 census tracts). Various area-level measures included in our analyses were associated with different geographic areas; hence, an overall nested analysis was not possible.
Power analysis: There were 8593 participants in the LIGHT2 cohort. With 6000 participants, we were well-powered to detect clinically important differences in CVD risk factors. For example, we will be able to detect a 4 mm difference in systolic blood pressure at the 0.05 level of significance with greater than 85% power.

3. Results

Of 8593 eligible participants in the LIGHT2 cohort, 6378 participants had at least one cardiometabolic measure reported both before and after the intervention. The Figure 1 Flow Diagram illustrates the derivation of participants for each cardiometabolic measure.
The cohort description is included in Table 1. Because our cohort was primarily White, non-Hispanic ethnicity (86.3%), we dichotomized the race/ethnicity variable. The presence of mood disorder was reported in 1475 (23.13%) participants, of which 32.36% were male participants and 67.64% were female participants.
We obtained LDL cholesterol outcomes for 2377 participants, HbA1C for 1290 participants, and B.P. outcomes for 4619 participants. The results of all models were consistent. The final parsimonious models showed significant worsening of LDL-cholesterol associated with higher pre-intervention LDL-cholesterol levels (β 0.56, 95% CI 0.52 to 0.60, p < 0.001), significant worsening of HbA1C associated with higher pre-intervention HbA1C levels (main effect β 0.51, 95% CI 0.43 to 0.59, p < 0.001), significant worsening of systolic and diastolic BP with higher pre-intervention systolic BP (main effect β 0.95, 95% CI 0.83 to 1.08, p < 0.001), and higher pre-intervention diastolic BP (main effect β 0.83, 95% CI 0.75 to 0.91, p < 0.001), respectively. LDL-cholesterol worsened for women compared with men (β 7.76, 95% CI 5.21 to 10.32, p < 0.001). There was a significant interaction between pre-intervention HbA1C and gender (main effect β −1.29, 95% CI −1.95 to −0.62, p < 0.001; interaction effect β 0.19, 95% CI 0.09 to 0.28, p < 0.001), with HbA1C worsening if the pre-intervention HbA1C was more than 6.8% in women compared with men (Figure S3). The interaction between gender and pre-intervention systolic BP levels (main effect β −7.86, 95% CI −15.55 to −0.17 p = 0.045; interaction effect β 0.06, 95% CI 0.002 to 0.12, p = 0.043) indicates worsening trend in systolic BP for women compared with men with pre-intervention systolic BP level >131 mm Hg. All other associations were inconsistent across all cardiometabolic measures. The coefficient of determinations (R2) did not change significantly with the addition of neighborhood-level variables. See Table 2, Table 3 and Table 4 for results from parsimonious models for LDL- cholesterol, HbA1C, and systolic B.P. outcomes and Supplementary Table S1 for results from the parsimonious model for diastolic B.P. outcomes. See Supplementary Tables S2–S5 for detailed models for all measures and R2 for all models. See Supplementary Figures S1 and S2 for the interaction of female sex with pre-intervention systolic B.P. on adjusted change in systolic B.P. and diastolic B.P., respectively. See Supplementary Figure S3 for the interaction of female sex with pre-intervention HbA1C on adjusted change in HbA1C. The interaction between female sex and mood disorder was only significant for diastolic BP outcomes (main effect β −5.33, 95% CI −9.75 to −0.19 p = 0.018; interaction effect β 1.63, 95% CI 0.55 to 2.98, p = 0.003). The results from both the mixed-effects model for clinics and census tracts show no significant changes in the parameter estimates for significant associations. Supplementary Tables S6–S9 give the solution to the random effect of clinics and the variability.

4. Discussion

In predominantly white suburban and rural participants from a two-year nurse-led care coordination program, we found higher pre-intervention cardiometabolic measures were associated with worsening post-intervention levels. Individuals with increased cardiometabolic risks may not benefit from solely clinic-based care coordination and may need additional support for self-management between clinic visits. Additionally, we found women’s LDL-cholesterol worsened compared with men, and women with high pre-intervention HbA1C (>6.8%) and B.P. (>131 mm Hg systolic B.P.) became worse compared with men despite clinic-based, nurse-led care coordination. In women with increased cardiometabolic risks, there may be additional psychosocial or behavioral contexts that may not be addressed by solely clinic-based care coordination. While there were some inconsistent findings across outcomes, the addition of neighborhood-level risks based on geocoded residential addresses did not significantly change the associations or fit of models compared to models based on variables that are routinely available in clinical charts. This is consistent with previous studies investigating the impact of community-level determinants on risk predictions and outcomes [21,38,39]. There may be additional gender-specific social and behavioral contexts that impact cardiometabolic risks that are not captured by EHR or neighborhood-level variables.
Our results differ from several previous studies that have shown nurse case management improves diabetes and hypertension control [40,41]. Our results may be different from previous studies as nurses in the LIGHT2 program provided care coordination and as-needed chronic disease education during clinic visits. Most other studies of nurse-led interventions included additional case management or disease management components delivered during and between clinic visits [40,41,42]. Individuals with higher baseline cardiometabolic risks may have unresolved needs and preferences not addressed by solely clinic-based care coordination. Gender is the only socially stratifying factor present in >50% of our cohort [43]. Our findings of worsening cardiometabolic outcomes in women compared with men when baseline B.P. and HbA1c were high may indicate additional psychosocial contexts for women with uncontrolled hypertension or diabetes that limit their ability to benefit from solely clinic-based interventions [44,45,46,47]. Further research to understand and address gender-specific needs and preferences in individuals with increased cardiometabolic risks may help tailor team-based care between the clinic and community-based team members.
Strengths of our study: Our study is the first study assessing the interaction of clinical factors and neighborhood-level social risks to identify individuals that may not benefit from clinic-based care coordination. We only included variables that can be extracted from clinical charts or based on the patient’s home address in the demographic section of clinical charts to avoid burdening PCPs with additional individual social and behavioral risk screenings [15,16]. We separated our models based on covariates available in clinical charts, covariates extracted at the neighborhood-level (zip code or census tract), and covariates extracted by calculating the distance from geocoded addresses. In addition to variables accounting for the NAM recommended social and behavioral domains, our study included one factor associated with each of the five key areas of social determinants of health included in the place-based organizing framework developed by Healthy People 2020; namely, economic stability, education, social and community context, neighborhood environment, and healthcare [48,49].
Weaknesses of our Study: We acknowledge several limitations. First, the cohort consists of Medicaid, Medicare, or dual-eligible beneficiaries of predominantly white, non-Hispanic ethnicity from Midwestern primary care clinics, which may limit the generalizability of our findings. Second, physical activity is one of the primary CVD risk factors, but we could not identify reliable neighborhood-level measures of physical activity opportunities for our cohort of suburban and rural participants [50,51]. Third, though burdensome, individual-level social and behavior risks, rather than neighborhood-level risks, can improve the ability to predict which patients may benefit from supplementary clinic-community linked interventions [38,52,53]. Lastly, we acknowledge that the LIGHT2 care coordination program focused on super-utilizers and reducing care fragmentation rather than reducing health disparities [22].

5. Conclusions

We found higher baseline cardiometabolic risks and gender were commonly associated with worsening cardiometabolic outcomes in predominantly White suburban and rural participants from a clinic-based care coordination program. The addition of neighborhood-level risks based on patients’ residential addresses did not change estimates of associations beyond routinely collected clinical and sociodemographic data in EHR. Further research to understand gender-specific needs and preferences of individuals with increased cardiovascular risks may aid in tailoring clinic-community-linked team-based care.

Supplementary Materials

The following supporting information can be downloaded at: https://0-www-mdpi-com.brum.beds.ac.uk/article/10.3390/jcm11102897/s1, Supplementary File S1: Detailed methods for determining neighborhood-level social risks and driving time to PCP clinic location; Table S1 Results of Parsimonious model for diastolic blood pressure outcome; Table S2: Multivariable models of LDL cholesterol for 2377 participants with pre-and post-intervention measures; Table S3: Multivariable models of hemoglobin A1C for 1290 participants with pre-and post-intervention measures; Table S4: Multivariable models of systolic blood pressure for 4618 participants with pre-and post-intervention measures; Table S5: Multivariable models of diastolic blood pressure for 4619 participants with pre-and post-intervention measures.; Table S6: Solution for Random Effects by clinics, LDL outcome; Table S7: Solution for Random Effects by clinics: HbA1C Outcome; Table S8: Solution for Random Effects by clinics: Systolic B.P.; Table S9: Solution for Random Effects by clinics, Diastolic B.P. outcome; Figure S1: Interaction of female sex with pre-intervention systolic B.P. on adjusted change in systolic B.P.; Figure S2: Interaction of female sex with pre-intervention systolic B.P. on adjusted change in diastolic B.P.; Figure S3: Interaction of female sex with pre-intervention HbA1C on adjusted change in HbA1C. References [29,30,31,32,33,34,54,55] are cited in the supplementary materials.

Author Contributions

Conceptualization, S.J.P.; Acquisition, analysis, or interpretation of data: S.J.P., M.G., A.J., Y.W., J.C.P., R.B.S., D.H.-J., D.R.M., R.E.F. and R.L.K.; Drafting of the manuscript: S.J.P. and M.G.; Critical revision of the manuscript for important intellectual content: All authors.; Statistical analysis: M.G., Y.W. and S.J.P.; Administrative, technical, or material support: A.J.; Supervision: R.L.K., R.E.F. and D.R.M. All authors have read and agreed to the published version of the manuscript.

Funding

Patil was supported by the National Center for Advancing Translational Sciences of the National Institutes of Health under Award Number KL2 TR002346. The content is solely the responsibility of the authors and does not necessarily represent the official views of the National Institutes of Health. This publication was made possible by Grant Number 1C1CMS331001-01-00 from the Department of Health and Human Services (HHS), Centers for Medicare and Medicaid Services. The contents of this publication are solely the responsibility of the authors and do not necessarily represent the official views of the U.S. Department of Health and Human Services or any of its agencies.

Institutional Review Board Statement

This study involves human participants, but an Ethics Committee or Institutional Board exempted this study— the University of Missouri Institutional Review Board (IRB) committee exempted this study. The University of Missouri IRB determined the LIGHT2 program to be a quality improvement activity that was exempt from IRB review and did not need patient consent.

Informed Consent Statement

The project was given an exempt status and no patient consent was required.

Data Availability Statement

The LIGHT2 project was funded by a Centers for Medicare and Medicaid Services (CMS) innovation award and all data was shared with the funding agency [https://downloads.cms.gov/files/cmmi/hcia-crppm-thirdannrptaddendum.pdf] (pp. 231–292) (accessed on 10 May 2022). The datasets used and/or analyzed during the current study are available from the corresponding author on reasonable request.

Conflicts of Interest

The authors declare no conflict of interest.

References

  1. National Center for Health Statistics. With Special Feature on Racial and Ethnic Health Disparities. 2015. Available online: https://pubmed.ncbi.nlm.nih.gov/27308685 (accessed on 1 December 2020).
  2. Benjamin, E.J.; Virani, S.S.; Callaway, C.W.; Chamberlain, A.M.; Chang, A.R.; Cheng, S.; Chiuve, S.E.; Cushman, M.; Delling, F.N.; Deo, R.; et al. Heart disease and stroke statistics-2018 update: A report From the American Heart Association. Circulation 2018, 137, e67–e492. [Google Scholar] [CrossRef] [PubMed]
  3. Cunningham, T.J.; Croft, J.B.; Liu, Y.; Lu, H.; Eke, P.I.; Giles, W.H. Vital signs: Racial disparities in age-specific mortality among Blacks or African Americans—United States, 1999–2015. MMWR Morb. Mortal Wkly. Rep. 2017, 66, 444–456. [Google Scholar] [CrossRef] [PubMed]
  4. Sterling, M.R.; Echeverría, S.E.; Commodore-Mensah, Y.; Breland, J.Y.; Nunez-Smith, M. Health equity and implementation science in heart, lung, blood, and sleep-related research: Emerging themes from the 2018 Saunders-Watkins Leadership Workshop. Circ. Cardiovasc. Qual. Outcomes 2019, 12, e005586. [Google Scholar] [CrossRef] [PubMed]
  5. Shah, N.S.; Molsberry, R.; Rana, J.S.; Sidney, S.; Capewell, S.; O’Flaherty, M.; Carnethon, M.; Lloyd-Jones, D.M.; Khan, S.S. Heterogeneous trends in burden of heart disease mortality by subtypes in the United States, 1999–2018: Observational analysis of vital statistics. BMJ 2020, 370, m2688. [Google Scholar] [CrossRef]
  6. Shen, X.; DiMario, S.; Philip, K. Gender disparities in health resource utilization in patients with atherosclerotic cardiovascular disease: A retrospective cross-sectional study. Adv. Ther. 2019, 36, 3424–3434. [Google Scholar] [CrossRef] [Green Version]
  7. Care Coordination. Available online: https://www.ahrq.gov/professionals/prevention-chronic-care/improve/coordination/index.html (accessed on 30 November 2020).
  8. Gunderson, J.M.; Wieland, M.L.; Quirindongo-Cedeno, O.; Asiedu, G.B.; Ridgeway, J.L.; O’Brien, M.W.; Nelson, T.M.; Buzard, R.; Campbell, C.; Njeru, J.W. Community health workers as an extension of care coordination in primary care: A community-based cosupervisory model. J. Ambul. Care Manag. 2018, 41, 333–340. [Google Scholar] [CrossRef]
  9. Engaging Community Health Workers Recommended to Prevent Cardiovascular Disease. Available online: https://www.thecommunityguide.org/content/engaging-community-health-workers-recommended-prevent-cardiovascular-disease (accessed on 10 December 2020).
  10. Clinical-Community Linkages. Available online: https://www.ahrq.gov/professionals/prevention-chronic-care/improve/community/index.html (accessed on 5 December 2020).
  11. Mensah, G.A.; Cooper, R.S.; Siega-Riz, A.M.; Cooper, L.A.; Smith, J.D.; Brown, C.H.; Westfall, J.M.; Ofili, E.O.; Price, L.N.; Arteaga, S.; et al. Reducing cardiovascular disparities through community-engaged implementation research: A national heart, lung, and blood institute workshop report. Circ. Res. 2018, 122, 213–230. [Google Scholar] [CrossRef]
  12. Patil, S.J. Task sharing chronic disease self-management training with lay health coaches to reduce health disparities. Ann. Fam. Med. 2020, 18, 2–3. [Google Scholar] [CrossRef] [Green Version]
  13. Prasad, K.; Poplau, S.; Brown, R.; Yale, S.; Grossman, E.; Varkey, A.B.; Williams, E.; Neprash, H.; Linzer, M. Time pressure during primary care office visits: A prospective evaluation of data from the Healthy Work Place Study. J. Gen. Intern. Med. 2020, 35, 465–472. [Google Scholar] [CrossRef]
  14. Kaufman, A.; Dickinson, W.P.; Fagnan, L.J.; Duffy, F.D.; Parchman, M.L.; Rhyne, R.L. The role of health extension in practice transformation and community health improvement: Lessons from 5 case studies. Ann. Fam. Med. 2019, 17 (Suppl. 1), S67–S72. [Google Scholar] [CrossRef]
  15. Schickedanz, A.; Hamity, C.; Rogers, A.; Sharp, A.L.; Jackson, A. Clinician experiences and attitudes regarding screening for social determinants of health in a large integrated health system. Med. Care 2019, 57 (Suppl. 62), S197–S201. [Google Scholar] [CrossRef] [PubMed]
  16. Cottrell, E.K.; Dambrun, K.; Cowburn, S.; Mossman, N.; Bunce, A.E.; Marino, M.; Krancari, M.; Gold, R. Variation in Electronic Health Record Documentation of Social Determinants of Health Across a National Network of Community Health Centers. Am. J. Prev. Med. 2019, 57 (Suppl. 1), S65–S73. [Google Scholar] [CrossRef] [PubMed] [Green Version]
  17. Sigmund, C.D.; Carey, R.M.; Appel, L.J.; Arnett, D.K.; Bosworth, H.B.; Cushman, W.C.; Galis, Z.S.; Green Parker, M.; Hall, J.E.; Harrison, D.G.; et al. Report of the National Heart, Lung, and Blood Institute Working Group on Hypertension: Barriers to Translation. Hypertension 2020, 75, 902–917. [Google Scholar] [CrossRef] [PubMed]
  18. Taylor, L.A.; Tan, A.X.; Coyle, C.E.; Ndumele, C.; Rogan, E.; Canavan, M.; Curry, L.A.; Bradley, E.H. Leveraging the social determinants of health: What works? PLoS ONE 2016, 11, e0160217. [Google Scholar] [CrossRef] [PubMed]
  19. Cantor, M.N.; Chandras, R.; Pulgarin, C. FACETS: Using open data to measure community social determinants of health. J. Am. Med. Inform. Assoc. JAMIA 2018, 25, 419–422. [Google Scholar] [CrossRef]
  20. Sequist, T.D.; Taveras, E.M. Clinic-community linkages for high-value care. N. Engl. J. Med. 2014, 371, 2148–2150. [Google Scholar] [CrossRef] [Green Version]
  21. Zhang, Y.; Zhang, Y.; Sholle, E.; Abedian, S.; Sharko, M.; Turchioe, M.R.; Wu, Y.; Ancker, J.S. Assessing the impact of social determinants of health on predictive models for potentially avoidable 30-day readmission or death. PLoS ONE 2020, 15, e0235064. [Google Scholar] [CrossRef]
  22. Evaluation of the Health Care Innovation Awards: Community Resource Planning, Prevention, and Monitoring. pp. 231–292. Available online: https://downloads.cms.gov/files/cmmi/hcia-crppm-thirdannrptaddendum.pdf (accessed on 10 May 2022).
  23. von Elm, E.; Altman, D.G.; Egger, M.; Pocock, S.J.; Gøtzsche, P.C.; Vandenbroucke, J.P. The Strengthening the Reporting of Observational Studies in Epidemiology (STROBE) statement: Guidelines for reporting observational studies. Ann. Intern. Med. 2007, 147, 573–577. [Google Scholar] [CrossRef] [Green Version]
  24. Popejoy, L.L.; Jaddoo, J.; Sherman, J.; Howk, C.; Nguyen, R.; Parker, J.C. Monitoring resource utilization in a health care coordination program. Prof. Case Manag. 2015, 20, 310–320. [Google Scholar] [CrossRef]
  25. Sheets, L.; Popejoy, L.; Aprn, G.B.; Khalilia, M.; Petroski, G.; Parker, J.C. Identifying patients at risk of high healthcare utilization. AMIA Annu. Symp. Proc. 2016, 2016, 1129–1138. [Google Scholar]
  26. Care Coordination Measures Atlas Update. Available online: https://www.ahrq.gov/professionals/prevention-chronic-care/improve/coordination/atlas2014/index.html (accessed on 30 November 2020).
  27. Adler, N.E.; Stead, W.W. Patients in Context—EHR Capture of Social and Behavioral Determinants of Health. N. Engl. J. Med. 2015, 372, 698–701. [Google Scholar] [CrossRef] [PubMed] [Green Version]
  28. Giuse, N.B.; Koonce, T.Y.; Kusnoor, S.V.; Prather, A.A.; Gottlieb, L.M.; Huang, L.-C.; Phillips, S.E.; Shyr, Y.; Adler, N.E.; Stead, W.W. Institute of Medicine Measures of Social and Behavioral Determinants of Health: A Feasibility Study. Am. J. Prev. Med. 2017, 52, 199–206. [Google Scholar] [CrossRef] [PubMed] [Green Version]
  29. ESRI. ArcGIS Online World Geocoding Service; Environmental Systems Research Institute: Redlands, CA, USA, 2019. [Google Scholar]
  30. Infogroup Inc. ReferenceUSA [Dataset]. Available online: http://www.referenceusa.com (accessed on 5 November 2020).
  31. Low-Income and Low-Supermarket-Access Census Tracts, 2010–2015. Available online: https://www.ers.usda.gov/publications/pub-details/?pubid=82100 (accessed on 8 November 2020).
  32. 2014 TIGER/Line Shapefiles (Machine-Readable Data Files). Available online: https://www.census.gov/geographies/mapping-files/time-series/geo/tiger-line-file.2014.html (accessed on 2 November 2020).
  33. Rupasingha, A.; Goetz, S.J.; Freshwater, D. The production of social capital in US counties. J. Socio. Econ. 2006, 35, 83–101. [Google Scholar] [CrossRef]
  34. Walk Score API Sign Up. Available online: https://www.walkscore.com/professional/api-sign-up.php (accessed on 5 November 2020).
  35. Cohen, J. A power primer. Psychol. Bull. 1992, 112, 155–159. [Google Scholar] [CrossRef] [PubMed]
  36. Maroko, A.R.; Doan, T.M.; Arno, P.S.; Hubel, M.; Yi, S.; Viola, D. Integrating Social Determinants of Health with Treatment and Prevention: A New Tool to Assess Local Area Deprivation. Prev. Chronic Dis. 2016, 13, E128. [Google Scholar] [CrossRef] [Green Version]
  37. Shortage Designation Application and Review Process. Available online: https://bhw.hrsa.gov/shortage-designation/application-review-process (accessed on 5 December 2020).
  38. Chen, M.; Tan, X.; Padman, R. Social determinants of health in electronic health records and their impact on analysis and risk prediction: A systematic review. J. Am. Med. Inform. Assoc. 2020, 27, 1764–1773. [Google Scholar] [CrossRef]
  39. Holcomb, J.; Oliveira, L.C.; Highfield, L.; Hwang, K.O.; Giancardo, L.; Bernstam, E.V. Predicting health-related social needs in Medicaid and Medicare populations using machine learning. Sci. Rep. 2022, 12, 4554. [Google Scholar] [CrossRef]
  40. Norris, S.L.; Nichols, P.J.; Caspersen, C.J.; Glasgow, R.E.; Engelgau, M.M.; Jack, L.; Isham, G.; Snyder, S.R.; Carande-Kulis, V.G.; Garfield, S.; et al. The effectiveness of disease and case management for people with diabetes. A systematic review. Am. J. Prev. Med. 2002, 22 (Suppl. 4), 15–38. [Google Scholar] [CrossRef]
  41. Proia, K.K.; Thota, A.B.; Njie, G.J.; Finnie, R.K.; Hopkins, D.P.; Mukhtar, Q.; Pronk, N.P.; Zeigler, D.; Kottke, T.E.; Rask, K.J.; et al. Team-based care and improved blood pressure control: A community guide systematic review. Am. J. Prev. Med. 2014, 47, 86–99. [Google Scholar] [CrossRef] [Green Version]
  42. Kastner, M.; Cardoso, R.; Lai, Y.; Treister, V.; Hamid, J.S.; Hayden, L.; Wong, G.; Ivers, N.M.; Liu, B.; Marr, S.; et al. Effectiveness of interventions for managing multiple high-burden chronic diseases in older adults: A systematic review and meta-analysis. CMAJ 2018, 190, E1004–E1012. [Google Scholar] [CrossRef] [Green Version]
  43. O’Neill, J.; Tabish, H.; Welch, V.; Petticrew, M.; Pottie, K.; Clarke, M.; Evans, T.; Pardo Pardo, J.; Waters, E.; White, H.; et al. Applying an equity lens to interventions: Using PROGRESS ensures consideration of socially stratifying factors to illuminate inequities in health. J. Clin. Epidemiol. 2014, 67, 56–64. [Google Scholar] [CrossRef] [PubMed]
  44. Ikeda, A.; Iso, H.; Kawachi, I.; Yamagishi, K.; Inoue, M.; Tsugane, S. Living arrangement and coronary heart disease: The JPHC study. Heart 2009, 95, 577–583. [Google Scholar] [CrossRef] [PubMed] [Green Version]
  45. Stewart, A.L.; Magnani, J.W.; Barinas-Mitchell, E.; Matthews, K.A.; Khoudary, S.R.E.; Jackson, E.A.; Brooks, M.M. Social role stress, reward, and the American Heart Association Life 2019 Simple 7 in midlife women: The study of women 2019 health across the nation. J. Am. Heart Assoc. 2020, 9, e017489. [Google Scholar] [CrossRef] [PubMed]
  46. Johnson, P.J.; Jou, J.; Upchurch, D.M. Health Care Disparities Among U.S. Women of Reproductive Age by Level of Psychological Distress. J. Womens Health 2019, 28, 1286–1294. [Google Scholar] [CrossRef] [PubMed]
  47. Johnson, P.J.; Jou, J.; Upchurch, D.M. Psychological distress and access to care among midlife women. J. Aging Health 2020, 32, 317–327. [Google Scholar] [CrossRef]
  48. Committee on the Recommended Social and Behavioral Domains and Measures for Electronic Health Records; Board on Population Health and Public Health Practice; Institute of Medicine. Capturing Social and Behavioral Domains and Measures in Electronic Health Records: Phase 2; National Academies Press: Washington, DC, USA, 2015. [Google Scholar]
  49. Healthy People 2030: Social Determinants of Health. Available online: https://health.gov/healthypeople/objectives-and-data/social-determinants-health (accessed on 10 December 2020).
  50. Tamura, K.; Langerman, S.D.; Ceasar, J.N.; Andrews, M.R.; Agrawal, M.; Powell-Wiley, T.M. Neighborhood Social Environment and Cardiovascular Disease Risk. Curr. Cardiovasc. Risk Rep. 2019, 13, 7. [Google Scholar] [CrossRef]
  51. Hansen, A.Y.; Umstattd Meyer, M.R.; Lenardson, J.D.; Hartley, D. Built Environments and Active Living in Rural and Remote Areas: A Review of the Literature. Curr. Obes. Rep. 2015, 4, 484–493. [Google Scholar] [CrossRef]
  52. Cottrell, E.K.; Hendricks, M.; Dambrun, K.; Cowburn, S.; Pantell, M.; Gold, R.; Gottlieb, L.M. Comparison of community-level and patient-level social risk data in a network of community health centers. JAMA Netw. Open. 2020, 3, e2016852. [Google Scholar] [CrossRef]
  53. Zulman, D.M.; Maciejewski, M.L.; Grubber, J.M.; Weidenbacher, H.J.; Blalock, D.V.; Zullig, L.L.; Greene, L.; Whitson, H.E.; Hastings, S.N.; Smith, V.A. Patient-Reported Social and Behavioral Determinants of Health and Estimated Risk of Hospitalization in High-Risk Veterans Affairs Patients. JAMA Netw. Open 2020, 3, e2021457. [Google Scholar] [CrossRef]
  54. 2010–2014 American Community Survey 5-year Estimates [Data File]. Available online: https://www2.census.gov/programs-surveys/acs/summary_file/2014/data/5_year_entire_sf/ (accessed on 2 November 2020).
  55. ESRI. ArcGIS Desktop: Release 10; Environmental Systems Research Institute: Redlands, CA, USA, 2018. [Google Scholar]
Figure 1. Flow Diagram illustrating the derivation of participants for each cardiometabolic measure.
Jcm 11 02897 g001
Table 1. Characteristics of the study sample (N = 6378).
VariableTotal
Demographics
  Age (mean, SD)62.67 (18.5)
  Sex (frequency [%])
    Female3928 (61.59)
    Male2450 (38.41)
  Race (frequency [%])
    White non-Hispanic5507 (86.34)
    Other871 (13.66)
  Marital status (frequency [%])
    Married2746 (43.05)
    Other892 (13.99)
    Single1622 (25.43)
    Widowed1118 (17.53)
Cardiometabolic measures (mean, S.D.)
  Pre-intervention LDL (mg/dL)106.26 (31.55)
  Post-intervention LDL (mg/dL)99.41 (36.22)
  Pre-intervention HbA1c (%)6.94 (1.43)
  Post-intervention HbA1c (%)7.09 (1.53)
  Pre-intervention systolic BP (mm of Hg)132.74 (14.17)
  Post-intervention systolic BP (mm of Hg)131.14 (17.61)
  Pre-intervention diastolic BP (mm of Hg)75.83 (7.64)
  Post-intervention diastolic BP (mm of Hg)75.05 (9.69)
Neighborhood characteristics
  Percentage of population below 200% of the FPL (mean, SD) for patient’s census-tract36.14 (14.30)
  Percentage of population that did not graduate from high school for patient’s census-block group (frequency [%])
    Quartile 1: <3.17%2049 (32.13)
    Quartile 2: 3.17–8.79%1519 (23.82)
    Quartile 3: 8.79–14.06%1325 (20.77)
    Quartile 4: >14.06%1485 (23.28)
  Domestic violence injury rates (per 1000) for patient zip codes, 2011–2015 (mean, SD)0.39 (0.37)
Distance to nearest grocery store from patient’s geocoded address (miles)3.42 (3.69)
 Number of civic or social organizations per capita for patient zip codes (mean, SD)13.10 (4.9)
Health characteristics
  Number of comorbidities4.89 (4.23)
  Pre-intervention body mass index (kg/m2)30.35 (7.71)
  Current smoking (frequency [%])
    Yes1455 (22.81)
    No4810 (75.42)
    Missing113 (1.77)
  High-risk alcohol use (frequency [%])
    Yes110 (1.72)
    Unknown6368 (98.28)
  Presence of mood disorder (frequency [%])
    Yes1475 (23.13)
    Unknown4903 (76.87)
  Total number of nurse care manager contacts during the study period (frequency [%])
    Quartile 1: <51504 (23.58)
    Quartile 2: 5–101489 (23.35)
    Quartile 3: 11–211745 (27.36)
    Quartile 4: >221640 (25.71)
  High versus low healthcare resource utilizer (frequency [%])
    High utilizer778 (12.2)
    Low utilizer5600 (87.8)
  Travel time to PCP office from geocoded addresses (frequency [%])
    <=30 min4004 (62.78)
    >30 min1331 (20.87)
    Unknown1043 (16.35)
SD = standard deviation, LDL = low density lipoprotein cholesterol, HbA1c = glycosylated hemoglobin, BP = blood pressure, FPL = federal poverty level, PCP = primary care provider.
Table 2. Results of Parsimonious model for LDL cholesterol outcome (R2 = 0.29).
ParameterAdjusted β (95% Confidence Limits)p-Value
Intercept68.66 (57.87, 79.44)<0.001
Pre-intervention BMI−0.19 (−0.35, −0.02)0.02
Pre-intervention LDL0.56 (0.52, 0.60)<0.001
Female (ref = male)7.76 (5.21, 10.32)<0.001
Non-White race (ref = White)−3.43 (−7.24, 0.38)0.077
Age−0.26 (−0.36, −0.17)<0.001
Number of comorbidities−0.47 (−0.79, −0.15)0.004
Percentage of area population below 200% of the FPL−0.14 (-0.23, −0.05)0.002
Domestic violence injury hospitalization rate (per 1000 population)−5.78 (−9.24, −2.33)0.001
LDL = low density lipoprotein, BMI = body mass index (kg/m2), ref = reference category, FPL = federal poverty level, R2 = unadjusted coefficient of determinations.
Table 3. Results of Parsimonious model for HbA1C outcome (R2 = 0.39).
ParameterAdjusted β (95% Confidence Limits)p-Value
Intercept3.73 (2.93, 4.53)<0.001
Pre-intervention HbA1C0.51 (0.43, 0.59)<0.001
Female (ref = male)−1.29 (−1.95, −0.62)<0.001
Pre-intervention HbA1C × female sex0.19 (0.09, 0.28)<0.001
Non-White race (ref = White)−1.16 (−1.94, −0.37)0.004
Pre-intervention HbA1C × non-White race0.14 (0.03, 0.25)0.01
Age−0.006 (−0.012, −0.00001)0.05
Current smoker (ref = No)
  Yes−0.20 (−0.38, −0.017)0.03
  Unknown−0.58 (−1.16, −0003)0.05
Civic and social associations rate (per 100,000 population)0.01 (−0.0008, 0.026)0.06
Distance to nearest grocery store from patient’s geocoded address in miles0.01 (−0.007, 0.03)0.25
HbA1C = hemoglobin A1C; ref = reference category, × = interaction symbol, R2 = unadjusted coefficient of determinations).
Table 4. Results of Parsimonious model for Systolic B.P. (R2 = 0.43).
ParameterAdjusted β (95% Confidence Limits)p-Value
Intercept−3.68 (−19.70, 12.34)0.65
Pre-intervention BMI0.096 (0.04, 0.15)<0.001
Pre-intervention SBP0.95 (0.83, 1.08)<0.001
Female (ref = Male)−7.86 (−15.55, −0.17)0.045
Pre-intervention SBP × female sex0.06 (0.002, 0.12)0.043
Age0.38 (0.17, 0.60)<0.001
Pre-intervention SBP × age−0.003 (−0.004, −0.0008)0.003
Number of comorbidities0.10 (0.009, 0.19)0.03
Female sex × mood disorder1.81 (0.96, 1.9)0.058
Percentage of area population below 200% of the FPL0.30 (0.18, 0.43)<0.001
Pre-intervention DBP × Percentage of area population below 200% of the FPL−0.004 (−005, −0.002)<0.001
Domestic violence injury hospitalization rate (per 1000)2.21 (1.16, 3.26)<0.001
BMI = body mass index (kg/m2), SBP = systolic blood pressure, FPL = Federal poverty level, DBP = diastolic blood pressure, × = interaction symbol, R2 = unadjusted coefficient of determinations.
Publisher’s Note: MDPI stays neutral with regard to jurisdictional claims in published maps and institutional affiliations.

