Next Article in Journal
Advances in Neuromodulation for Chronic Pain
Next Article in Special Issue
Incidence of SARS-CoV-2 Infection and Related Mortality by Education Level during Three Phases of the 2020 Pandemic: A Population-Based Cohort Study in Rome
Previous Article in Journal
Multimodality Imaging in Cardiomyopathies with Hypertrophic Phenotypes
Previous Article in Special Issue
Predictors of Mortality in Hemodialyzed Patients after SARS-CoV-2 Infection
 
 
jcm-logo
Article Menu

Article Menu

Article

Usefulness of the C2HEST Score in Predicting the Clinical Outcomes of COVID-19 in Diabetic and Non-Diabetic Cohorts

by
Damian Gajecki
1,†,
Adrian Doroszko
1,*,†,
Małgorzata Trocha
2,
Katarzyna Giniewicz
3,
Krzysztof Kujawa
3,
Marek Skarupski
4,
Jakub Gawryś
1,
Tomasz Matys
1,
Ewa Szahidewicz-Krupska
1,
Piotr Rola
5,
Barbara Stachowska
6,
Jowita Halupczok-Żyła
6,
Barbara Adamik
7,
Krzysztof Kaliszewski
8,
Katarzyna Kilis-Pstrusinska
9,
Krzysztof Letachowicz
10,
Agnieszka Matera-Witkiewicz
11,
Michał Pomorski
12,
Marcin Protasiewicz
13,
Marcin Madziarski
14,
Klaudia Konikowska
15,
Agata Remiorz
16,
Maja Orłowska
17,
Krzysztof Proc
18,
Małgorzata Szymala-Pedzik
19,
Joanna Zorawska
19,
Karolina Lindner
19,
Janusz Sokołowski
20,
Ewa A. Jankowska
21,22,‡ and
Katarzyna Madziarska
10,‡
add Show full author list remove Hide full author list
1
Clinical Department of Internal Medicine, Hypertension and Clinical Oncology, Faculty of Medicine, Wroclaw Medical University, Borowska 213, 50-556 Wroclaw, Poland
2
Department of Pharmacology, Faculty of Medicine, Wroclaw Medical University, Mikulicz-Radecki Street 2, 50-345 Wroclaw, Poland
3
Statistical Analysis Centre, Wroclaw Medical University, K. Marcinkowski Street 2-6, 50-368 Wroclaw, Poland
4
Faculty of Pure and Applied Mathematics, Wroclaw University of Science and Technology, Wybrzeże Wyspiańskiego Street 27, 50-370 Wroclaw, Poland
5
Department of Cardiology, Provincial Specialized Hospital, Iwaszkiewicza 5 Street, 59-220 Legnica, Poland
6
Department of Endocrinology, Diabetes and Isotope Therapy, Faculty of Medicine, Wroclaw Medical University, Ludwik Pasteur 4, 50-367 Wroclaw, Poland
7
Clinical Department of Anaesthesiology and Intensive Therapy, Faculty of Medicine, Wroclaw Medical University, Borowska Street 213, 50-556 Wroclaw, Poland
8
Department of General, Minimally Invasive and Endocrine Surgery, Faculty of Medicine, Wroclaw Medical University, Borowska Street 213, 50-556 Wroclaw, Poland
9
Clinical Department of Paediatric Nephrology, Faculty of Medicine, Wroclaw Medical University, Borowska Street 213, 50-556 Wroclaw, Poland
10
Clinical Department of Nephrology and Transplantation Medicine, Faculty of Medicine, Wroclaw Medical University, Borowska Street 213, 50-556 Wroclaw, Poland
11
Laboratory of Biological Activity Tests and Collection of Biological Material, Wroclaw Medical University, Borowska Street 211A, 50-556 Wroclaw, Poland
12
Clinical Department of Gynecology and Obstetrics, Faculty of Medicine, Wroclaw Medical University, Borowska Street 213, 50-556 Wroclaw, Poland
13
Clinical Department and Clinic of Cardiology, Wroclaw Medical University, Borowska Street 213, 50-556 Wroclaw, Poland
14
Clinical Department of Rheumatology and Internal Medicine, Faculty of Medicine, Wroclaw Medical University, Borowska Street 213, 50-556 Wroclaw, Poland
15
Department of Dietetics, Wroclaw Medical University, Parkowa Street 34, 51-616 Wroclaw, Poland
16
Clinical Department of Nephrology and Transplantation Medicine, Wroclaw University Hospital, Borowska Street 213, 50-556 Wroclaw, Poland
17
Department of Emergency Medicine, Wroclaw University Hospital, Borowska Street 213, 50-556 Wroclaw, Poland
18
Clinical Department of Rheumatology and Internal Medicine, Wroclaw University Hospital, Borowska Street 213, 50-556 Wroclaw, Poland
19
Clinical Department of Geriatrics, Wroclaw Medical University, Pasteur 4 Street, 50-367 Wroclaw, Poland
20
Department of Emergency Medicine, Faculty of Medicine, Wroclaw Medical University, Borowska Street 213, 50-556 Wroclaw, Poland
21
Institute of Heart Diseases, Wroclaw Medical University, Borowska Street 213, 50-556 Wroclaw, Poland
22
Institute of Heart Diseases, University Hospital in Wroclaw, Borowska Street 213, 50-556 Wroclaw, Poland
*
Author to whom correspondence should be addressed.
These authors contributed equally to this work.
Submission received: 22 January 2022 / Revised: 3 February 2022 / Accepted: 5 February 2022 / Published: 7 February 2022
(This article belongs to the Special Issue COVID-19: Special Populations and Risk Factors)

Abstract

:
Background: Diabetes mellitus is among the most frequent comorbidities worsening COVID-19 outcome. Nevertheless, there are no data regarding the optimal risk stratification of patients with diabetes and COVID-19. Since individual C2HEST components reflect the comorbidities, we assumed that the score could predict COVID-19 outcomes. Material and Methods: A total of 2184 medical records of patients hospitalized for COVID-19 at the medical university center were analyzed, including 473 diabetic patients and 1666 patients without any glucose or metabolic abnormalities. The variables of patients’ baseline characteristics were retrieved to calculate the C2HEST score and subsequently the diabetic and non-diabetic subjects were assigned to the following categories: low-, medium- or high-risk. The measured outcomes included: in-hospital mortality; 3-month and 6-month all-cause mortality; non-fatal end of hospitalization (discharged home/sudden-deterioration/rehabilitation) and adverse in-hospital clinical events. Results: A total of 194 deaths (41%) were reported in the diabetic cohort, including 115 in-hospital deaths (24.3%). The 3-month and 6-month in-hospital mortality was highest in the high-risk C2HEST stratum. The C2HEST score revealed to be more sensitive in non-diabetic-group. The estimated six-month survival probability for high-risk subjects reached 0.4 in both cohorts whereas for the low-risk group, the six-month survival probability was 0.7 in the diabetic vs. 0.85 in the non-diabetic group—levels which were maintained during whole observation period. In both cohorts, receiver operating characteristics revealed that C2HEST predicts the following: cardiogenic shock; acute heart failure; myocardial injury; and in-hospital acute kidney injury. Conclusions: We demonstrated the usefulness and performance of the C2HEST score in predicting the adverse COVID-19 outcomes in hospitalized diabetic subjects.

1. Introduction

Since the outbreak of coronavirus disease 2019 (COVID-19) in China in December 2019, considerable attention has been focused on its elucidation. The natural history and outcome of COVID-19 patients initially hospitalized in a medical ward remain unpredictable. Since the risk score systems have proven useful in clinical decision-making, there is an urgent need to help physicians effectively triage COVID-19 subjects. Numerous patients rapidly deteriorate after a period of relatively mild symptoms, emphasizing the need for early risk stratification. A few studies have aimed to develop predictive or risk score models in order to facilitate clinical decision making associated with COVID-19. Nevertheless, risk scores, such as SOFA and MEWS, lack sufficient sensitivity and specificity to predict mortality when applied to the COVID-19 cohort [1,2]. As a result, prognostic factors of COVID-19 patients among the European population are missing. Moreover, it remains unclear whether these models could be applied to the cohorts with specific comorbidities which are already known to worsen the disease course and affecting the outcome.
Diabetes mellitus is among the most frequent comorbidities in patients with COVID-19. Individuals with diabetes have been identified as having worse outcomes when infected by SARS-CoV-2. In diabetes, an imbalance between coagulation and fibrinolysis occurs, with increased levels of coagulation factors and the relative inhibition of the fibrinolytic system. Both insulin resistance and diabetes are associated with endothelial dysfunction, and enhanced platelet aggregation and activation [3]. These abnormalities favor the development of a hypercoagulable pro-thrombotic state. Nevertheless, as far as the literature is concerned, there are no data regarding the most appropriate risk stratification and management of patients with diabetes and COVID-19 [4]. The European Society of Cardiology (ESC) recognized hypertension, diabetes and severe obesity as concomitant conditions that may be associated with a more severe course of COVID-19 in its recent guidance for the diagnosis and management of cardiovascular disease during the COVID-19 pandemic. Of note, hypertension, obesity, and CVD are frequent comorbidities in patients with diabetes [5]. Therefore, special attention is required to stratify the risk appropriately, particularly since the disease may be associated with an increased severity of symptoms and complications [6].
The C2HEST score was initially implemented to predict the risk for atrial fibrillation and it is based on the simple comorbidities’ calculation. Since individual C2HEST components reflect the comorbidities, we assumed that the score could predict unfavorable clinical COVID-19 outcomes in subjects with concomitant diabetes mellitus. Liang et al. were the first to show that the count of comorbidities predicted critical illness in hospitalized subjects [7], which prompted us to investigate the predictive value of the C2HEST score in the COVID-19 cohort.
Hence, in this study, the analysis of hospitalized COVID-19 patients with and without diabetes mellitus was performed to verify the prognostic efficacy of the C2HEST score in predicting the outcomes, including death as well as non-fatal clinical events in the course of hospitalization in these subpopulations.

2. Materials and Methods

2.1. Study Design and Participants

We retrospectively analyzed the medical records of patients hospitalized for COVID-19 at the medical university center between February 2020 and June 2021. The protocol for the COLOS retrospective study was approved by the Institutional Review Board and Ethics Committee of Wroclaw Medical University, Wroclaw, Poland (No: KB-444/2021). The routine data were retrospectively collected; therefore, written informed consent to participate in this study was not required. The Bioethics Committee approved the publication of fully anonymized data.
All patients were admitted to the hospital because of COVID-19 symptoms and a positive test result for SARS-CoV-2. The testing was strictly based on the protocol published by the World Health Organization (WHO). Nasopharyngeal swab specimens were obtained from all patients and SARS-CoV-2 RNA was detected in the samples by reverse-transcription polymerase chain reaction (RT-PCR), strictly according to the manufacturer’s instructions. Diabetes mellitus was confirmed according to the American and Polish Diabetes Associations’ criteria.
The analyzed data included: demographic information; clinical characteristics; breathing support; smoking; comorbidities; home medication; laboratory results—and the course of hospitalization including applied treatment and adverse clinical events: shock; pulmonary embolism; deep vein thrombosis; myocardial infarction; myocardial injury; acute heart failure; stroke/TIA; pneumonia; complete respiratory failure; systemic inflammatory response syndrome SIRS; sepsis; acute kidney injury; acute liver; dysfunction; multiple organ dysfunction syndrome (MODS); and bleeding.

2.2. Follow Up and Outcomes

The follow up period started from the day of admission to the hospital and ended on the day of discharge or death. The entire hospitalization period was analyzed. Further information regarding the patients’ deaths was collected after 90 and 180 days from admission. Patient characteristics were obtained from individual clinical records.
The measured outcomes included: in-hospital mortality; 3-month and 6-month all-cause mortality; and the end of hospitalization not due to death (discharged home/emergency transfer to another center or deterioration/transferred for rehabilitation). Secondary outcomes included: the need for mechanical ventilation support; myocardial injury; shock; acute heart failure; pulmonary embolism; stroke; acute kidney injury; acute liver dysfunction; pneumonia; sepsis; systemic inflammatory response syndrome (SIRS); multiple organ dysfunction syndrome (MODS); and bleeding.

2.3. C2HEST Score Stratification

In this study, we included 473 patients with diabetes mellitus and 1666 non-diabetic patients who acted as the control group. The patients’ characteristics at baseline were retrieved from the dataset in order to calculate the C2HEST score with a total of 6 individual components including coronary artery disease (1 point); chronic obstructive pulmonary disease (COPD, 1 point each); hypertension (1 point); elderly (age  ≥  75 years, 2 points); systolic heart failure (HF, 2 points); and thyroid disease (1 point). Of note, the coronary artery disease criterion was met with a positive history of myocardial infarction or coronary revascularization (MI, as 1 point). Moreover, in subsequent sensitivity analyses, the “thyroid disease” was replaced more precisely with “hyperthyroidism” and “hypothyroidism”. These risk factors were determined based on a combination of medical record review and interview at baseline visits. Afterwards, the subjects were assigned to one of the three primary risk categories:
  • 0–1—low;
  • 2–3—medium;
  • ≥4—high.

2.4. Statistical Analysis

Descriptive data are presented as numbers and percentages for categorical variables, and as the mean with a standard deviation range (minimum–maximum) and number of non-missing values for numerical variables. As an omnibus test, a chi-square test was used for categorical variables with more than 5 expected cases in each group, whereas a Fisher exact test was used for cases with fewer cell counts. Welch’s ANOVA was performed for continuous variables due to unequal variances between risk-strata and a sample size large enough for appropriateness of asymptotic results. Post hoc analysis for continuous variables was performed using a Games–Howell test with Tukey correction. For categorical variables, a post hoc test was the same as the omnibus test but performed in subgroups with Bonferroni correction.
In-hospital mortality and all-cause mortality was available as right-censored data, so time-dependent ROC analysis with an inverse probability of censoring weighting (IPCW) estimation was performed for those variables. The C2HEST score was assessed through the time-dependent area under the curve (AUC). A log-rank test was used to confirm the differences in survival curves between risk strata. Proportional hazard assumption was verified using the Grambsch–Therneau test. A Cox proportional hazard model was used to analyze the hazard ratio (HR) for the C2HEST score, its components, and risk strata.
For the secondary outcomes, due to their dichotomic nature, a logistic regression model was fitted. Classical ROC analysis was performed, and an AUC measure was used for assessing predictive capabilities. An odds ratio (OR) was reported as an effect size for the influence of the C2HEST score, its components and risk strata.
All statistical analyses were performed with R version 4.0.4 using the packages time-ROC, pROC [8], survival [9], Coin [10], and odds ratio [11]. A significance level of 0.05 was selected for all statistical analyses.

3. Results

3.1. Baseline Characteristics of the Studied Population and Comorbidities

The baseline characteristics of this study and control group are summarized in Table 1 and in Supplementary Table S1. In both groups, a higher C2HEST score was associated with a higher average age and number of comorbidities. Moreover, the prevalence of cigarette smoking, moderate/severe valvular heart disease, previous TIA/stroke and chronic kidney disease was significantly greater in the high- than in low-risk C2HEST stratum. The prevalence of asthma did not differ between groups (Table 1 and Supplementary Table S1).
Among the patient-reported symptoms, vital signs, and abnormalities measured during the baseline physical examination of the non-diabetic group, the subjects from the high-risk compared to low-risk stratum were characterized by a higher prevalence of dyspnea and diarrhea, a decreased occurrence of smell dysfunction, as well as a lower baseline heart rate and saturation. In the physical examination of non-diabetic patients, the frequency of crackles, pulmonary congestion, and hemiplegia were significantly higher with the increase in the C2HEST stratum. Interestingly, the diabetic cohort was more homogeneous and such differences in the vital signs and symptoms at admission to the hospital were not found. However, patients from both groups, with a higher C2HEST score, presented a higher pulse pressure and more frequently demonstrated wheezing and peripheral edema. Interestingly, no significant differences regarding cough, chest pain, taste dysfunction, and body temperature were found between the strata of the diabetic and non-diabetic groups (Table 2).

3.2. Characteristics of the In-Hospital Laboratory Tests and Treatment Applied

3.2.1. Laboratory Assays

The detailed characteristics of the laboratory parameters measured during hospitalization for the diabetic and non-diabetic cohorts are presented in the Supplementary Table S2.
There were no differences between the C2HEST strata in both cohorts regarding white blood cells upon admission; however, upon discharge, the high-risk subjects were more commonly characterized with lymphopenia and a low platelet count. The lower hemoglobin level and higher INR in the high-risk C2HEST stratum were found in both groups during the whole observation period. Interestingly, no significant differences between the strata were noted in terms of acid-base balance parameters nor in terms of the procalcitonin, IL-6, ESR and D-dimer levels, at baseline or at the time of discharge. The CRP level was similar in different strata at the time of admission. It was significantly lower in the low-risk stratum in the non-diabetic cohort. Such a difference was not seen in the diabetic group.
In the diabetic group, contrary to the non-diabetic one, the higher C2HEST score was related to more frequent respiratory failure at discharge. The parameters of kidney function, including urea, creatinine, eGFR were maintained as significantly worse in the high-risk C2HEST stratum during the whole hospitalization period in both groups. No significant differences between groups regarding Fe, TIBC, sTfR, vitamin B12, and folic acid levels both upon admission and upon discharge were observed. Nevertheless, the baseline ferritin level was lower in the high-risk stratum of the diabetic cohort at admission. In the diabetic cohort, no differences were noted between strata in terms of the glucose level during the whole observation; however, the high-risk group had a significantly lower HbA1c concentration.
The markers of cardiac injury evaluated in both cohorts, including troponin T and NT-proBNP levels, were greater in the high-risk stratum during the whole observation period. Furthermore, acute myocardial injury, as assessed by the increase in the troponin level of >5-fold above the upper-range limit, was more common in this group. No significant differences regarding the cortisol and TSH between the groups were noted. No differences regarding ALT, bilirubin, and GGTP upon admission were present.

3.2.2. Specific Treatment Applied during the Hospitalization Period

In terms of management, there were no differences regarding the use of systemic corticoids, remdesivir, tocilizumab nor convalescent plasma between the C2HEST risk strata. Only specific antimicrobial treatment was more commonly applied in the subjects from the high-risk C2HEST stratum (Supplementary Table S3).

3.2.3. Supportive Treatment Applied during Hospitalization

The need for oxygen supplementation increased with C2HEST in the non-diabetic cohort, including via low-oxygen support and high flow nasal cannula, whereas the oxygenation parameters during the period of qualification for advanced respiratory support decreased.
The need for urgent coronary angiography and revascularization also increased with the C2HEST score in non-diabetic patients. Interestingly, no significant differences between groups in terms of the need for the use of catecholamines or de novo hemodialysis were observed in either cohort. (Table 3).

3.3. Associations of the C2HEST Score with Fatal Outcomes

3.3.1. C2HEST Score Results and Mortality

A total of 194 deaths (41%) were reported in the diabetic cohort (473 diabetic subjects), including 115 in-hospital deaths (24.3%). The in-hospital, 3-month and 6-month mortality was highest in the high-risk C2HEST stratum, reaching 34.7%, 53.4%, and 64.8%, respectively, and lowest in the low-risk stratum: 15.3%, 24.4%, and 37.2%, as appropriate. Similarly, in the non-diabetic cohort, a total of 376 deaths (22.6%) were reported. The in-hospital, 3-month, and 6-month mortality was also the highest in the high-risk C2HEST stratum—reaching 37.0%, 55.5%, and 68.0%, respectively (Table 4).

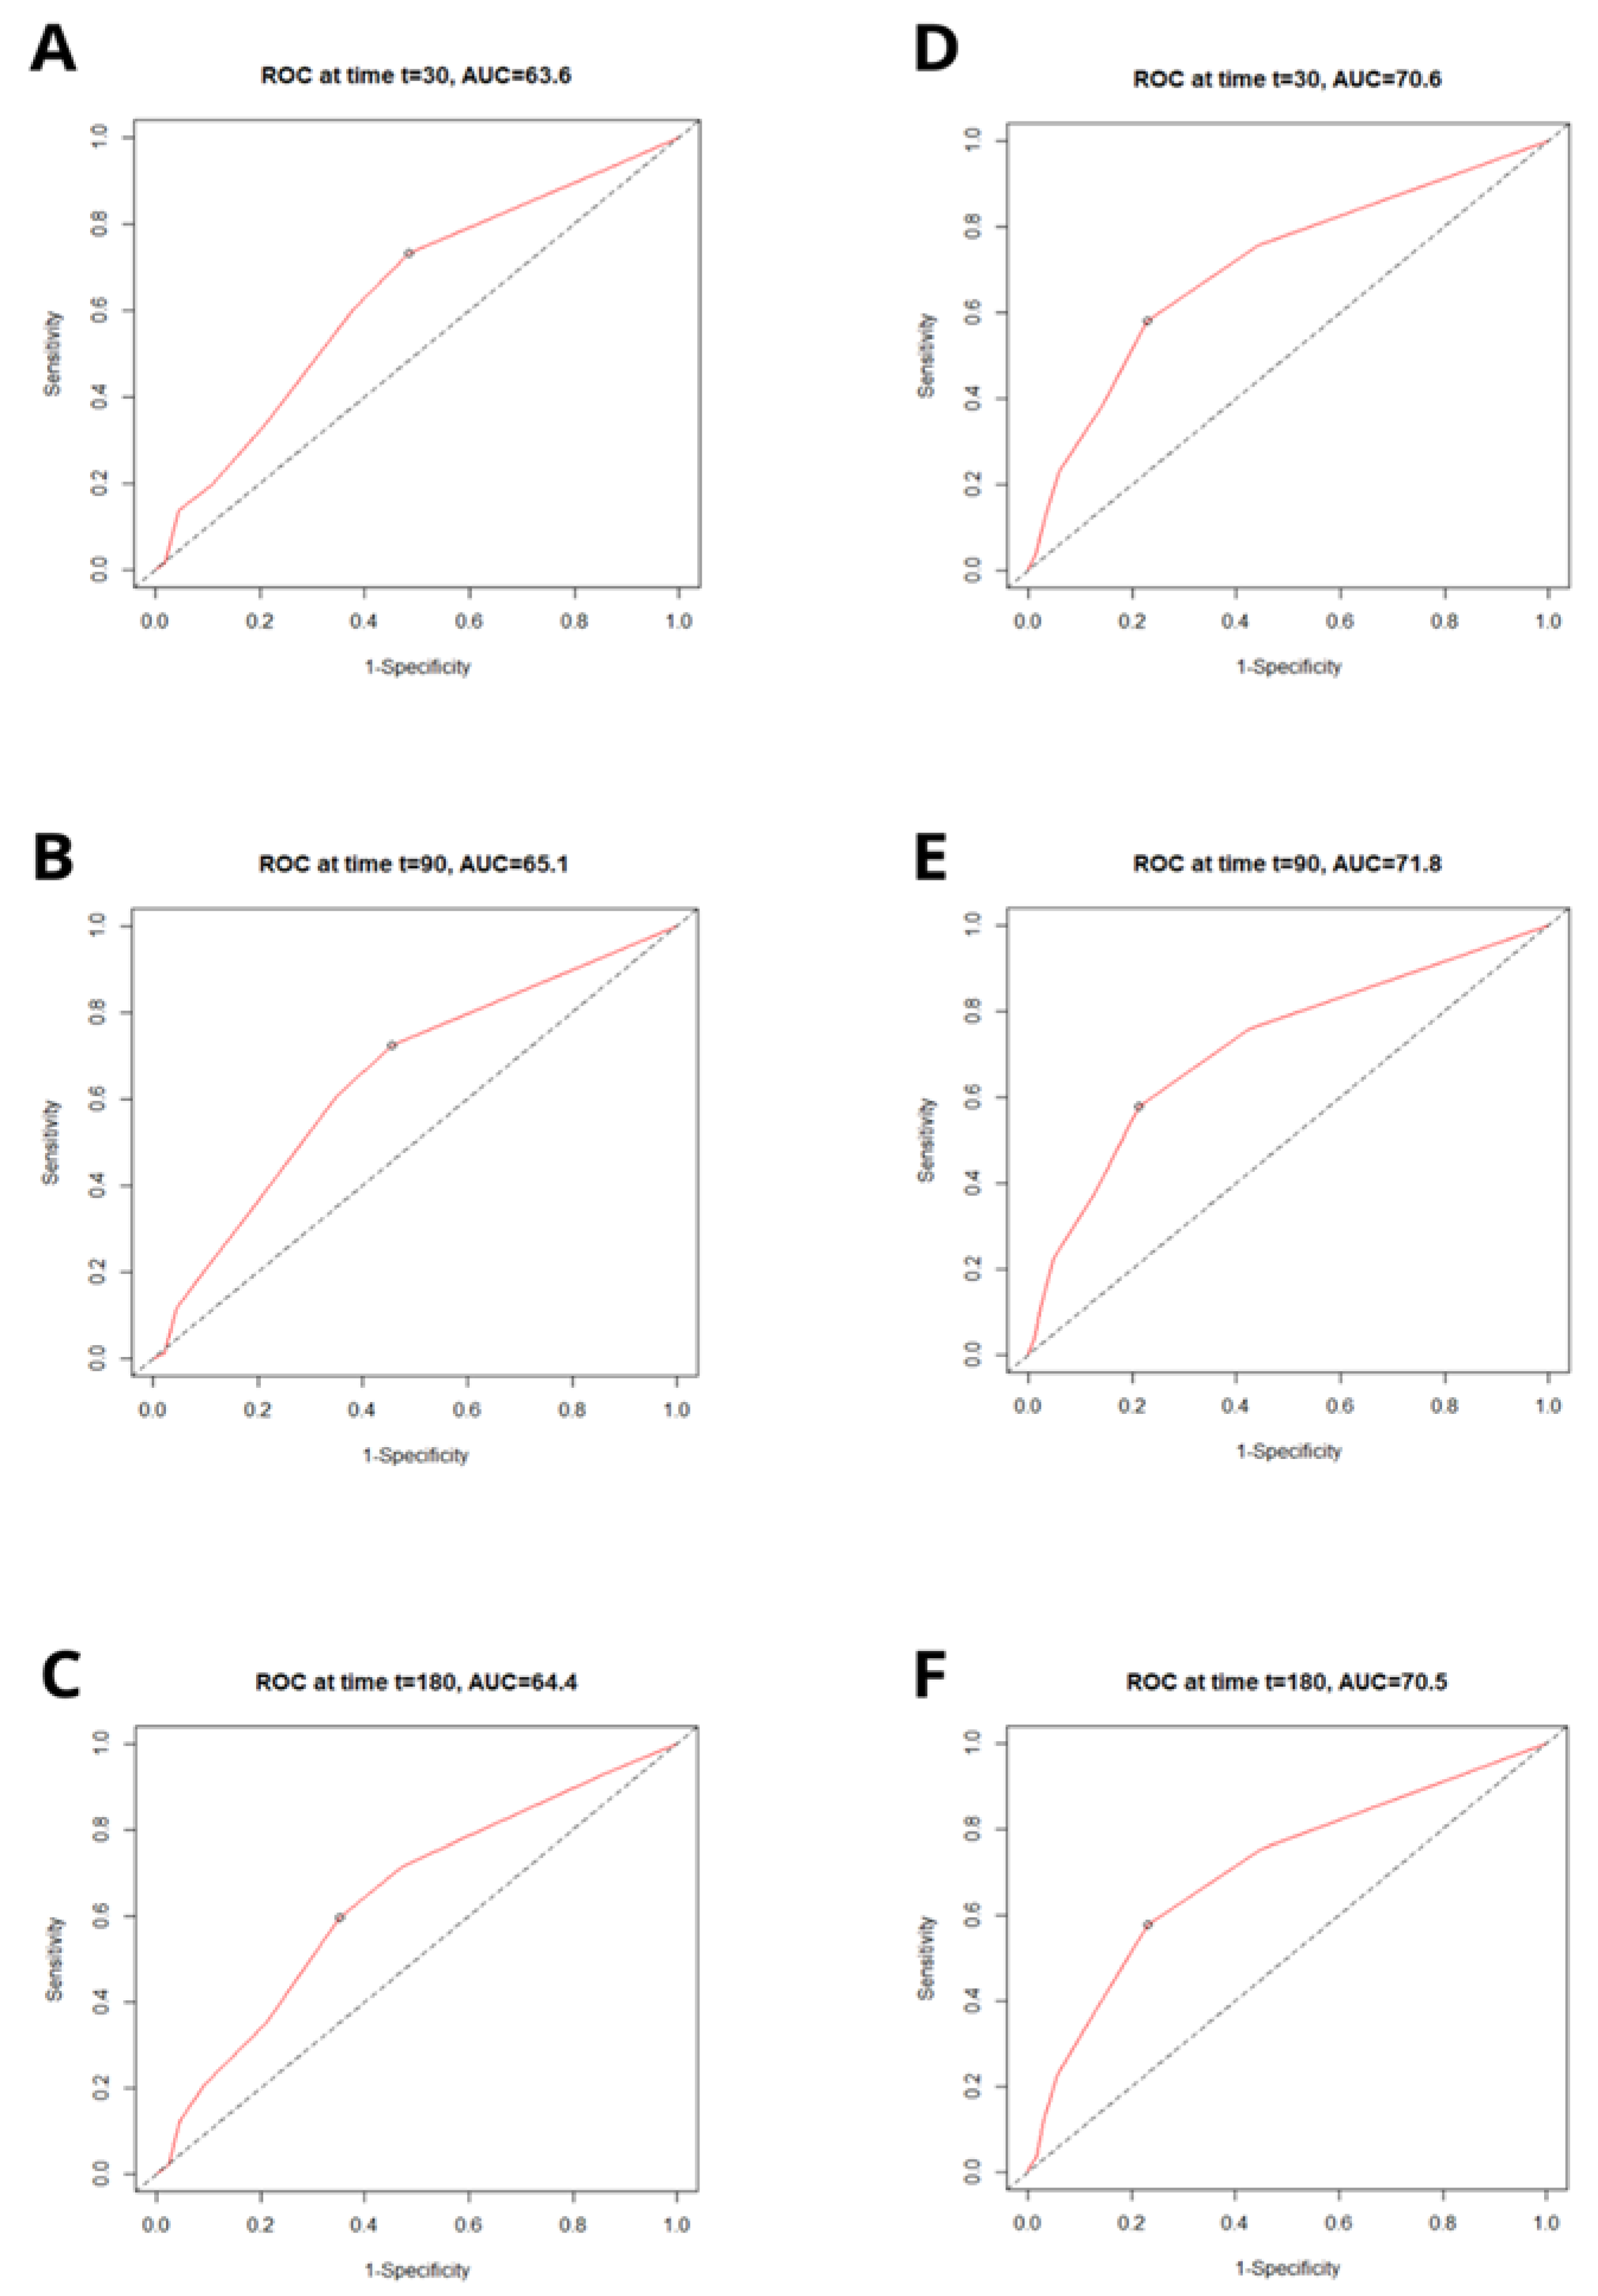
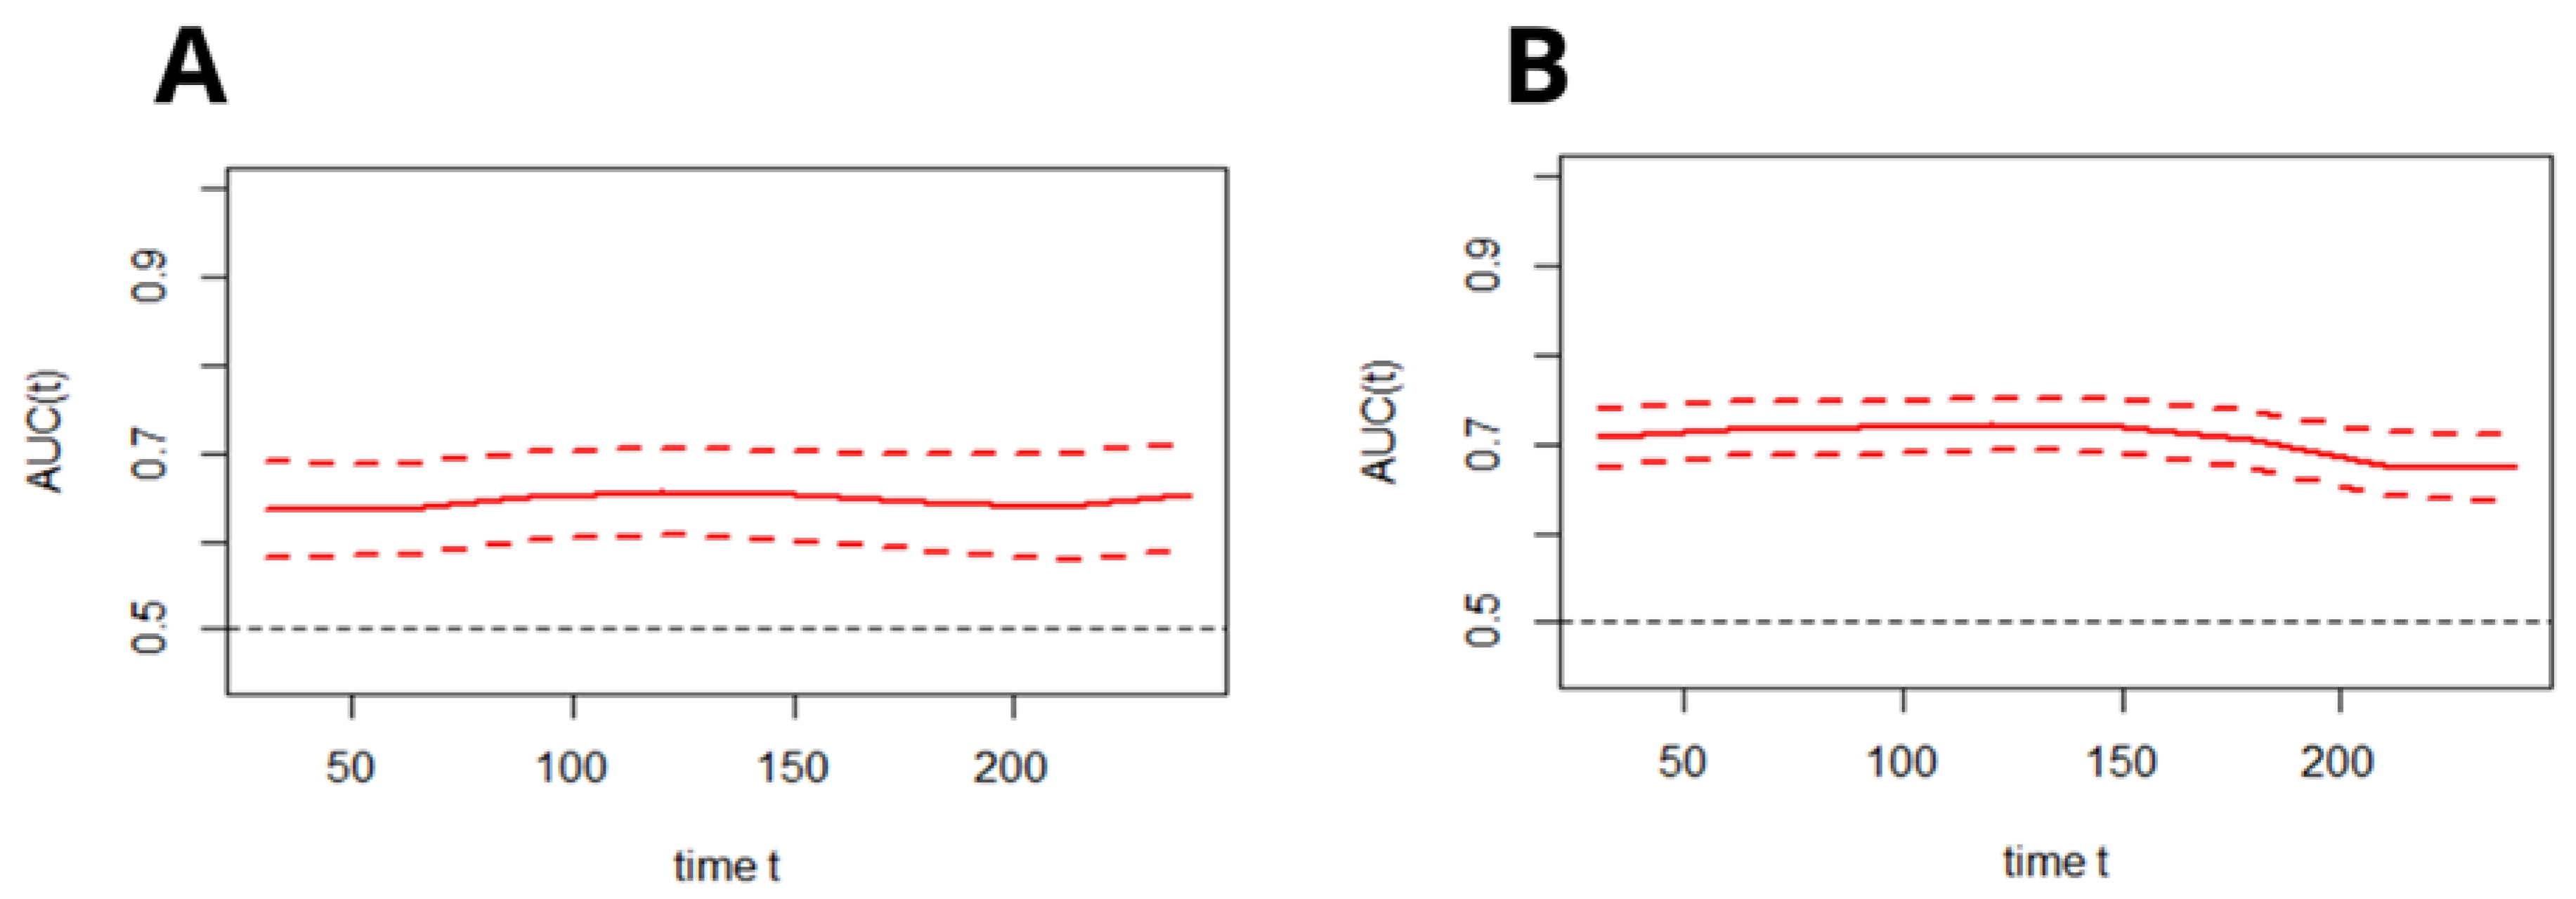
3.3.2. Discriminatory Performance of the C2HEST Score on the Total All-Cause Mortality

The receiver operating characteristics (ROC) revealed that C2HEST moderately predicts the 1-, 3-, and 6-month mortality in diabetic cohort. Additionally, the C2HEST score revealed to be an even more sensitive tool in the non-diabetic group where it demonstrated a better predictive value. The C2HEST predicting the AUC in the diabetic vs. non-diabetic cohorts presents as follows: the 1-month AUC30 = 63.6% vs. 70.6%; 3-month AUC90 = 65.1% vs. 71.8%; and 6-month AUC180 = 64.4% vs. 70.5%. All the data were calculated for all-cause death without competing risk (Figure 1).
Subsequently, the time–ROC analysis was performed in order to assess the predictive value of the C2HEST scale for all-cause mortality at a particular time from admission to the hospital in both cohorts. Figure 2 presents the time-dependent changes in the predictive value of the C2HEST score (changes of AUC in time, alongside with the CI).

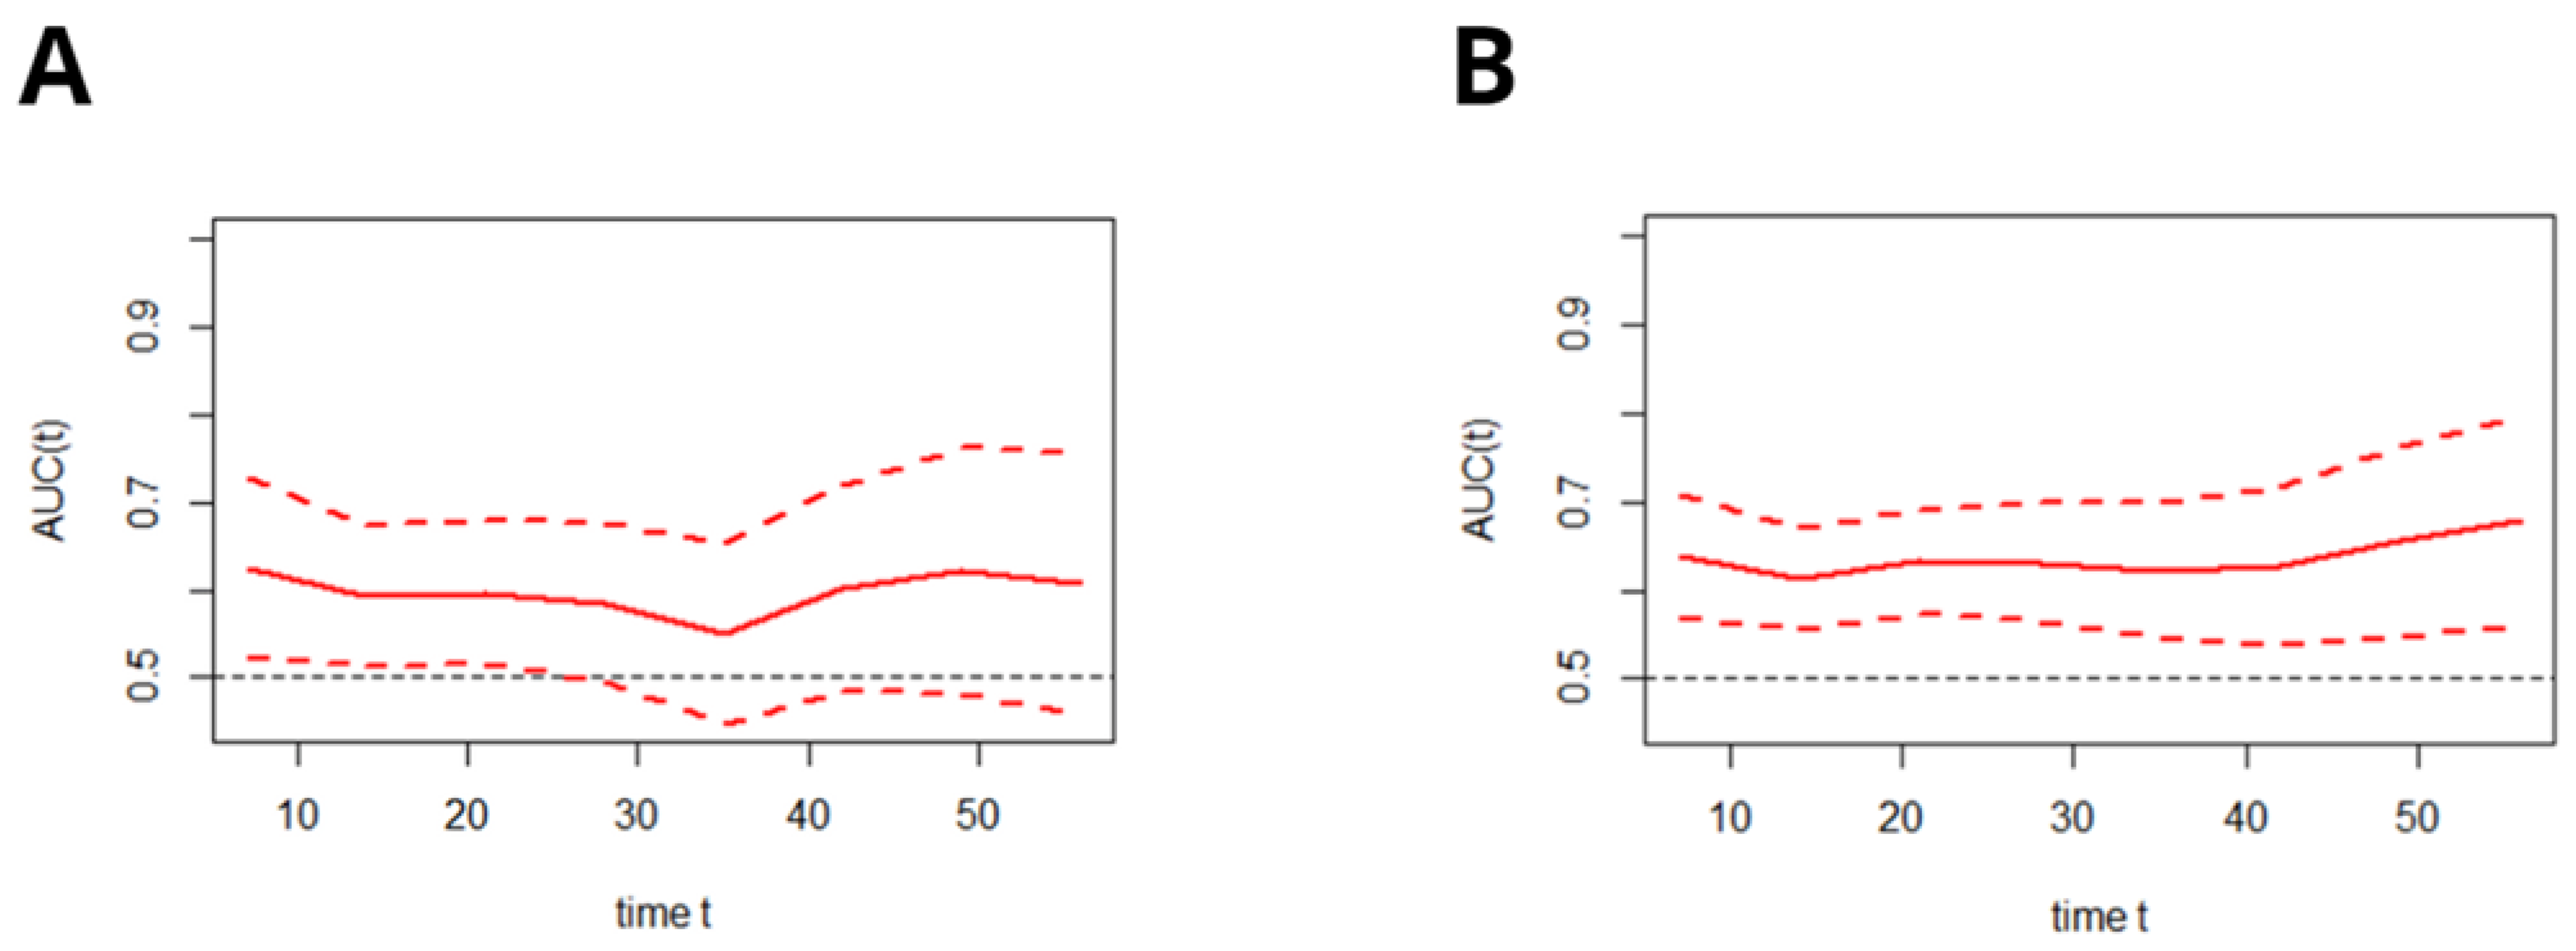
3.3.3. Discriminatory Performance of the C2HEST Score on the In-Hospital All-Cause Mortality–Time–ROC Analysis

As presented in Figure 3, the time-dependent AUC for the C2HEST score in predicting the in-hospital deaths in both cohorts remained moderate, regardless of the time of hospitalization.

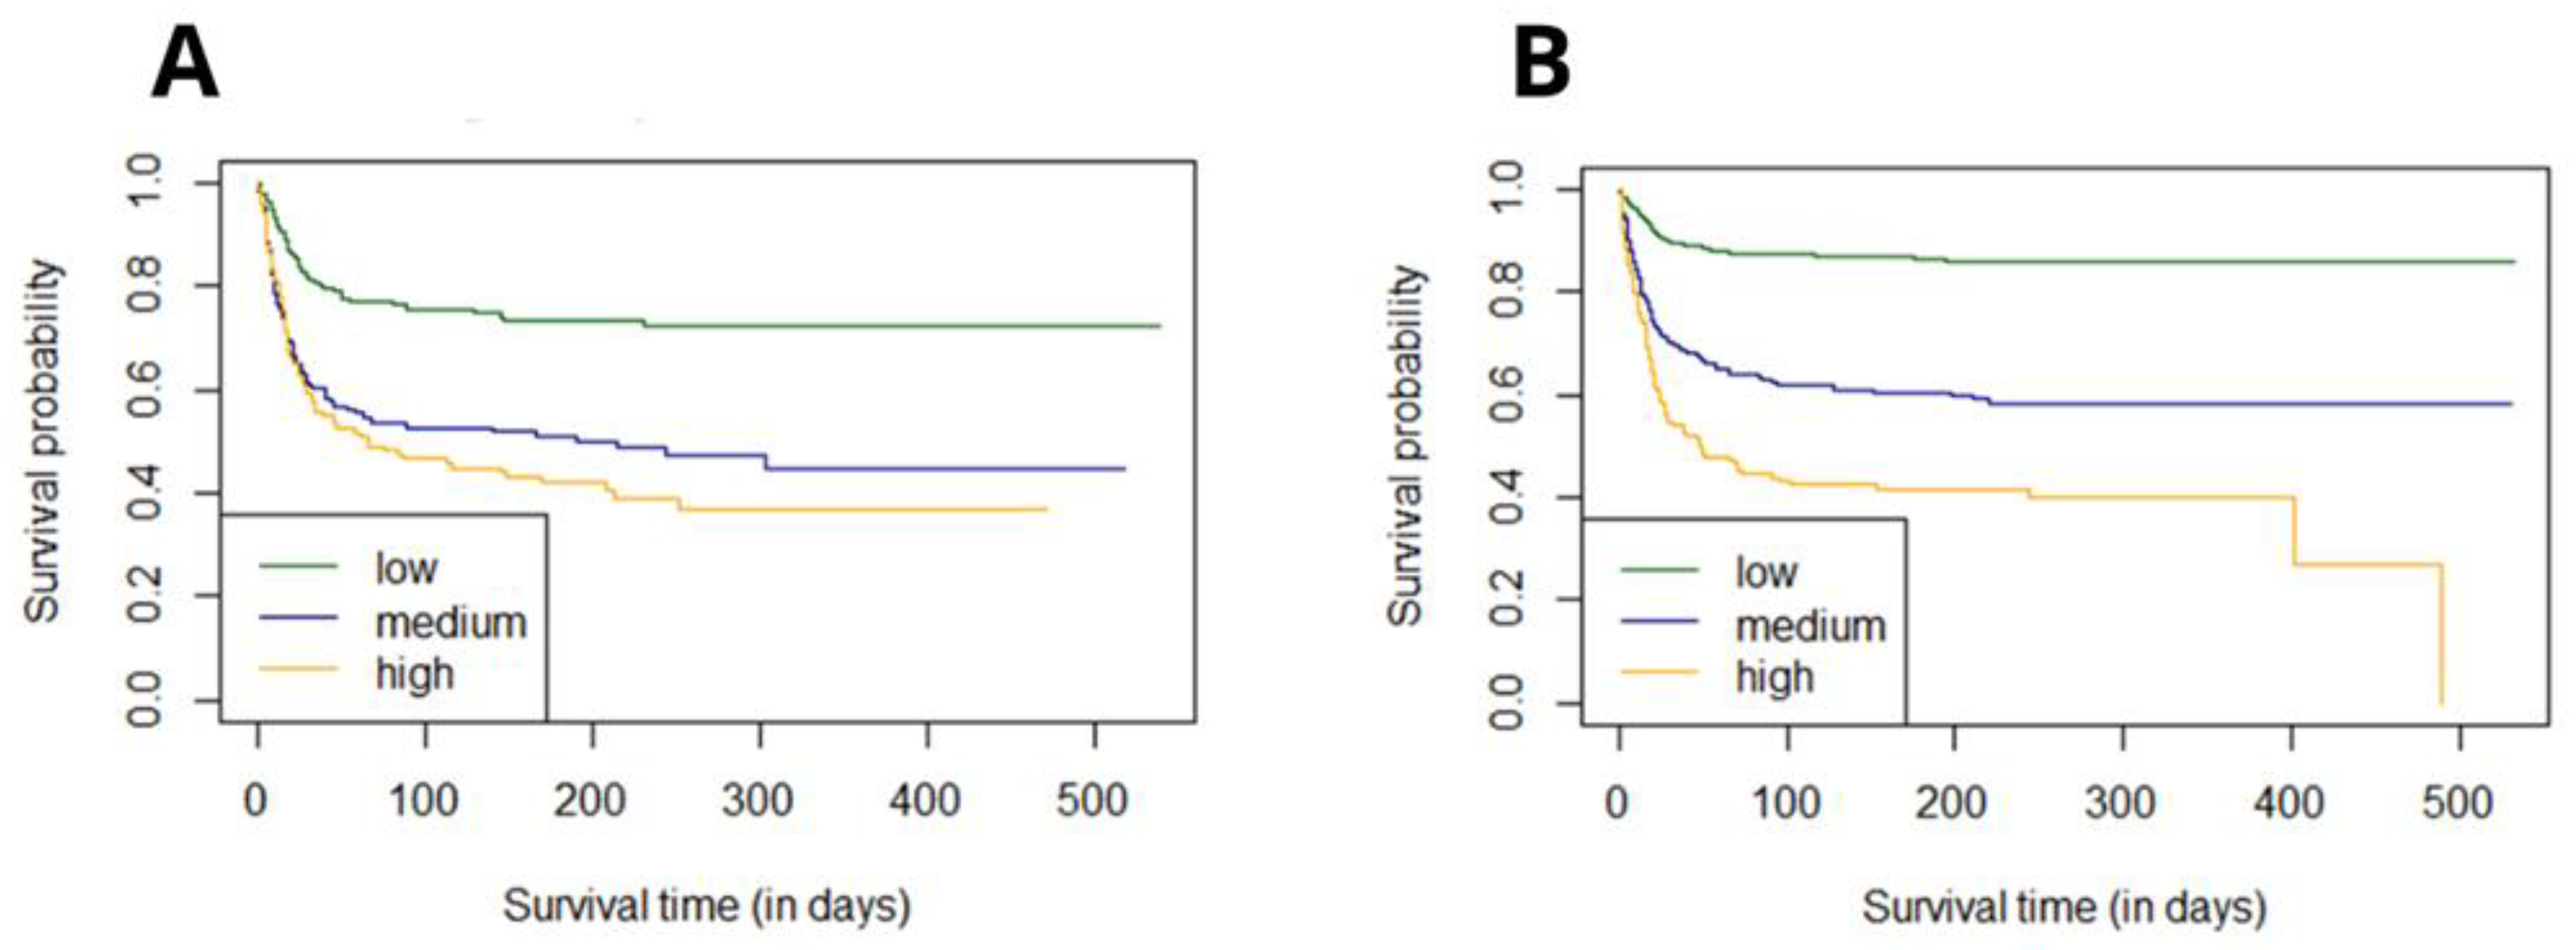
3.3.4. The Survival Probability for Hospitalized COVID-19 Patients

The survival curves for groups were estimated using Kaplan–Meier functions, based on the original stratification-low/medium/high for 0–1/2–3/≥4 points, respectively. The p value for the Log-rank test was <0.0001 (Figure 4). The estimated six-month survival probability for high-risk subjects reached 0.4 in both cohorts whereas for the low-risk group, the six-month survival probability was 0.7 in the diabetic vs. 0.85 in the non-diabetic group—levels which were maintained during whole observation period.

3.3.5. Risk Strata Matching Analysis

In order to verify whether the original risk stratification included the low/medium/high-risk categories for 0–1/2–3/≥4 points, respectively, all the possible C2HEST intervals were analyzed, and for each one, the log-rank statistics test was performed (Supplementary Table S4).
The highest value of the log-rank statistics for the diabetic cohort corresponded with the risk strata estimated as follows:
  • 0–1—low;
  • 2–5—medium;
  • 6–8—high.
Such risk calculation results in better risk stratification than the generally accepted one, however, the subpopulation division classically used in the literature will be used in the rest of this study.
Nevertheless, the same statistical analysis for the non-diabetic cohort revealed that, for this subpopulation, the primary risk categories (0–1 = low; 2–3 = medium; >4 = high) best reflect the total mortality curves.
This analysis was also repeated for the in-hospital mortality (Supplementary Table S5).

3.3.6. Effect of the C2HEST Risk Stratification Result on COVID-19 Survival

Subsequently, two Cox models were analyzed to assess the effect of the C2HEST score stratification on COVID-19 mortality. The overall model takes an uncategorized value of the C2HEST score, and the assumption of proportional hazard was met. Increase in one point in the C2HEST score increased the total-death intensity in approximately 24.9% of the diabetic cohort (HR 1.249, 95% CI 1.163–1.341 p < 0.0001) and in 45.2% in the non-diabetic subjects (HR 1.452, 95% CI 1.382–1.525 p < 0.0001).
For diabetic patients, the change from the low to the medium category increased death likelihood by 2.34 times, whereas between the low- and high-risk group, the hazard ratio was 2.84. The results for the non-diabetic subjects reflects an increased death chance between the low- and medium-risk stratum by 3.51 and the low vs. high with 6.0 times. The results are presented in Table 5.
A Similar analysis was performed for in-hospital deaths. The overall model took into consideration an uncategorized value of the C2HEST score, and the assumption of proportional hazard was met. In the diabetic cohort, the one-point increase relates to a 19% increase in in-hospital death (HR 1.19, 95% CI 1.081–1.314, p < 0.0005). The risk of in-hospital death increases 2.16-fold and 2.11-fold between the medium- vs. low- and high- vs. low-risk strata, respectively (Table 6).
The analogous statistical model in the non-diabetic cohort revealed that the assumption of proportional hazard was met. However, for the group model, the p value was 0.033, so the null hypothesis was excluded, and the confidence intervals and p values were omitted. An increase in one point in the C2HEST score increased the in-hospital death intensity by 29%. The change from the low to the medium category increased the in-hospital death intensity by 2.1-fold, whereas between the low- and high-risk categories, the hazard ratio was 3.35. The results are presented in Table 6.
The associations of individual C2HEST score components in the C2HEST score with mortality are presented in Supplementary Table S10. As the results from the analysis of the Cox proportional hazard model (all-cause death) and competing risk regression model for other outcomes, among individual comorbidities, the highest prognostic value for in-hospital mortality had coronary artery disease and age in both cohorts.

3.4. Associations of the C2HEST Score with Other, Non-Fatal Outcomes

In both cohorts, receiver operating characteristics (ROC) revealed that the C2HEST predicts: cardiogenic shock (AUCdiabetes = 0.725 vs. AUCnon-diabetes = 0.749) and acute heart failure (AUCdiabetes = 0.819 vs. AUCnon-diabetes = 0.868) well. The increase in one point in the C2HEST score increased the risk for cardiogenic shock by 53% in the diabetic vs. 63.6% in the non-diabetic group (ORdiabetes low vs. high: 7.53 95% CI = 1.85–50.45 p = 0.012 ORnon-diabetes low vs. high: 10.1 95% CI = 3.0–35.44, p < 0.0001). Similarly, myocardial injury (MI), as assessed by the >5-fold in-hospital increase in the troponin levels, as well as the acute heart failure, increased with the C2HEST score in both cohorts. For MI, the ORdiabetes overall = 1.17 (95% CI = 1.03–1.33, p = 0.014) and ORnon-diabetes overall = 1.44 (95% CI = 1.31–1.59, p < 0.0001), while the OR between strata for MI are: ORdiabetes low vs. high: 2.16 (95% CI = 1.2–3.92, p = 0.01) and ORnon-diabetes low vs. high: 5.59 (95% CI = 3.5–8.94, p < 0.0001). For acute heart failure (AHF), the ORdiabetes overall = 1.94 (95% CI = 1.59–2.43 p < 0.0001) and ORnon-diabetes overall = 2.07 (95% CI = 1.77–2.44, p < 0.0001) while the OR between the low and high groups for AHI are: ORdiabetes low vs. high: 25.06 (95% CI = 7.22–158.17 p < 0.0001) and ORnon-diabetes low vs. high: 36.68 (95% CI = 15.58–100.86, p < 0.0001). Table 7 and Supplementary Table S6). A similar tendency in both cohorts was observed for the occurrence of in-hospital acute kidney injury (AKI). Increase in one point in C2HEST increased the risk by 20.5% in the diabetic and by 29.9% in the non-diabetic group. The OR for the AKI was: ORdiabetes low vs. high: 2.3 (95% CI = 1.3–4.1 p < 0.0042) and ORnon-diabetes low vs. high: 2.81 (95% CI = 1.7–4.51, p < 0.0001). Table 7 and Supplementary Table S6).
Interestingly, in both cohorts, there were no differences in the occurrence of stroke/TIA, complete respiratory failure, systemic inflammatory response syndrome (SIRS), nor multi-organ dysfunction syndrome (MODS). Additionally, an increase in the C2HEST score did not increase the prevalence of deep vein thrombosis and pulmonary embolism.
It is worth noting that in the non-diabetic cohort, the increase in the C2HEST score was also related to the increased risk of: pneumonia ORnon-diabetes overall = 1.35 (95% CI = 1.26–1.45 p < 0.0001), sepsis ORnon-diabetes overall = 1.43 (95% CI = 1.1–1.84 p < 0.0054), acute liver dysfunction ORnon-diabetes overall = 1.3 (95% CI = 1.1–1.51 p < 0.008), and all types of bleeding ORnon-diabetes overall = 1.21 (95% CI = 1.06–1.37 p < 0.0038), with increased risk of upper-gastrointestinal tract bleeding for every C2HEST score: ORnon-diabetes overall = 1.49 (95% CI = 1.2–1.83 p < 0.002) and myocardial infarction ORnon-diabetes overall = 1.47 (95% CI = 1.11–1.91 p < 0.0042). Described differences had not been seen in the diabetic cohort; however, in this group, the increase in one point of the C2HEST scale coexists with a higher risk of complete respiratory failure ORdiabetes overall = 1.29 (95% CI = 1.02–1.69 p = 0.0377).
All of the odds ratios for quantifying the strength of the association between the CH2EST score and the study endpoints and adverse events are demonstrated in Supplementary Table S6. The summarized discriminatory performance of the C2HEST score on the clinical events is presented in Supplementary Table S7.

3.5. Sensitivity Analysis

The results of the sensitivity analysis are summarized in Supplementary Tables S8a,b and S9a,b.
Interestingly, replacing the general definition of “thyroid disease” with the more precise term “hypothyroidism” and the cut-off point for age to a more liberal “>65 years” as scoring items in the C2HEST score resulted in a significant increase in the predictive value for the endpoints and most of the adverse clinical events in both cohorts. The all-cause mortality HR shows as follows: HRdiabetes overall = 1.21, (95% CI 1.08–1.34, p < 0.0006) HRdiabetes low vs. high = 2.5 (95% CI 1.01–6.17, p < 0.047—and for the non-diabetic cohort: HRnon-diabetes overall = 1.49, (95% CI 1.42–1.57, p < 0.0001), HRnon-diabetes low vs. high = 6.69 (95% CI 5.01–8.92, p < 0.0001). Interestingly, the predictive value for pulmonary embolism (PE) and venous thromboembolic disease (VTD) reached statistical significance, but still with a relatively low OR –PE ORnon-diabetes overall = 1.20 (95% CI 1.07–1.35 p = 0.0013) and OR non-diabetes low vs. high = 2.17 (95% CI = 1.33–3.53, p = 0.0018). For VTD, ORnon-diabetes overall = 1.18 (95% CI 1.05–1.31 p = 0.0037) and ORnon-diabetes low vs. high = 1.98 (95% CI = 1.23–3.19, p = 0.0049). Additionally, the fact that statistical modification ends with changes in the end-point analysis in the non-diabetic cohort. In addition to conversion, the one point in the C2HEST score increases the risk of: all causes of shock by 23.3%; septic shock by 19.1%; and the cardiogenic shock the most—by 60.8%. Additionally, the modified C2HEST score had a better prognostic value for the TIA/stroke and complete respiratory failure which achieved statistical significance in non-diabetic subjects.

4. Discussion

To the best of our knowledge, this is the first study evaluating the usefulness of the C2HEST scale in predicting the outcome of a COVID-19 cohort with respect to the presence of diabetes mellitus. Since diabetes mellitus is considered to be an independent risk factor worsening COVID-19 course and mortality, its prediction abilities in this cohort required detailed analysis. The clinical manifestations of COVID-19 patients have shown that comorbidities including diabetes, hypertension, and atherosclerotic cardiovascular disease are very common and diabetes mellitus has emerged as a critical risk factor [12,13,14]. Previous studies have highlighted that those patients with cardiometabolic risk factors such as diabetes mellitus (DM) have been associated with worse clinical manifestation and higher mortality in COVID-19 [15,16]. Due to the heterogeneity of the diabetic cohort, including its metabolic compensation and the severity of the target organ damage, an individualized approach is pivotal for the early identification of patients being more susceptible to a poor COVID-19 outcome.
Hyperglycemia itself as well as chronically impaired glucose metabolism in the course of diabetes trigger numerous metabolic signaling pathways leading to chronic inflammatory disease and impaired immune response to infection [17], which include the uncontrolled secretion of INF-α, other pro-inflammatory cytokines, and chemokines [18]. According to the results from a recent study by Guo J. et al. [19], the mortality of COVID19 is associated with elevated serum levels of innate inflammatory cytokine IL-6 and inflammatory chemokines IL-8 and IP10 consistently across strata of diabetes. Consequently, the mortality rate of COVID-19 patients particularly associated with DM in the presence of some other comorbidities [20] is considerably greater than that observed in patients without diabetes due to the higher risk of developing cytokine storm and greater susceptibility to multiorgan failure, particularly in those previously affected by diabetes. Therefore, diabetic subjects are more likely to present with clinical symptoms and complications when compared to those without glucose metabolism abnormalities [21]. Our study revealed that, alongside a higher C2HEST stratum, the mortality significantly increases irrespectively in the presence of glucose metabolism abnormalities. The ROC analysis revealed that C2HEST moderately predicts the 1-, 3- and 6-month mortality in the diabetic cohort and its predictive value was even better in non-diabetic subjects. Noteworthily, 1.82-fold higher mortality was seen in the diabetic cohort, which is in accordance with the meta-analysis by Kumar et al., in which a two-fold increase in mortality associated with diabetes mellitus was demonstrated [22]. According to the results of the Kulcsar et al. model of the MERS-CoV infection in diabetic mice, diabetes mellitus is related to more severe systemic inflammation with a higher expression of inflammation mediators playing a pivotal role in the pathogenesis of the COVID-19 cytokine storm [23].
The increased vascular superoxide production with endothelial dysfunction, defective CD4+ and CD8+ T-cells and the impaired complement system in diabetic patients make this group more susceptible to poor outcomes in the course of COVID-19 [24,25,26,27].
The survival curves estimated the six-month survival probability for high-risk subjects reaching 0.4 in both cohorts and reaching approximately 0.7 in the diabetic vs. 0.85 in the non-diabetic subjects in the low-risk cohort, respectively. This proves that diabetes mellitus per se determines high COVID-19 mortality, also in the post-hospital follow-up period, which, however, seems to be less modified by the presence of additional comorbidities. Together with our other findings, all results point towards the significant increase in cardiogenic shock, myocardial injury, and acute heart failure with each additional point of C2HEST score in both cohorts, which indicates that cardio-metabolic burden plays a pivotal role in COVID-19 complication and notably increases mortality. In contrast, in relatively healthier subjects, not suffering from diabetes mellitus, the change from a low to high C2HEST stratum evokes more severe results.
Even though the total mortality is significantly different between the C2HEST strata, the patient-reported symptoms, and their severity at the moment of admission in the diabetic cohort were similar apart from the frequency of peripheral edemas and wheezing occurrence. The ROC analysis indicates that C2HEST poorly predicts in-hospital deaths, which indicates the need to use other scales for this purpose. To date, the ABC2-SPH risk score was validated for predicting in-hospital mortality in COVID-19 and displayed better discrimination ability compared to other existing scores [28]. However, its effectiveness and similarly other scales predicting the mortality and severe course of the disease in the diabetic cohort require further detailed analysis.

Limitations

Our study has several limitations. First, our results are based on the data of a retrospective analysis of cases of patients hospitalized in a single center, which could affect the validity of our conclusions. Second, this study analyzed the whole COVID-19 cohort whose usefulness has not been verified under special circumstances, such as subpopulations with a specific comorbid condition. Finally, the data for this study were entirely from central Europe, which could potentially limit the generalizability of the risk score in other areas of the world.

5. Conclusions

This study shows the usefulness and performance of the C2HEST score in predicting adverse COVID-19 outcomes in hospitalized subjects with type 2 diabetes mellitus. The simplicity of this scale, which can be calculated based on comorbidities, may address the medical needs in the risk stratification of COVID-19 subjects with diabetes mellitus.

Supplementary Materials

The following supporting information can be downloaded at: https://0-www-mdpi-com.brum.beds.ac.uk/article/10.3390/jcm11030873/s1, Table S1. Baseline characteristics of the diabetes and non-diabetes cohort - treatment applied before hospitalization. Table S2. Laboratory parameters measured during the hospitalisation in the diabetic and non-diabetic cohort. Table S3. Therapies applied during the hospitalisation in the diabetic and non-diabetic cohort. Table S4. The Log-rank statistics for matching the C2HEST risk strata for total mortality in the diabetic and non-diabetic cohort. Table S5. The Log-rank statistics for matching the C2HEST risk strata for in-hospital mortality in the diabetic and non-diabetic cohort. Table S6. Odds ratios for quantifying the strength of the association between CH2EST-score and study endpoints and adverse events in the diabetic and non-diabetic cohort. Table S7. Discriminatory performance of the C2HEST score on the clinical events in the diabetic and non-diabetic cohort. Table S8. The in-hospital all-cause-death Hazard Ratios for modified C2HEST risk stratification—Replace “thyroid disease” by “hypothyroidism” and “age > 75 years” by “age > 65 years” in the diabetic and non-diabetic cohort. Table S9. Odds ratios for quantifying the strength of the association between the modified CH2EST-score and study endpoints and adverse events—replacing “thyroid disease” with “hypothyroidism” and cut-off point for age to “>65 years” as scoring items in the diabetic and non-diabetic cohort. Table S10. Components of C2HEST score and the risk of outcomes in univariate Cox proportional hazard model (all-cause death) and competing risk regression model (other outcomes) in diabetes cohort.

Author Contributions

Conceptualization, D.G., P.R., A.D., M.T., E.A.J. and K.M.; methodology, D.G., A.D., K.G., K.K.(Krzysztof Kujawa), M.T. and K.M.; software, K.G. and M.S.; formal analysis, K.G., M.S. and A.D.; investigation, P.R., A.D., M.T., J.G., T.M., E.S.-K., D.G., B.A., K.K. (Klaudia Konikowska), K.K.-P., K.L. (Karolina Lindner), A.M.-W., M.P. (Marcin Protasiewicz), M.P. (Michał Pomorski), K.M., M.M., J.S. and E.A.J.; resources, P.R., A.D., M.T., J.G., T.M., E.S.-K., D.G., B.A., K.K. (Krzysztof Kaliszewski), K.K.-P., K.L. (Krzysztof Letachowicz), A.M.-W., M.P. (Marcin Protasiewicz), M.P. (Michał Pomorski), K.M., J.S. and E.A.J.; data curation, B.S., J.H.-Ż., A.R., M.O., K.P., M.S.-P., J.Z., P.R., A.D., M.T., J.G., T.M., E.S.-K., D.G., B.A., K.K. (Krzysztof Kaliszewski), K.K.-P., K.L. (Krzysztof Letachowicz), A.M.-W., M.P. (Marcin Protasiewicz), M.P. (Michał Pomorski), K.M., J.S. and E.A.J.; writing—original draft preparation, D.G., P.R., A.D., M.T. and K.M.; writing—review and editing, A.D. and K.M.; visualization, D.G., K.G., M.S., P.R., M.M., A.D., M.T., E.A.J. and K.M.; supervision, A.D., M.T., E.A.J. and K.M.; project administration, A.D., M.T., E.A.J., K.M. and K.K. (Krzysztof Kujawa). All authors have read and agreed to the published version of the manuscript.

Funding

This research received no external funding.

Institutional Review Board Statement

This study was conducted according to the guidelines of the Declaration of Helsinki and approved by the Bioethics Committee of Wroclaw Medical University, Wroclaw, Poland (Signature number: KB-444/2021).

Informed Consent Statement

The routine data were collected retrospectively; therefore, written informed consent to participate in the study was not required. The Bioethics Committee approved the publication of anonymized data.

Data Availability Statement

The datasets used and/or analyzed during the present study are available from the corresponding author upon reasonable request.

Acknowledgments

The authors are grateful to all the staff and the patients at the study center who contributed to this work.

Conflicts of Interest

The authors declare no conflict of interest.

References

  1. Tang, X.; Du, R.H.; Wang, R.; Cao, T.Z.; Guan, L.L.; Yang, C.Q.; Zhu, Q.; Hu, M.; Li, X.Y.; Li, Y.; et al. Comparison of Hospitalized Patients with ARDS Caused by COVID-19 and H1N1. Chest 2020, 158, 195–205. [Google Scholar] [CrossRef]
  2. Zhou, F.; Yu, T.; Du, R.; Fan, G.; Liu, Y.; Liu, Z.; Xiang, J.; Wang, Y.; Song, B.; Gu, X.; et al. Clinical course and risk factors for mortality of adult inpatients with COVID-19 in Wuhan, China: A retrospective cohort study. Lancet 2020, 395, 1054–1062. [Google Scholar] [CrossRef]
  3. Janus, A.; Szahidewicz-Krupska, E.; Mazur, G.; Doroszko, A. Insulin Resistance and Endothelial Dysfunction Constitute a Common Therapeutic Target in Cardiometabolic Disorders. Mediat. Inflamm. 2016, 2016, 3634948. [Google Scholar] [CrossRef] [Green Version]
  4. Hussain, A.; Bhowmik, B.; do Vale Moreira, N.C. COVID-19 and diabetes: Knowledge in progress. Diabetes Res. Clin. Pract. 2020, 162, 108142. [Google Scholar] [CrossRef] [PubMed]
  5. Whyte, M.B.; Vas, P.; Heiss, C.; Feher, M.D. The contribution of diabetic micro-angiopathy to adverse outcomes in COVID-19. Diabetes Res. Clin. Pract. 2020, 164, 108217. [Google Scholar] [CrossRef]
  6. Katsiki, N.; Gómez-Huelgas, R.; Mikhailidis, D.P.; Pérez-Martínez, P. Narrative review on clinical considerations for patients with diabetes and COVID-19: More questions than answers. Int. J. Clin. Pract. 2021, 75, e14833. [Google Scholar] [CrossRef]
  7. Liang, W.; Liang, H.; Ou, L.; Chen, B.; Chen, A.; Li, C.; Li, Y.; Guan, W.; Sang, L.; Lu, J.; et al. Development and validation of a clinical risk score to predict the occurrence of critical illness in hospitalized patients with COVID-19. JAMA Intern. Med. 2020, 180, 1081–1089. [Google Scholar] [CrossRef]
  8. Robin, X.; Turck, N.; Hainard, A.; Tiberti, N.; Lisacek, F.; Sanchez, J.C.; Müller, M. pROC: An open-source package for R and S+ to analyze and compare ROC curves. BMC Bioinform. 2011, 12, 77. [Google Scholar] [CrossRef]
  9. Therneau, T. A Package for Survival Analysis in R; R Package Version 3.2-7. Mayo Foundation for Medical Education and Research. 2020. Available online: https://CRAN.R-project.org/package=survival (accessed on 31 October 2021).
  10. Hothorn, T.; Hornik, K.; Van De Wiel, M.A.; Zeileis, A. A lego system for conditional inference. Am. Stat. 2006, 60, 257–263. [Google Scholar] [CrossRef] [Green Version]
  11. Muenchow, J.; Schratz, P.; Brenning, A. QGIS: Integrating R with QGIS for statistical geocomputing. R J. (Scopus) 2017, 9, 409–428. [Google Scholar] [CrossRef]
  12. Seiglie, J.; Platt, J.; Cromer, S.J.; Bunda, B.; Foulkes, A.S.; Bassett, I.V. Diabetes as a Risk Factor for Poor Early Outcomes in Patients Hospitalized With COVID-19. Diabetes Care 2020, 43, 2938–2944. [Google Scholar] [CrossRef] [PubMed]
  13. Huang, C.; Wang, Y.; Li, X.; Ren, L.; Zhao, J.; Hu, Y. Clinical features of patients infected with 2019 novel coronavirus in Wuhan China. Lancet 2020, 395, 497–506. [Google Scholar] [CrossRef] [Green Version]
  14. Wang, D.; Hu, B.; Hu, C.; Zhu, F.; Liu, X.; Zhang, J. Clinical Characteristics of 138 Hospitalized Patients With 2019 Novel Coronavirus-Infected Pneumonia in Wuhan China. JAMA 2020, 323, 1061–1069. [Google Scholar] [CrossRef] [PubMed]
  15. Abdi, A.; Jalilian, M.; Ahmadi, P.; Vlaisavljevic, Z. Diabetes and COVID-19: A systematic review on the current evidences. Diabetes Res. Clin. Pract. 2020, 166, 108347. [Google Scholar] [CrossRef]
  16. Huang, I.; Lim, M.A.; Pranata, R. Diabetes mellitus is associated with increased mortality and severity of disease in COVID-19 pneumonia—a systematic review, meta-analysis, and meta-regression: Diabetes and COVID-19. Diabetes Metab. Syndr. Clin. Res. Rev. 2020, 14, 395–403. [Google Scholar] [CrossRef]
  17. Volpe, C.M.O.; Villar-Delfino, P.H.; Dos Anjos, P.M.F.; Nogueira-Machado, J.A. Cellular death, reactive oxygen species (ROS) and diabetic complications. Cell Death Dis. 2018, 9, 119. [Google Scholar] [CrossRef]
  18. Hu, R.; Xia, C.-Q.; Butfiloski, E.; Clare-Salzler, M. Effect of high glucose on cytokine production by human peripheral blood immune cells and type I interferon signaling in monocytes: Implications for the role of hyperglycemia in the diabetes inflammatory process and host defense against infection. Clin. Immunol. 2018, 195, 139–148. [Google Scholar] [CrossRef]
  19. Guo, J.; Lin, W.W.; Zucker, J.E.; Nandakumar, R.; Uhlemann, A.C.; Wang, S.; Shivakoti, R. Inflammation and mortality in COVID-19 hospitalized patients with and without type 2 diabetes. J. Clin. Endocrinol. Metab. 2022, dgac003, online, ahead of print. [Google Scholar] [CrossRef]
  20. Sarkar, S.; Das, D.; BorsinghWann, S.; Kalita, J.; Manna, P. Is diabetes mellitus a wrongdoer to COVID-19 severity? Diabetes Res. Clin. Pract. 2021, 178, 108936. [Google Scholar] [CrossRef]
  21. Harbuwono, D.S.; Handayani, D.O.T.L.; Wahyuningsih, E.S.; Supraptowati, N.; Ananda; Kurniawan, F.; Wafa, S.; Kristanti, M.; Pantoro, N.I.; Sinto, R.; et al. Impact of diabetes mellitus on COVID-19 clinical symptoms and mortality: Jakarta’s COVID-19 epidemiological registry. Prim. Care Diabetes 2021, in press. [Google Scholar] [CrossRef]
  22. Kumar, A.; Arora, A.; Sharma, P.; Anikhindi, S.A.; Bansal, N.; Singla, V.; Khare, S.; Srivastava, A. Is diabetes mellitus associated with mortality and severity of COVID-19? A meta-analysis. Diabetes Metab. Syndr. Clin. Res. Rev. 2020, 14, 535–545. [Google Scholar] [CrossRef]
  23. Kulcsar, K.A.; Coleman, C.M.; Beck, S.E.; Frieman, M.B. Comorbid diabetes results in immune dysregulation and enhanced disease severity following MERS-CoV infection. JCI Insight 2019, 4, e131774. [Google Scholar] [CrossRef] [Green Version]
  24. Alraddadi, B.M.; Watson, J.T.; Almarashi, A.; Abedi, G.R.; Turkistani, A.; Sadran, M.; Housa, A.; AlMazroa, M.A.; Alraihan, N.; Banjar, A.; et al. Risk Factors for Primary Middle East Respiratory Syndrome Coronavirus Illness in Humans, Saudi Arabia, 2014. Emerg. Infect. Dis. 2016, 22, 49–55. [Google Scholar] [CrossRef] [PubMed]
  25. Daryabor, G.; Atashzar, M.R.; Kabelitz, D.; Meri, S.; Kalantar, K. The Effects of Type 2 Diabetes Mellitus on Organ Metabolism and the Immune System. Front. Immunol. 2020, 11, 1582. [Google Scholar] [CrossRef] [PubMed]
  26. Kumar, N.P.; Sridhar, R.; Nair, D.; Banurekha, V.V.; Nutman, T.B.; Babu, S. Type 2 diabetes mellitus is associated with altered CD8+ T and natural killer cell function in pulmonary tuberculosis. Immunology 2015, 144, 677–686. [Google Scholar] [CrossRef] [Green Version]
  27. Hill, M.A.; Mantzoros, C.; Sowers, J.R. Commentary: COVID-19 in patients with diabetes. Metabolism 2020, 107, 154217. [Google Scholar] [CrossRef]
  28. Marcolino, M.S.; Pires, M.C.; Ramos, L.E.F.; Silva, R.T.; Oliveira, L.M.; Carvalho, R.L.; Mourato, R.L.S.; Sánchez-Montalvá, A.; Raventós, B.; Anschau, F.; et al. ABC2-SPH risk score for in-hospital mortality in COVID-19 patients: Development, external validation and comparison with other available scores. Int. J. Infect. Dis. 2021, 110, 281–308. [Google Scholar] [CrossRef]
Figure 1. Receiver operating characteristic (ROC) curves for the C2HEST score in predicting total mortality in the diabetic (AC) and non-diabetic (DF) cohorts at 3 time points following the positive RT-PCR test (t = 30 days; t = 90 days; t = 180 days). AUC—area under curve.
Jcm 11 00873 g001
Figure 2. Time-dependent ROC analysis for the C2HEST predictive abilities of all-cause death in the diabetic (A) and non-diabetic (B) cohorts (mean with CI). AUC—area under curve.
Jcm 11 00873 g002
Figure 3. Time-dependent ROC analysis for the C2HEST predictive abilities of death during hospitalization in the diabetic (A) and non-diabetic (B) cohorts (mean with CI). AUC—area under curve.
Jcm 11 00873 g003
Figure 4. Analysis of the 6-month survival for the low, medium, and high C2HEST risk strata in the diabetic (A) and non-diabetic (B) cohorts.
Jcm 11 00873 g004
Table 1. Baseline demographics, clinical characteristics, and comorbidities in the diabetic and non-diabetic cohort.
Variables, UnitsLow Risk
(0–1)
Medium
(2–3)
High Risk
(>4)
ANOVA
p Value
p Value for
Post Hoc Analysis in Significant ANOVA
L–M a
L–H b
M–H c
DemographicsDiabetes
N = 209
Non-Diabetes
N = 1183
Diabetes
N = 146
Non-Diabetes
N = 337
Diabetes
N = 118
Non-Diabetes
N = 146
DiabetesNon-DiabetesDiabetesNon-
Diabetes
Age, years
mean ± SD
min–max
N=

61.7 ± 11.7
17–74
209

49.4 ± 15.8
17–74
1183

75.3 ± 9.7
41–97
146

76.0 ± 12.5
29–100
337

76.9 ± 10.3
38–93
118

80.4 ± 8.2
50–100
146
<0.0001<0.0001<0.0001 a
<0.0001 b
0.409 c
<0.0001 a
<0.0001 b
0.000016 c
Age ≥ 65 years
n, n (%)
106, (50.7)268, (22.7)130, (89.0)284, (84.3)103, (87.3)141, (96.6)<0.0001<0.0001<0.0001 a
<0.0001 b
1.0 c
<0.0001 a
<0.0001 b
0.00074c
Male sex
n, n (%)
129, (61.7)597, (50.5)69, (47.3)134, (39.8)62, (52.5)71, (48.6)0.0220.00240.0287a
0.4003 b
1.0 c
0.002 a
1 b
0.2615 c
BMI. kg/m2
mean ± SD
min–max
N=
29.6 ± 5.7
17.1–42.4
65
27.8 ± 4.7
15.4–49.4
321
29.7 ± 3.8
23.0–36.7
27
28.9 ± 6.3
18.6–47.8
60
29.8 ± 6.3
19.6 -48.2
33
25.6 ± 4.6
16.4–34.9
32
0.98860.016N/A0.445 a
0.034 b
0.015 c
Normal body weight
(BMI = 18.5–24.9 kg/m2)
n, n (%) N=
14, (21.5)
65
85, (26.5)
321
5, (18.5)
27
14, (23.3)
60
8, (24.2)
33
14, (43.8)
32
0.99610.0332N/A1 a
0.0304 b
0.0496 c
Underweight
(BMI < 18.5 kg/m2)
n, n (%) N=
1, (1.5)
65
2, (0.6)
321
0, (0.0)
27
0, (0.0)
60
0, (0.0)
33
2, (6.3)
32
Overweight
(BMI = 25–29.9 kg/m2)
n, n (%) N=
19, (29.2)
65
140, (43.6)
321
9, (33.3)
27
24, (40.0)
60
10, (30.3)
33
11, (34.4)
32
Obesity
(BMI ≥ 30 kg/m2)
n, n (%) N=
31, (47.7)
65
94, (29.3)
321
13, (48.1)
27
22, (36.7)
60
15, (45.5)
33
5, (15.6)
32
Cigarette smoking, never/previous/current
n, n (%) N=
194, (92.8%)/6, (2.9%)/9, (4.3)
209
1122, (94.8%)/39, (3.3%)/22, (1.9%)
1183
131, (90.3%)/8, (5.5%),
/6, (4.1%)
145
294, (87.8%)/24, (7.2%)/17, (5.1%)
335
98, (83.1%)
/16, (13.6%)
/4, (3.4%)
118
116, (80.0%)/17, (11.7%)
/12, (8.3%)
145
0. 0081<0.00011.0 a
0.0041 b
0.2695 c
0.0002a
<0.0001 b
0.258 c
Hypertension,
n, n (%)
145, (69.4)264, (22.3)129, (88.4)219, (65.0)108, (91.5)131, (89.7)<0.0001<0.00010.00015 a
<0.0001 b
1.0 c
<0.0001 a
<0.0001 b
<0.0001 c
Dyslipidemia,
n, n (%) N=
57, (62.6)
91
146, (54.7)
267
25, (48.1)
52
43, (39.1)
110
24, (43.6)
55
20, (34.5)
58
0.05450.0019N/A0.025 a
0.0025b
1.0 c
Atrial fibrillation/flutter,
n, n (%)
16, (7.7)31, (2.6)35, (24)68, (20.2)54, (45.8)77, (52.7) <0.0001<0.0001<0.0001 a
<0.0001 b
0.00098 c
<0.0001 a
<0.0001 b
<0.0001 c
Previous coronary revascularization,
n, n (%)
2, (1.0)4, (0.3)14, (9.6)21, (6.2)55, (46.6)50, (34.2)<0.0001<0.00010.00096 a
<0.0001 b
<0.0001 c
<0.0001 a
< 0.0001b
< 0.0001c
Previous myocardial infarction
n, n (%)
2, (1.0)9, (0.8)28, (19.2)32, (9.5)55, (46.6)57, (39.0)<0.0001<0.0001<0.0001 a
<0.0001 b
<0.0001 c
<0.0001 a
<0.0001 b
<0.0001 c
Heart failure,
n, n (%)
0, (0)0, (0)20, (13.7)32, (9.5)94, (79.7)100, (68.5)<0.0001<0.0001<0.0001 a
<0.0001 b
<0.0001 c
<0.0001 a
<0.0001 b
<0.0001 c
Moderate/severe valvular heart disease or previous valve heart surgery,
n, n (%)
4, (1.9)9, (0.8)12, (8.2)18, (5.3)24, (20.3)25, (17.1)<0.0001<0.00010.0316 a
<0.0001 b
0.0226 c
<0.0001 a
<0.0001 b
0.00025 c
Peripheral artery disease,
n, n (%)
13, (6.2)12, (1.0)12, (8.2)17, (5.0)25, (21.2)15, (10.3)<0.0001<0.00011 a
0.00032 b
0.01357 c
<0.0001 a
<0.0001 b
0.1354 c
Previous stroke/TIA,
n, n (%)
12, (5.7)31, (2.6)26, (17.8)33, (9.8)25, (21.2)31, (21.2)<0.0001<0.00010.00172 a
0.00015 b
1 c
<0.0001 a
<0.0001 b
0.0034 c
Chronic kidney disease
n, n (%)
24, (11.5)45, (3.8)24, (16.4)43, (12.8)54, (45.8)34, (23.3)<0.0001<0.00010.7072 a
<0.0001 b
<0.0001 c
<0.0001 a
<0.0001 b
0.017 c
Hemodialysis
n, n (%)
6, (2.9)13, (1.1)8, (5.5)11, (3.3)13, (11.09)5, (3.4)0.00950.00651 a
0.0164 b
0.463 c
0.0314 a
0.1176 b
1 c
Asthma,
n, n (%)
9, (4.3)43, (3.6)9, (6.2)13, (3.9)16, (13.6)3, (2.1)0.80530.584676N/AN/A
COPD
n, n (%)
1, (0.5)5, (0.4)9, (6.2)15, (4.5)16, (13.6)25, (17.1)<0.0001<0.00010.0127 a
<0.0001 b
0.2023 c
<0.0001 a
<0.0001 b
<0.0001 c
Hypothyroidism
n, n (%)
10, (4.8)62, (5.2)17, (11.6)49, (14.5)33, (28.0)28, (19.2)<0.0001<0.00010.0844 a
<0.0001 b
0.004 c
<0.0001 a
<0.0001 b
0.7586 c
Hyperthyroidism
n, n (%)
0, (0)4, (0.3)1, (0.7)9, (2.7)0, (0)6, (4.1)0.5581<0.0001N/A0.0011 a
0.0007 b
1.0 c
Continuous variables are presented as: mean ± SD; range (minimum–maximum); and number of non-missing values. Categorized variables are presented as: a number with a percentage. Information about the numbers with valid values is provided in the left column. Abbreviations: N—valid measurements; n—number of patients with a parameter above the cut-off point; SD—standard deviation; BMI—body mass index; TIA—transient ischemic attack; COPD—chronic obstructive pulmonary disease; N/A—non-applicable; a—low- vs. medium-risk stratum; b—low- vs. high-risk stratum; c—medium- vs. high-risk stratum; red color text—statistically significant values. Statistically significant differences are marked in red color.
Table 2. Patient-reported symptoms, vital signs, and abnormalities measured during physical examination at hospital admission in the diabetic and non-diabetic cohorts.
Variables, UnitsLow Risk
(0–1)
Medium
(2–3)
High Risk
(>4)
ANOVA
p Value
p Value for
Post Hoc Analysis in Significant ANOVA
L–M a
L–H b
M–H c
Patient-Reported SymptomsDiabetes
N = 209
Non-
Diabetes
N = 1183
Diabetes
N= 146
Non-
Diabetes
N = 337
Diabetes
N = 118
Non-
Diabetes
N = 146
DiabetesNon-
Diabetes
DiabetesNon-
Diabetes
Cough,
n, n (%)
52, (24.9)392, (33.1)34, (23.3)89, (26.4)25, (21.2)38, (26)0.7490.0236N/AN/A
Dyspnea,
n, n (%)
84, (40.2)475, (40.2)62, (42.5)140, (41.5)62, (52.5)79, (54.1)0.0880.00546N/A1 a
0.0051 b
0.0431 c
Chest pain
n, n (%)
11, (5.3)88, (7.4)8, (5.5)25, (7.4)17, (14.4)8, (5.5)0.0060.68528N/AN/A
Hemoptysis
n, n (%)
3, (1.4)6, (0.5)0, (0)2, (0.6)2, (1.69)2, (1.4)0.2710.3467N/AN/A
Smell dysfunction
n, n (%)
2, (1)57, (4.8)2, (1.4)8, (2.4)3, (2.5)2, (1.4)0.5520.03057N/A0.2137 a
0.2698 b
1 c
Taste dysfunction
n, n (%)
3, (1.4)45, (3.8)3, (2.1)7, (2.1)4, (3.4)3, (2.1)0.4670.2337N/AN/A
Abdominal pain
n, n (%)
21, (10.1)83, (7.0)7, (4.8)19, (5.6)5, (4.2)12, (8.2)0.0650.53339N/AN/A
Diarrhea
n, n (%)
14, (6.7)61, (5.2)9, (6.2)24, (7.1)4, (3.4)15, (10.3)0.4460.03065N/AN/A
Nausea/vomiting
n, n (%)
8, (3.8)48, (4.1)11, (7.5)16, (4.7)5, (4.2)9, (6.2)0.2620.4694N/AN/A
Body temperature, °C
mean ± SD
min–max
N=
36.9 ± 0.82
34.4–39.5
110
37.1 ± 0.89
35.0–40.5
678
37 ± 1
35–40
75
36.9 ± 0.87
35.5–40.0
154
36.8 ± 0.7
35.2–39.3
63
37.0 ± 0.97
35.9–40.0
71
0.4710.07369N/AN/A
Heart rate, beats/minute mean ± SD
min–max
N=
87.1 ± 17.2
48–150
160
86.3 ± 15.41
48–160
863
85.5 ± 16.2
50–150
122
83.5 ± 16.7
50–160
257
84.6 ± 17.5
47–140
109
84.7 ± 18.97
36–150
121
0.490.0486N/A0.045a
0.626 b
0.84 c
Respiratory rate, breaths/minute
mean ± SD
min–max
N=
21.1 ± 9.1
12–50
35
17.8 ± 4.65
12–40
167
18 ± 4
12–28
20
18.9 ± 6.05
12–45
44
19.9 ± 7.8
12–50
24
18.9 ± 3.66
12–25
19
0.1960.3055N/AN/A
Systolic blood pressure, mmHg
mean ± SD
min–max
N=
132.9 ± 21.6
60–204
160
130.2 ± 21.22
60–240
855
134.3 ± 38.8
50–270
121
134.1 ± 23.39
60–210
256
137.5 ± 23.4
86–210
111
132.6 ± 26.11
70–205
123
0.2530.05307N/AN/A
Diastolic blood pressure, mmHg
mean ± SD
min–max
N=
78.8 ± 13.6
40–125
159
78.5 ± 12.5
40–150
853
79.2 ± 14.3
50–150
117
77.6 ± 13.1
45–157
255
76 ± 14.8
44–143
111
76.0 ± 15.66
40–120
123
0.1900.19414N/AN/A
Pulse pressure
mean ± SD
min–max
N=
54.6 ± 16
15–110
159
51.9 ± 15.28
11–136
853
57.5 ± 18.6
20–120
117
56.9 ± 18.16
20–120
254
61.6 ± 18
30–130
111
56.6 ± 19.47
20–120
123
0.0049<0.00010.36 a
0.003 b
0.212 c
0.0002 a
0.03b
0.987 c
SpO2 on room air, % (FiO2 = 21%)
mean ± SD
min–max
N=
91.8 ± 6.8
56–100
106
92.9 ± 7.2
48–100
690
88.8 ± 10.2
50–100
89
90.0 ± 9.45
50–99
187
91.5 ± 7.8
60–99
66
88.8 ± 9.13
50–99
92
0.059<0.0001N/A0.0005a
0.0003b
0.559 c
SpO2 < 90%,
n, n (%)
29, (27.4)153, (22.2)37, (41.6)63, (33.7)19, (28.8)36, (39.1)0.081<0.0001N/A0.00496a
0.0018b
1 c
GCS, points
mean ± SD
min–max
N=
14.7 ± 1.3
6–15
77
14.6 ± 1.88
3–15
484
14.2 ± 2
3–15
56
14.6 ± 1.52
3–15
130
14.2 ± 2.6
3–15
48
14.0 ± 2.38
3–15
66
0.2020.15588N/AN/A
Cracles
n, n (%)
33, (15.8)119, (10.1)38, (26)61, (18.1)33, (28)32, (21.9)0.014<0.0001N/A0.00025 a
0.0001 b
1 c
Wheezing
n, n (%)
15, (7.2)79, (6.7)20, (13.7)35, (10.4)32, (27.1)35, (24.0)<0.0001<0.00010.1941 a
<0.0001 b
0.0305 c
0.0917 a
<0.0001 b
0.00052 c
Pulmonary congestion
n, n (%)
37, (17.7)145, (12.3)39, (26.7)62, (18.4)39, (33.1)36, (24.7)0.006<0.0001N/A0.0149 a
0.0002 b 0.443 c
Peripheral edema
n, n (%)
14, (6.7)61, (5.2)24, (16.4)35, (10.4)29, (24.6)23, (15.8)<0.0001<0.00010.0181 a
<0.0001 b
0.4113 c
0.0024 a
<0.0001 b
0.3899 c
Hemiplegia/hemiparesis
n, n (%)
6, (2.9)23, (1.9)10, (6.9)13, (3.9)6, (5.1)12, (8.2)0.2090.0002N/A0.1931 a
0.0005 b
0.2122 c
VES-13, points
mean ± SD
min–max
N=
5 ± 3.4
1–9
8
3.8 ± 2.63
1–9
20
6.28 ± 3.6
1–12
18
5.1 ± 3.03
1–10
19
6.2 ± 2.66
3–10
10
6.5 ± 3.2
3–13
14
0.6710.045N/A0.363 a
0.038 b
0.394 c
Continuous variables are presented as: mean ± SD; range (minimum–maximum); and the number of non-missing values. Categorized variables are presented as: a number with a percentage. Information about the numbers with valid values is provided in the left column. Abbreviations: N—valid measurements; n—number of patients with a parameter above the cut-off point; SD—standard deviation; GCS—Glasgow Coma Scale; VES—Vulnerable Elders Survey; N/A—non-applicable; a—low- vs. medium-risk stratum; b—low- vs. high-risk stratum; c—medium- vs. high-risk stratum; red color text—statistically significant values. Statistically significant differences are marked in red color.
Table 3. Applied treatment and procedures in the diabetic and non-diabetic cohorts after C2HEST risk stratification.
VariablesLow Risk
(0–1)
Medium
(2–3)
High Risk
(>4)
ANOVA
p Value
p Value for
Post Hoc Analysis in Significant ANOVA
L–M a
L–H b
M–H c
Diabetes
N = 209
Non-
Diabetes
N = 1183
Diabetes
N= 146
Non-
Diabetes
N = 337
Diabetes
N = 118
Non-
Diabetes
N = 146
DiabetesNon-
Diabetes
DiabetesNon-
Diabetes
Applied treatment and procedures
The most advanced respiratory support applied during the hospitalization 0.0712<0.0001N/A0.0229a
<0.0001b
0.0066c
no oxygen
n, n (%)79, (37.8)648, (54.9)45, (30.8)153, (45.4)37, (31.4)47, (32.2)
low flow oxygen support
n, n (%)79, (37.8)365, (30.9)61, (41.8)125, (37.1)49, (41.5)72, (49.3)
high flow nasal cannula
non-invasive ventilation
n, n (%)15, (3.2)67, (5.7)20, (4.2)32, (9.5)18, (3.8)20, (13.7)
invasive ventilation
n, n (%)36, (17.2)101, (8.6)20, (13.7)27, (8.0)14, (11.9)7, (4.8)
Oxygenation parameters from the period of qualification for advanced respiratory support: SpO2, %
mean ± SD
(min–max)
N=
88.4 ± 8.5
(60–98)
54
90.9 ± 7.8
(50–100)
345
86.6 ± 10.8
(57–99)
47
86.9 ± 9.0
(55–99)
82
87.6 ± 8.0
(60–98)
42
83.6 ± 11.4
(59–99)
44

0.6374

<0.0001
N/A

0.0009a
0.0004b
0.224 c
Therapy with catecholamines,
n, n (%)
33, (15.8)95, (8.0)15, (10.3)28, (8.3)22, (18.6)19, (13.0)0.14110.124667N/AN/A
Coronary revascularization or/and an indication for coronary revascularization,
n, n (%)
4, (1.9)4, (0.3)4, (2.7)6, (1.8)5, (4.2)2, (1.4)0.42350.0092N/A0.0317a
0.4015 b
1 c
Hemodialysis,
n, n (%)
15, (7.2)31, (2.6)7, (4.8)5, (1.5)8, (6.8)3, (2.1)0.64660.5311N/AN/A
Continuous variables are presented as: mean ± S; range (minimum–maximum); and the number of non-missing values. Categorized variables are presented as: a number with a percentage. Information about the numbers with valid values is provided in the left column. Abbreviations: N—valid measurements; n—number of patients with a parameter above cut-off point; SD—standard deviation; ANOVA—analysis of variance; N/A—non-applicable; a—low- vs. medium-risk stratum; b—low- vs. high-risk stratum; c—medium- vs. high-risk stratum. Statistically significant differences are marked in red color.
Table 4. Total and in-hospital all-cause mortality in the C2HEST risk strata in the diabetic and non-diabetic cohort.
VariablesLow Risk
(0–1)
Medium
(2–3)
High Risk
(>4)
ANOVA
p Value
p Value for
Post Hoc Analysis in Significant ANOVA
L–M a
L–H b
M–H c
Diabetes
N = 209
Non-Diabetes
N = 1183
Diabetes
N= 146
Non-Diabetes
N = 337
Diabetes
N = 118
Non-Diabetes
N = 146
DiabetesNon-DiabetesDiabetesNon-
Diabetes
All-cause mortality rate
In-hospital mortality,
n, n (%)
32, (15.3)85, (7.2)42, (28.8)65, (19.3)41, (34.7)54, (37.0)0.00014<0.00010.0099
0.0003
1.0 c
<0.0001 a
<0.0001 b
0.00017c
3-month mortality,
n, n (%)
N=
51, (24.4)
201
150, (12.7)
1116
69, (47.3)
143
125, (37.1)
323
63, (53.4)
117
81, (55.5)
143
<0.0001<0.0001<0.0001 a
<0.0001 b
1.0 c
<0.0001 a
<0.0001 b
0.0008 c
6-month mortality,
n, n (%)
N=
55, (37.2)
118
158, (22.3)
447
71, (60.7)
109
133, (51.4)
214
68, (64.8)
91
85, (68.0)
116
<0.0001<0.00010.0007a
<0.0001 b
0.5682 c
<0.0001 a
<0.0001 b
0.0088 c
Hospitalization
Duration of hospitalization, days (distribution to be verified)
mean ± SD
(min–max)
16.5 ± 17.7
(1–126)
1.5 ± 12.4
(1–131)
14.4 ± 14.6
(1–72)
12.8 ± 13.3
(1–124)
17.8 ± 18.2
(1–121)
15.3 ± 14.0
(1–82)
0.2293<0.0001 0.011a
0.0004b
0.181 c
End of hospitalization 0.0003<0.00010.0063 a
0.0004 b
1.0 c
<0.0001 a
<0.0001 b
0.0019c
death
n, n (%)32, (15.3)85, (7.2)42, (28.8)65, (19.3)41, (34.7)54, (37)
discharge to home—full recovery
n, n (%)120, (57.4)851, (71.9)56, (38.4)164, (48.7)43, (36.4)56, (38.4)
transfer to another hospital—worsening)
n, n (%)28, (13.4)111, (9.4)24, (16.4)70, (20.8)20, (16.9)23, (15.8)
transfer to another hospital—in recovery
n, n (%)29, (13.9)136, (11.5)24, (16.4)38, (11.3)14, (11.9)13, (8.9)
Categorized variables are presented as: a number with a percentage. Abbreviations: N—valid measurements; n—number of patients with a parameter above the cut-off point; SD—standard deviation; ANOVA—analysis of variance; N/A—non-applicable; a—low- vs. medium-risk stratum; b—low- vs. high-risk stratum; c—medium- vs. high-risk stratum. Statistically significant differences are marked in red color.
Table 5. The total all-cause death hazard ratios for C2HEST risk stratification in the diabetic cohort.
DiabeticsNon-Diabetics
Total DeathsHR95% CIp-ValueHR95% CIp-Value
Overall1.251.163–1.341<0.00011.451.382–1.525<0.0001
Risk strata
Medium- vs. low-risk2.341.658–3.315<0.00013.512.795–4.414<0.0001
High- vs. low-risk2.841.999–4.0329<0.00016.04.628–7.794<0.0001
Bold text—statistically significant values.
Table 6. The in-hospital all-cause death hazard ratios for C2HEST risk stratification in the diabetic cohort.
DiabeticsNon-Diabetics
Total DeathsHR95% CIp-ValueHR95% CIp-Value
Overall1.191.081–1.314<0.00051.2941.207–1.387<0.0001
Risk strata
Medium- vs. low-risk2.161.363–3.4370.001062.135--
High- vs. low-risk2.111.329–3.3560.001553.345--
Bold text—statistically significant values.
Table 7. Clinical non-fatal events and hospitalization outcomes in the C2HEST risk strata in the diabetic and non-diabetic cohort.
VariablesLow Risk
(0–1)
Medium
(2–3)
High Risk
(>4)
ANOVA
p Value
p Value for
Post Hoc Analysis in Significant ANOVA
L–M a
L–H b
M–H c
Diabetes
N = 209
Non-Diabetes
N = 1183
Diabetes
N= 146
Non-Diabetes
N = 337
Diabetes
N = 118
Non-Diabetes
N = 146
DiabetesNon-
Diabetes
DiabetesNon-
Diabetes
Aborted cardiac arrest,
n, n (%)
2, (1.0)13, (1.1)0, (0.0)3, (0.9)4, (3.4)2, (1.4)0.05730.8520N/AN/A
Shock,
n, n (%)
29, (13.9)76, (6.4)14, (9.6)29, (8.6)16, (13.6)16, (11.0)0.44570.0782N/AN/A
Hypovolemic shock,
n, n (%)
5, (2.4)17, (1.4)3, (2.1)4, (1.2)1, (0.8)5, (3.4)0.69460.1623N/AN/A
Cardiogenic shock,
n, n (%)
2, (1.0)5, (0.4)4, (2.7)7, (2.1)8, (6.8)6, (4.1)0.01320.000110.7008 a
0.01599 b
0.4287 c
0.0208a
0.0014b
0.6787 c
Septic shock,
n, n (%)
27, (12.9)58, (4.9)10, (6.8)18, (5.3)12, (10.2)9, (6.2)0.18120.7878N/AN/A
Venous thromboembolic disease,
n, n (%)
13, (6.2),68, (5.7)9, (6.2)21, (6.2)3, (2.5)12, (8.2)0.30670.493N/AN/A
Pulmonary embolism,
n, n (%)
4, (1.9)28, (2.4)2, (1.4)7, (2.1)3, (2.5)4, (2.7)0.980.7257N/AN/A
Myocardial infarction,
n, n (%)
4, (1.9)4, (0.3)4, (2.7)6, (1.8)4, (3.4)3, (2.1)0.6570.0049N/A0.0317a
0.0978 b
1 c
Myocardial injury, 3x,
n, n (%) N
31, (24.6)
N = 126
78, (14.4)
N = 542
35, (39.3)
N = 89
60, (28.7)
N = 209
36, (41.4)
N = 87
46, (48.4)
N = 95
0.0165<0.00010.0934 a
0.0438 b
1.0 c
<0.0001 a
<0.0001 b
0.0039c
Acute heart failure,
n, n (%)
2(1.0)6, (0.5)9, (6.2)13, (3.9)23, (19.5)23, (15.8)<0.0001<0.00010.04a <0.0001b
0.0056c
<0.0001 a
<0.0001 b
<0.0001c
Stroke/TIA,
n, n (%)
4, (1.9)13, (1.1)8, (5.5)10, (30.0)2, (1.7)3, (2.1)0.13610.0347N/A0.062 a
1.0 b
1.0 c
Pneumonia,
n, n (%)
127, (60.8)545, (46.1)90, (61.6)210, (62.3)77, (65.3)102, (69.9)0.7155<0.0001N/A<0.0001a
<0.0001b
0.409 c
Complete respiratory failure,
n, n (%)
N
17, (45.9)
N = 37
39, (47.0)
N = 83
20, (62.5)
N = 32
26, (46.4)
N = 56
21, (70)
N = 30
22, (62.9)
N = 35
0.11950.2344N/AN/A
SIRS,
n, n (%)
N
23, (11.2)
N = 206
116, (10.3)
N = 1121
17, (11.6)
N = 146
25, (97.5)
N = 334
17, (14.4)
N = 118
19, (13.1)
N = 145
0.6750.132N/AN/A
Sepsis,
n, n (%)
N
2, (2.6)
N = 77
7, (1.4)
N = 484
4, (7.3)
N = 55
2, (1.6)
N = 122
2, (3.6)
N = 55
5, (7.8)
N = 64
0.44040.0109N/AN/A
Acute kidney injury,
n, n (%)
28, (13.4)81, (6.8)27, (18.5)39, (11.6)31, (26.3)25, (17.1)0.0149<0.00010.7422 a
0.0175 b
0.5139 c
0.0194 a
<0.0001b
0.396 c
Acute liver dysfunction, n, n (%)
N
6, (3.0)
N = 198
24, (2.3)
N = 1034
5, (3.7)
N = 136
17, (5.3)
N = 320
7, (6.4)
N = 109
7, (5.2)
N = 134
0.33880.001N/A0.0408 a
0.2311 b
1 c
Multiple organ dysfunction syndrome,
n, n (%)
2, (1.0)19, (1.6)3, (2.1)5, (1.5)5, (4.2)3, (2.1)0.14210.8547N/AN/A
Lactic acidosis (on admission),
n, n (%)
N
3, (9.7)
N = 31
6, (8.2)
N = 73
2, (7.1)
N = 28
3, (5.9)
N = 51
6, (22.2)
N = 27
2, (6.3)
N = 32
0.25810.9199N/AN/A
Hyperlactatemia (on admission)
n, n (%)
N
20, (64.5)
N = 31
58, (79.5)
N = 73
17, (60.7)
N = 28
35, (68.6)
N = 51
16, (59.3)
N = 27
21, (65.2)
N = 32
0.91240.2317N/AN/A
Bleeding, n (%)
n, n (%)
15, (7.2)48, (4.1)9, (6.2)16, (4.7)11, (9.3)14, (9.6)0.61370.0116N/A1 a
0.0162 b
0.2066 c
Intracranial bleeding,
n, n (%)
3, (1.4)9, (0.8)3, (2.1)5, (1.5)0, (0.0)1, (0.7)0.38460.3794N/AN/A
Respiratory tract bleeding,
n, n (%)
6, (2.9)17, (1.4)3, (2.1)1, (0.3)4, (3.4)3, (2.1)0.7740.1106N/AN/A
Gastrointestinal bleeding,
n, n (%)
7, (3.3)13, (1.1)2, (1.4)7, (2.1)5, (4.2)7, (4.8)0.46990.0031N/A0.4279 a
0.0047 b
0.3529 c
Urinary tract bleeding,
n, n (%)
3, (1.4)6, (0.5)2, (1.4)2, (0.6)2, (1.7)3, (2.1)1.00.0955N/AN/A
Continuous variables are presented as: mean ± SD range (minimum–maximum) and the number of non-missing values. Categorized variables are presented as: a number with a percentage. Abbreviations: N—valid measurements; n—number of patients with a parameter above the cut-off point; SD—standard deviation; ANOVA—analysis of variance; N/A—not applicable; a—low- vs. medium-risk stratum; b—low- vs. high-risk stratum; c—medium- vs. high-risk stratum; red color text—statistically significant values. Statistically significant differences are marked in red color.
Publisher’s Note: MDPI stays neutral with regard to jurisdictional claims in published maps and institutional affiliations.

