Derivation and Validation of Machine Learning Approaches to Predict Acute Kidney Injury after Cardiac Surgery

 , , and
Abstract
:1. Introduction
2. Materials and Methods
2.1. Study Design
2.2. Anesthesia, Surgical Technique
2.3. Data Collection
2.4. Statistical Analysis
3. Results
4. Discussion
5. Conclusions
Supplementary Materials
Author Contributions
Funding
Conflicts of Interest
References
- Bejnordi, B.E.; Veta, M.; van Diest, P.J.; van Ginneken, B.; Karssemeijer, N.; Litjens, G.; van der Laak, J.A.W.M. Diagnostic Assessment of Deep Learning Algorithms for Detection of Lymph Node Metastases in Women With Breast Cancer. Jama 2017, 318, 2199–2210. [Google Scholar] [CrossRef] [PubMed]
- Ting, D.S.W.; Cheung, C.Y.L.; Lim, G.; Tan, G.S.W.; Quang, N.D.; Gan, A.; Hamzah, H.; Garcia-Franco, R.; San Yeo, I.Y.; Lee, S.Y.; et al. Development and Validation of a Deep Learning System for Diabetic Retinopathy and Related Eye Diseases Using Retinal Images From Multiethnic Populations With Diabetes. Jama 2017, 318, 2211–2223. [Google Scholar] [CrossRef] [PubMed]
- Fei, Y.; Hu, J.; Li, W.Q.; Wang, W.; Zong, G.Q. Artificial neural networks predict the incidence of portosplenomesenteric venous thrombosis in patients with acute pancreatitis. J. Thromb. Haemost. 2017, 15, 439–445. [Google Scholar] [CrossRef] [PubMed]
- Taylor, R.A.; Pare, J.R.; Venkatesh, A.K.; Mowafi, H.; Melnick, E.R.; Fleischman, W.; Hall, M.K. Prediction of In-hospital Mortality in Emergency Department Patients with Sepsis: A Local Big Data-Driven, Machine Learning Approach. Acad. Emerg. Med. 2016, 23, 269–278. [Google Scholar] [CrossRef] [PubMed]
- Lee, C.K.; Hofer, I.; Gabel, E.; Baldi, P.; Cannesson, M. Development and Validation of a Deep Neural Network Model for Prediction of Postoperative In-hospital Mortality. Anesthesiology 2018, in press. [Google Scholar] [CrossRef] [PubMed]
- Shin, S.R.; Kim, W.H.; Kim, D.J.; Shin, I.W.; Sohn, J.T. Prediction and Prevention of Acute Kidney Injury after Cardiac Surgery. Biomed Res. Int. 2016, 2016, 2985148. [Google Scholar] [CrossRef] [PubMed]
- Hobson, C.E.; Yavas, S.; Segal, M.S.; Schold, J.D.; Tribble, C.G.; Layon, A.J.; Bihorac, A. Acute kidney injury is associated with increased long-term mortality after cardiothoracic surgery. Circulation 2009, 119, 2444–2453. [Google Scholar] [CrossRef] [PubMed]
- Chawla, L.S.; Eggers, P.W.; Star, R.A.; Kimmel, P.L. Acute kidney injury and chronic kidney disease as interconnected syndromes. N. Engl. J. Med. 2014, 371, 58–66. [Google Scholar] [CrossRef] [PubMed]
- Thakar, C.V.; Arrigain, S.; Worley, S.; Yared, J.P.; Paganini, E.P. A clinical score to predict acute renal failure after cardiac surgery. J. Am. Soc. Nephrol. 2005, 16, 162–168. [Google Scholar] [CrossRef] [PubMed]
- Mehta, R.H.; Grab, J.D.; O’Brien, S.M.; Bridges, C.R.; Gammie, J.S.; Haan, C.K.; Ferguson, T.B.; Peterson, E.D. Bedside tool for predicting the risk of postoperative dialysis in patients undergoing cardiac surgery. Circulation 2006, 114, 2208–2216. [Google Scholar] [CrossRef] [PubMed]
- Palomba, H.; de Castro, I.; Neto, A.L.; Lage, S.; Yu, L. Acute kidney injury prediction following elective cardiac surgery: AKICS Score. Kidney Int. 2007, 72, 624–631. [Google Scholar] [CrossRef] [PubMed]
- Wijeysundera, D.N.; Karkouti, K.; Dupuis, J.Y.; Rao, V.; Chan, C.T.; Granton, J.T.; Beattie, W.S. Derivation and validation of a simplified predictive index for renal replacement therapy after cardiac surgery. Jama 2007, 297, 1801–1809. [Google Scholar] [CrossRef] [PubMed]
- Aronson, S.; Fontes, M.L.; Miao, Y.; Mangano, D.T. Risk index for perioperative renal dysfunction/failure: Critical dependence on pulse pressure hypertension. Circulation 2007, 115, 733–742. [Google Scholar] [CrossRef] [PubMed]
- Brown, J.R.; Cochran, R.P.; Leavitt, B.J.; Dacey, L.J.; Ross, C.S.; MacKenzie, T.A.; Kunzelman, K.S.; Kramer, R.S.; Hernandez, F.; Helm, R.E.; et al. Multivariable prediction of renal insufficiency developing after cardiac surgery. Circulation 2007, 116, I139–I143. [Google Scholar] [CrossRef] [PubMed]
- Fortescue, E.B.; Bates, D.W.; Chertow, G.M. Predicting acute renal failure after coronary bypass surgery: Cross-validation of two risk-stratification algorithms. Kidney Int. 2000, 57, 2594–2602. [Google Scholar] [CrossRef] [PubMed] [Green Version]
- Rahmanian, P.B.; Kwiecien, G.; Langebartels, G.; Madershahian, N.; Wittwer, T.; Wahlers, T. Logistic risk model predicting postoperative renal failure requiring dialysis in cardiac surgery patients. Eur. J. Cardiothorac. Surg. 2011, 40, 701–707. [Google Scholar] [PubMed]
- Vives, M.; Callejas, R.; Duque, P.; Echarri, G.; Wijeysundera, D.N.; Hernandez, A.; Sabate, A.; Bes-Rastrollo, M.; Monedero, P. Modern hydroxyethyl starch and acute kidney injury after cardiac surgery: A prospective multicentre cohort. Br. J. Anaesth. 2016, 117, 458–463. [Google Scholar] [CrossRef] [PubMed]
- Kim, W.H.; Lee, J.H.; Kim, E.; Kim, G.; Kim, H.J.; Lim, H.W. Can We Really Predict Postoperative Acute Kidney Injury after Aortic Surgery? Diagnostic Accuracy of Risk Scores Using Gray Zone Approach. Thorac. Cardiovasc. Surg. 2016, 64, 281–289. [Google Scholar] [CrossRef] [PubMed]
- Parolari, A.; Pesce, L.L.; Pacini, D.; Mazzanti, V.; Salis, S.; Sciacovelli, C.; Rossi, F.; Alamanni, F. Risk factors for perioperative acute kidney injury after adult cardiac surgery: Role of perioperative management. Ann. Thorac. Surg. 2012, 93, 584–591. [Google Scholar] [CrossRef] [PubMed]
- Kim, W.H.; Lee, S.M.; Choi, J.W.; Kim, E.H.; Lee, J.H.; Jung, J.W.; Ahn, J.H.; Sung, K.I.; Kim, C.S.; Cho, H.S. Simplified clinical risk score to predict acute kidney injury after aortic surgery. J. Cardiothorac. Vasc. Anesth. 2013, 27, 1158–1166. [Google Scholar] [CrossRef] [PubMed]
- Kim, W.H.; Park, M.H.; Kim, H.J.; Lim, H.Y.; Shim, H.S.; Sohn, J.T.; Kim, C.S.; Lee, S.M. Potentially modifiable risk factors for acute kidney injury after surgery on the thoracic aorta: A propensity score matched case-control study. Medicine 2015, 94, e273. [Google Scholar] [CrossRef] [PubMed]
- Hur, M.; Koo, C.H.; Lee, H.C.; Park, S.K.; Kim, M.; Kim, W.H.; Kim, C.S.; Lee, S.M. Preoperative aspirin use and acute kidney injury after cardiac surgery: A propensity-score matched observational study. PLoS ONE 2017, 12, E0177201. [Google Scholar] [CrossRef] [PubMed]
- Hur, M.; Nam, K.; Jo, W.Y.; Kim, G.; Kim, W.H.; Bahk, J.H. Association Between Elevated Echocardiographic Index of Left Ventricular Filling Pressure and Acute Kidney Injury After Off-Pump Coronary Artery Surgery. Circ. J. 2018, 82, 857–865. [Google Scholar] [CrossRef] [PubMed] [Green Version]
- Thomas, M.E.; Blaine, C.; Dawnay, A.; Devonald, M.A.; Ftouh, S.; Laing, C.; Latchem, S.; Lewington, A.; Milford, D.V.; Ostermann, M. The definition of acute kidney injury and its use in practice. Kidney Int. 2015, 87, 62–73. [Google Scholar] [CrossRef] [PubMed]
- Hori, D.; Katz, N.M.; Fine, D.M.; Ono, M.; Barodka, V.M.; Lester, L.C.; Yenokyan, G.; Hogue, C.W. Defining oliguria during cardiopulmonary bypass and its relationship with cardiac surgery-associated acute kidney injury. Br. J. Anaesth. 2016, 117, 733–740. [Google Scholar] [CrossRef] [PubMed]
- Mizota, T.; Yamamoto, Y.; Hamada, M.; Matsukawa, S.; Shimizu, S.; Kai, S. Intraoperative oliguria predicts acute kidney injury after major abdominal surgery. Br. J. Anaesth. 2017, 119, 1127–1134. [Google Scholar] [CrossRef] [PubMed]
- Kellum, J.A.; Zarbock, A.; Nadim, M.K. What endpoints should be used for clinical studies in acute kidney injury? Intensive Care Med. 2017, 43, 901–903. [Google Scholar] [CrossRef] [PubMed]
- Hanley, J.A.; McNeil, B.J. The meaning and use of the area under a receiver operating characteristic (ROC) curve. Radiology 1982, 143, 29–36. [Google Scholar] [CrossRef] [PubMed]
- Zou, K.H.; O’Malley, A.J.; Mauri, L. Receiver-operating characteristic analysis for evaluating diagnostic tests and predictive models. Circulation 2007, 115, 654–657. [Google Scholar] [CrossRef] [PubMed]
- DeLong, E.R.; DeLong, D.M.; Clarke-Pearson, D.L. Comparing the areas under two or more correlated receiver operating characteristic curves: A nonparametric approach. Biometrics 1988, 44, 837–845. [Google Scholar] [CrossRef] [PubMed]
- Zavrsnik, J.; Kokol, P.; Maleiae, I.; Kancler, K.; Mernik, M.; Bigec, M. ROSE: Decision trees, automatic learning and their applications in cardiac medicine. Medinfo 1995, 8, 1688. [Google Scholar] [PubMed]
- Sheridan, R.P.; Wang, W.M.; Liaw, A.; Ma, J.; Gifford, E.M. Extreme Gradient Boosting as a Method for Quantitative Structure-Activity Relationships. J. Chem. Inf. Model. 2016, 56, 2353–2360. [Google Scholar] [CrossRef] [PubMed]
- Gao, C.; Sun, H.; Wang, T.; Tang, M.; Bohnen, N.I.; Muller, M.L.; Herman, T.; Giladi, N.; Kalinin, A.; Spino, C.; et al. Model-based and Model-free Machine Learning Techniques for Diagnostic Prediction and Classification of Clinical Outcomes in Parkinson’s Disease. Sci. Rep. 2018, 8, 7129. [Google Scholar] [CrossRef] [PubMed]
- Available online: https://github.com/dmlc/xgboost (accessed on 3 October 2018).
- Chawla, N.V.; Bowyer, K.W.; Hall, L.O.; Kegelmeyer, W.P. SMOTE: Synthetic minority over-sampling technique. J. Artif. Intell. Res. 2002, 16, 321–357. [Google Scholar] [CrossRef]
- Available online: https://vitaldb.net/aki (accessed on 3 Octber 2018).
- Lei, T.; Sun, H.; Kang, Y.; Zhu, F.; Liu, H.; Zhou, W.; Wang, Z.; Li, D.; Li, Y.; Hou, T. ADMET Evaluation in Drug Discovery. 18. Reliable Prediction of Chemical-Induced Urinary Tract Toxicity by Boosting Machine Learning Approaches. Mol. Pharm. 2017, 14, 3935–3953. [Google Scholar] [CrossRef] [PubMed]
- Aviles-Jurado, F.X.; Leon, X. Prognostic factors in head and neck squamous cell carcinoma: Comparison of CHAID decision trees technology and Cox analysis. Head Neck 2013, 35, 877–883. [Google Scholar] [CrossRef] [PubMed]
- Kasbekar, P.U.; Goel, P.; Jadhav, S.P. A Decision Tree Analysis of Diabetic Foot Amputation Risk in Indian Patients. Front. Endocrinol. 2017, 8, 25. [Google Scholar] [CrossRef] [PubMed]
- Zintzaras, E.; Bai, M.; Douligeris, C.; Kowald, A.; Kanavaros, P. A tree-based decision rule for identifying profile groups of cases without predefined classes: Application in diffuse large B.-cell lymphomas. Comput. Biol. Med. 2007, 37, 637–641. [Google Scholar] [CrossRef] [PubMed]
- Lemon, S.C.; Roy, J.; Clark, M.A.; Friedmann, P.D.; Rakowski, W. Classification and regression tree analysis in public health: Methodological review and comparison with logistic regression. Ann. Behav. Med. 2003, 26, 172–181. [Google Scholar] [CrossRef] [PubMed]
- Li, K.; Yu, N.; Li, P.; Song, S.; Wu, Y.; Li, Y.; Liu, M. Multi-label spacecraft electrical signal classification method based on DBN and random forest. PLoS ONE 2017, 12, E0176614. [Google Scholar] [CrossRef] [PubMed]
- Hsu, P.L.; Robbins, H. Complete Convergence and the Law of Large Numbers. Proc. Natl. Acad. Sci. USA 1947, 33, 25–31. [Google Scholar] [CrossRef] [PubMed]
- Hornik, K. Approximation capabilities of multilayer feedforward networks. Neural. Networks. 1991, 4, 251–257. [Google Scholar] [CrossRef]
- Kuo, P.J.; Wu, S.C.; Chien, P.C.; Rau, C.S.; Chen, Y.C.; Hsieh, H.Y.; Hsieh, C.H. Derivation and validation of different machine-learning models in mortality prediction of trauma in motorcycle riders: A cross-sectional retrospective study in southern Taiwan. BMJ Open 2018, 8, e018252. [Google Scholar] [CrossRef] [PubMed]
- Karkouti, K.; Wijeysundera, D.N.; Yau, T.M.; Callum, J.L.; Cheng, D.C.; Crowther, M.; Dupuis, J.Y.; Fremes, S.E.; Kent, B.; Laflamme, C.; et al. Acute kidney injury after cardiac surgery: Focus on modifiable risk factors. Circulation 2009, 119, 495–502. [Google Scholar] [CrossRef] [PubMed]
- Lee, E.H.; Kim, W.J.; Kim, J.Y.; Chin, J.H.; Choi, D.K.; Sim, J.Y.; Choo, S.J.; Chung, C.H.; Lee, J.W.; Choi, I.C. Effect of Exogenous Albumin on the Incidence of Postoperative Acute Kidney Injury in Patients Undergoing Off-pump Coronary Artery Bypass Surgery with a Preoperative Albumin Level of Less Than 4.0 g/dl. Anesthesiology 2016, 124, 1001–1011. [Google Scholar] [CrossRef] [PubMed]
- Yoo, Y.C.; Shim, J.K.; Kim, J.C.; Jo, Y.Y.; Lee, J.H.; Kwak, Y.L. Effect of single recombinant human erythropoietin injection on transfusion requirements in preoperatively anemic patients undergoing valvular heart surgery. Anesthesiology 2011, 115, 929–937. [Google Scholar] [CrossRef] [PubMed]


| Variables | All | Training Set | Test Set | p-Value |
|---|---|---|---|---|
| Patient population, n | 2010 | 1005 | 1005 | |
| Demographic data | ||||
| Age (years) | 64 (56–71) | 64 (56–71) | 64 (55–71) | 0.884 |
| Female (n) | 553 (27.5) | 279 (27.8) | 274 (27.3) | 0.803 |
| Body-mass index (kg/m2) | 23.8 (21.6–25.9) | 23.9 (21.7–25.9) | 23.7 (21.5–25.9) | 0.563 |
| Surgery type | ||||
| Coronary artery bypass (n) | 911 (45.3) | 473 (47.1) | 438 (43.6) | 0.117 |
| Valvular heart surgery (n) | 1052 (52.3) | 503 (50.0) | 549 (54.6) | 0.060 |
| Thoracic aortic surgery (n) | 47 (2.3) | 29 (2.9) | 18 (1.8) | 0.104 |
| Emergency (n) | 51 (2.5) | 26 (2.6) | 25 (2.5) | 0.887 |
| Previous cardiac surgery (n) | 149 (7.4) | 75 (7.5) | 74 (7.4) | 0.932 |
| Medical history | ||||
| Hypertension (n) | 1057 (52.6) | 538 (53.5) | 519 (51.6) | 0.396 |
| Diabetes mellitus (n) | 588 (29.3) | 302 (30.0) | 286 (28.5) | 0.433 |
| Three vessel disease (n) | 602 (30.0) | 306 (30.4) | 296 (29.5) | 0.626 |
| Previous coronary stent insertion (n) | 235 (11.7) | 118 (11.7) | 117 (11.6) | 0.945 |
| Cerebrovascular accident (n) | 228 (11.3) | 101 (10.0) | 127 (12.6) | 0.078 |
| COPD (n) | 100 (5.0) | 49 (4.9) | 51 (5.1) | 0.837 |
| Pulmonary hypertension (n) | 129 (6.4) | 60 (6.0) | 69 (6.9) | 0.413 |
| Chronic kidney disease (n) | 121 (6.0) | 57 (5.7) | 64 (6.4) | 0.512 |
| Preoperative Medication | ||||
| ACEi (n) | 114 (5.7) | 58 (5.8) | 56 (5.6) | 0.847 |
| ARB (n) | 249 (12.4) | 122 (12.1) | 127 (12.6) | 0.735 |
| β-blocker (n) | 289 (19.4) | 199 (19.8) | 190 (18.9) | 0.611 |
| Diuretics (n) | 297 (14.8) | 133 (13.2) | 164 (16.3) | 0.059 |
| Calcium channel blocker (n) | 287 (14.3) | 151 (15.0) | 136 (13.5) | 0.339 |
| Statins (n) | 506 (25.2) | 255 (25.4) | 251 (25.0) | 0.837 |
| Aspirin (n) | 957 (47.6) | 498 (49.6) | 459 (45.7) | 0.090 |
| Baseline laboratory findings | ||||
| Preoperative LVEF (%) | 58 (52–63) | 58 (53–63) | 57 (52–63) | 0.427 |
| Hematocrit (%) | 38 (34–42) | 38 (34–42) | 38 (34–42) | 0.844 |
| Serum creatinine (mg/dL) | 0.94 (0.80–1.12) | 0.93 (0.80–1.10) | 0.94 (0.80–1.13) | 0.613 |
| Serum Albumin (g/dL) | 4.1 (3.8–4.3) | 4.1 (3.9–4.3) | 4.1 (3.8–4.3) | 0.183 |
| Serum uric acid (mg/dL) | 4.6 (3.7–5.6) | 4.6 (3.7–5.7) | 4.5 (3.6–5.5) | 0.190 |
| Blood glucose (mg/dL) | 115 (96–146) | 116 (96–146) | 113 (96–147) | 0.500 |
| Surgery and anaesthesia details | ||||
| Operation time (h) | 6.25 (5.33–7.25) | 6.25 (5.41–7.27) | 6.25 (5.33–7.24) | 0.654 |
| Anesthesia time (h) | 7.50 (6.25–8.50) | 7.50 (6.50–8.50) | 7.50 (6.50–8.42) | 0.608 |
| Total intravenous anesthesia (n) | 1858 (92.4) | 937 (93.2) | 921 (91.6) | 0.206 |
| Inhalational anesthesia (n) | 152 (7.6) | 68 (6.8) | 84 (8.4) | 0.206 |
| Intraoperative crystalloid infusion (L) | 2150 (1150–3000) | 2200 (1100–3100) | 2150 (1200–2950) | 0.656 |
| Intraoperative colloid use (mL) | 900 (350–1500) | 1000 (350–1550) | 800 (350–1500) | 0.067 |
| pRBC transfusion during surgery (units) | 2 (0–3) | 2 (0–3) | 2 (0–3) | 0.725 |
| FFP transfusion during surgery (units) | 0 (0–3) | 0 (0–3) | 0 (0–3) | 0.589 |
| Intraoperative mean arterial pressure (mmHg) | 72 (67–78) | 72 (67–78) | 72 (67–78) | 0.974 |
| Intraoperative mean cardiac index (L/min) | 2.3 (2.1–2.7) | 2.3 (2.1–2.7) | 2.3 (2.1–2.7) | 0.257 |
| Intraoperative mean SvO2 (%) | 73 (69–76) | 73 (69–76) | 73 (68–76) | 0.207 |
| Intraoperative diuretics use (n) | 204 (10.1) | 91 (9.1) | 113 (11.2) | 0.107 |
| Postoperative renal function | ||||
| AKI according to KDIGO criteria (n) | 0.596 | |||
| Stage 1 | 591 (29.4) | 282 (28.1) | 309 (30.7) | |
| Stage 2 | 114 (5.7) | 60 (6.0) | 54 (5.4) | |
| Stage 3 | 65 (3.2) | 33 (3.3) | 32 (3.2) | |
| Hemodialysis dependent (n) | 125 (6.2) | 60 (6.0) | 65 (6.5) | 0.644 |
| GFR at postoperative day one (ml/min/1.73m2) | 79 (58–94) | 79 (57–95) | 78 (58–94) | 0.864 |
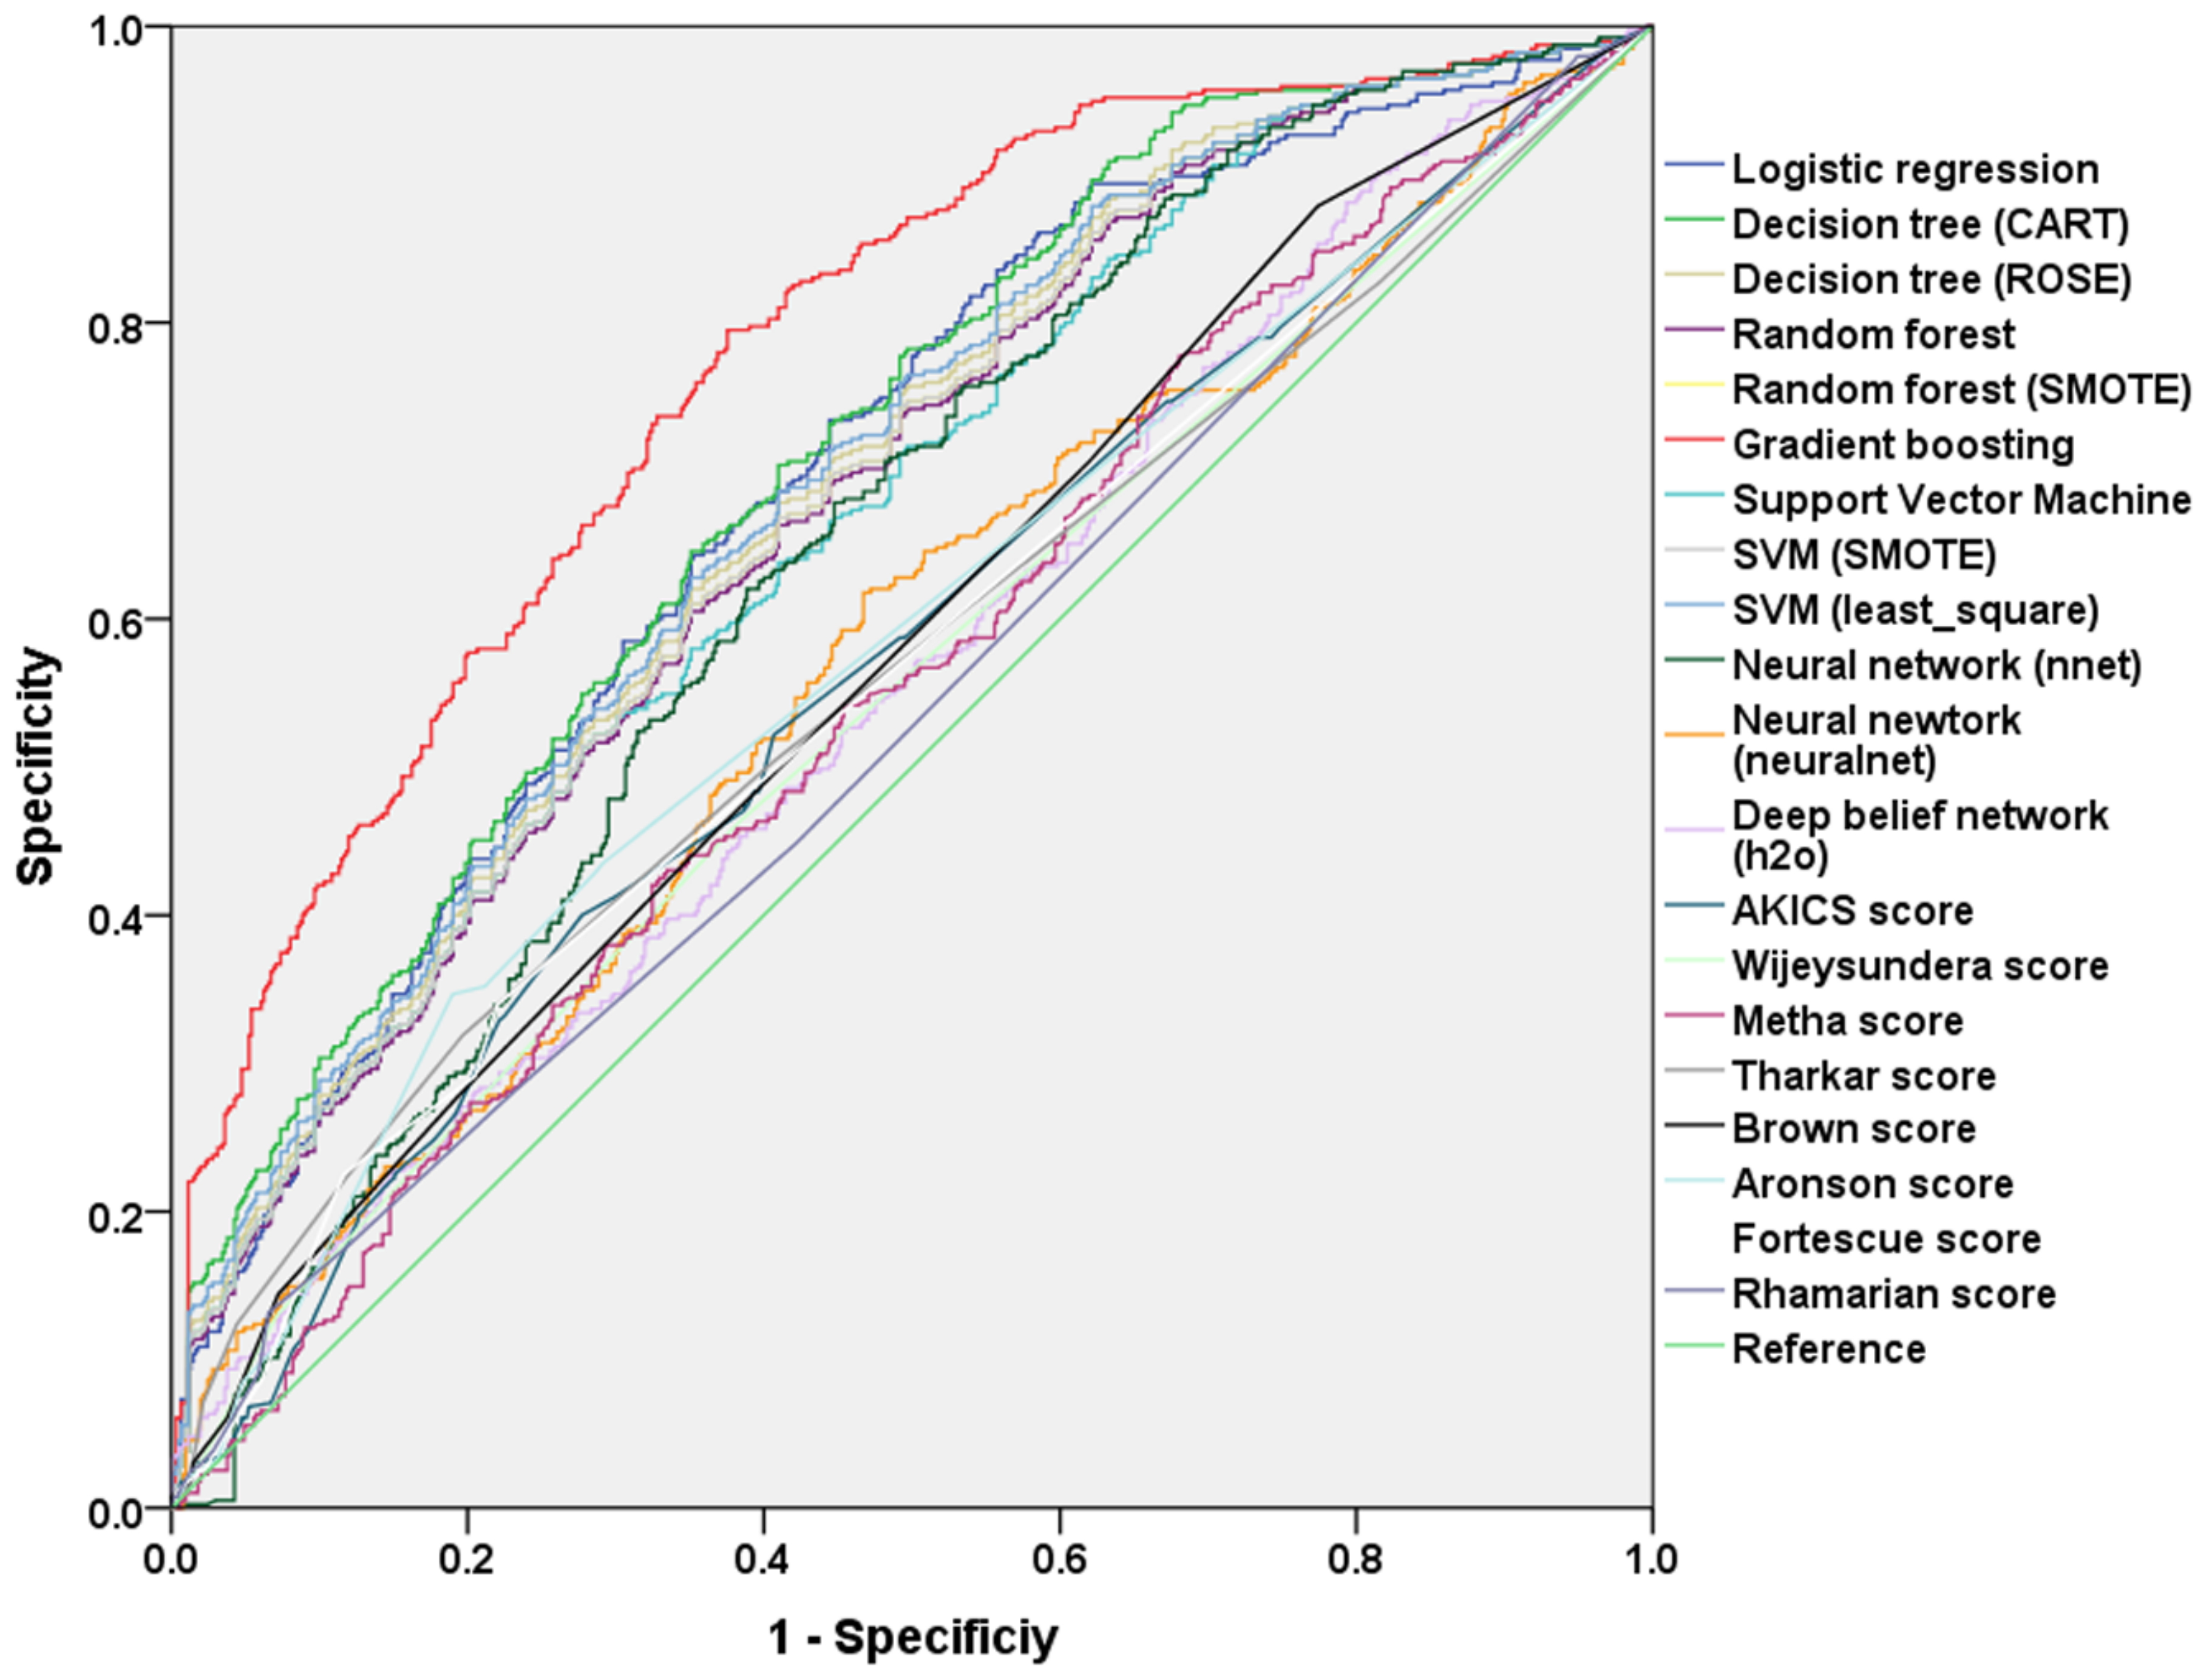
| Model | Software or R Packages | Error Rate of Test Data Set | AUC in the Test Set |
|---|---|---|---|
| Machine learning techniques | |||
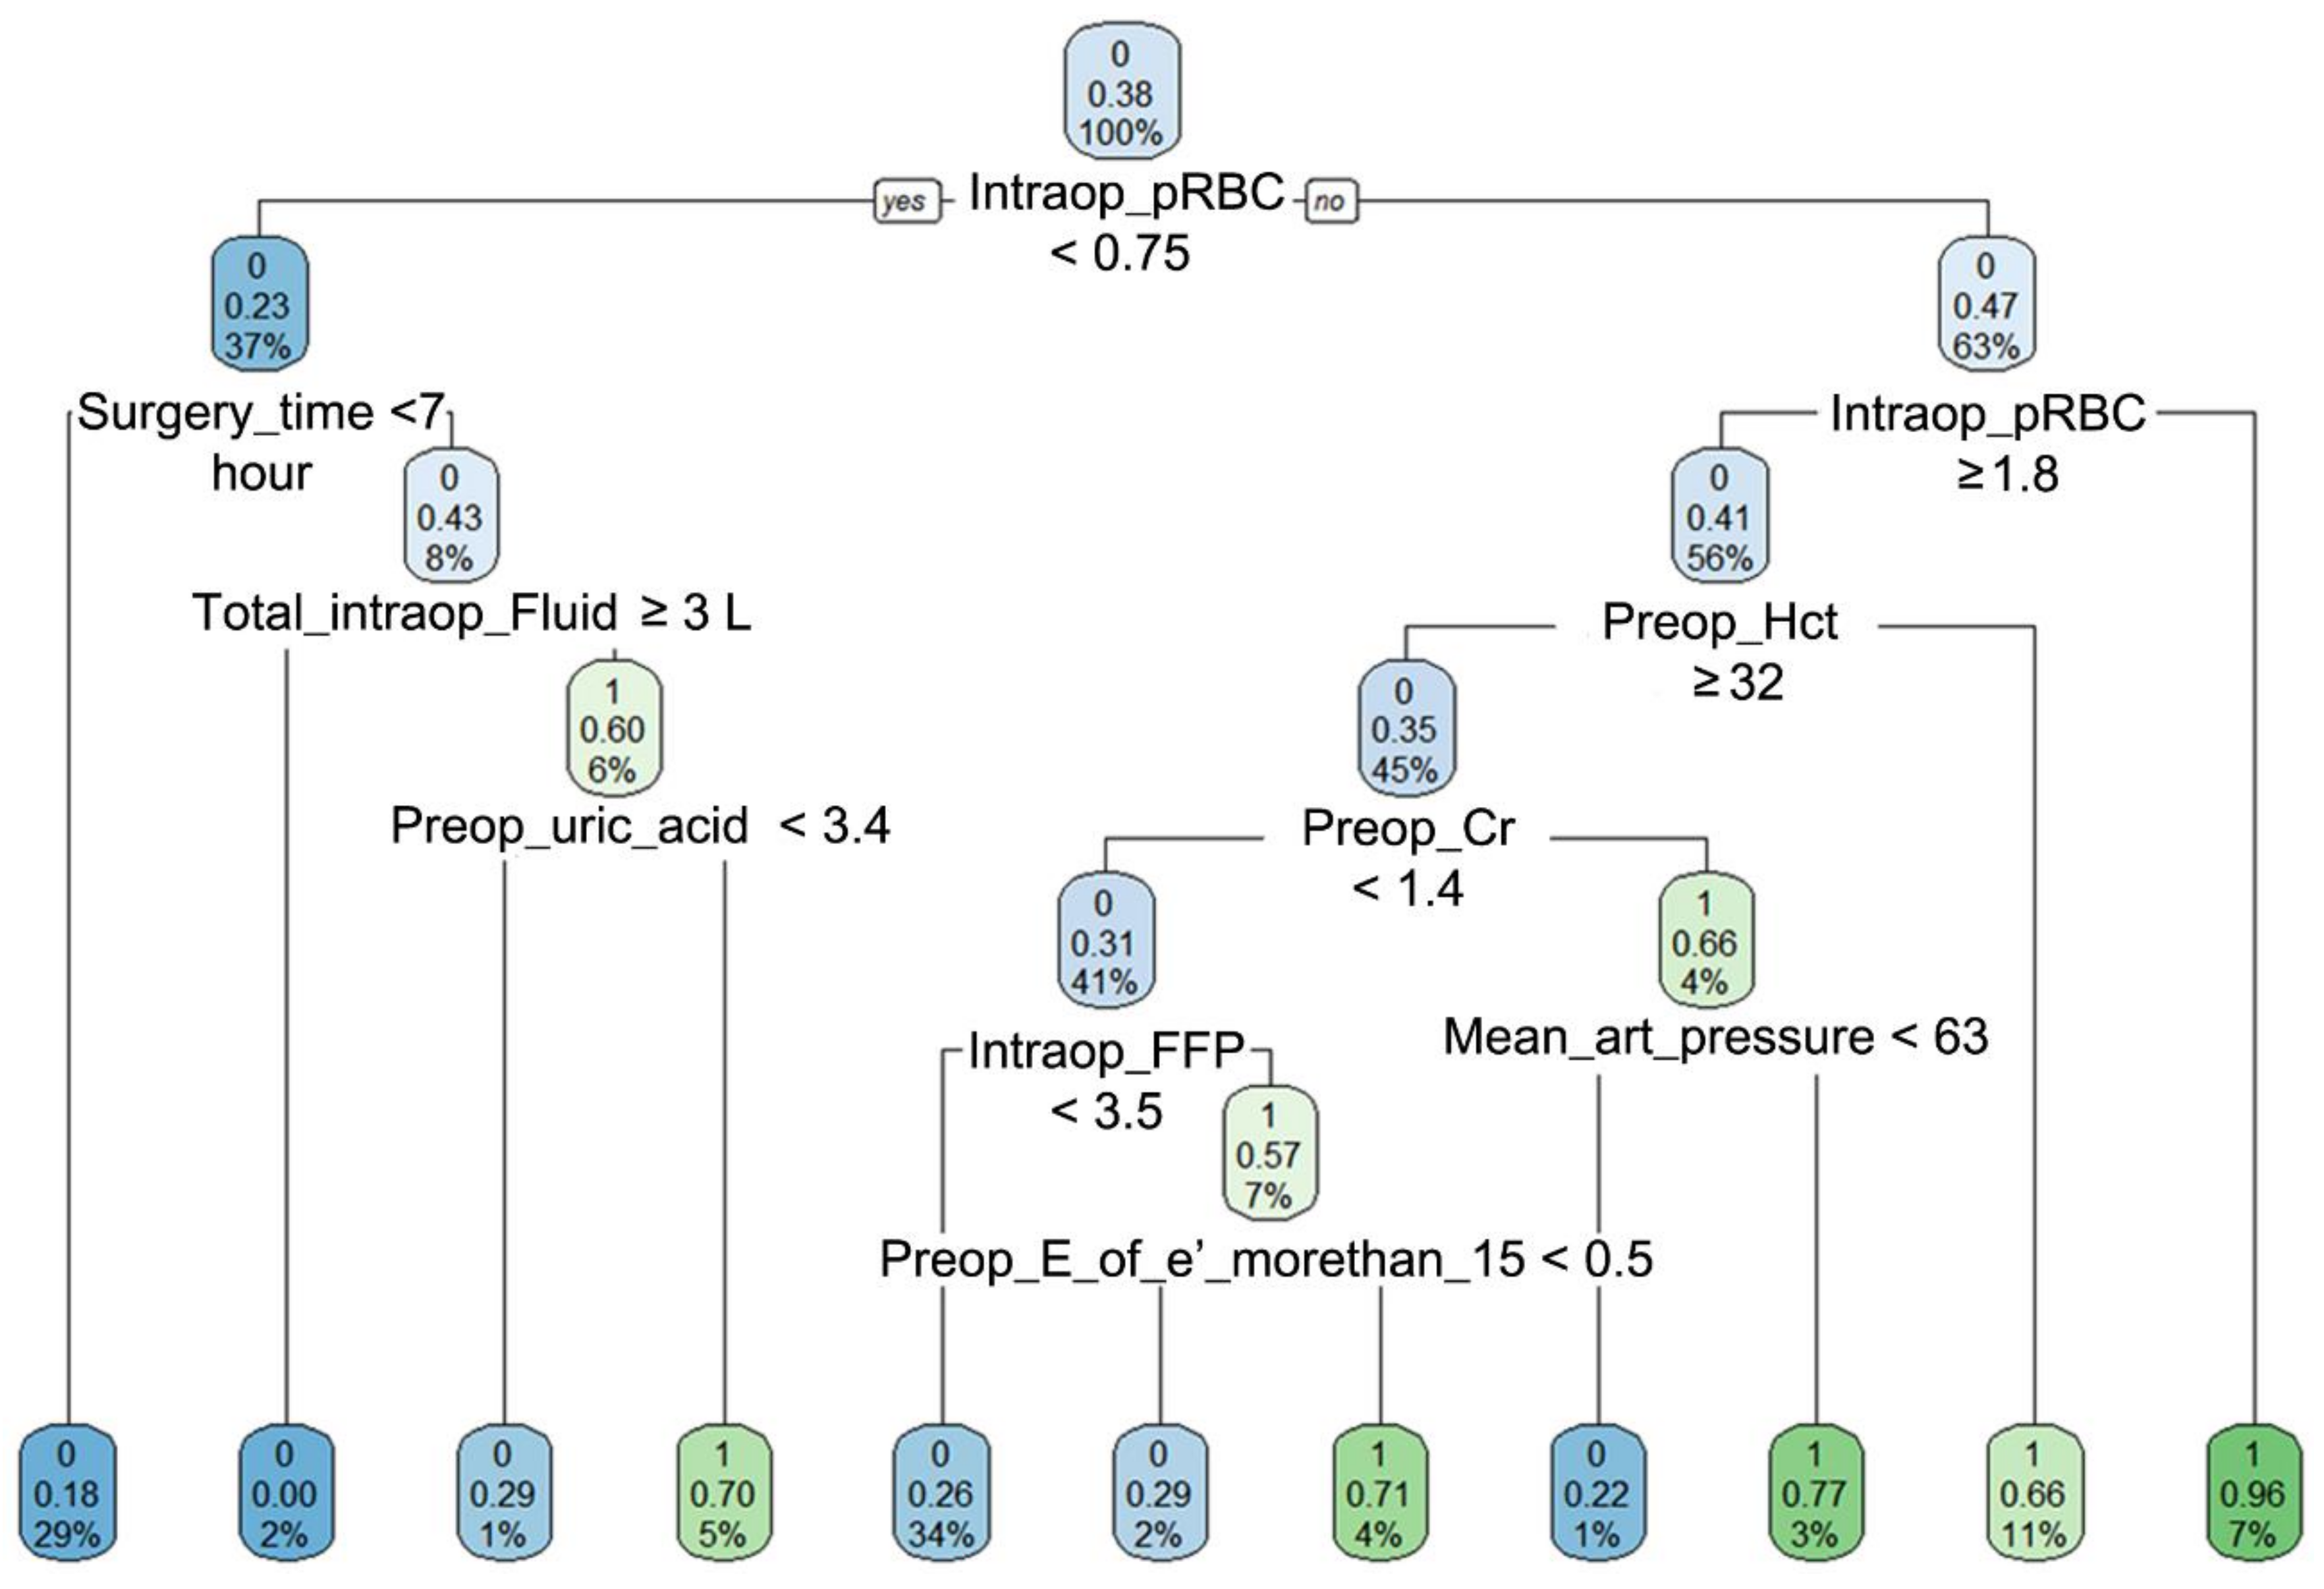
| Decision tree, CART | tree, rpart | 28.9% | 0.71 (0.67–0.74) |
| ROSE decision tree | ROSE | 30.6% | 0.66 (0.65–0.72) |
| Random forest model | randomForest | 30.4% | 0.68 (0.64–0.71) |
| Random forest SMOTE model | DMwR | 33.5% | 0.68 (0.65–0.71) |
| Gradient boosting classification | XGBoost | 26.0% | 0.78 (0.75–0.80) * |
| Support vector machine, classifier | e1071 | 31.4% | 0.67 (0.63–0.70) |
| Support vector machine, SMOTE model | UBL | 33.3% | 0.68 (0.65–0.71) |
| Support vector machine, least square | Kernlab | 30.2% | 0.69 (0.66–0.72) |
| Neural network classifier | nnet | 38.4% | 0.64 (0.61–0.68) |
| Neural network classifier | neuralnet | 43.9% | 0.57 (0.53–0.61) |
| Deep belief network | h2o | 47.2% | 0.55 (0.51–0.59) |
| Risk scores from logistic regression analysis | |||
| Logistic regression model, stepwise variable selection | R | 33.6% | 0.69 (0.66–0.72) |
| Logistic regression model, without variable selection | R | 32.8% | 0.70 (0.68–0.73) |
| AKICS score | R | 43.4% | 0.57 (0.53–0.60) |
| Wijeysundera and colleagues | R | 45.2% | 0.55 (0.51–0.59) |
| Metha and colleagues | R | 45.8% | 0.55 (0.52–0.59) |
| Thakar and colleagues | R | 45.3% | 0.56 (0.53–0.60) |
| Brown and colleagues | R | 43.1% | 0.58 (0.54–0.61) |
| Aronson and colleagues | R | 43.3% | 0.58 (0.51–0.62) |
| Fortescue and colleagues | R | 44.2% | 0.56 (0.52–0.60) |
| Rhamanian and colleagues | R | 47.0% | 0.55 (0.52–0.58) |
| Variable | Beta-Coefficient | Odds Ratio | 95% CI | p-Value |
|---|---|---|---|---|
| Age per 10 year | 0.128 | 1.14 | 1.04–1.61 | 0.004 |
| History of hypertension | 0.320 | 1.38 | 1.12–1.69 | 0.002 |
| Baseline chronic kidney disease | 0.907 | 2.48 | 1.62–3.78 | <0.001 |
| Preoperative E/e´ > 15 | 0.454 | 1.58 | 1.27–1.96 | <0.001 |
| Preoperative hematocrit, % | −0.062 | 0.94 | 0.92–0.96 | <0.001 |
| Surgery time, per 1 h | 0.073 | 1.08 | 1.01–1.15 | 0.036 |
| Intraoperative red blood cell transfusion, unit | 0.056 | 1.06 | 1.01–1.11 | 0.022 |
| Intraoperative fresh frozen plasma transfusion, unit | 0.085 | 1.09 | 1.03–1.15 | 0.001 |
| Intraoperative diuretics use | 0.630 | 1.88 | 1.36–2.60 | <0.001 |
© 2018 by the authors. Licensee MDPI, Basel, Switzerland. This article is an open access article distributed under the terms and conditions of the Creative Commons Attribution (CC BY) license (http://creativecommons.org/licenses/by/4.0/).
Share and Cite
Lee, H.-C.; Yoon, H.-K.; Nam, K.; Cho, Y.J.; Kim, T.K.; Kim, W.H.; Bahk, J.-H. Derivation and Validation of Machine Learning Approaches to Predict Acute Kidney Injury after Cardiac Surgery. J. Clin. Med. 2018, 7, 322. https://0-doi-org.brum.beds.ac.uk/10.3390/jcm7100322
Lee H-C, Yoon H-K, Nam K, Cho YJ, Kim TK, Kim WH, Bahk J-H. Derivation and Validation of Machine Learning Approaches to Predict Acute Kidney Injury after Cardiac Surgery. Journal of Clinical Medicine. 2018; 7(10):322. https://0-doi-org.brum.beds.ac.uk/10.3390/jcm7100322
Chicago/Turabian StyleLee, Hyung-Chul, Hyun-Kyu Yoon, Karam Nam, Youn Joung Cho, Tae Kyong Kim, Won Ho Kim, and Jae-Hyon Bahk. 2018. "Derivation and Validation of Machine Learning Approaches to Predict Acute Kidney Injury after Cardiac Surgery" Journal of Clinical Medicine 7, no. 10: 322. https://0-doi-org.brum.beds.ac.uk/10.3390/jcm7100322