First Evaluation of an Index of Low Vagally-Mediated Heart Rate Variability as a Marker of Health Risks in Human Adults: Proof of Concept

 , , ,
, , ,
Abstract
:1. Introduction
2. Material and Methods
2.1. Study Population
2.2. Exclusion Criteria
2.3. Measures
2.3.1. Blood withdrawal
2.3.2. Blood Pressure
2.3.3. Heart Rate Monitoring
2.4. Statistical Methods
3. Results
Multiple Adjusted Logistic Regression Models
4. Discussion
Limitations
5. Conclusions
Supplementary Materials
| Item Number | Filename | Description |
| Figure S1 | chol_predicted_day.png | Daytime |
| Figure S2 | chol_predicted_night.png | Nighttime |
| Figure S3 | crps_predicted_day.png | Daytime |
| Figure S4 | crps_predicted_night.png | Nighttime |
| Figure S5 | glucn_predicted_day.png | Daytime |
| Figure S6 | glucn_predicted_night.png | Nighttime |
| Figure S7 | hba1c_predicted_day.png | Daytime |
| Figure S8 | hba1c_predicted_night.png | Nighttime |
| Figure S9 | hdl_predicted_day.png | Daytime |
| Figure S10 | hdl_predicted_night.png | Nighttime |
| Figure S11 | ldllg_predicted_day.png | Daytime |
| Figure S12 | ldllg_predicted_night.png | Nighttime |
| Figure S13 | leuk_predicted_day.png | Daytime |
| Figure S14 | leuk_predicted_night.png | Nighttime |
| Figure S15 | rrdiam_predicted_day.png | Daytime |
| Figure S16 | rrdiam_predicted_night.png | Nighttime |
| Figure S17 | rrsysm_predicted_day.png | Daytime |
| Figure S18 | rrsysm_predicted_night.png | Nighttime |
| Figure S19 | trig_predicted_day.png | Daytime |
| Figure S20 | trig_predicted_night.png | Nighttime |
| Item Number | Filename | Description |
| Figure S21 | chol_actual_day.png | Daytime |
| Figure S22 | chol_actual_night.png | Nighttime |
| Figure S23 | crps_actual_day.png | Daytime |
| Figure S24 | crps_actual_night.png | Nighttime |
| Figure S25 | glucn_actual_day.png | Daytime |
| Figure S26 | glucn_actual_night.png | Nighttime |
| Figure S27 | hba1c_actual_day.png | Daytime |
| Figure S28 | hba1c_actual_night.png | Nighttime |
| Figure S29 | hdl_actual_day.png | Daytime |
| Figure S30 | hdl_actual_night.png | Nighttime |
| Figure S31 | ldllg_actual_day.png | Daytime |
| Figure S32 | ldllg_actual_night.png | Nighttime |
| Figure S33 | leuk_actual_day.png | Daytime |
| Figure S34 | leuk_actual_night.png | Nighttime |
| Figure S35 | rrdiam_actual_day.png | Daytime |
| Figure S36 | rrdiam_actual_night.png | Nighttime |
| Figure S37 | rrsysm_actual_day.png | Daytime |
| Figure S38 | rrsysm_actual_night.png | Nighttime |
| Figure S39 | trig_actual_day.png | Daytime |
| Figure S40 | trig_actual_night.png | Nighttime |
| Item Number | Filename |
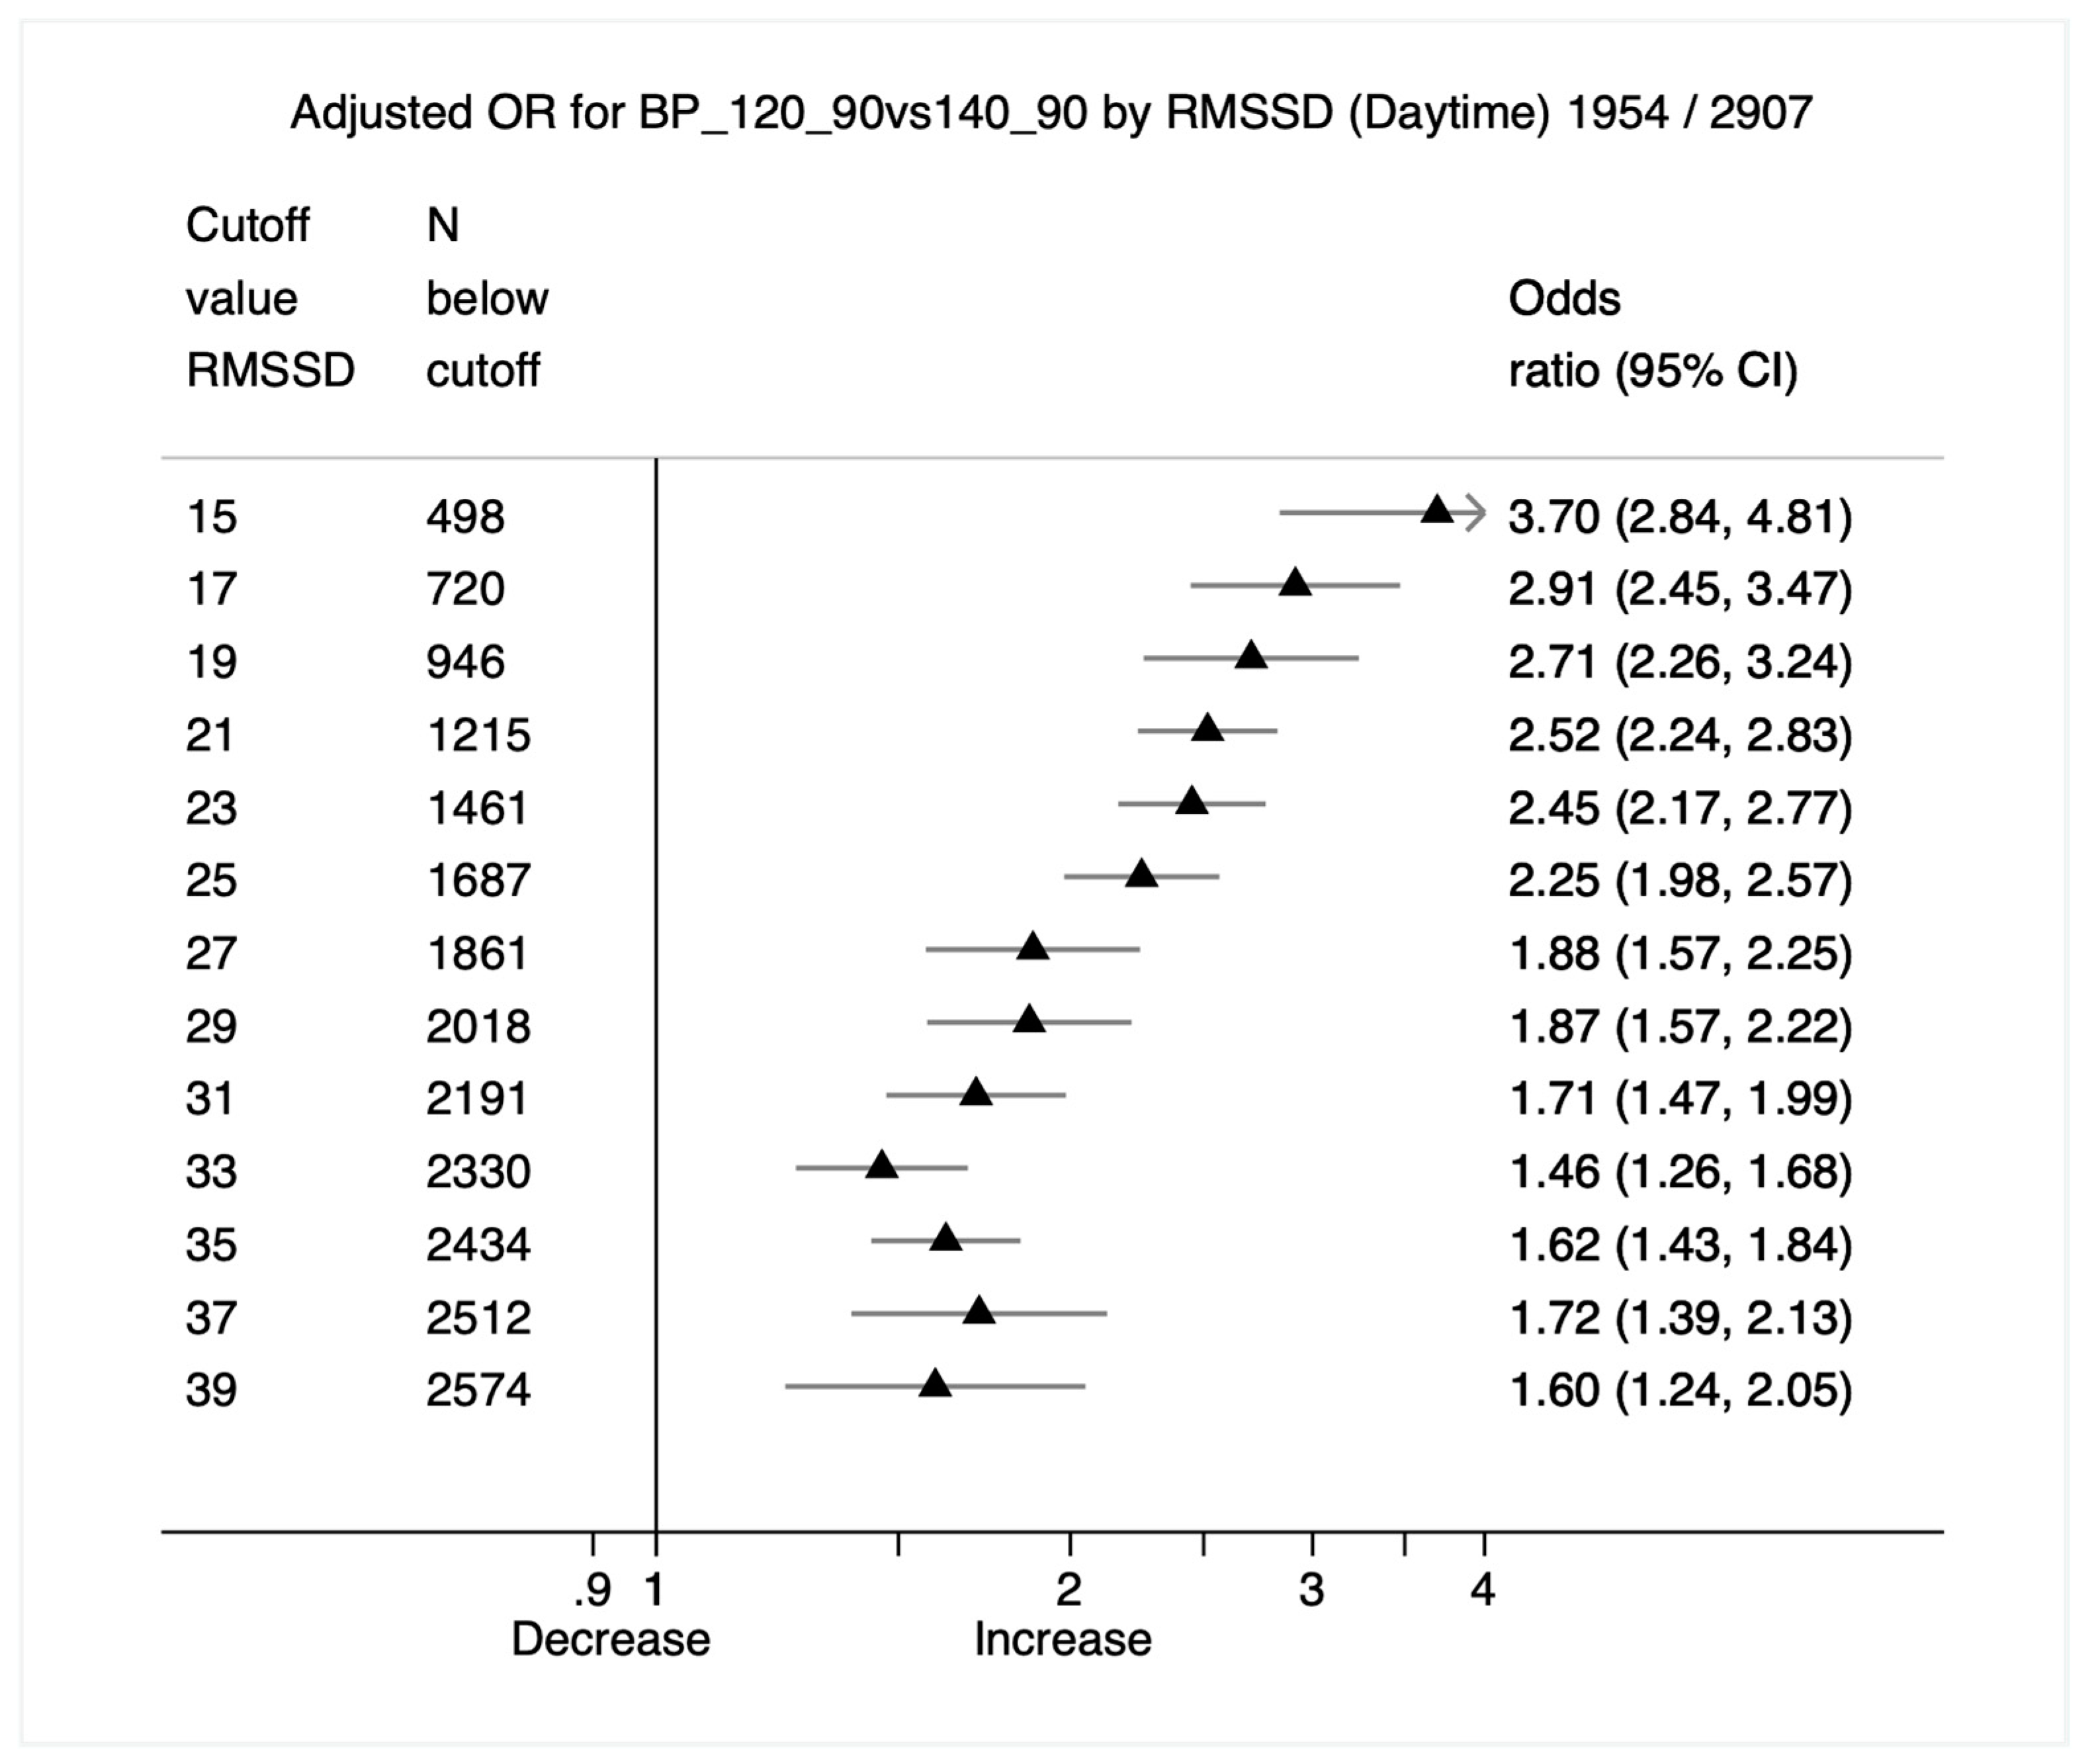
| Figure 1 | HvsC_day_BP_120_90vs140_90.png |
| Figure S41 | HvsC_day_CHOL_170plus_agedep.png |
| Figure S42 | HvsC_day_CRPS_1vs3.png |
| Figure S43 | HvsC_day_GLUC_100vs126.png |
| Figure S44 | HvsC_day_HBA1C_6vs6point5.png |
| Figure S45 | HvsC_day_HDL_55_65vs45_35.png |
| Figure S46 | HvsC_day_LDL_160plus.png |
| Figure S47 | HvsC_day_LEUK_33pc_vs66pc.png |
| Figure S48 | HvsC_day_TRIG_200plus.png |
| Figure S49 | HvsC_night_BP_120_90vs140_90.png |
| Figure S50 | HvsC_night_CHOL_170plus_agedep.png |
| Figure S51 | HvsC_night_CRPS_1vs3.png |
| Figure S52 | HvsC_night_GLUC_100vs126.png |
| Figure S53 | HvsC_night_HBA1C_6vs6point5.png |
| Figure S54 | HvsC_night_HDL_55_65vs45_35.png |
| Figure S55 | HvsC_night_LDL_160plus.png |
| Figure S56 | HvsC_night_LEUK_33pc_vs66pc.png |
| Figure S57 | HvsC_night_TRIG_200plus.png |
Author Contributions
Funding
Conflicts of Interest
References
- Kamphuis, M.H.; Geerlings, M.I.; Dekker, J.M.; Giampaoli, S.; Nissinen, A.; Grobbee, D.E.; Kromhout, D. Autonomic dysfunction: A link between depression and cardiovascular mortality? The FINE Study. Eur. J. Prev. Cardiol. 2007, 14, 796–802. [Google Scholar] [CrossRef] [PubMed]
- Dekker, J.M.; Schouten, E.G.; Klootwijk, P.; Pool, J.; Swenne, C.A.; Kromhout, D. Heart rate variability from short electrocardiographic recordings predicts mortality from all causes in middle-aged and elderly men. The Zutphen Study. Am. J. Epidemiol. 1997, 145, 899–908. [Google Scholar] [CrossRef] [PubMed]
- Samsudin, M.I.; Liu, N.; Prabhakar, S.M.; Chong, S.L.; Kit Lye, W.; Koh, Z.X.; Guo, D.; Rajesh, R.; Ho, A.F.W.; Ong, M.E.H. A novel heart rate variability based risk prediction model for septic patients presenting to the emergency department. Medicine 2018, 97, e10866. [Google Scholar] [CrossRef] [PubMed]
- Thayer, J.F.; Yamamoto, S.S.; Brosschot, J.F. The relationship of autonomic imbalance, heart rate variability and cardiovascular disease risk factors. Int. J. Cardiol. 2010, 141, 122–131. [Google Scholar] [CrossRef] [PubMed]
- Stuckey, M.I.; Tulppo, M.P.; Kiviniemi, A.M.; Petrella, R.J. Heart rate variability and the metabolic syndrome: A systematic review of the literature. Diabetes Metab. Res. Rev. 2014, 30, 784–793. [Google Scholar] [CrossRef] [PubMed]
- Sternberg, E.M. Neural regulation of innate immunity: A coordinated nonspecific host response to pathogens. Nat. Rev. Immunol. 2006, 6, 318–328. [Google Scholar] [CrossRef] [PubMed]
- Thayer, J.F.; Lane, R.D. The role of vagal function in the risk for cardiovascular disease and mortality. Biol. Psychol. 2007, 74, 224–242. [Google Scholar] [CrossRef] [PubMed]
- Jarczok, M.N.; Koenig, J.; Mauss, D.; Fischer, J.E.; Thayer, J.F. Lower heart rate variability predicts increased level of C-reactive protein 4 years later in healthy, nonsmoking adults. J. Intern. Med. 2014, 276, 667–671. [Google Scholar] [CrossRef] [PubMed]
- Williams, D.P.; Koenig, J.; Carnevali, L.; Sgoifo, A.; Jarczok, M.N.; Sternberg, E.M.; Thayer, J.F. Heart rate variability and inflammation: A meta-analysis of human studies. Brain. Behav. Immun. 2019, 80, 219–226. [Google Scholar] [CrossRef] [PubMed]
- Jarczok, M.N.; Kleber, M.E.; Koenig, J.; Loerbroks, A.; Herr, R.M.; Hoffmann, K.; Fischer, J.E.; Benyamini, Y.; Thayer, J.F. Investigating the mechanisms of self-rated health: Heart rate variability is more strongly associated than other frequently used biomarkers in a cross sectional occupational sample. PLoS ONE 2015, 10, 1–19. [Google Scholar] [CrossRef] [PubMed]
- Schuster, A.K.; Fischer, J.E.; Thayer, J.F.; Mauss, D.; Jarczok, M.N. Decreased heart rate variability correlates to increased cardiovascular risk. Int. J. Cardiol. 2016, 203, 728–730. [Google Scholar] [CrossRef] [PubMed]
- Wulsin, L.; Herman, J.; Thayer, J.F. Stress, autonomic imbalance, and the prediction of metabolic risk: A model and a proposal for research. Neurosci. Biobehav. Rev. 2018, 86, 12–20. [Google Scholar] [CrossRef] [PubMed]
- Michels, N.; Clays, E.; De Buyzere, M.; Huybrechts, I.; Marild, S.; Vanaelst, B.; De Henauw, S.; Sioen, I. Determinants and reference values of short-term heart rate variability in children. Eur. J. Appl. Physiol. 2013, 113, 1477–1488. [Google Scholar] [CrossRef] [PubMed]
- Seppälä, S.; Laitinen, T.; Tarvainen, M.P.; Tompuri, T.; Veijalainen, A.; Savonen, K.; Lakka, T. Normal values for heart rate variability parameters in children 6-8 years of age: The PANIC Study. Clin. Physiol. Funct. Imaging 2014, 34, 290–296. [Google Scholar] [CrossRef] [PubMed]
- Voss, A.; Heitmann, A.; Schroeder, R.; Peters, A.; Perz, S. Short-term heart rate variability—age dependence in healthy subjects. Physiol. Meas. 2012, 33, 1289–1311. [Google Scholar] [CrossRef] [PubMed]
- Hemingway, H.; Shipley, M.; Brunner, E.; Britton, A.; Malik, M.; Marmot, M. Does autonomic function link social position to coronary risk? The Whitehall II study. Circulation 2005, 111, 3071–3077. [Google Scholar] [CrossRef] [PubMed]
- Jarczok, M.N.; Guendel, H.; McGrath, J.J.; Balint, E.M. Circadian Rhythms of the Autonomic Nervous System: Scientific Implication and Practical Implementation. In Chronobiology - Te Science of Biological Time Structure; Pavol, S., Ed.; IntechOpen: London, UK, 2019; ISBN 978-1-78984-901-1. [Google Scholar]
- Li, X.; Shaffer, M.L.; Rodríguez-Colón, S.M.; He, F.; Bixler, E.O.; Vgontzas, A.N.; Wolbrette, D.L.; Wu, C.; Ball, R.W.; Liao, D. Systemic inflammation and circadian rhythm of cardiac autonomic modulation. Auton. Neurosci. 2011, 162, 72–76. [Google Scholar] [CrossRef] [PubMed]
- Kemp, A.H.; Quintana, D.S. The relationship between mental and physical health: Insights from the study of heart rate variability. Int. J. Psychophysiol. 2013, 89, 288–296. [Google Scholar] [CrossRef] [PubMed]
- Pencina, M.J.; D’Agostino, R.B.; Vasan, R.S. Statistical methods for assessment of added usefulness of new biomarkers. Clin. Chem. Lab. Med. 2010, 48, 1703–1711. [Google Scholar] [CrossRef] [PubMed]
- Pencina, M.J.; D’Agostino, R.B.; Vasan, R.S. Evaluating the added predictive ability of a new marker: From area under the ROC curve to reclassification and beyond. Stat. Med. 2008, 27, 157–172. [Google Scholar] [CrossRef] [PubMed]
- Hlatky, M.A.; Greenland, P.; Arnett, D.K.; Ballantyne, C.M.; Criqui, M.H.; Elkind, M.S.V.; Go, A.S.; Harrell, F.E.; Hong, Y.; Howard, B.V.; et al. American Heart Association Expert Panel on Subclinical Atherosclerotic Diseases and Emerging Risk Factors and the Stroke Council Criteria for evaluation of novel markers of cardiovascular risk: A scientific statement from the American Heart Association. Circulation 2009, 119, 2408–2416. [Google Scholar] [CrossRef] [PubMed]
- Ragland, D.R. Dichotomizing continuous outcome variables: Dependence of the magnitude of association and statistical power on the cutpoint. Epidemiology 1992, 3, 434–440. [Google Scholar] [CrossRef] [PubMed]
- Vasan, R.S. Biomarkers of cardiovascular disease: Molecular basis and practical considerations. Circulation 2006, 113, 2335–2362. [Google Scholar] [CrossRef] [PubMed]
- Abadie, J.M.; Koelsch, A.A. Performance of the Roche second generation hemoglobin A1c immunoassay in the presence of HB-S or HB-C traits. Ann. Clin. Lab. Sci. 2008, 38, 31–36. [Google Scholar] [PubMed]
- Jarczok, M.N.; Li, J.; Mauss, D.; Fischer, J.E.; Thayer, J.F. Heart rate variability is associated with glycemic status after controlling for components of the metabolic syndrome. Int. J. Cardiol. 2013, 167, 855–861. [Google Scholar] [CrossRef] [PubMed]
- Weippert, M.; Kumar, M.; Kreuzfeld, S.; Arndt, D.; Rieger, A.; Stoll, R. Comparison of three mobile devices for measuring R-R intervals and heart rate variability: Polar S810i, Suunto t6 and an ambulatory ECG system. Eur. J. Appl. Physiol. 2010, 109, 779–786. [Google Scholar] [CrossRef] [PubMed]
- Saul, J.P. Beat-To-Beat Variations of Heart Rate Reflect Beat-to-Beat Variations of Heart Rate Reflect Modulation of Cardiac Autonomic Outflow. Physiology 1990, 5, 32–37. [Google Scholar] [CrossRef]
- Shaffer, F.; Ginsberg, J.P. An Overview of Heart Rate Variability Metrics and Norms. Front. Public Health 2017, 5, 258. [Google Scholar] [CrossRef] [PubMed]
- Camm, A.; Malik, M.; Bigger, J.; Breithardt, G.; Cerutti, S.; Cohen, R.; Coumel, P.; Fallen, E.; Kennedy, H.; Kleiger, R. Heart rate variability. Standards of measurement, physiological interpretation, and clinical use. Task Force of the European Society of Cardiology and the North American Society of Pacing and Electrophysiology. Eur. Heart. J. 1996, 17, 354–381. [Google Scholar] [CrossRef]
- Wittling, W.; Wittling, R.A. Herzschlagvariabilität: Frühwarnsystem, Stress- und Fitnessindikator, 1st ed.; Eichsfeld: Heilbad Heiligenstadt, Germany, 2012; ISBN 978-3935782166. [Google Scholar]
- de Geus, E.J.C.; Gianaros, P.J.; Brindle, R.C.; Jennings, J.R.; Berntson, G.G. Should heart rate variability be “corrected” for heart rate? Biological, quantitative, and interpretive considerations. Psychophysiology 2019, 56, 1–26. [Google Scholar] [CrossRef] [PubMed]
- Rogers, W.H. Regression standard errors in clustered samples. Stata Tech. Bull. 1993, 13, 19–23. [Google Scholar]
- Thayer, J.F.; Fischer, J.E. Heart rate variability, overnight urinary norepinephrine and C-reactive protein: Evidence for the cholinergic anti-inflammatory pathway in healthy human adults. J. Intern. Med. 2009, 265, 439–447. [Google Scholar] [CrossRef] [PubMed]
- Jarczok, M.N.; Koenig, J.; Schuster, A.K.; Thayer, J.F.; Fischer, J.E. Nighttime heart rate variability, overnight urinary norepinephrine, and glycemic status in apparently healthy human adults. Int. J. Cardiol. 2013, 168, 3025–3026. [Google Scholar] [CrossRef] [PubMed]
- Pearson, T.A.; Mensah, G.A.; Alexander, R.W.; Anderson, J.L.; Cannon, R.O.; Criqui, M.; Fadl, Y.Y.; Fortmann, S.P.; Hong, Y.; Myers, G.L.; et al. Markers of inflammation and cardiovascular disease: Application to clinical and public health practice: A statement for healthcare professionals from the centers for disease control and prevention and the American Heart Association. Circulation 2003, 107, 499–511. [Google Scholar] [CrossRef] [PubMed]
- Xu, J.; Knowler, W.C.; Devereux, R.B.; Yeh, J.; Umans, J.G.; Begum, M.; Fabsitz, R.R.; Lee, E.T. Albuminuria within the “normal” range and risk of cardiovascular disease and death in American Indians: The Strong Heart Study. Am. J. Kidney Dis. 2007, 49, 208–216. [Google Scholar] [CrossRef] [PubMed]
- Hill, L.K.; Hu, D.D.; Koenig, J.; Sollers, J.J.; Kapuku, G.; Wang, X.; Snieder, H.; Thayer, J.F. Ethnic differences in resting heart rate variability: A systematic review and meta-analysis. Psychosom. Med. 2015, 77, 16–25. [Google Scholar] [CrossRef] [PubMed] [Green Version]


| Variable | Condition | Normal | Preclinic | Clinic | |
|---|---|---|---|---|---|
| Glycemic Status | FPG (mg/dL) | 80–100 | 100–126 | ≥126 | |
| HbA1c (%) | 4–6 | 6–6.5 | ≥6.5 | ||
| Inflammation Status | CRP (mg/L) | <1 | 1–3 | 3–5 | |
| WBC (μL) | <p33 | ≥p33–p66 | ≥p66 | ||
| Lipid Status | LDL (mg/dL) | <160 | ≥160 | ||
| HDL (mg/dL) | females | ≥65 | 45 – 65 | <45 | |
| HDL (mg/dL) | males | ≥55 | 35 – 55 | <35 | |
| TC (mg/dL) | age < 20 | <170 | - | ≥170 | |
| TC (mg/dL) | age 20–29 | <200 | - | ≥200 | |
| TC (mg/dL) | age 30–39 | <220 | - | ≥220 | |
| TC (mg/dL) | age 40+ | <240 | - | ≥240 | |
| TRIG (mg/dL) | <200 | - | ≥200 | ||
| Blood Pressure | Sys BP (mmHg) | In combination with Dia BP | <120 | ≥120–140 | ≥140 |
| Dia BP (mmHg) | In combination with Sys BP | <90 | <90 | ≥90 |
| Cutoff (%) | |||||||
|---|---|---|---|---|---|---|---|
| Variable | n | Mean | SD | Normal | Preclinical | Clinical | |
| Glycemic Status | FPG (mg/dL) | 9550 | 87.1 | 12 | 92.50% | 6.48% | 1.02% |
| HbA1c (%) | 9550 | 5.4 | 0.5 | 74.36% | 24.10% | 1.54% | |
| Inflammation Status | CRP (mg/L) | 9550 | 1.6 | 3.4 | 61.91% | 31.12% | 6.97% |
| WBC (μL) | 9550 | 6.3 | 1.7 | 34.34% | 35.69% | 29.98% | |
| Lipid Status | LDL (mg/dL) | 9550 | 127.9 | 34 | 82.62% | 17.38% | |
| HDL (mg/dL) | 9550 | 56.0 | 14.1 | 43.51% | 51.91% | 4.59% | |
| TC (mg/dL) | 9550 | 209 | 40.2 | 69.49% | 30.51% | ||
| TRIG (mg/dL) | 9550 | 121.2 | 72.6 | 88.31% | 11.69% | ||
| Blood Pressure | Sys BP (mmHg) | 9550 | 136.6 | 13.8 | 10.71% | 75.24% | 14.06% |
| Dia BP (mmHg) | 9550 | 78.6 | 11.3 | ||||
| Demographics | Age | 9550 | 41.7 | 11 | - | - | - |
| Male (n; %) | 9550 | 7745 | 81% | - | - | ||
| HRV | RMSSD Daytime (msec) | 9550 | 27.8 | 12 | - | - | - |
| RMSSD nighttime (msec) | 8425 | 38.9 | 19 | - | - | - | |
© 2019 by the authors. Licensee MDPI, Basel, Switzerland. This article is an open access article distributed under the terms and conditions of the Creative Commons Attribution (CC BY) license (http://creativecommons.org/licenses/by/4.0/).
Share and Cite
Jarczok, M.N.; Koenig, J.; Wittling, A.; Fischer, J.E.; Thayer, J.F. First Evaluation of an Index of Low Vagally-Mediated Heart Rate Variability as a Marker of Health Risks in Human Adults: Proof of Concept. J. Clin. Med. 2019, 8, 1940. https://0-doi-org.brum.beds.ac.uk/10.3390/jcm8111940
Jarczok MN, Koenig J, Wittling A, Fischer JE, Thayer JF. First Evaluation of an Index of Low Vagally-Mediated Heart Rate Variability as a Marker of Health Risks in Human Adults: Proof of Concept. Journal of Clinical Medicine. 2019; 8(11):1940. https://0-doi-org.brum.beds.ac.uk/10.3390/jcm8111940
Chicago/Turabian StyleJarczok, Marc N., Julian Koenig, Arne Wittling, Joachim E. Fischer, and Julian F. Thayer. 2019. "First Evaluation of an Index of Low Vagally-Mediated Heart Rate Variability as a Marker of Health Risks in Human Adults: Proof of Concept" Journal of Clinical Medicine 8, no. 11: 1940. https://0-doi-org.brum.beds.ac.uk/10.3390/jcm8111940