Article

Association between Albumin-Bilirubin Grade and Non-Protein Respiratory Quotient in Patients with Chronic Liver Diseases

Division of Hepatobiliary and Pancreatic disease, Department of Internal Medicine, Hyogo College of Medicine, Nishinomiya, Hyogo 663-8501, Japan
*
Author to whom correspondence should be addressed.
Submission received: 21 August 2019 / Revised: 13 September 2019 / Accepted: 13 September 2019 / Published: 18 September 2019
(This article belongs to the Section Pulmonology)

Abstract

:
We sought to elucidate the relationship between albumin-bilirubin (ALBI) grade and non-protein respiratory quotient (npRQ) calculated by indirect calorimetry in chronic liver disease (CLD) patients (n = 601, median age = 63 years). Factors linked to npRQ < 0.85, which is reported to be an optimal cutoff point for the prognosis in liver cirrhosis (LC) patients, were also investigated using univariate and multivariate analyses. The median npRQ for all cases was 0.86. In total, 253 patients (42.1%) had npRQ < 0.85. The proportions of patients with npRQ < 0.85 in LC and non-LC patients were 51.9% (166/320) in LC patients and 31.0% (87/281) in non-LC patients (p < 0.0001). The median npRQ in ALBI grades 1, 2, and 3 for all cases were: 0.89, 0.85, and 0.82 (overall p < 0.0001). The proportions of patients with npRQ < 0.85 were 31.0% (71/229) in ALBI grade 1, 46.34% (152/328) in ALBI grade 2, and 68.18% (30/44) in ALBI grade 3 (overall p < 0.0001). In multivariate analyses of factors linked to npRQ < 0.85, ALBI grade 3 (p = 0.0095, hazard ratio = 3.242, ALBI grade 1 as a reference) was an independent predictor along with prothrombin time (p = 0.0139). In conclusion, ALBI grade can be a useful marker for npRQ in patients with CLDs.

1. Introduction

The liver plays a pivotal role in the nutrition metabolism and the storage of nutrients; it is deeply involved in the maintenance of serum blood glucose, gluconeogenesis from glycogen, amino acids and lactic acid, and the production of ketone bodies from fatty acids [1,2]. Liver cirrhosis (LC), which occurs after a long period of time due to persistent inflammation in the liver, is often complicated with protein-energy malnutrition (PEM) [1,2,3,4,5]. Protein malnutrition can be evaluated by serum albumin level, and energy malnutrition can be evaluated by testing the non-protein respiratory quotient (npRQ) using indirect calorimetry [6]. PEM is one of the representative complications seen in LC patients, and it can be linked to high morbidity and mortality in LC patients [1,2,3,4,5,6,7]. A previous report showed that protein malnutrition as defined by serum albumin < 3.5 g/dL and energy malnutrition as defined by npRQ < 0.85 were found in 61% and 43%, respectively, and PEM was found in 27% of LC patients (n = 294) [8]. RQs reflect which macronutrients are being metabolized; RQ level that approaches 0.7 indicates that lipids are being consumed, and RQ level that approaches 1.00 indicates that carbohydrates are largely being burned [9]. RQ level may exceed 1.00 during intensive exercise [9]. Previous studies reported that npRQ had significant correlation with percentage of arm circumference, percentage of arm muscle circumference, and free fatty acid (FFA) [10,11].
The albumin-bilirubin (ALBI) grade is a simple evaluation method for hepatic function, which is calculated by only serum albumin and total bilirubin, to overcome limitations of Child-Pugh classification in clinical settings [12]. That is, it includes several subjective items (ascites and encephalopathy) and interrelated items (ascites and serum albumin) [12]. After the introduction of the ALBI grading system, the good predictability of the ALBI grading system was confirmed in LC patients, irrespective of liver disease etiologies or the presence of hepatocellular carcinoma (HCC) in numerous clinical studies [13,14,15,16,17,18,19,20,21,22]. However, to our knowledge, the relationship between ALBI grade and npRQ in chronic liver disease (CLD) patients is largely unknown. This issue appears to be of clinical importance because indirect calorimetry is time-consuming and has high cost [23,24]. In the present study, we sought to elucidate this important research problem. Here, we present the current status of energy metabolism in Japanese CLD patients using a large sample.

2. Patients and Methods

2.1. Patients

A total of 601 CLD patients with data for npRQ available were admitted to our hospital between October 2005 and August 2018, and they were analyzed in this study. All analyzed patients had liver histological data (F0–F4), and 594 patients (98.8%) had bioimpedance analysis (BIA) data (skeletal muscle index (SMI) or extracellular water (ECW) to total body water (TBW) ratio). ALBI score was calculated and classified into three grades (ALBI grades 1, 2, and 3) as reported previously [12].

2.2. Measurement of npRQ by Indirect Calorimetry

Carbohydrates, lipids, and proteins taken into the body are metabolized to produce energy. Nutrients that are components in the body are also broken down as needed and eventually metabolized as energy. In the process of this metabolic reaction, oxygen is consumed, and carbon dioxide, water, and heat are produced. When carbohydrates, lipids, and proteins are metabolized, the ratio between the amount of oxygen consumed and the amount of carbon dioxide produced is different, which is called “RQ” [25]. Carbon dioxide production per minute (VCO2) and oxygen consumption per minute (VO2) were tested by indirect calorimetry. Total urinary excretion of nitrogen (UN) was measured as described elsewhere [6,25]. npRQ was calculated using the following formula: npRQ = (1.44VCO2–4.890UN) divided by (1.44VO2–6.04UN) [6,25].

2.3. SMI and ECW to TBW Ratio Using BIA

The definition of SMI was “appendicular skeletal muscle mass (kg) divided by (height (m))2” using BIA. Based on the current Japanese criteria, the definition of decreased SMM was: SMI < 7.0 kg/m2 in men and < 5.7 kg/m2 in women [26]. Based on the concept that excessive ECW leads to edematous state, extracellular fluid (ECF) status was defined as the ECW to TBW ratio. In healthy persons, ECW to TBW ratio can be maintained at a constant value (ECW to TBW ratio around 0.38). ECF excess was classified as follows: normal (ECW to TBW ratio < 0.390), mild overhydrated state (ECW to TBW ratio 0.390–0.399), and moderate to severe overhydrated state (ECW to TBW ratio ≥ 0.400) (Biospace Co. Ltd., Seoul, Korea) [27].
We examined the relationship between npRQ and ALBI grade and factors linked to npRQ < 0.85, which is reported to be an optimal cutoff point for the prognosis in LC patients, using univariate and multivariate analyses [6,23]. The ethics committee of our hospital (Hyogo College of Medicine Hospital) acknowledged the study (approval no. 1831). The protocol in the current study strictly observed the regulations of the Declaration of Helsinki.

2.4. Statistical Considerations

In continuous variables, in order to estimate between-group difference, Student’s t test, Mann–Whitney U test, Spearman’s rank coefficient rs, analysis of variance, or Kruskal–Wallis tests were employed as appropriate. Normality of data distribution to analyze the continuous variables was tested by the Shapiro–Wilk test. In categorical variables, in order to estimate between-group difference, Fisher’s exact tests or Pearson χ2 tests were employed as appropriate. Factors with p < 0.05 linked to npRQ < 0.85 in the univariate analysis were entered into the multivariate logistic regression analysis to select candidate parameters. Unless otherwise stated, data are presented as interquartile range (IQR). The threshold for statistical significance was set at p < 0.05. The JMP 14 (SAS Institute Inc., Cary, NC, USA) was employed to perform statistical analyses.

3. Results

3.1. Patient Baseline Characteristics

Baseline characteristics in our study (n = 601, 301 males and 300 females, median (IQR) age = 63 (54, 71) years) are presented in Table 1. The median (IQR) npRQ was 0.86 (0.81, 0.925). In total, 253 patients (42.1%) had npRQ < 0.85. The proportions of patients with npRQ < 0.85 in LC and non-LC patients were 51.9% (166/320) in LC patients and 31.0% (87/281) in non-LC patients (p < 0.0001). PEM, as defined by serum albumin level <3.5 g/dL and npRQ <0.85, was identified in 103 patients (17.1%: 97 patients (30.3%) in LC patients and 6 patients (2.1%) in non-LC patients). In terms of liver histology (F factor), F0 was found in 12 patients, F1 in 117, F2 in 77, F3 in 75, and F4 in 320. The median (IQR) npRQs in patients with F0-2, F3, and F4 were: 0.90 (0.83, 0.95), 0.87 (0.82, 0.95), and 0.84 (0.80, 0.89) (p values: F0-2 vs. F3, p = 0.2184; F0-2 vs. F4, p = 0.0034; F3 vs. F4, p < 0.0001 (overall p < 0.0001)) (Figure 1A). HCC was found in 166 patients (27.6%). There were 229 patients (38.1%) in ALBI grade 1, 328 (54.6%) in ALBI grade 2, and 44 (7.3%) in ALBI grade 3. Ascites was identified in 54 patients (9.0%). BIA testing is not appropriate for SMI in patients with massive ascites, and thus such patients were not included in this analysis. The median (IQR) npRQs in patients with SMM non-decrease (n = 375) and SMM decrease (n = 219) were 0.86 (0.81, 0.92) and 0.87 (0.82, 0.93) (p = 0.1194) (Figure 1B). The median (IQR) npRQs in patients with normal hydrated state (ECW to TBW ratio < 0.390, n = 398), mild overhydrated state (ECW to TBW ratio > 0.390 and < 0.399, n = 126), and moderate to severe overhydrated state (ECW to TBW ratio > 0.400, n = 70) were 0.87 (0.81, 0.93), 0.85 (0.82, 0.91) and 0.83 (0.7975, 0.88) (p values: normal vs. mild, p = 0.2198; normal vs. moderate to severe, p = 0.0025; mild vs. moderate to severe, p = 0.0576 (overall p = 0.0077)) (Figure 1C).

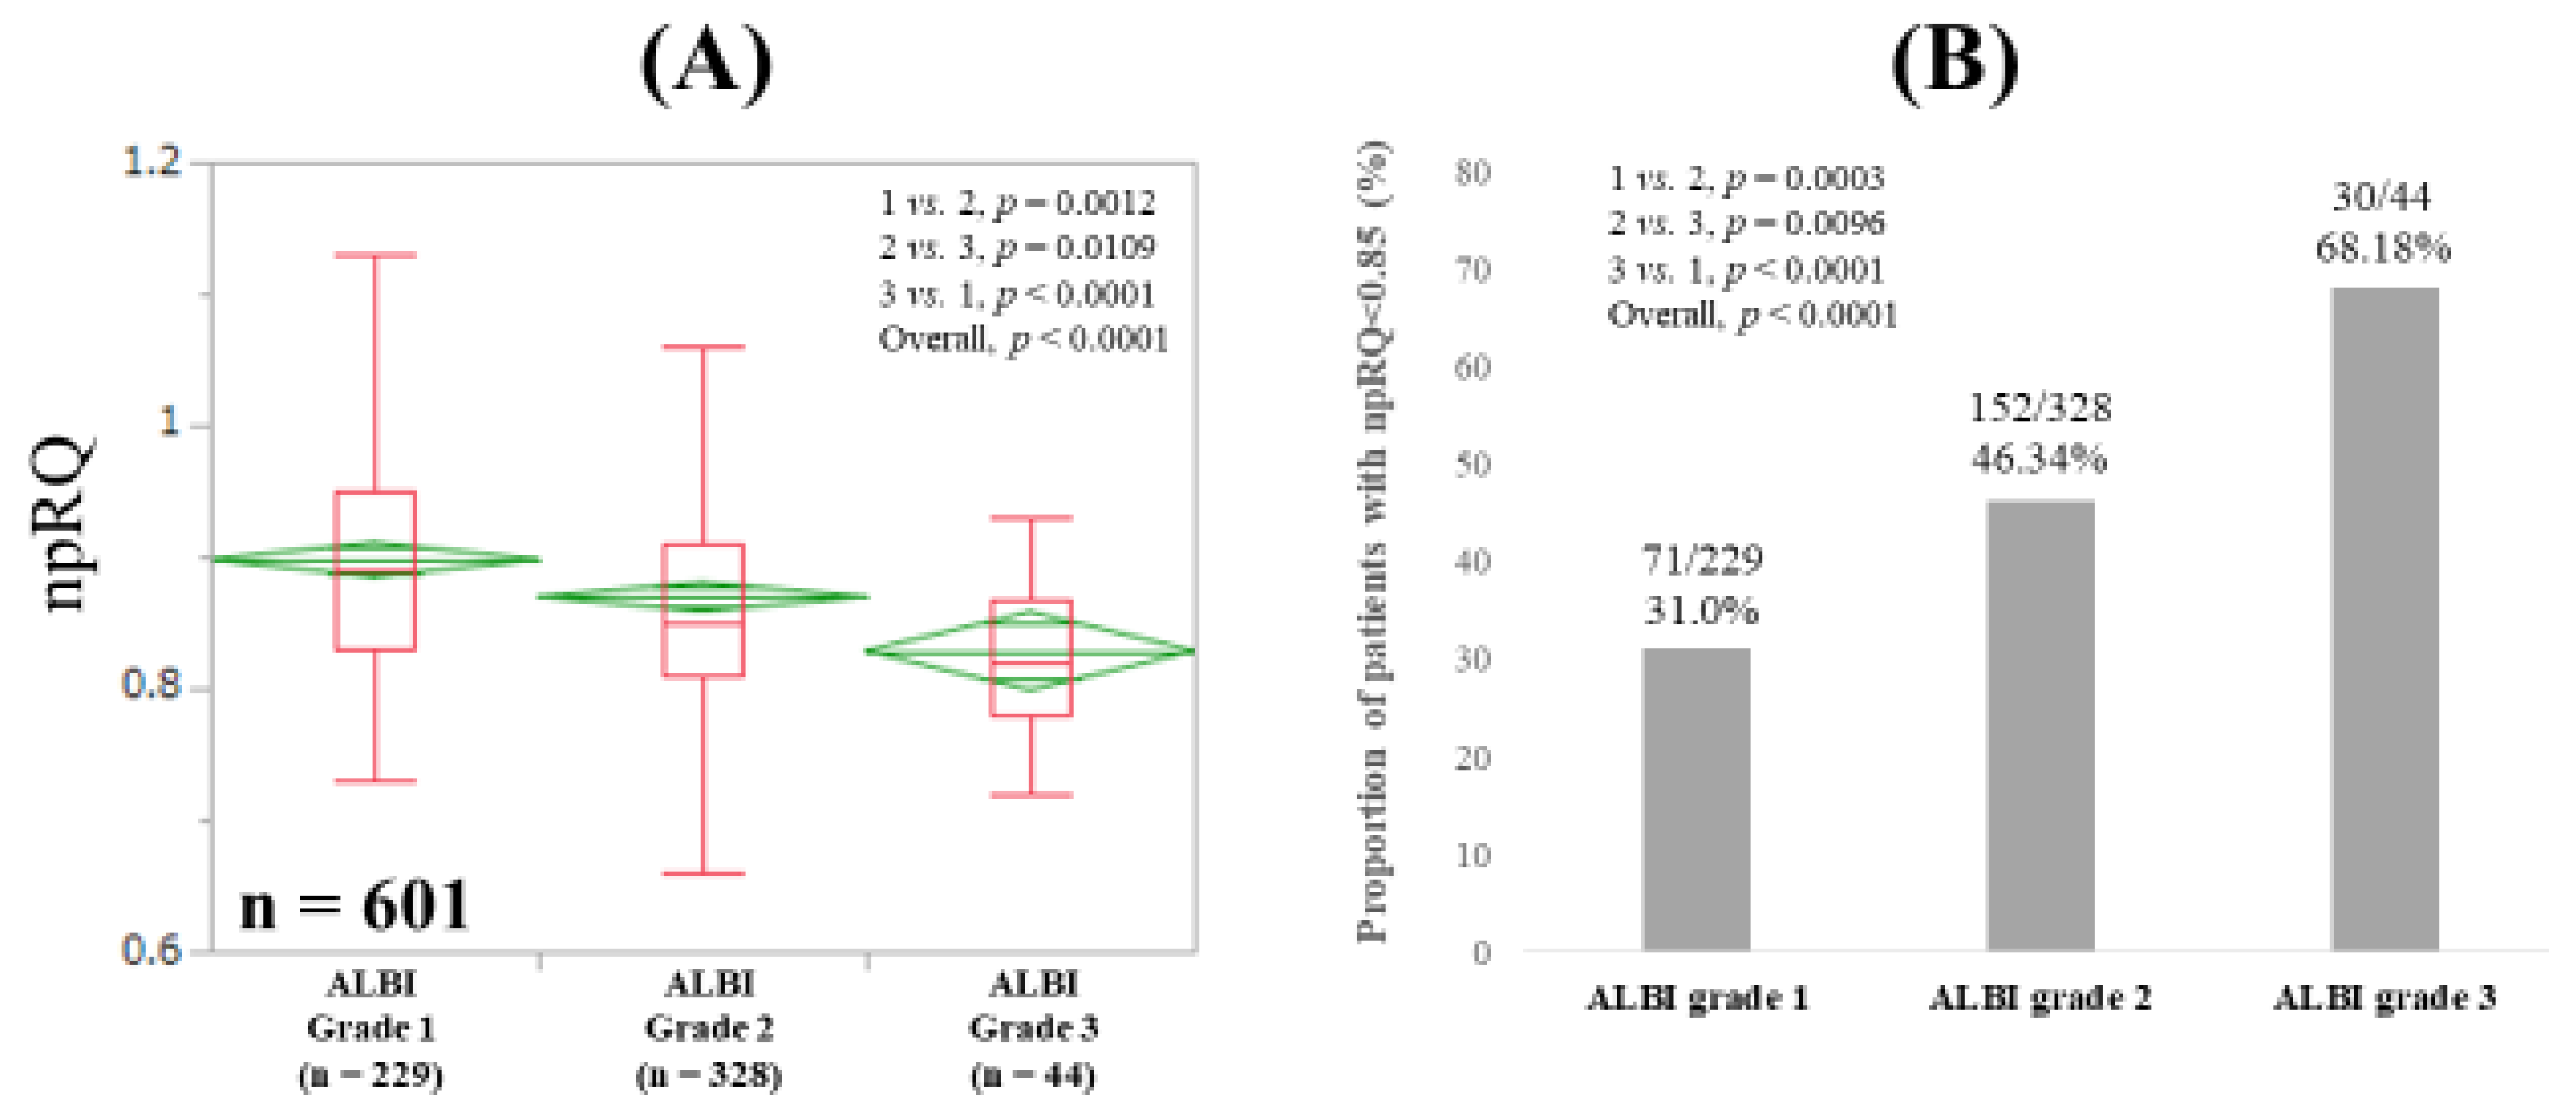
3.2. npRQ Level Among ALBI Grades 1, 2, and 3 for All Cases

The median (IQR) npRQs in ALBI grades 1, 2, and 3 for all cases were: 0.89 (0.83, 0.95), 0.85 (0.81, 0.91), and 0.82 (0.78, 0.8675) (p values: grade 1 vs. 2, p = 0.0012; grade 2 vs. 3, p = 0.0109; grade 3 vs. 1, p < 0.0001 (overall p < 0.0001)) (Figure 2A). While the proportions of patients with npRQ < 0.85 were: 31.0% (71/229) in ALBI grade 1, 46.34% (152/328) in ALBI grade 2, and 68.18% (30/44) in ALBI grade 3 (p values: grade 1 vs. 2, p = 0.0003; grade 2 vs. 3, p = 0.0096; grade 3 vs. 1, p < 0.0001 (overall p < 0.0001)) (Figure 2B).

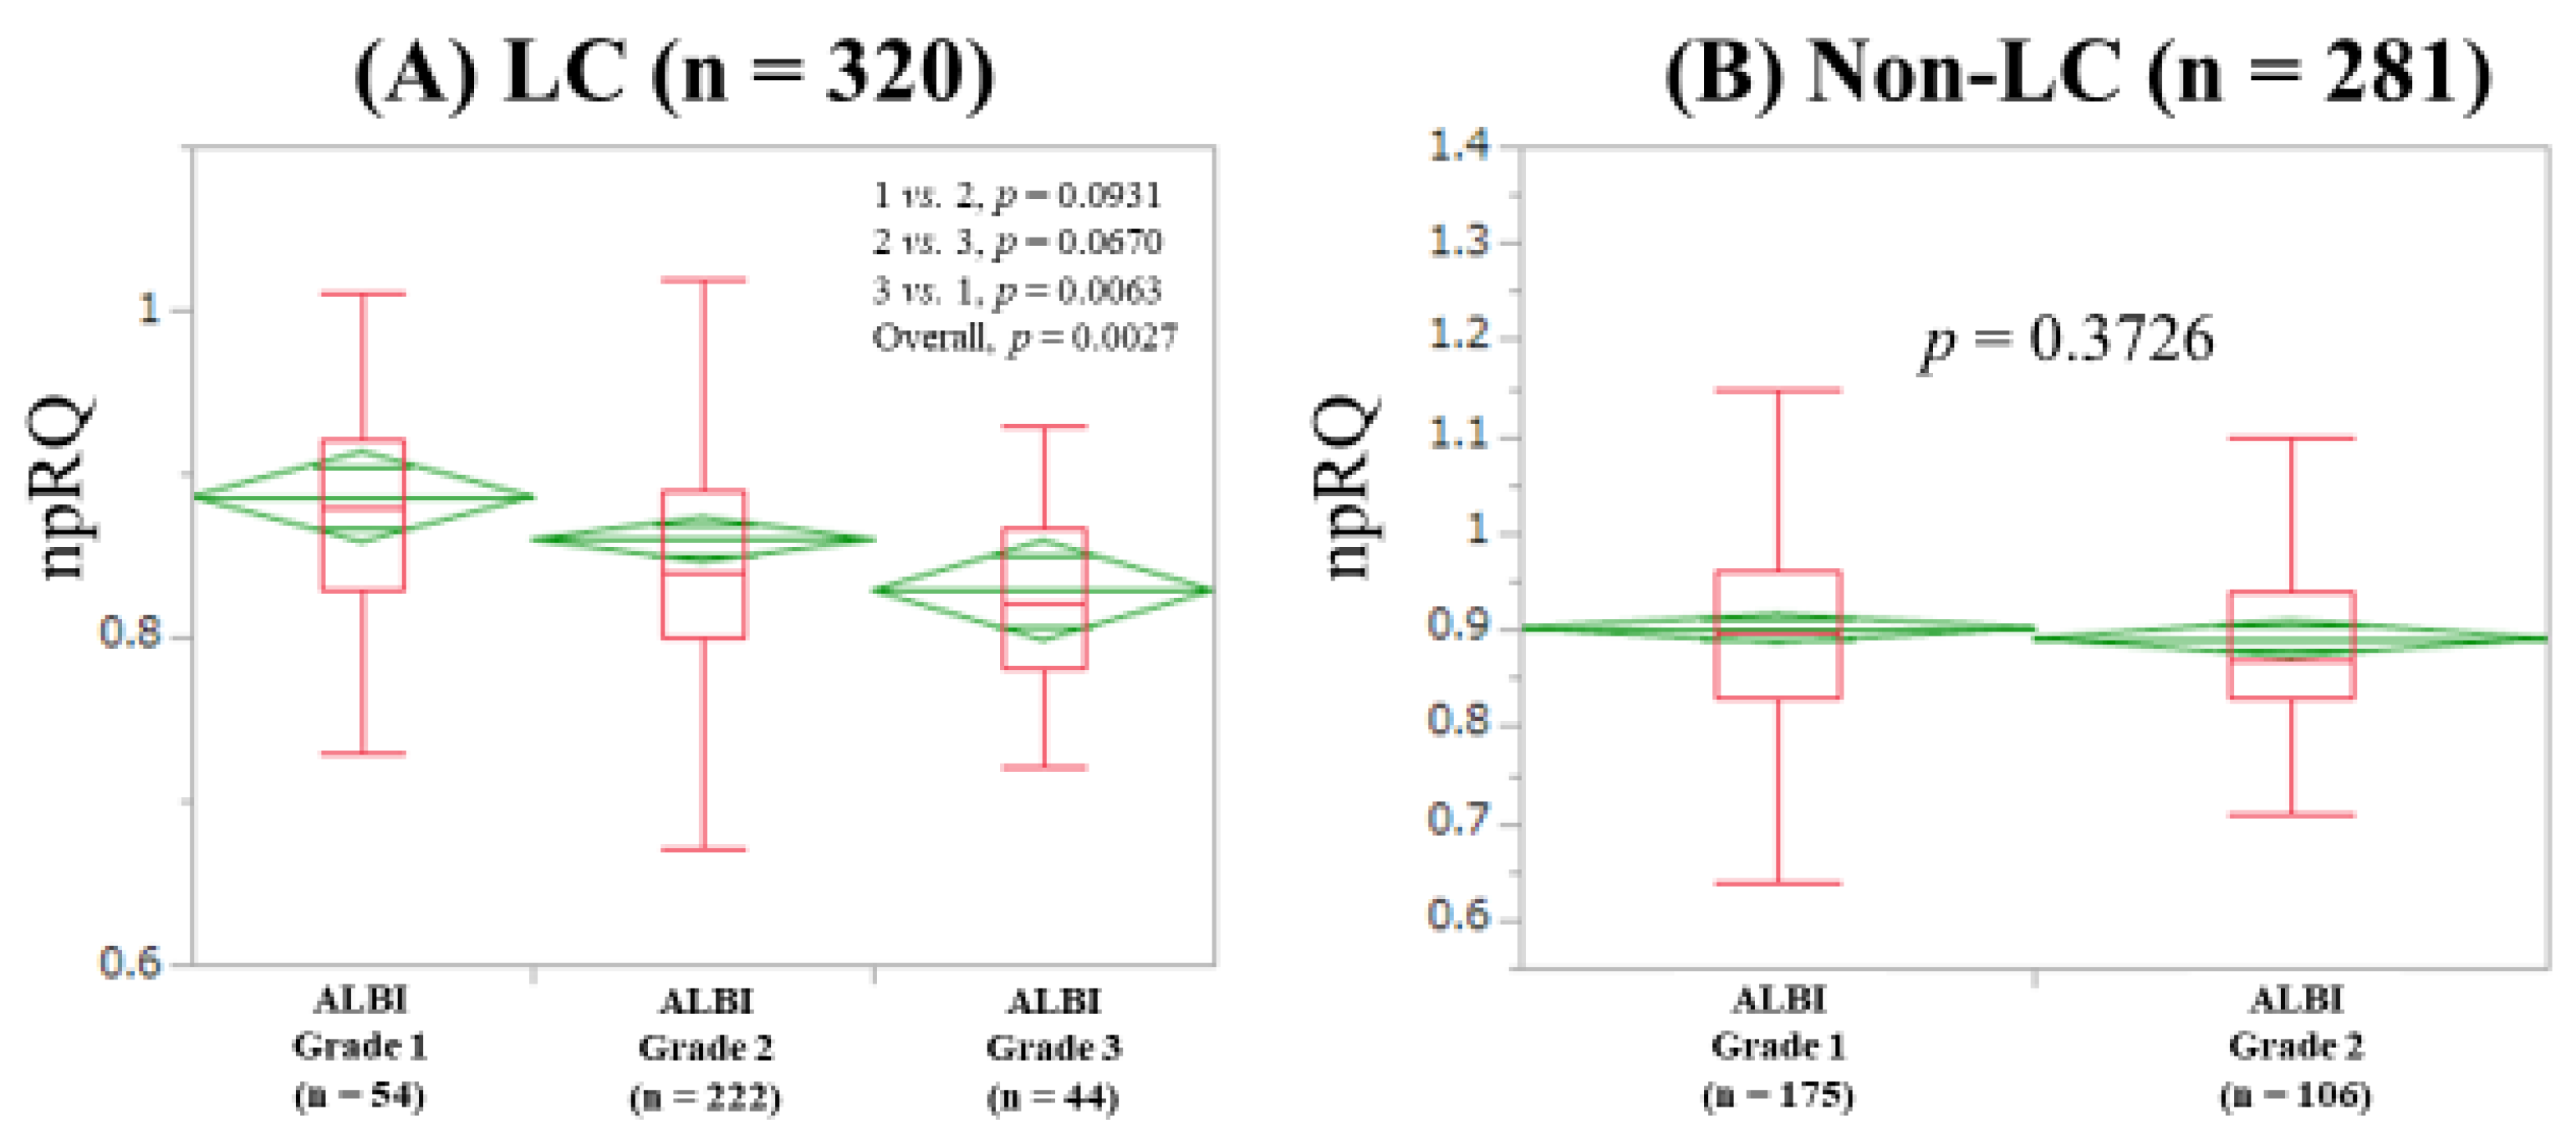
3.3. npRQ Level Among ALBI Grades 1, 2, and 3 According to the LC Status

The median (IQR) npRQs in ALBI grades 1 (n = 54), 2 (n = 222) and 3 (n = 44) in LC patients were: 0.88 (0.83, 0.92), 0.84 (0.80, 0.89), and 0.82 (0.78, 0.8675) (p values: grade 1 vs. 2, p = 0.0931; grade 2 vs. 3, p = 0.0670; grade 3 vs. 1, p = 0.0063 (overall p = 0.0027)) (Figure 3A). The median (IQR) npRQs in ALBI grades 1 (n = 175) and 2 (n = 106) in non-LC patients were: 0.90 (0.83, 0.96) and 0.87 (0.83, 0.94) (p = 0.3726) (Figure 3B).

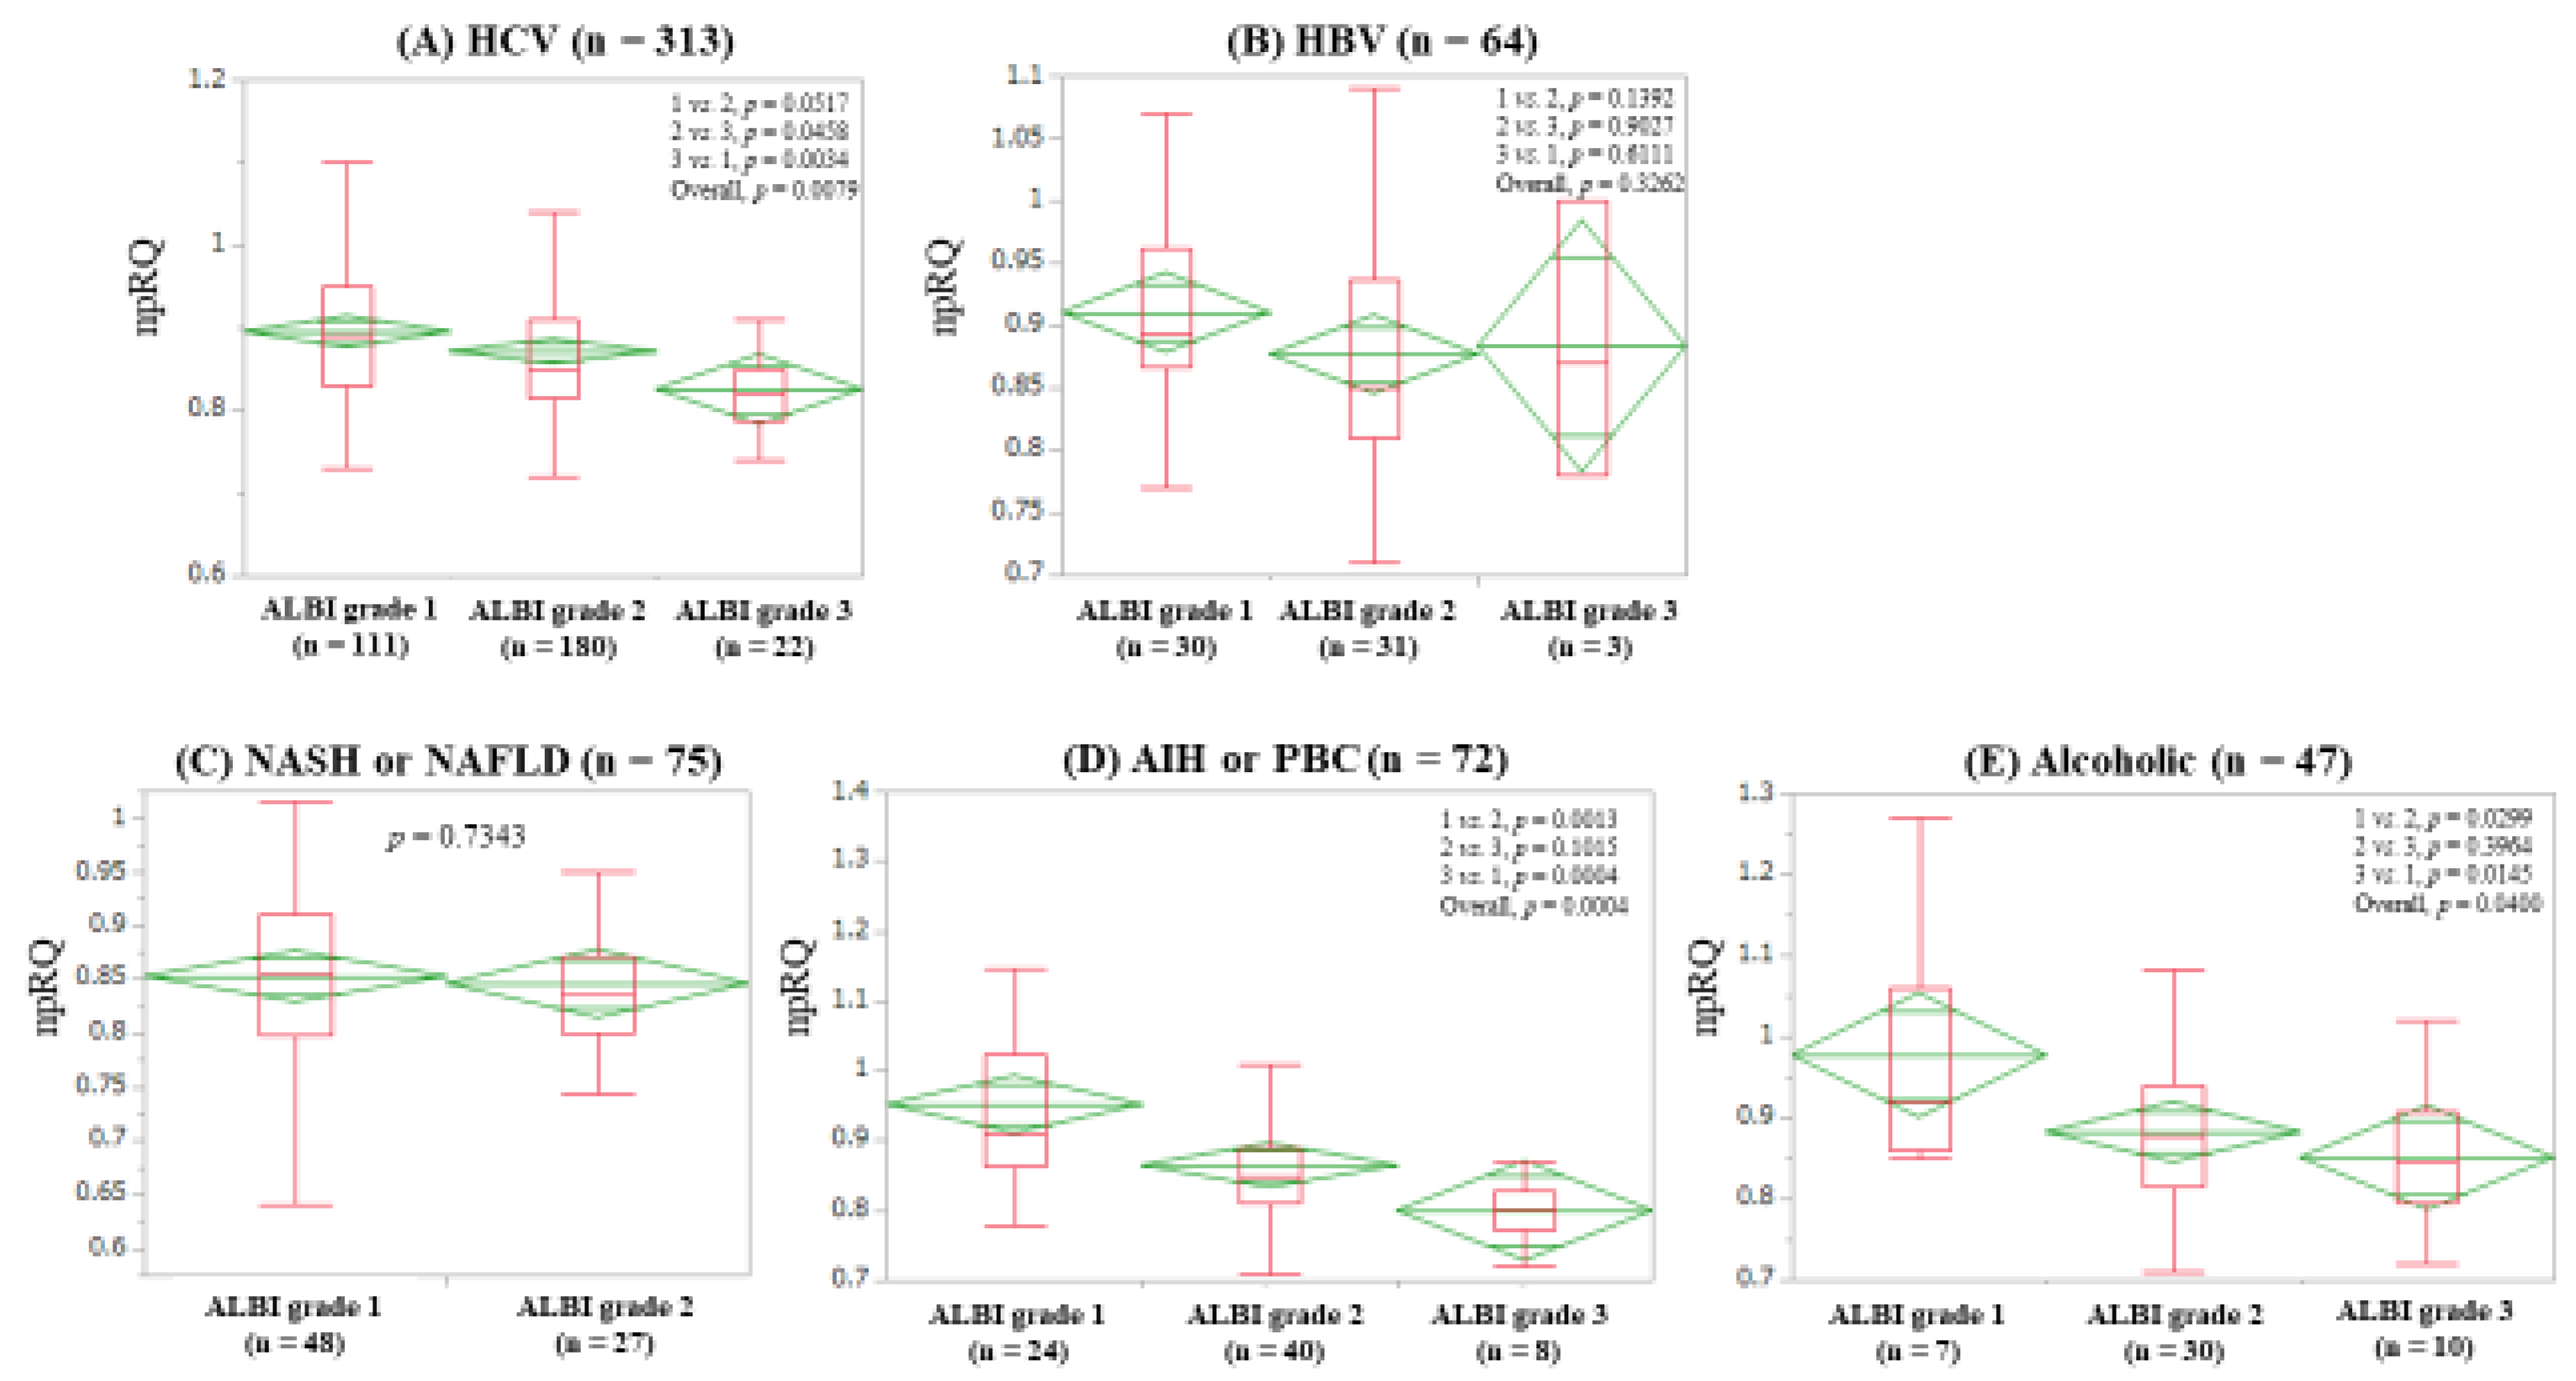
3.4. npRQ Level Among ALBI Grades 1, 2, and 3 According to Liver Disease Etiology

The median (IQR) npRQs in ALBI grades 1 (n = 111), 2 (n = 180), and 3 (n = 22) in patients with hepatitis C virus (HCV) were: 0.89 (0.83, 0.95), 0.85 (0.815, 0.91), and 0.82 (0.7875, 0.85) (p values: grade 1 vs. 2, p = 0.0517; grade 2 vs. 3, p = 0.04458; grade 3 vs. 1, p = 0.0034 (overall p = 0.0079)) (Figure 4A). The median (IQR) npRQs in ALBI grades 1 (n = 30), 2 (n = 31), and 3 (n = 3) in patients with hepatitis B virus (HBV) were: 0.893 (0.8675, 0.9625), 0.85 (0.81, 0.936), and 0.87 (0.78, 1.0) (p values: grade 1 vs. 2, p = 0.1392; grade 2 vs. 3, p = 0.9027; grade 3 vs. 1, p = 0.6111 (overall p = 0.3262)) (Figure 4B). The median (IQR) npRQs in ALBI grades 1 (n = 48) and 2 (n = 27) in patients with non-alcoholic fatty liver disease or non-alcoholic steatohepatitis were: 0.8539 (0.80, 0.91) and 0.8354 (0.80, 0.871) (p = 0.7343) (Figure 4C). The median (IQR) npRQs in ALBI grades 1 (n = 24), 2 (n = 40) and 3 (n = 8) in autoimmune hepatitis (AIH) or primary biliary cholangitis (PBC) patients were: 0.91 (0.8625, 1.025), 0.85 (0.81, 0.89), and 0.802 (0.773, 0.828) (p values: grade 1 vs. 2, p = 0.0013; grade 2 vs. 3, p = 0.1015; grade 3 vs. 1, p = 0.0004 (overall p = 0.0004)) (Figure 4D). The median (IQR) npRQs in ALBI grades 1 (n = 7), 2 (n = 30), and 3 (n = 10) in patients with alcoholic liver disease were: 0.92 (0.86, 1.06), 0.878 (0.815, 0.941), and 0.845 (0.794, 0.9075) (p values: grade 1 vs. 2, p = 0.0299; grade 2 vs. 3, p = 0.3964; grade 3 vs. 1, p = 0.0145 (overall p = 0.040)) (Figure 4E).

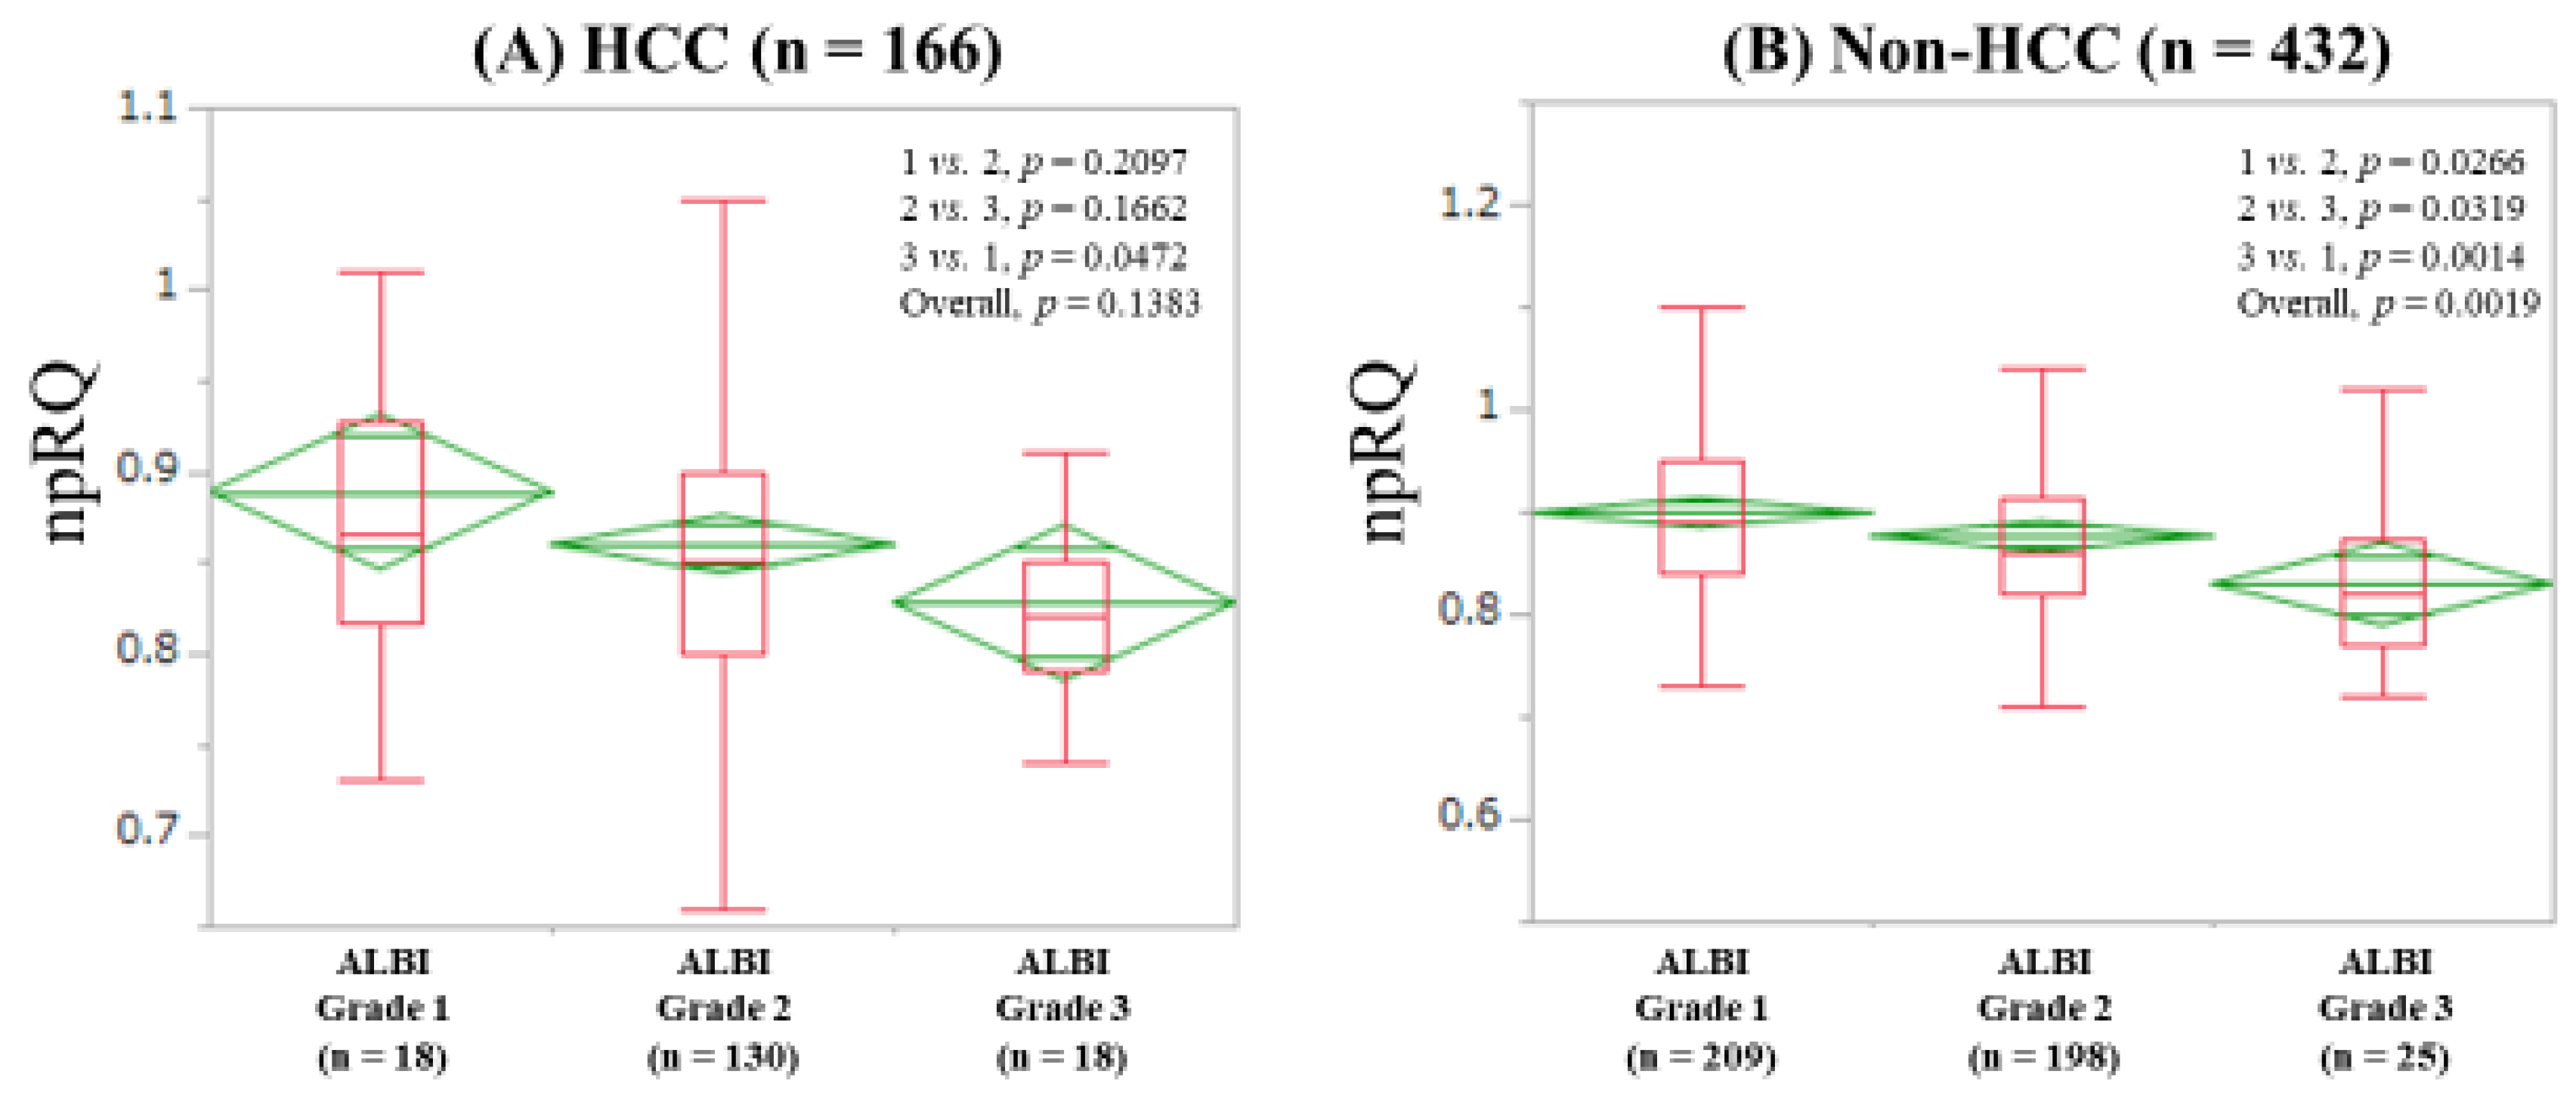
3.5. npRQ Level Among ALBI Grades 1, 2, and 3 According to the Presence of HCC

The median (IQR) npRQs in ALBI grades 1 (n = 18), 2 (n = 130), and 3 (n = 18) in patients with HCC were: 0.865 (0.8175, 0.9275), 0.85 (0.80, 0.90), and 0.82 (0.79, 0.85) (p values: grade 1 vs. 2, p = 0.2097; grade 2 vs. 3, p = 0.1662; grade 3 vs. 1, p = 0.0472 (overall p = 0.1383)) (Figure 5A). The median (IQR) npRQs in ALBI grades 1 (n = 209), 2 (n = 198), and 3 (n = 25) in non-HCC patients were: 0.89 (0.84, 0.95), 0.86 (0.82, 0.9125), and 0.82 (0.77, 0.8725) (p values: grade 1 vs. 2, P = 0.0266; grade 2 vs. 3, p = 0.0319; grade 3 vs. 1, p = 0.0014 (overall p = 0.0019)) (Figure 5B).

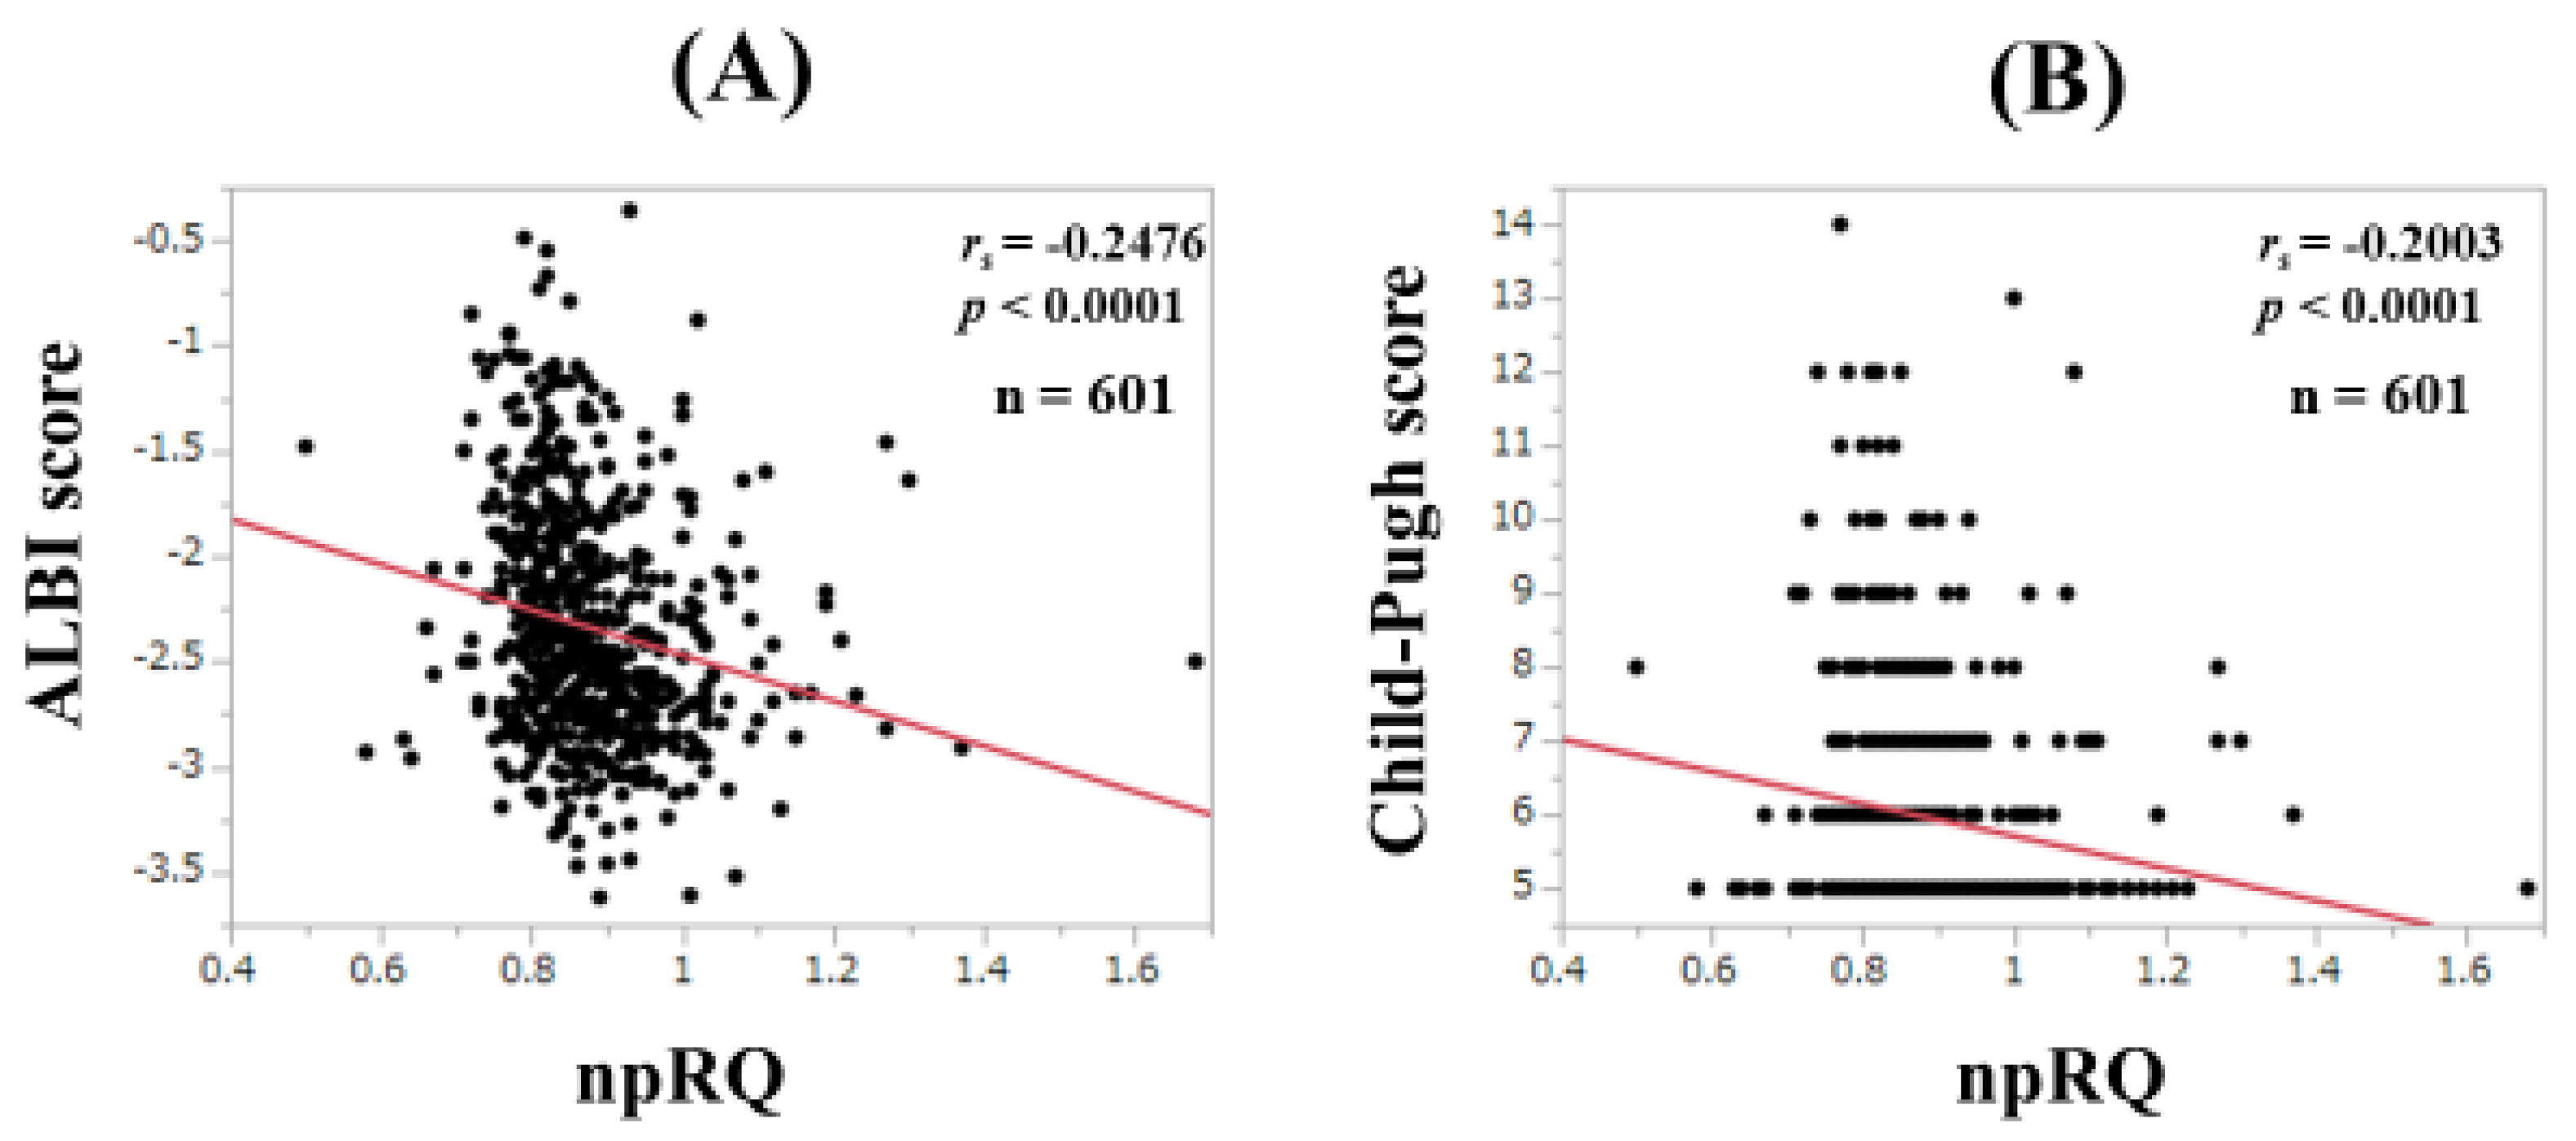
3.6. Correlation between npRQ and ALBI Score and Child-Pugh Score for All Cases

ALBI score ranged from −3.62 to −0.36 (median, −2.44). ALBI score significantly correlated with npRQ level for all cases (rs = −0.2476, p < 0.0001, Figure 6A) Child-Pugh score ranged from 5–14 (median, 5). Child-Pugh score significantly correlated with npRQ level for all cases (rs = −0.2003, p < 0.0001, Figure 6B).

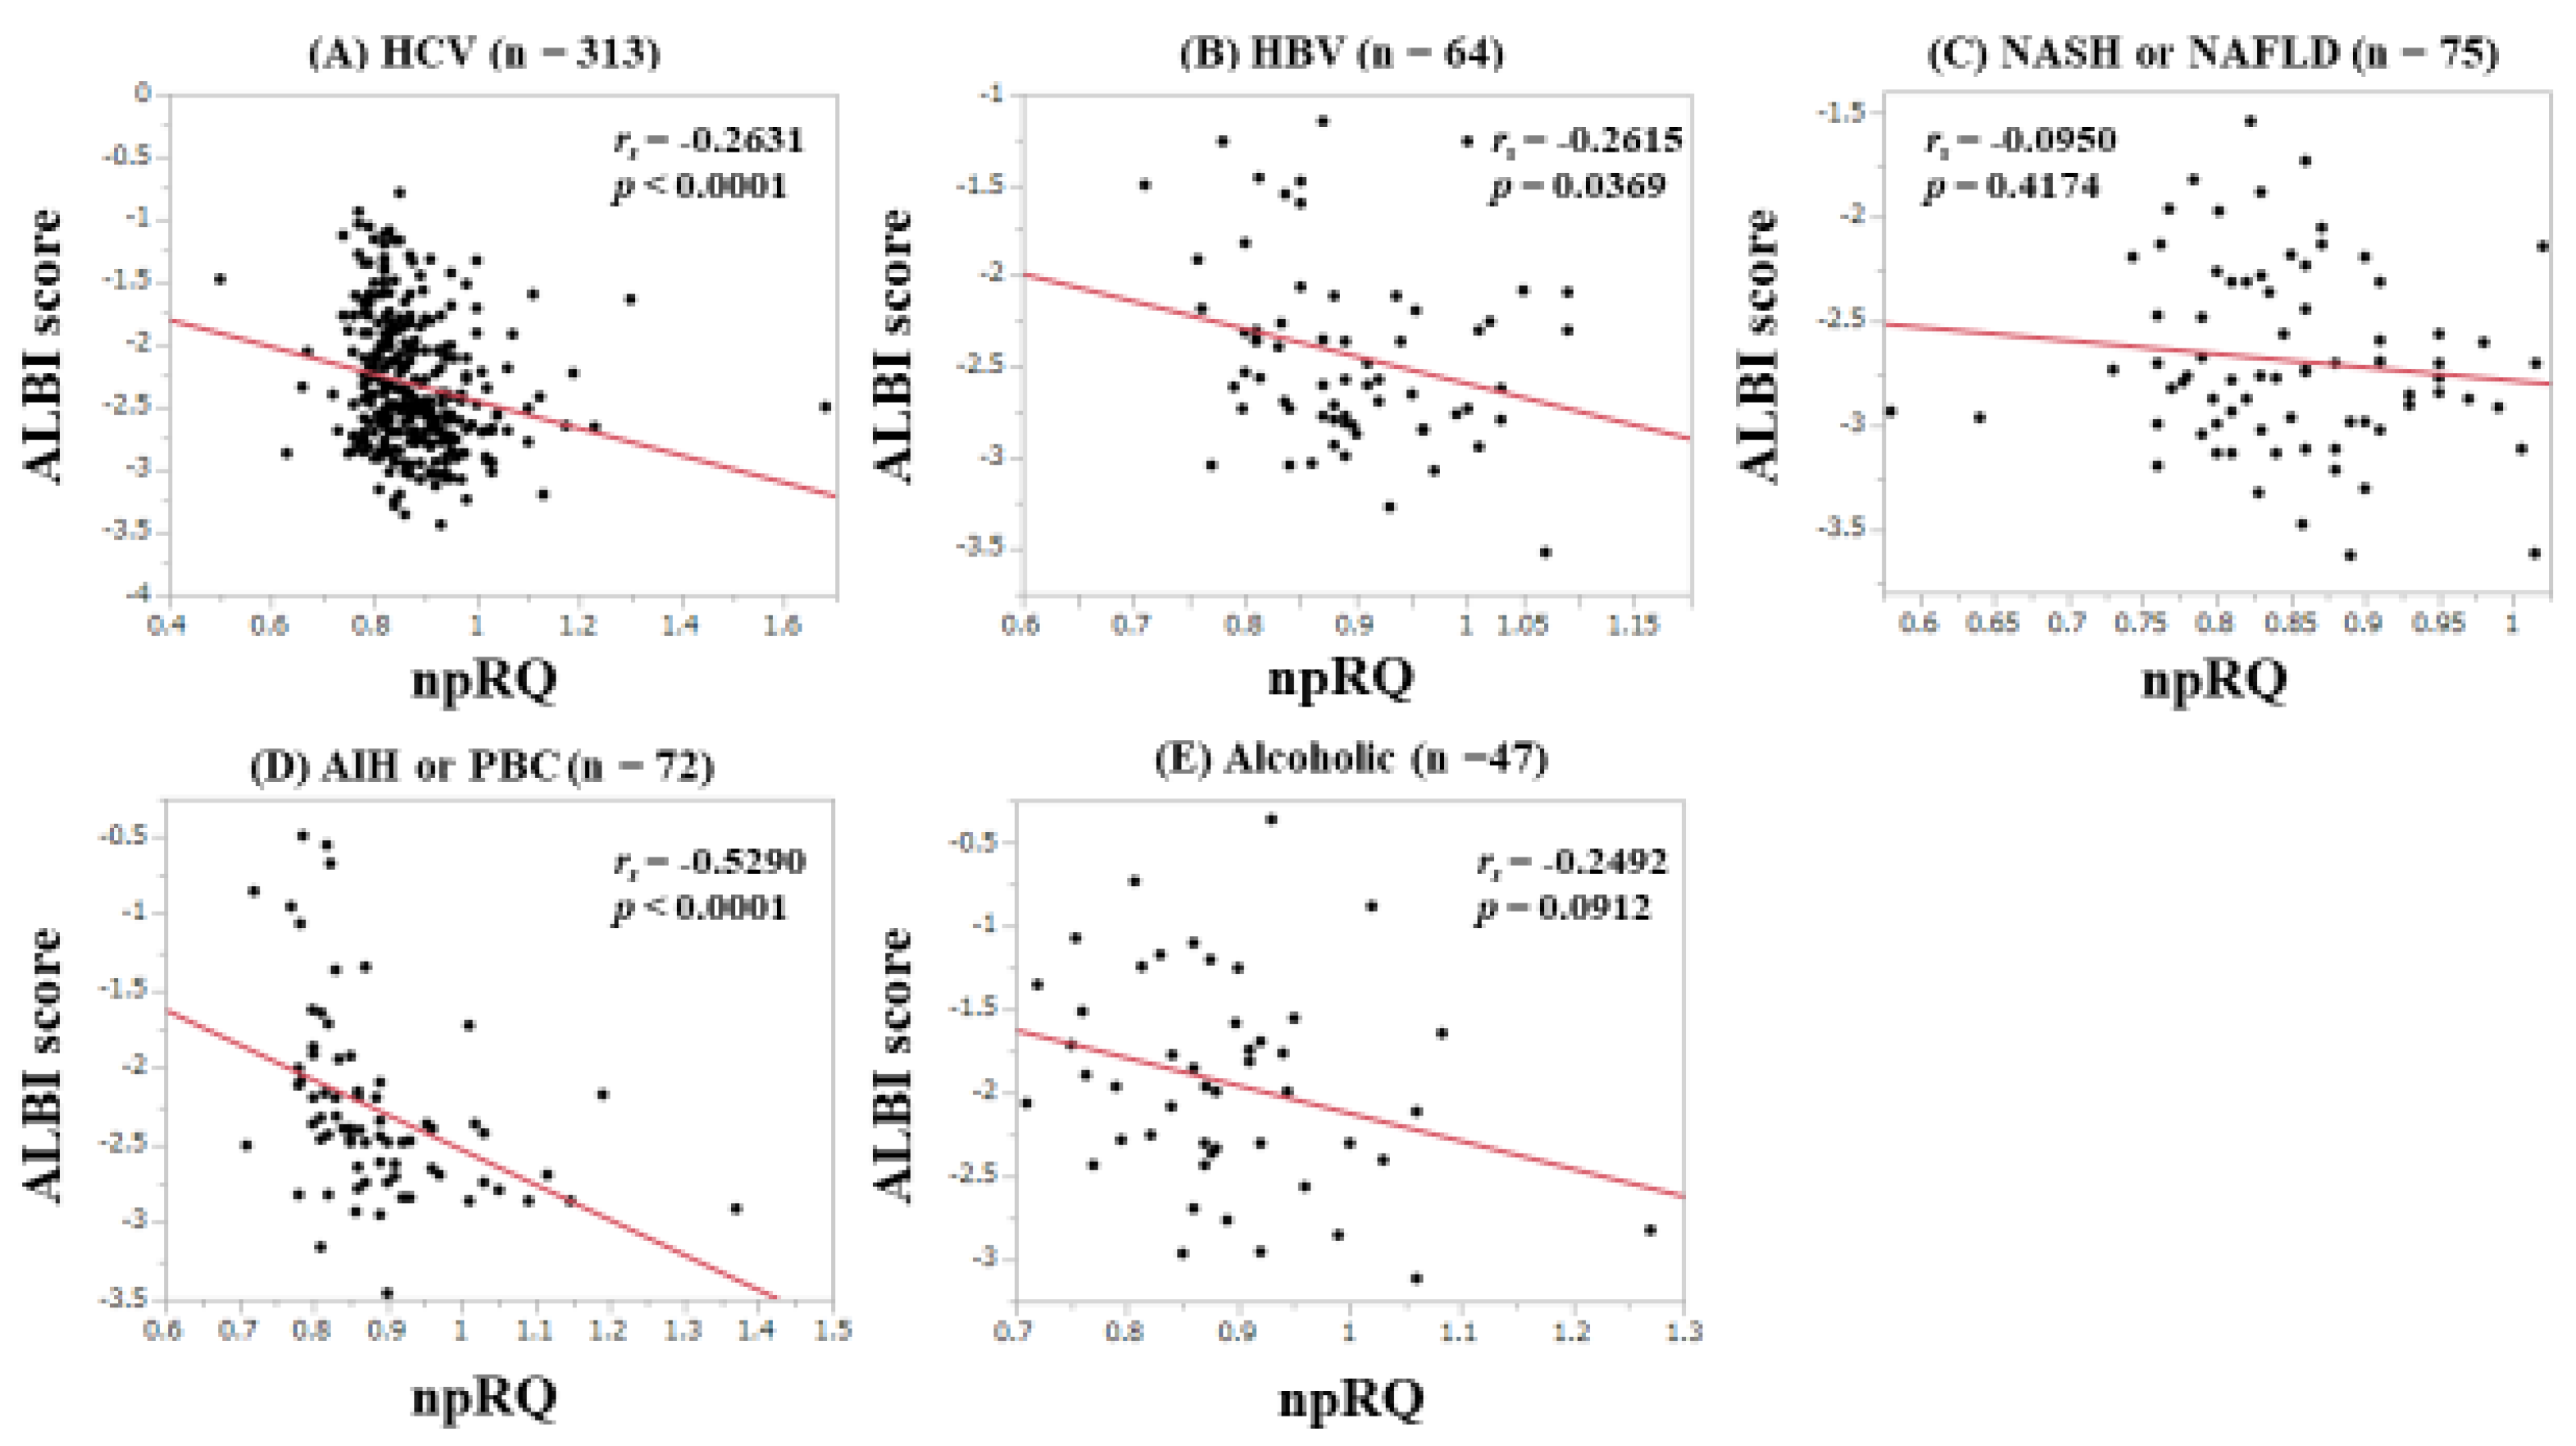
3.7. Correlation between npRQ and ALBI Score According to Liver Disease Etiology

Correlation between npRQ and ALBI score according to liver disease etiology was shown in Figure 7A–E. In patients with HCV (rs = −0.2631, p < 0.0001), HBV (rs = −0.2615, p = 0.0369), and AIH or PBC (rs = −0.5290, p < 0.0001), significant correlation was identified.

3.8. Univariate and Multivariate Analyses of Factors Associated with npRQ < 0.85

Univariate analysis identified nine factors to be significantly associated with npRQ < 0.85: age (p = 0.0042), body mass index (p = 0.0259), presence of LC (p < 0.0001), presence of HCC (p = 0.0055), ALBI grade (p < 0.0001), prothrombin time (PT, p < 0.0001), platelet count (p = 0.0003), total cholesterol (p = 0.0044), and branched-chain amino acid (BCAA) to tyrosine ratio (p = 0.0009) (Table 2). Multivariate analysis for the nine factors (p < 0.05 in the univariate analyses) revealed that PT (p = 0.0139), ALBI grade 3 (p = 0.0095, and ALBI grade 1 as a reference) were significant factors linked to npRQ < 0.85 (Table 3). Corresponding hazard ratio and 95% confidence interval were listed in Table 3.

4. Discussion

The npRQ calculated from indirect calorimetry represents the ratio of carbohydrate to fat oxidation, and lower npRQ value is reported to be an indicator of poor prognosis in patients with LC [6]. However, as mentioned above, indirect calorimetry is time-consuming and has high cost [23,24]. Not all clinicians are familiar with the indirect calorimetry used, and it therefore does not spread to the clinical settings. Thus, identifying markers related to npRQ level in patients with CLDs seems to be of clinical importance, while the ALBI grading system has spread to clinical settings due to its convenience of use and good predictability [13,14,15,16,17,18,19,20]. We therefore conducted the current analysis. The strong point in this study was its large sample size (n = 601). To the best of our knowledge, this is the first study examining the relationship between npRQ and ALBI grade in CLD patients.
In our data, npRQ level was well stratified according to ALBI grade for all cases, although such tendencies were not observed in several subgroups. In addition, ALBI score significantly correlated with npRQ value, and ALBI grade was an independent predictor linked to npRQ < 0.85 along with PT in the multivariate analysis. The correlation coefficient between ALBI score and npRQ (rs = −0.2476) was stronger than that between Child-Pugh score and npRQ (rs = −0.2003). These results denoted that the ALBI grading system can be helpful for predicting npRQ to some extent. The ALBI grading system includes serum albumin [12]. Saito et al. reported that supplementation with BCAA granules improved energy metabolism and serum albumin level after radiofrequency ablation therapy in HCC patients [28]. Our results can be associated with their results. In non-LC patients, however, the ALBI grading system cannot be helpful for predicting npRQ. The fact that most non-LC patients had normal albumin and bilirubin levels may be linked to our results. In the comparison of npRQ level among ALBI grades 1, 2, and 3 in HCC patients, the overall P value also did not reach significance. In patients with cancer, tumor-secreted or tumor-host interactions cause imbalance of energy requirements and energy uptake [29]. In HCC patients, the presence of HCC itself may be associated with energy metabolism regardless of the severity of ALBI grade [30,31,32,33].
Hanai et al. reported that plasma FFA level was significantly correlated with npRQ value (r = −0.39, p < 0.0001) [11]. In our subgroup analyses, according to liver disease etiology, the strongest correlation between ALBI score and npRQ was found in patients with AIH or PBC (rs = −0.5290, p < 0.0001), which had a stronger impact on npRQ than their data [11]. In autoimmune liver diseases, ALBI grade may be helpful for predicting energy malnutrition.
As shown in Figure 1A, the difference of npRQ level in patients with F0-2 and F3 did not reach significance, whereas npRQ levels in patients with F3 and F4 were quite different (p < 0.0001). This appears to be an important message for clinicians. Additionally, the proportion of patients with npRQ < 0.85 in LC patients (51.9%, 166/320) was significantly higher than that in non-LC patients (31.0%, 87/281) (p < 0.0001). These were expected results; more importantly, more than 30% non-LC patients had npRQ < 0.85. Clinicians should be aware of these, although a decrease in npRQ level in non-LC patients was not be able to be revealed by ALBI grade, as shown in Figure 3B. PEM was identified in 97 patients (30.3%) in our LC patients. A previous report presented that PEM was observed in 27% of LC patients (n = 294), which was similar to our data [8].
Patients with higher SMI may exercise well, and such patients may have higher npRQ value; however, SMI did not affect npRQ in our data [9]. The clinical implication of muscle mass or muscle function on energy metabolism in patients with CLDs should be further investigated in future studies. On the other hand, npRQ level was well stratified according to the edematous state defined by ECW to TBW ratio, as demonstrated in Figure 1C. Additionally, ECW to TBW ratio had the significant negative correlation with ALBI score (rs = −0.1261, p = 0.0021), although it did not reach significance in the univariate analysis linked to npRQ < 0.85. Body composition analysis using BIA is particularly attractive because of its noninvasiveness [34,35,36]. ECW to TBW ratio using BIA may provide useful information for clinicians [37].
Several limitations warrant mention in this study. First, this study was a single-center cross-sectional study with a retrospective nature. Second, the number of patients with ALBI grade 3 was relatively small for analysis, although the major strength of our study was its large sample size (n = 601). Third, npRQ level can vary according to patient activities, creating bias. Fourth, the correlation between npRQ level and ALBI score was relatively weak, although it reached statistical significance. Caution should therefore be applied for the interpretation of our data. Nevertheless, our study results demonstrated that npRQ level in CLDs was closely associated with ALBI grade. In conclusion, ALBI grade can be a useful marker for npRQ in patients with CLDs. In CLD patients with severe ALBI grade, presence of poor npRQ should be noted.

Author Contributions

Data curation, R.T., H.N., H.E., K.Y., Y.I., Y.S., K.K., N.I., T.T., N.A., K.H., N.I., Y.Y., T.N. and H.I.; Formal analysis, H.N.; Methodology, R.T. and H.N.; Supervision, S.N.; Writing–original draft, R.T. and H.N.; Writing–review & editing, H.E.

Acknowledgments

The authors gratefully thank all medical staff in our nutritional guidance room for their help with data collection.

Conflicts of Interest

None of the authors has any conflicts of interest to declare.

References

  1. Moriwaki, H.; Miwa, Y.; Tajika, M.; Kato, M.; Fukushima, H.; Shiraki, M. Branched-chain amino acids as a protein- and energy-source in liver cirrhosis. Biochem. Biophys. Res. Commun. 2004, 313, 405–409. [Google Scholar] [CrossRef]
  2. Charlton, M.R. Branched-chain amino acid enriched supplements as therapy for liver disease. J. Nutr. 2006, 136, 295S–298S. [Google Scholar] [CrossRef]
  3. Nishikawa, H.; Osaki, Y. Clinical significance of therapy using branched-chain amino acid granules in patients with liver cirrhosis and hepatocellular carcinoma. Hepatol. Res. 2014, 44, 149–158. [Google Scholar] [CrossRef] [PubMed]
  4. Hanai, T.; Shiraki, M.; Nishimura, K.; Ohnishi, S.; Imai, K.; Suetsugu, A.; Takai, K.; Shimizu, M.; Moriwaki, H. Sarcopenia impairs prognosis of patients with liver cirrhosis. Nutrition 2015, 31, 193–199. [Google Scholar] [CrossRef] [PubMed]
  5. Nishikawa, H.; Osaki, Y. Liver Cirrhosis: Evaluation, Nutritional Status, and Prognosis. Mediat. Inflamm. 2015, 2015, 872152. [Google Scholar] [CrossRef] [PubMed]
  6. Tajika, M.; Kato, M.; Mohri, H.; Miwa, Y.; Kato, T.; Ohnishi, H.; Moriwaki, H. Prognostic value of energy metabolism in patients with viral liver cirrhosis. Nutrition 2002, 18, 229–234. [Google Scholar] [CrossRef]
  7. Sakai, Y.; Iwata, Y.; Enomoto, H.; Saito, M.; Yoh, K.; Ishii, A.; Takashima, T.; Aizawa, N.; Ikeda, N.; Tanaka, H.; et al. Two randomized controlled studies comparing the nutritional benefits of branched-chain amino acid (BCAA) granules and a BCAA-enriched nutrient mixture for patients with esophageal varices after endoscopic treatment. J. Gastroenterol. 2015, 50, 109–118. [Google Scholar] [CrossRef]
  8. Shiraki, M.; Nishiguchi, S.; Saito, M.; Fukuzawa, Y.; Mizuta, T.; Kaibori, M.; Hanai, T.; Nishimura, K.; Shimizu, M.; Tsurumi, H.; et al. Nutritional status and quality of life in current patients with liver cirrhosis as assessed in 2007–2011. Hepatol. Res. 2013, 43, 106–112. [Google Scholar] [CrossRef]
  9. Peng, S.; Plank, L.D.; McCall, J.L.; Gillanders, L.K.; McIlroy, K.; Gane, E.J. Body composition, muscle function, and energy expenditure in patients with liver cirrhosis: A comprehensive study. Am. J. Clin. Nutr. 2007, 85, 1257–1266. [Google Scholar] [CrossRef]
  10. Terakura, Y.; Shiraki, M.; Nishimura, K.; Iwasa, J.; Nagaki, M.; Moriwaki, H. Indirect calorimetry and anthropometry to estimate energy metabolism in patients with liver cirrhosis. J. Nutr. Sci. Vitaminol. 2010, 56, 372–379. [Google Scholar] [CrossRef]
  11. Hanai, T.; Shiraki, M.; Nishimura, K.; Imai, K.; Suetsugu, A.; Takai, K.; Shimizu, M.; Naiki, T.; Moriwaki, H. Free fatty acid as a marker of energy malnutrition in liver cirrhosis. Hepatol. Res. 2014, 44, 218–228. [Google Scholar] [CrossRef] [PubMed]
  12. Johnson, P.J.; Berhane, S.; Kagebayashi, C.; Satomura, S.; Teng, M.; Reeves, H.L.; O’Beirne, J.; Fox, R.; Skowronska, A.; Palmer, D.; et al. Assessment of liver function in patients with hepatocellular carcinoma: A new evidence-based approach-the ALBI grade. J. Clin. Oncol. 2015, 33, 550–558. [Google Scholar] [CrossRef]
  13. Wang, Y.Y.; Zhong, J.H.; Su, Z.Y.; Huang, J.F.; Lu, S.D.; Xiang, B.D.; Ma, L.; Qi, L.N.; Ou, B.N.; Li, L.Q. Albumin-bilirubin versus Child-Pugh score as a predictor of outcome after liver resection for hepatocellular carcinoma. Br. J. Surg. 2016, 103, 725–734. [Google Scholar] [CrossRef]
  14. Toyoda, H.; Lai, P.B.; O’Beirne, J.; Chong, C.C.; Berhane, S.; Reeves, H.; Manas, D.; Fox, R.P.; Yeo, W.; Mo, F.; et al. Long-term impact of liver function on curative therapy for hepatocellular carcinoma: Application of the ALBI grade. Br. J. Cancer 2016, 114, 744–750. [Google Scholar] [CrossRef] [PubMed]
  15. Hiraoka, A.; Kumada, T.; Michitaka, K.; Toyoda, H.; Tada, T.; Ueki, H.; Kaneto, M.; Aibiki, T.; Okudaira, T.; Kawakami, T.; et al. Usefulness of albumin-bilirubin grade for evaluation of prognosis of 2584 Japanese patients with hepatocellular carcinoma. J. Gastroenterol. Hepatol. 2016, 31, 1031–1036. [Google Scholar] [CrossRef] [PubMed]
  16. Edeline, J.; Blanc, J.F.; Johnson, P.; Campillo-Gimenez, B.; Ross, P.; Ma, Y.T.; King, J.; Hubner, R.A.; Sumpter, K.; Darby, S.; et al. A multicentre comparison between Child Pugh and Albumin-Bilirubin scores in patients treated with sorafenib for Hepatocellular Carcinoma. Liver Int. 2016, 36, 1821–1828. [Google Scholar] [CrossRef] [Green Version]
  17. Fujita, K.; Oura, K.; Yoneyama, H.; Shi, T.; Takuma, K.; Nakahara, M.; Tadokoro, T.; Nomura, T.; Morishita, A.; Tsutsui, K.; et al. Albumin-bilirubin score indicates liver fibrosis staging and prognosis in chronic hepatitis C patients. Hepatol. Res. 2019. [Google Scholar] [CrossRef]
  18. Wang, J.; Zhang, Z.; Yan, X.; Li, M.; Xia, J.; Liu, Y.; Chen, Y.; Jia, B.; Zhu, L.; Zhu, C.; et al. Albumin-Bilirubin (ALBI) as an accurate and simple prognostic score for chronic hepatitis B-related liver cirrhosis. Dig. Liver Dis. 2019. [Google Scholar] [CrossRef]
  19. Hsieh, Y.C.; Lee, K.C.; Wang, Y.W.; Yang, Y.Y.; Hou, M.C.; Huo, T.I.; Lin, H.C. Correlation and prognostic accuracy between noninvasive liver fibrosismarkers and portal pressure in cirrhosis: Role of ALBI score. PLoS ONE 2018, 13, e0208903. [Google Scholar] [CrossRef]
  20. Nishikawa, H.; Enomoto, H.; Yoh, K.; Iwata, Y.; Sakai, Y.; Kishino, K.; Ikeda, N.; Takashima, T.; Aizawa, N.; Takata, R.; et al. Combined Albumin-Bilirubin Grade and Skeletal Muscle Mass as a Predictor in Liver Cirrhosis. J. Clin. Med. 2019, 8, 782. [Google Scholar] [CrossRef]
  21. Antkowiak, M.; Gabr, A.; Das, A.; Ali, R.; Kulik, L.; Ganger, D.; Moore, C.; Abecassis, M.; Katariya, N.; Mouli, S.; et al. Prognostic Role of Albumin, Bilirubin, and ALBI Scores: Analysis of 1000 Patients with Hepatocellular Carcinoma Undergoing Radioembolization. Cancers 2019, 11, 879. [Google Scholar] [CrossRef] [PubMed]
  22. Honmyo, N.; Kobayashi, T.; Hamaoka, M.; Kohashi, T.; Abe, T.; Oishi, K.; Tazawa, H.; Imaoka, Y.; Akita, T.; Tanaka, J.; et al. Hiroshima Surgical study group of Clinical Oncology (HiSCO). Comparison of new prognostic systems for patients with resectable hepatocellular carcinoma: Albumin-Bilirubin grade and Albumin-Indocyanine green Evaluation grade. Hepatol. Res. 2019. [Google Scholar] [CrossRef] [PubMed]
  23. Nishikawa, H.; Enomoto, H.; Iwata, Y.; Kishino, K.; Shimono, Y.; Hasegawa, K.; Nakano, C.; Takata, R.; Ishii, A.; Nishimura, T.; et al. Prognostic significance of nonprotein respiratory quotient in patients with liver cirrhosis. Medicine 2017, 96, e5800. [Google Scholar] [CrossRef] [PubMed]
  24. Nishikawa, H.; Enomoto, H.; Yoh, K.; Iwata, Y.; Hasegawa, K.; Nakano, C.; Takata, R.; Kishino, K.; Shimono, Y.; Sakai, Y.; et al. Serum hyaluronic acid predicts protein-energy malnutrition in chronic hepatitis C. Medicine 2016, 95, e3920. [Google Scholar] [CrossRef] [PubMed]
  25. Dickerson, R.N.; Tidwell, A.C.; Minard, G.; Croce, M.A.; Brown, R.O. Predicting total urinary nitrogen excretion from urinary urea nitrogen excretion in multiple-trauma patients receiving specialized nutritional support. Nutrition 2005, 21, 332–338. [Google Scholar] [CrossRef] [PubMed]
  26. Nishikawa, H.; Shiraki, M.; Hiramatsu, A.; Moriya, K.; Hino, K.; Nishiguchi, S. Japan Society of Hepatology guidelines for sarcopenia in liver disease (1st edition): Recommendation from the working group for creation of sarcopenia assessment criteria. Hepatol. Res. 2016, 46, 951–963. [Google Scholar] [CrossRef]
  27. McManus, M.L.; Churchwell, K.B.; Strange, K. Regulation of cell volume in health and disease. N. Engl. J. Med. 1995, 333, 1260–1266. [Google Scholar] [CrossRef]
  28. Saito, M.; Yano, Y.; Minami, A.; Hirano, H.; Momose, K.; Sugimoto, M.; Yoshida, M.; Azuma, T. Branched-chain amino acid granules improve the non-protein respiratory quotient after radiofrequency ablation. Intern. Med. 2014, 53, 1469–1475. [Google Scholar] [CrossRef]
  29. Rohm, M.; Zeigerer, A.; Machado, J.; Herzig, S. Energy metabolism in cachexia. EMBO Rep. 2019, 20, e47258. [Google Scholar] [CrossRef]
  30. Ren, M.; Li, J.; Xue, R.; Wang, Z.; Coll, S.L.; Meng, Q. Liver function and energy metabolism in hepatocellular carcinoma developed in patients with hepatitis B-related cirrhosis. Medicine 2019, 98, e15528. [Google Scholar] [CrossRef]
  31. Saito, M.; Seo, Y.; Yano, Y.; Miki, A.; Yoshida, M.; Azuma, T. Short-term reductions in non-protein respiratory quotient and prealbumin can be associated with the long-term deterioration of liver function after transcatheter arterial chemoembolization in patients with hepatocellular carcinoma. J. Gastroenterol. 2012, 47, 704–714. [Google Scholar] [CrossRef] [PubMed]
  32. Hsu, C.C.; Wu, L.C.; Hsia, C.Y.; Yin, P.H.; Chi, C.W.; Yeh, T.S.; Lee, H.C. Energy metabolism determines the sensitivity of human hepatocellular carcinoma cells to mitochondrial inhibitors and biguanide drugs. Oncol. Rep. 2015, 34, 1620–1628. [Google Scholar] [CrossRef] [PubMed]
  33. Beyoğlu, D.; Imbeaud, S.; Maurhofer, O.; Bioulac-Sage, P.; Zucman-Rossi, J.; Dufour, J.F.; Idle, J.R. Tissue metabolomics of hepatocellular carcinoma: Tumor energy metabolism and the role of transcriptomic classification. Hepatology 2013, 58, 229–238. [Google Scholar] [CrossRef] [PubMed] [Green Version]
  34. Santilli, V.; Bernetti, A.; Mangone, M.; Paoloni, M. Clinical definition of sarcopenia. Clin. Cases Miner. Bone Metab. 2014, 11, 177–180. [Google Scholar] [CrossRef] [PubMed]
  35. Chen, L.K.; Liu, L.K.; Woo, J.; Assantachai, P.; Auyeung, T.W.; Bahyah, K.S.; Chou, M.Y.; Chen, L.Y.; Hsu, P.S.; Krairit, O.; et al. Sarcopenia in Asia: Consensus Report of the Asian Working Group for Sarcopenia. J. Am. Med. Dir. Assoc. 2014, 15, 95–101. [Google Scholar] [CrossRef] [PubMed]
  36. Ferreira, L.G.; Santos, L.F.; Anastácio, L.R.; Lima, A.S.; Correia, M.I. Resting energy expenditure, body composition, and dietary intake: A longitudinal study before and after liver transplantation. Transplantation 2013, 96, 579–585. [Google Scholar] [CrossRef] [PubMed]
  37. Nishikawa, H.; Yoh, K.; Enomoto, H.; Ishii, N.; Iwata, Y.; Nakano, C.; Takata, R.; Nishimura, T.; Aizawa, N.; Sakai, Y.; et al. Extracellular Water to Total Body Water Ratio in Viral Liver Diseases: A Study Using Bioimpedance Analysis. Nutrients 2018, 10, 1072. [Google Scholar] [CrossRef] [PubMed]
Figure 1. Non-protein respiratory quotient according to liver histology (A), skeletal muscle index (SMI) (B), and extracellular water (ECW) to total body water (TBW) ratio (C). SMI decrease indicates < 7.0 kg/m2 for male and < 5.7 kg/m2 for female. Normal state indicates ECW to TBW ratio < 0.390. Mild edematous state indicates ECW to TBW ratio 0.390–0.399. Moderate to severe edematous state indicates ECW to TBW ratio ≥ 0.400.
Jcm 08 01485 g001
Figure 2. (A) Non-protein respiratory quotient (npRQ) value according to ALBI grade. (B) The proportion of npRQ < 0.85 according to ALBI grade.
Jcm 08 01485 g002
Figure 3. Non-protein respiratory quotient according to ALBI grade in patients with LC (A) and non-LC (B).
Jcm 08 01485 g003
Figure 4. Non-protein respiratory quotient according to ALBI grade in patients with HCV (A) and HBV (B), NASH or NAFLD (C), AIH or PBC (D) and alcoholic liver disease (E).
Jcm 08 01485 g004
Figure 5. Respiratory quotient according to ALBI grade in patients with HCC (A) and non-HCC (B).
Jcm 08 01485 g005
Figure 6. Correlation between npRQ and ALBI score (A) and Child-Pugh score (B) for all cases.
Jcm 08 01485 g006
Figure 7. Correlation between npRQ and ALBI score according to liver disease etiology. (A) HCV, (B) HBV, (C) NAFLD or NASH, (D) AIH or PBC, and (E) alcoholic liver disease.
Jcm 08 01485 g007
Table 1. Baseline data (n = 601).
VariablesNumber or Median (Interquartile Range (IQR))
Age (years)63 (54, 71)
Gender, male/female301/300
Body mass index (kg/m2)22.2 (20.2, 24.9)
Presence of LC, yes/no320/281
Child-Pugh classification, A/B/C447/131/23
Presence of HCC, yes/no/unknown166/432/3
Skeletal muscle mass index (kg/m2), male7.3 (6.8, 8.0)
Skeletal muscle mass index (kg/m2), female5.8 (5.3, 6.3)
ECW to TBW ratio0.385 (0.376, 0.393)
Causes of liver disease64/313/47/75/72/30
Hepatitis B/Hepatitis C/alcohol/NAFLD or NASH/AIH or PBC/others
Liver histology
F0/F1/F2/F3/F412/117/77/75/320
ALBI grade, 1/2/3229/328/44
npRQ0.86 (0.81, 0.925)
Total bilirubin (mg/dL)0.9 (0.7, 1.3)
Serum albumin (g/dL)3.8 (3.3, 4.1)
Prothrombin time (%)86.0 (71.9, 95.5)
Platelets (×104/mm3)12.4 (7.8, 19.0)
Total cholesterol (mg/dL)160 (134.75, 188)
AST (IU/L)40 (28.5, 62)
ALT (IU/L)35 (23, 61.5)
HbA1c (NGSP)5.2 (4.9, 5.7)
Branched-chain amino acid to tyrosine ratio5.04 (3.725, 6.335)
Ascites, yes/no/unknown54/544/3
LC, liver cirrhosis; HCC, hepatocellular carcinoma; ECW, extracellular water; TBW, total body water; NAFLD, non-alcoholic fatty liver disease; NASH, non-alcoholic steatohepatitis; AIH, autoimmune hepatitis; PBC, primary biliary cholangitis; npRQ, non-protein respiratory quotient; ALBI, albumin-bilirubin; AST, aspartate aminotransferase; ALT, alanine aminotransferase; NGSP, National Glycohemoglobin Standardization Program.
Table 2. Univariate analyses of factors linked to npRQ < 0.85.
VariablesnpRQ ≥ 0.85 (n = 348)npRQ < 0.85 (n = 253)p Value
Age (years)62 (51,70)66 (56,73)0.0042
Gender, male/female178/170123/1300.5635
HBV/HCV/alcohol/NAFLD or NASH/AIH or PBC/others43/177/32/37/43/1621/136/15/38/29/140.2124
Body mass index (kg/m2)21.9 (20.1, 24.4)22.8 (20.2, 25.6)0.0259
Presence of LC, yes/no154/194166/87<0.0001
Presence of HCC, yes/no81/26685/1660.0055
ALBI grade, 1/2/3158/176/1471/152/30<0.0001
Prothrombin time (%)89.6 (76.1, 98.1)78.9 (67.6, 91.0)<0.0001
Platelet count (×104/mm3)14.2 (8.7, 19.8)9.8 (7.2, 17.2)0.0003
AST (IU/L)36 (27,57)44 (30, 65)0.0506
ALT (IU/L)35 (23, 62.75)35 (24, 60)0.9233
Total cholesterol (mg/dL)166 (136, 193.25)153 (129.25, 180)0.0044
HbA1c (NGSP)5.2 (5.0, 5.6)5.2 (4.7, 5.7)0.1438
BTR5.34 (4.08, 6.42)4.605 (3.28, 6.0325)0.0009
ECW to TBW ratio0.384 (0.375, 0.392)0.386 (0.377, 0.394)0.0643
SMI (kg/m2), male7.3 (6.8, 7.85)7.35 (6.9, 8.0)0.3515
SMI (kg/m2), female5.7 (5.3, 6.3)5.9 (5.2, 6.4)0.1723
Data are expressed as median value (interquartile range). HBV hepatitis B virus; HCV, hepatitis C virus; NAFLD, non-alcoholic fatty liver; NASH, non-alcoholic steatohepatitis; AIH, autoimmune hepatitis; PBC, primary biliary cholangitis; AST, aspartate aminotransferase; ALT, alanine aminotransferase; NGSP, National Glycohemoglobin Standardization Program; BTR, branched-chain amino acid to tyrosine ratio; ECW, extracellular water; TBW, total body water; SMI, skeletal muscle index.
Table 3. Multivariate analyses of factors linked to npRQ < 0.85.
Multivariate Analysis
Hazard Ratio95% CIp Value
Age1.5930.488–5.2010.4407
Platelet count0.7290.0963–5.5150.7593
Body mass index0.3090.0808–1.1810.0861
Total cholesterol0.6360.185–2.1850.4721
BTR0.1590.0159–1.5780.1162
Prothrombin time0.1180.0215–0.6470.0139
Presence of HCC1.0160.649–1.5930.9428
Presence of LC1.6460.987–2.7430.0560
ALBI
ALBI grade 11.000Reference
ALBI grade 21.4650.930–2.3090.1000
ALBI grade 33.2421.333–7.8860.0095
CI, confidence interval; BTR, branched-chain amino acid to tyrosine ratio; HCC, hepatocellular carcinoma; LC, liver cirrhosis; ALBI, albumin-bilirubin.

