Optimization Method for Forecasting Confirmed Cases of COVID-19 in China


1
State Key Laboratory for Information Engineering in Surveying, Mapping and Remote Sensing, Wuhan University, Wuhan 430079, China
2
Department of e-Systems, University of Bisha, Bisha 61922, Saudi Arabia
3
Department of Computer, Damietta University, Damietta 34517, Egypt
4
Department of Mathematics, Faculty of Science, Zagazig University, Zagazig 44519, Egypt
*
Author to whom correspondence should be addressed.
J. Clin. Med. 2020, 9(3), 674; https://0-doi-org.brum.beds.ac.uk/10.3390/jcm9030674
Submission received: 9 February 2020
/
Revised: 26 February 2020
/
Accepted: 27 February 2020
/
Published: 2 March 2020
(This article belongs to the Special Issue Real Time Clinical and Epidemiological Investigations on Novel Coronavirus - Part I)
Abstract
:In December 2019, a novel coronavirus, called COVID-19, was discovered in Wuhan, China, and has spread to different cities in China as well as to 24 other countries. The number of confirmed cases is increasing daily and reached 34,598 on 8 February 2020. In the current study, we present a new forecasting model to estimate and forecast the number of confirmed cases of COVID-19 in the upcoming ten days based on the previously confirmed cases recorded in China. The proposed model is an improved adaptive neuro-fuzzy inference system (ANFIS) using an enhanced flower pollination algorithm (FPA) by using the salp swarm algorithm (SSA). In general, SSA is employed to improve FPA to avoid its drawbacks (i.e., getting trapped at the local optima). The main idea of the proposed model, called FPASSA-ANFIS, is to improve the performance of ANFIS by determining the parameters of ANFIS using FPASSA. The FPASSA-ANFIS model is evaluated using the World Health Organization (WHO) official data of the outbreak of the COVID-19 to forecast the confirmed cases of the upcoming ten days. More so, the FPASSA-ANFIS model is compared to several existing models, and it showed better performance in terms of Mean Absolute Percentage Error (MAPE), Root Mean Squared Relative Error (RMSRE), Root Mean Squared Relative Error (RMSRE), coefficient of determination (), and computing time. Furthermore, we tested the proposed model using two different datasets of weekly influenza confirmed cases in two countries, namely the USA and China. The outcomes also showed good performances.
1. Introduction
A large family of viruses, called coronaviruses, are severe pathogens for human beings, which infect respiratory, hepatic, gastrointestinal, and neurologic diseases. They are distributed among humans, birds, livestock, mice, bats, and other wild animals [1,2,3]. The outbreaks of two previous coronaviruses, SARS-CoV and MERS-CoV in 2003 and 2012, respectively, have approved the transmission from animal to animal, and human to human [4]. In December 2019, the World Health Organization (WHO) received notifications from China for many cases of respiratory illness that were linked to some people who had visited a seafood market in Wuhan [5]. Currently, Wuhan city suffers from the spreading of a novel coronavirus, called COVID-19 (previously, it was called 2019-nCoV). In [6], the authors concluded that COVID-19 likely originated in bats, because it is more similar to two bat-derived coronavirus strains. However, the source of the COVID-19 is not confirmed yet, and it requires more investigation. Most of the reported cases are in Wuhan city; therefore, at 10:00 a.m. on 23 January 2020, Wuhan was put on lockdown, in which no people were allowed to go in or out, so, the authorities stopped all public transportation, including airports, trains, metro, and public buses to avoid the spread of COVID-19. Moreover, several cities in Hubei province were put on lockdown. However, many confirmed cases have been recorded in other Chinese cities and about 24 countries globally (up to 3 February 2020) but less than Wuhan city. On 30 January 2020, the Centers for Disease Control and Prevention (CDC) confirmed the human to human transmission of COVID-19. According to the CDC, the virus can be spread by the air, close personal contact, touching surfaces, or objects that contain viral particles, and rarely from fecal contamination. One of the serious problems of the COVID-19 is its incubation period which is up to 14 days as mentioned by [7], and during this period it can spread to others. Moreover, in [8], a Chinese team concludes that the median incubation period is 3 days and it ranged from 0 to 24 days, and the median age is 47.0 years. Therefore, the confirmed cases have increased daily, specifically in China. The spread of such a virus is very dangerous and requires more strict policies and plans, which have already been implemented in many Chinese cities, especially in Hubei province. Thus, it is very critical to forecast the confirmed cases in the upcoming days to enact the necessary protection plans.
Zhao et al. [9] proposed a mathematical model to estimate the real number of COVID-19 cases in the first half of January 2020, which had not been reported. They concluded that the number of unreported cases resulted in 469 cases from 1 to 15 January 2020. In addition, they estimated that after 17 January 2020, the cases had increased 21-fold. Nishiura et al. [10] proposed an estimation model for the infection rate of COVID-19 in Wuhan, China using the data of 565 Japanese citizens who had been evacuated from Wuhan from 29 to 31 January 2020. They conclude that the estimated rate is 9.5%, and the death rate is 0.3% to 0.6%. However, the number of Japanese citizens who had been evacuated from Wuhan is small and insufficient to estimate the infection and death rate. Tang et al. [11] proposed a mathematical model to estimate the transmission risk of COVID-19. They concluded that the basic reproduction number could be 6.47. They also predicted the number of confirmed cases in seven days (23 to 29 January 2020). Moreover, they expected that the peak would be reached after two weeks (from 23 January 2020). In [12], data of 47 patients were used to estimate sustained human-to-human transmission of COVID-19. The author concluded that the transmission is 0.4, and if the time of symptom to hospitalization is half of the tested data, the transmission will be only 0.012. In [13], the authors presented an estimation model for the risk of death from COVID-19. Their estimation results for two different scenarios are 5.1% and 8.4%. They also estimated the reproduction number for both two scenarios as 2.1 and 3.2, respectively. The estimation results showed that the COVID-19 might cause a pandemic.
Previously, many studies were presented for forecasting some epidemics, for example, DeFelice et al. [14] proposed a compartmental model to forecast spillover transmission risk and human West Nile virus (WNV) cases. The proposed model was applied using the historical data of WNY outbreaks of Long Island, New York, for 2001–2014. In [15], a comparison of several time series forecasting models is proposed to forecast hepatitis A virus infection. The authors used 13 years of data of Turkey to test four time series forecasting models, namely multi-layer perceptron (MLP), time-delay neural networks, radial basis function (RBF), and auto-regressive integrated moving average (ARIMA). The comparison outcomes showed that the MLP outperformed other models. In [16], the authors proposed a forecasting model based on ensemble adjustment Kalman filter for seasonal outbreaks of influenza. They evaluated the proposed model using the influenza seasons data of New York City for six years (2003–2008). In addition, Shaman et al. [17] proposed weekly forecasts for seasonal influenza based on susceptible-infected-recovered-susceptible, ensemble adjustment Kalman filter, and influenza-like illness. Moreover, in [18], the authors employed a dynamic model with Bayesian inference to forecast the outbreaks of Ebola in several African countries, namely, Liberia, Sierra Leone, and Guinea. Massad et al. [19] proposed a mathematical model to analyze and forecast the infection of the SARS epidemic. They concluded that the reproduction number for two different communities, Hong Kong and Toronto, were 1.2 and 1.32, respectively. Ong et al. [20] proposed a monitoring and forecasting model for influenza A (H1N1-2009). Furthermore, Nah et al. [21] proposed a probability-based model to predict the spread of the MERS.
The Adaptive Neuro-Fuzzy Inference System (ANFIS) [22] is widely applied in time series prediction and forecasting problems, and it showed good performance in many existing applications. It offers flexibility in determining nonlinearity in the time series data, as well as combining the properties of both artificial neural networks (ANN) and fuzzy logic systems. It has been applied in various forecasting applications, for example, in [23], a stock price forecasting model was proposed using ANFIS and empirical mode decomposition. Chen et al. [24] proposed a TAIEX time series forecasting model based on a hybrid of ANFIS and ordered weighted averaging (OWA). In [25], another time series forecasting method was presented for electricity prices based on ANFIS. Svalina et al. [26] proposed an ANFIS based forecasting model for close price indices for a stock market for five days. Ekici and Aksoy [27] presented an ANFIS based building energy consumption forecasting model. More so, ANFIS is also applied to forecast electricity loads [28]. Kumar et al. [29] proposed an ANFIS based model to forecast return products. Ho and Tsai [30] applied ANFIS to forecast product development performance. However, estimating ANFIS parameters is a challenge that needs to be improved. Therefore, in previous studies, some individual swarm intelligence (SI) methods have been applied to the ANFIS parameters to enhance time series forecasting because these parameters have a significant effect on the performance of ANFIS. The SI methods include the particle swarm optimization (PSO) [31,32], social-spider optimization [33], sine-cosine algorithm (SCA) [34], and multi-verse optimizer (MVO) [35]. For example, in [34] SCA algorithm was applied to improve the ANFIS model to forecast oil consumption in three countries, namely, Canada, Germany, and Japan. In the same context, in [35], The MVO algorithm was used to enhance the ANFIS model to forecast oil consumption in two countries. In addition, in [36] the PSO was used with ANFIS to predict biochar yield. However, individual SI algorithms may stock at local optima. Therefore, one solution is to apply hybrid SI algorithms to avoid this problem. In [37], a hybrid of two SI algorithms, namely GA and SSA, was presented to improve the ANFIS model. The proposed new model called GA-SSA-ANFIS was applied to forecast crude oil prices for long-term time series data. However, the previously mentioned methods suffer from some limitations that can affect the performance of the forecasting output such as slow convergence and the ability to balance between exploration and exploitation phases can influence the quality of the final output. This motivated us to propose an alternative forecasting method dependent on the hybridization concept. This concept avoids the limitations of traditional SI techniques by combining the strengths of different techniques, and this produces new SI techniques that are better than traditional ones.
In the current study, we propose an improved ANFIS model based on a modified flower pollination algorithm (FPA) using the salp swarm algorithm (SSA). The FPA is an optimization algorithm proposed by Yang [38], which was inspired by the flow pollination process of the flowering plants. The FPA was employed in various optimization applications, for example to estimate solar PV parameter [39,40], solving sudoku puzzles [41], feature selection [42], antenna design [43], and other applications [44,45,46,47]. Moreover, SSA is also an optimization algorithm proposed by Mirjalili et al. [48] inspired by the behavior of salp chains. In recent years, the SSA was utilized to solve different optimization problems, such as feature selection [49,50], data classification [51], image segmentation [52], and others [53,54].
The proposed method called FPASSA is a hybrid of FPA and SSA, in which the SSA is applied as a local search method for FPA. The proposed FPASSA starts by receiving the historical COVID-19 dataset. Then a set of solutions is generated where each of them represents the value for the parameters of the ANFIS model. Then the quality of each solution is calculated using the fitness value, and the solution that has the best fitness value is chosen to represent the best solution. Then the probability of each solution is computed. Then the current solution will be updated, either using global or local strategy in FPA. However, in the case of local strategy, the operators of SSA or FPA will be used according to the probability of the fitness value for each solution. The process of updating the solutions is repeated until reaching the stop condition, and the best parameter configurations are used to forecast the number of confirmed cases of COVID-19.
The main contribution points of the current study are as follows:
- We propose an efficient forecasting model to forecast the confirmed cases of the COVID-19 in China for the upcoming ten days based on previously confirmed cases.
- An improved ANFIS model is proposed using a modified FPA algorithm, using SSA.
- We compare the proposed model with the original ANFIS and existing modified ANFIS models, such as PSO, GA, ABC, and FPA.
2. Material and Methods
2.1. Adaptive Neuro-Fuzzy Inference System (ANFIS)
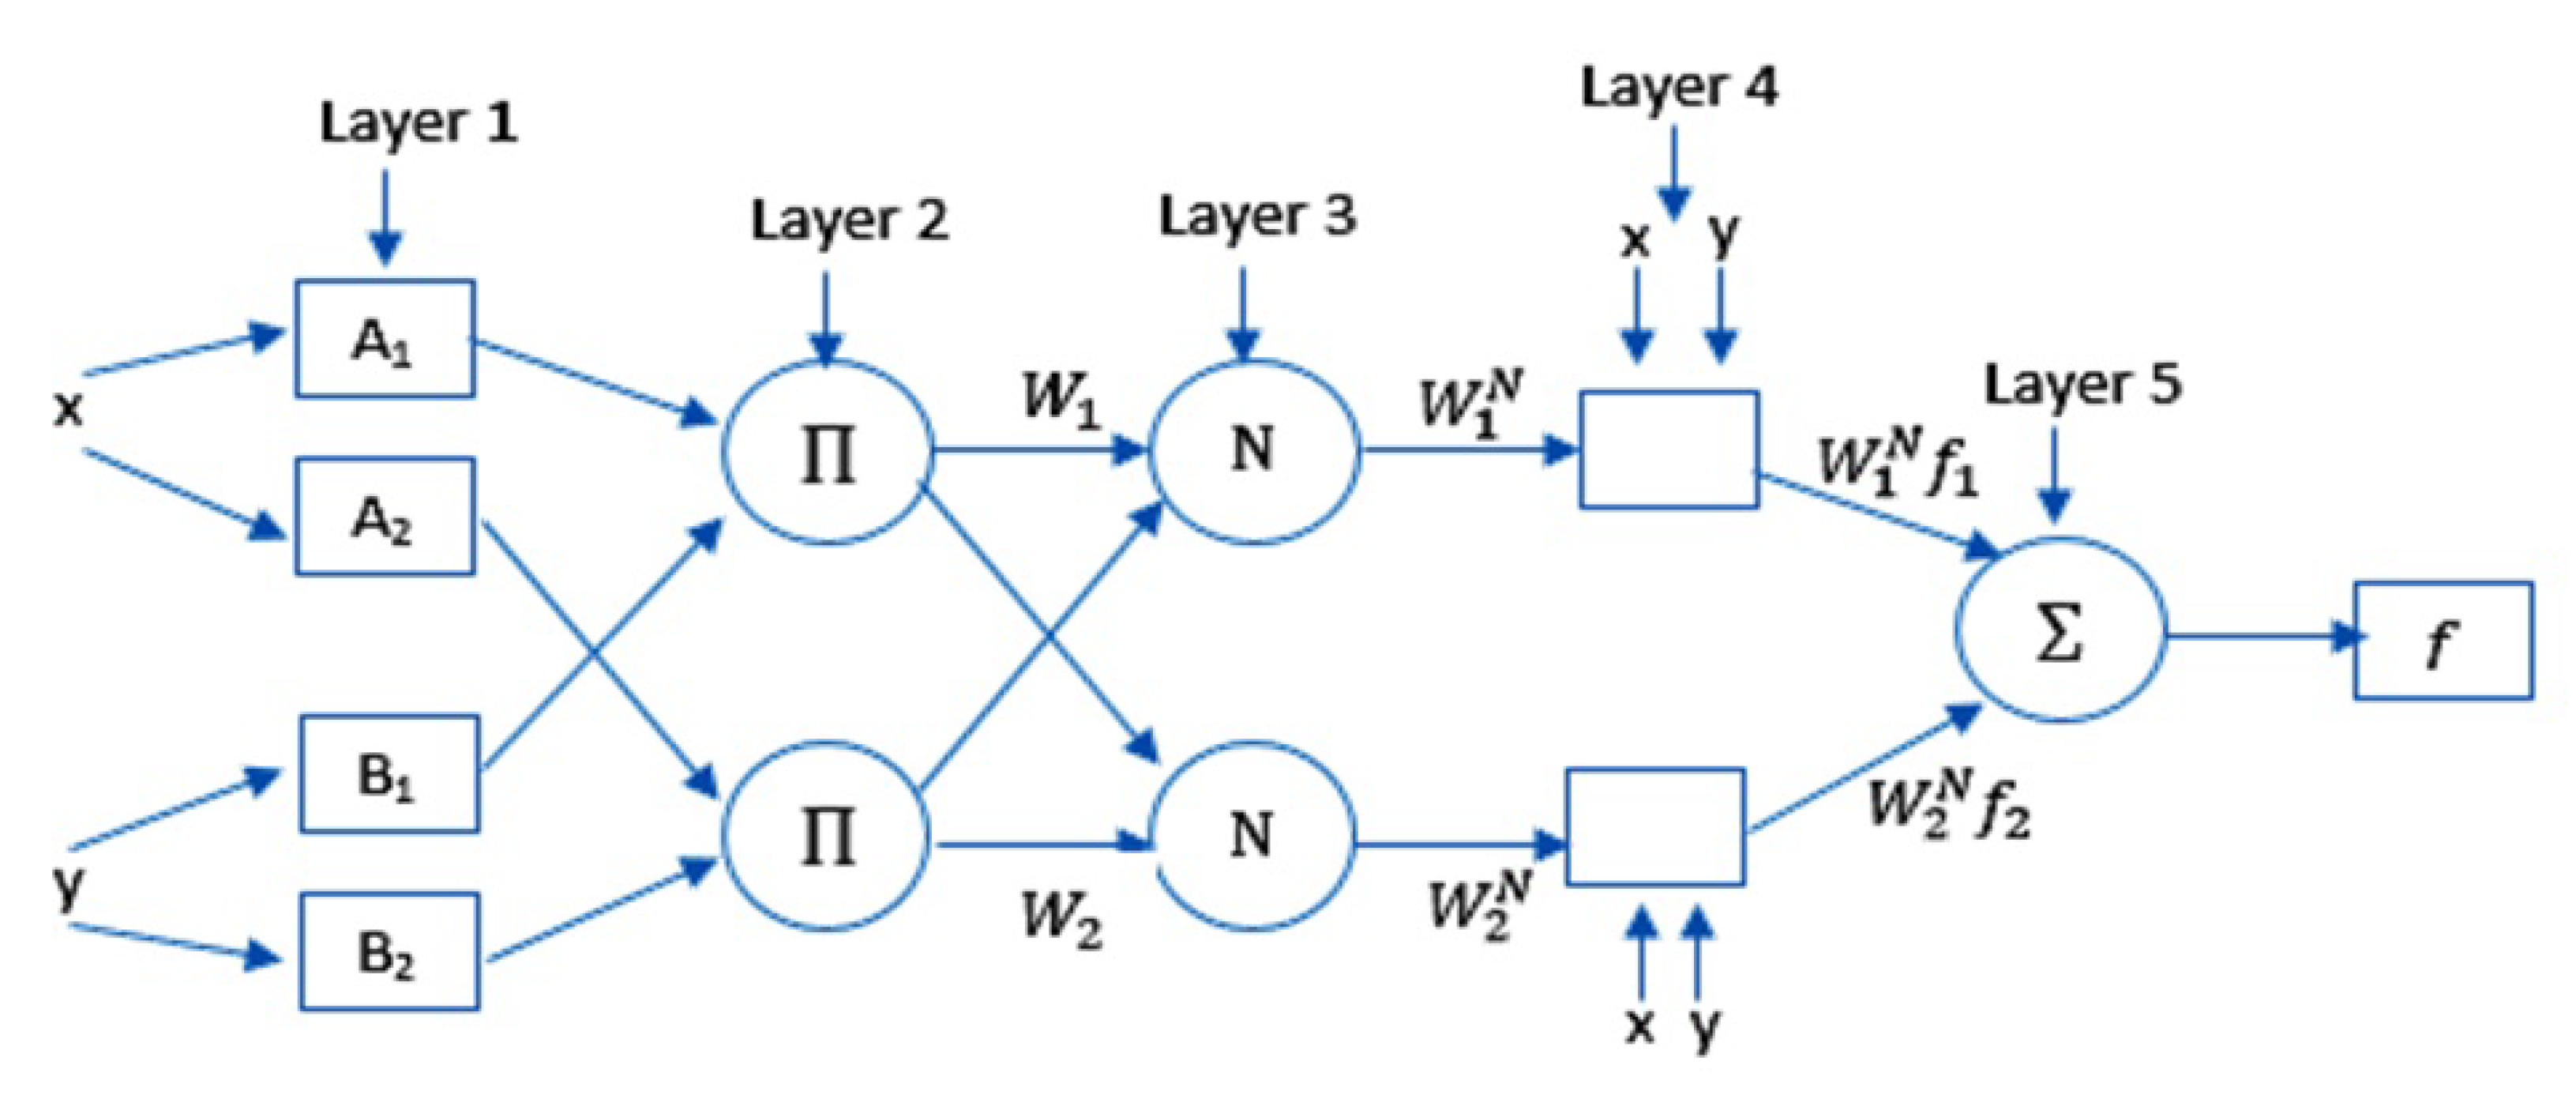
The principles of the ANFIS are given in this section. The ANFIS model links the fuzzy logic and neural networks [22]. It generates a mapping between the input and output by applying IF-THEN rules (it is also called Takagi–Sugeno inference model). Figure 1 illustrates the ANFIS model where, y and x define the inputs to Layer 1 whereas, is its output of node i that is computed as follows:
where denotes the generalized Gaussian membership functions. and define the membership values of . and denote the premise parameters set.
The output of Layer 2 (it is also known as the firing strength of a rule) is calculated as follows:
Meanwhile, the output of Layer 3 (it is also known as the normalized firing strength) is calculated as follows:
The output of Layer 4 (it is also known as an adaptive node) is calculated as follows:
where , , and define the consequent parameters of the node i. Layer 5 contains only one node; its output is computed as:
2.2. Flower Pollination Algorithm (FPA)
Flower Pollination Algorithm is an optimization method proposed by Yang [38]. It simulates the transfer of flowers’ pollen by pollinators in nature. This algorithm utilizes the two types of pollination (i.e., self-pollination and cross-pollination). In self-pollination, the pollination occurs with no pollinators, whereas, in cross-pollination, the pollens are moved between different plants. In more detail, the self-pollination can be represented as a local pollination while the cross-pollination can be called global pollination.
The global pollination or cross-pollination can be mathematically formed as follows:
where defines the pollen i at iteration t. L denotes the pollination’s strength or the step size. is the target position or best solution. In some cases, insects can fly with different distance steps for a long space; therefore, Levy fly distribution is applied to simulate this movement.
where . denotes the gamma function. This distribution is available for large steps .
The self-pollination or local pollination can be mathematically formed as follows:
where and represent pollens from different flower in the same plant. in the range [0, 1]
The process of pollination can be done using cross-pollination or self-pollination. Therefore, the random variable p, in the range , is used to determine this process.
2.3. Salp Swarm Algorithm (SSA)
SSA is an optimization technique introduced by [48]. It simulates the Salps’ behavior in nature. This behavior is called salp chain. The mathematical model of SSA begins by splinting its population into a leader group and followers group. The leader is the front salp, whereas, the followers are the other salps. The search space is determined in n-dimensions with n variables. Equation (10) works to update the salps’ positions.
where denotes the leader’s position in j-th dimension. is the target position. and represent the max and min bounds, respectively. and denote random numbers in . is an important parameter; it balances between the exploration and exploitation phases. It is computed as follows:
where the current loop number is t and the max loop’ number is .
Then, the followers’ position is updated as follows:
where defines the i-th position of the follower in j-th dimension. i > 1.
3. The Proposed Method
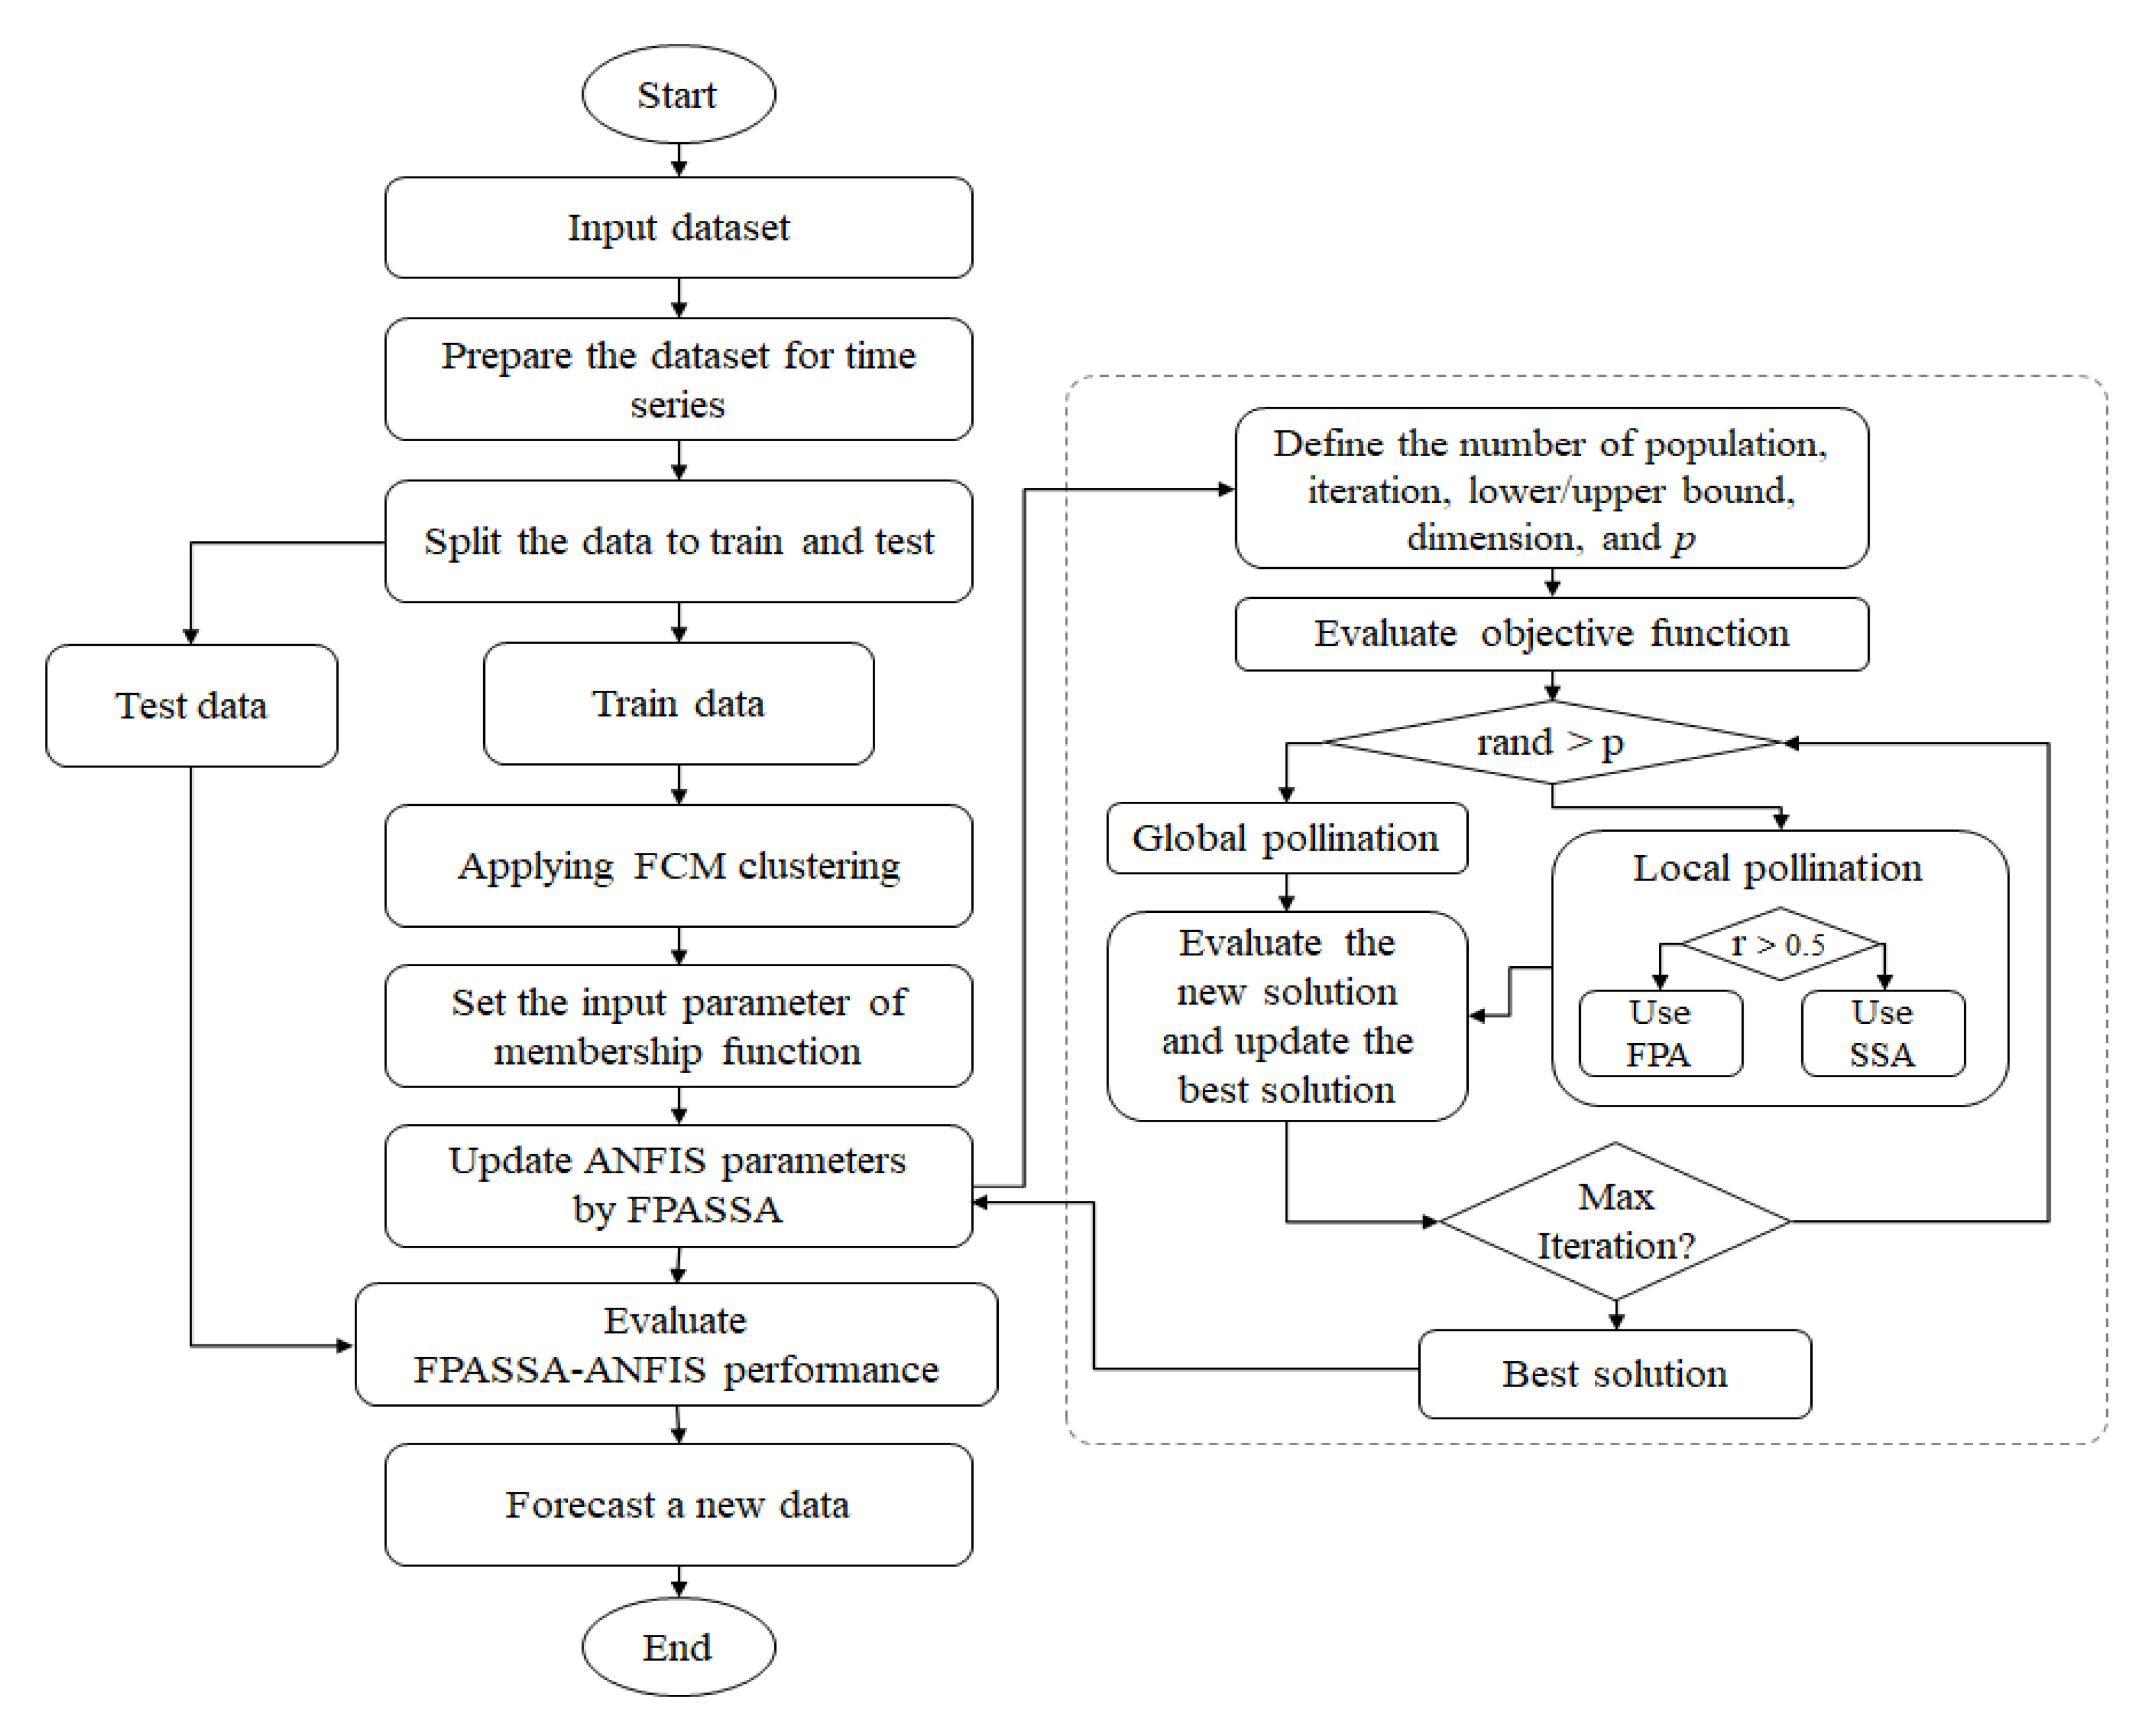
This section explains the proposed FPASSA-ANFIS method. It is a time series method for forecasting the confirmed cases of the COVID-19, as given in Figure 2.
The FPASSA-ANFIS utilizes the improved FPA to train the ANFIS model by optimizing its parameters. The FPASSA-ANFIS contains five layers as the classic ANFIS model. Layer 1 contains the input variables (the historical COVID-19 confirmed cases). Whereas Layer 5 produces the forecasted values. In the learning phase, the FPASSA is used to select the best weights between Layer 4 and Layer 5.
The FPASSA-ANFIS starts by formatting the input data in a time series form. In our case, the autocorrelation function (ACF) was considered. ACF is one of the methods applied to find patterns in the data; it presents information about the correlation between points separated by various time lags. Therefore, in this paper, the variables with ACF greater than 0.2 are considered i.e., 5-lags.
Besides, the training data contains 75% of the dataset, whereas the testing data contains 25% of them. The number of clusters is defined by the fuzzy c-mean (FCM) method to construct the ANFIS model.
The parameters of the ANFIS model are prepared by the FPASSA algorithm. In the training phase, the calculation error (as in Equation (13)) between the real data and the predicted data is used to evaluate the parameters’ quality.
where T is the real data, and P is the predicted data. is the sample length. The smaller values of the objective function indicate good ANFIS’s parameter.
On the other hand, the updating phase of the followers’ positions in the SSA algorithm is applied to improve the global pollination phase in the FPA algorithm. In this improvement, there is a random variable (r) used to switch between both phases. If , then the operators of the SSA is used; otherwise, the operators of the FPA are used. In general, The FPASSA starts by constructing the population (X); afterward, the objective function is calculated for each solution. The solution with the lowest error value is saved to the next iteration. This sequence is repeated until meeting the stop condition, which in this paper, is the maximum number of iterations. Then the best solution is passed to train the parameters of the ANFIS model.
After finishing the training phase, the testing phase is started with the best solution to compute the final output. The performance of the proposed method is evaluated by comparing the real data with the predicted data using the performance measures. Finally, the FPASSA produces a foretasted value for confirmed cases of COVID-19 in China in the next day. The steps of the proposed FPASSA are presented in Algorithm 1.
| Algorithm 1 Proposed FPASSA algorithm |
| Input: Historical COVID-19 dataset, size of population N, total number of iterations . Divide the data into training and testing sets. Using Fuzzy c-mean method to determine the number of membership functions. Constructing the ANFIS network. Set the initial value for N solutions (X). Set . while do Calculate the objective value for each . if then Apply the Global operators of FPA. else if then Using the operators of FPA to update . else Using the operators of SSA. end if end if end while Return the best solution that represents the best configuration for ANFIS. Apply the testing set to the best ANFIS model. Forecasting the COVID-19 for the next ten days. |
4. Experiment
This section presents the description of the used dataset, the performance measures, the parameter setting for all methods, the experiment results, and discussions.
4.1. Datasets Description
The main dataset of this study is COVID-19 dataset. It was collected from the WHO website (https://www.who.int/emergencies/diseases/novel-coronavirus-2019/situation-reports/). It contains the daily confirmed cases in China from 21 January 2020 to 18 February 2020, as shown in Table 1. We used 75% from the dataset to train the model while the rest is used to test it.
Moreover, we evaluated the performance of the proposed method using two datasets of weekly influenza confirmed cases. The first one is called DS1; it was collected from the Centers for Disease Control and Prevention (CDC) (https://www.cdc.gov/flu/weekly/). It starts from week number 40 in 2015 and continues until week number 6 in 2020. Whereas, the second one is called DS2. It was collected from the WHO website (https://www.who.int/influenza). It contains the data of weekly influenza confirmed cases in China from week number 1 in 2016 to week number 8 in 2020.
4.2. Performance Measures
The quality of the proposed method is evaluated using a set of performance metrics as follows:
- Root Mean Square Error (RMSE):where and Y are the predicted and original values, respectively.
- Mean Absolute Error (MAE):
- Mean Absolute Percentage Error (MAPE):
- Root Mean Squared Relative Error (RMSRE):represents the sample size of the data.
- Coefficient of Determination ():where represents the average of Y.
The lowest value of RMSE, MAE, MAPE, and RMSRE refers to the best method. The higher value of indicates better correlation for the method.
4.3. Parameter Settings
This paper aims to assess the ability of the FPASSA to forecast the COVID-19 by comparing its performance with other methods, namely the ANFIS and the trained ANFIS models using PSO, GA, ABC, FPA, and FPASSA. The parameters’ setting for these models is listed in Table 2.
4.4. Performance of FPASSA to Forecast DS1 and DS2
In this section, the performance of the proposed FPASSA to predict the DS1 and DS2 is discussed. It can be concluded from Table 3 that the performance of FPASSA outperformed the compared methods in all measures, whereas the FPA is ranked second. The results of DS2 indicate that the FPASSA is ranked first in terms of RMSE, MAPE, , and the CPU time. Whereas, the PSO is ranked second, followed by the FPA, GA, then ABC. These results denote that the proposed method can optimize the parameters of the ANFIS model effectively and produce good results in terms of the performance measures.
4.5. Influence of FPASSA to Forecast COVID-19
Comparison results between the proposed FPASSA and other models to forecast COVID-19 are given in Table 4. It can be concluded that the FPASSA outperforms other models. For example, by analyzing the results of RMSE, MAE, MAPE, RMSRE, and CPU time(s) it can be observed that the FPASSA achieves the smallest value among the comparison algorithms, and this indicates the high quality of the FPASSA. Meanwhile, the FPA allocates the second rank, which provides better results than the rest of the methods.
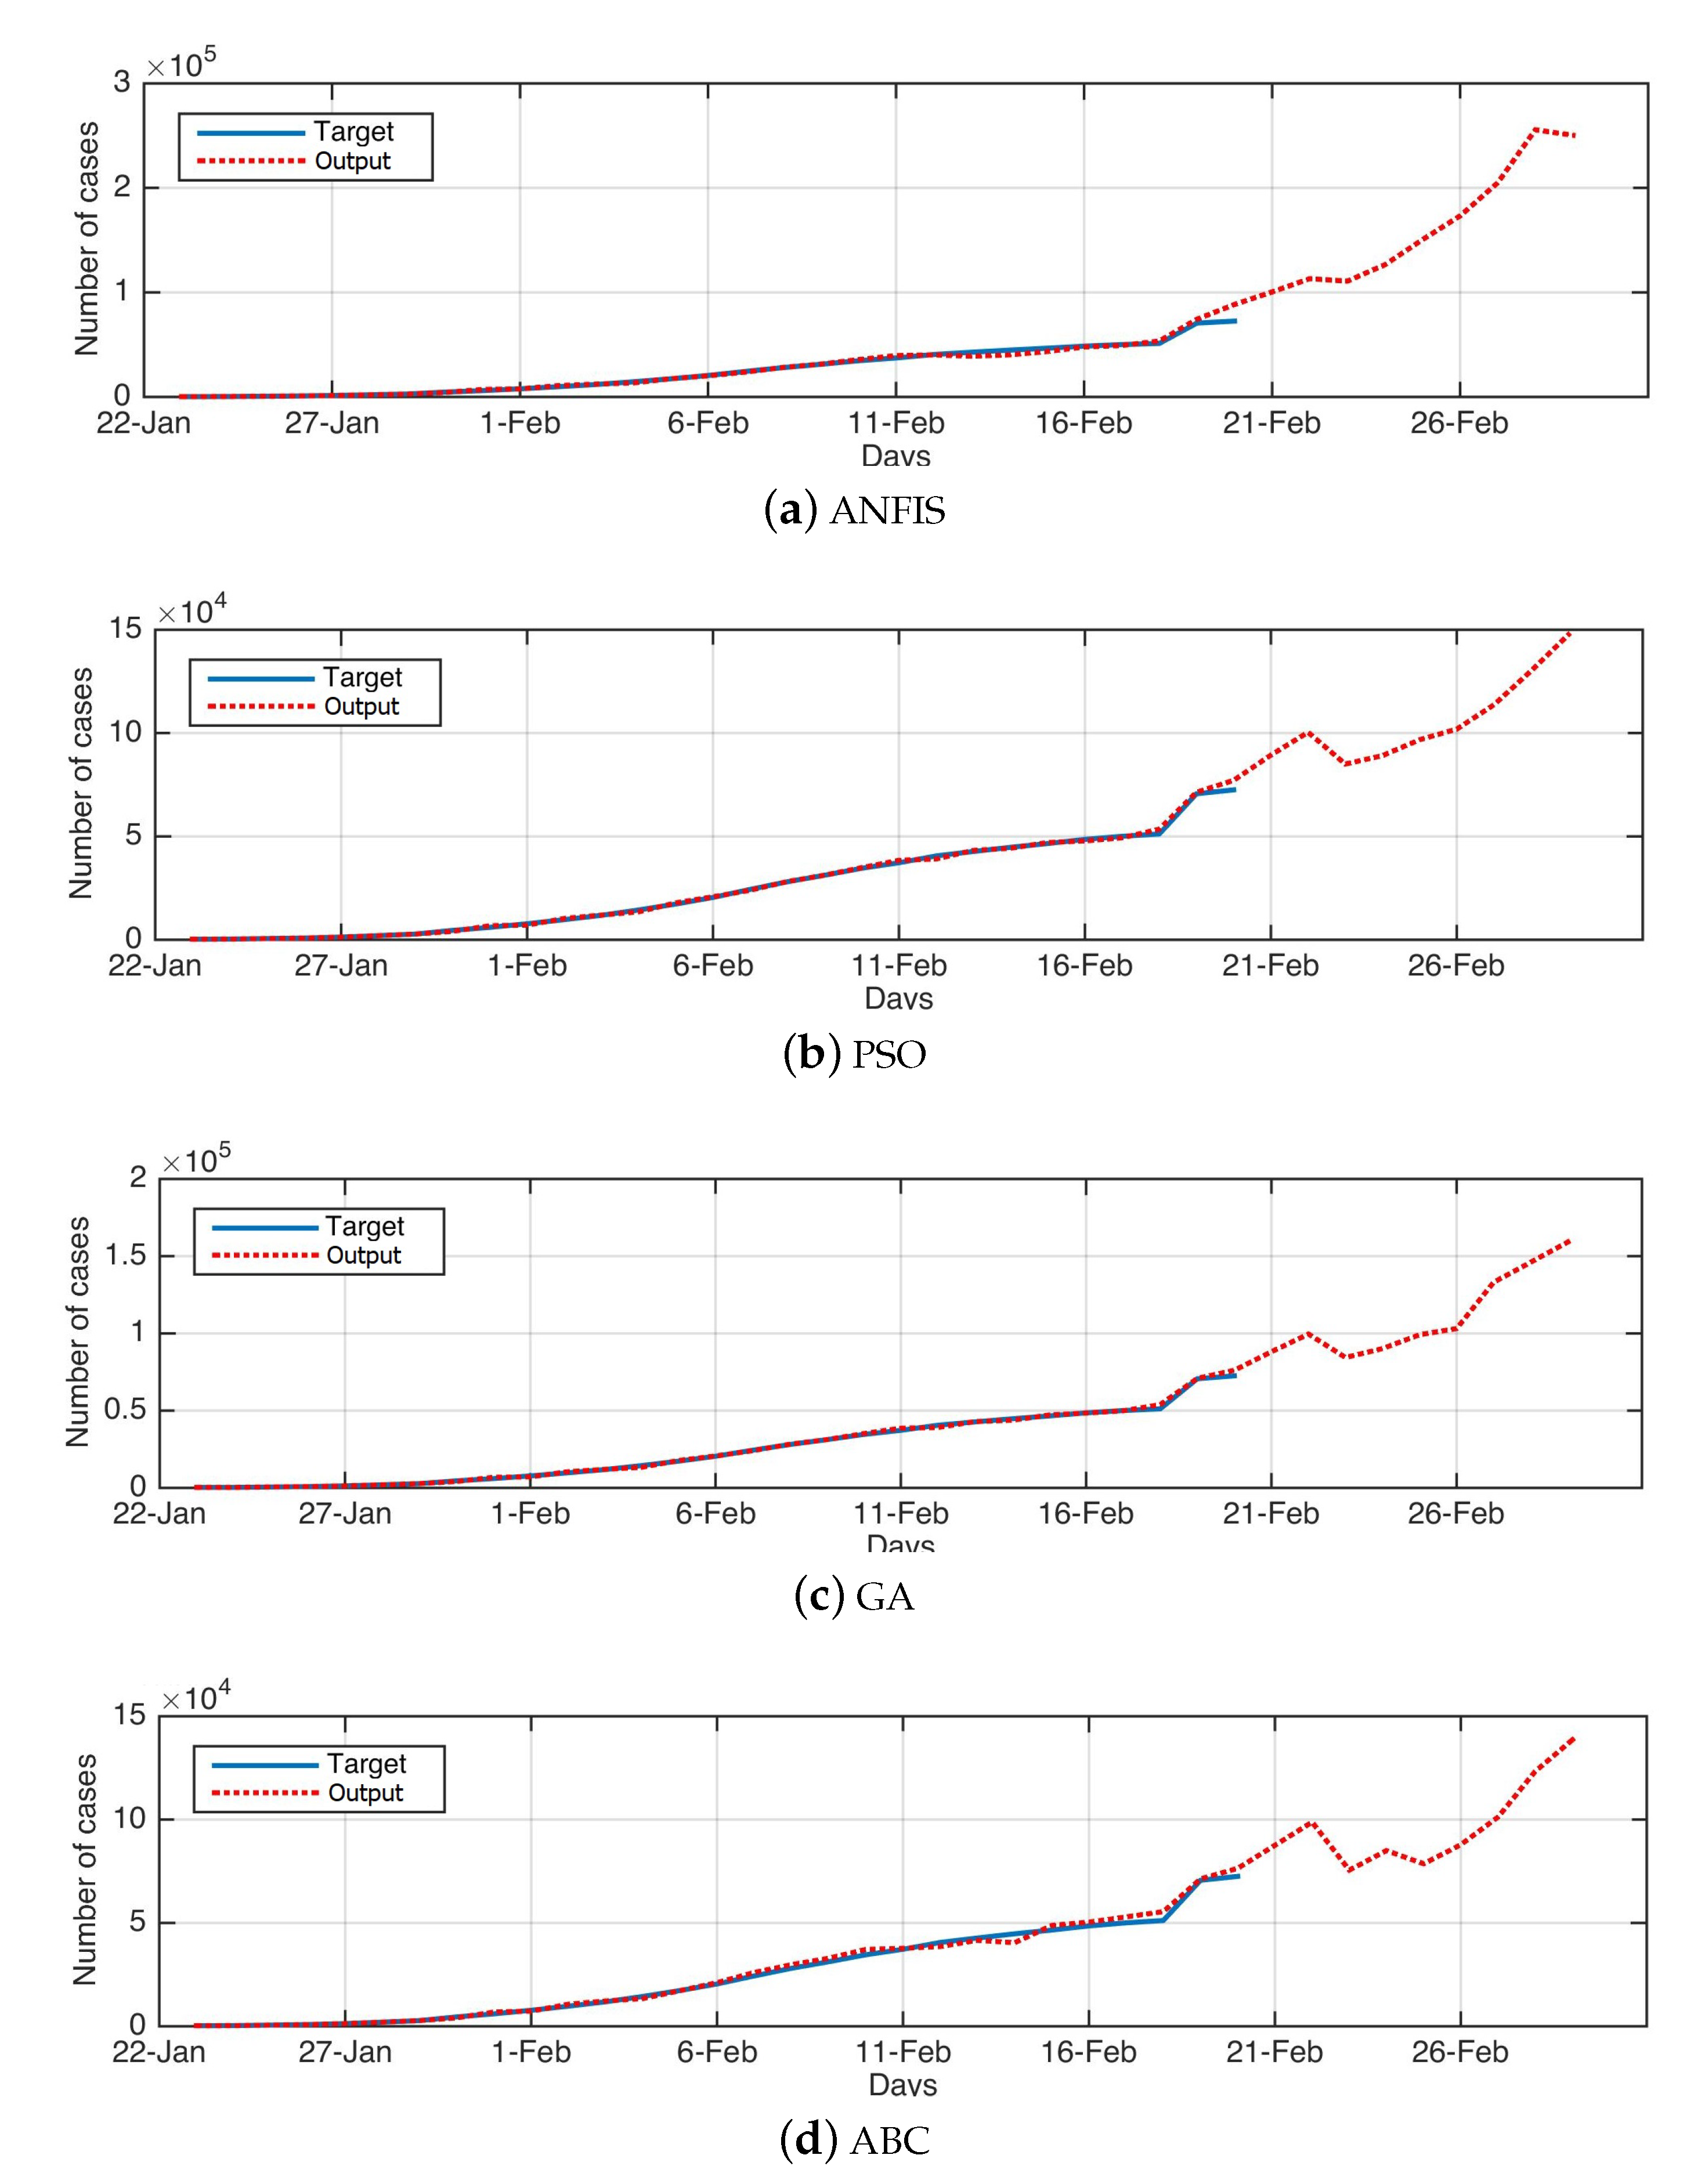
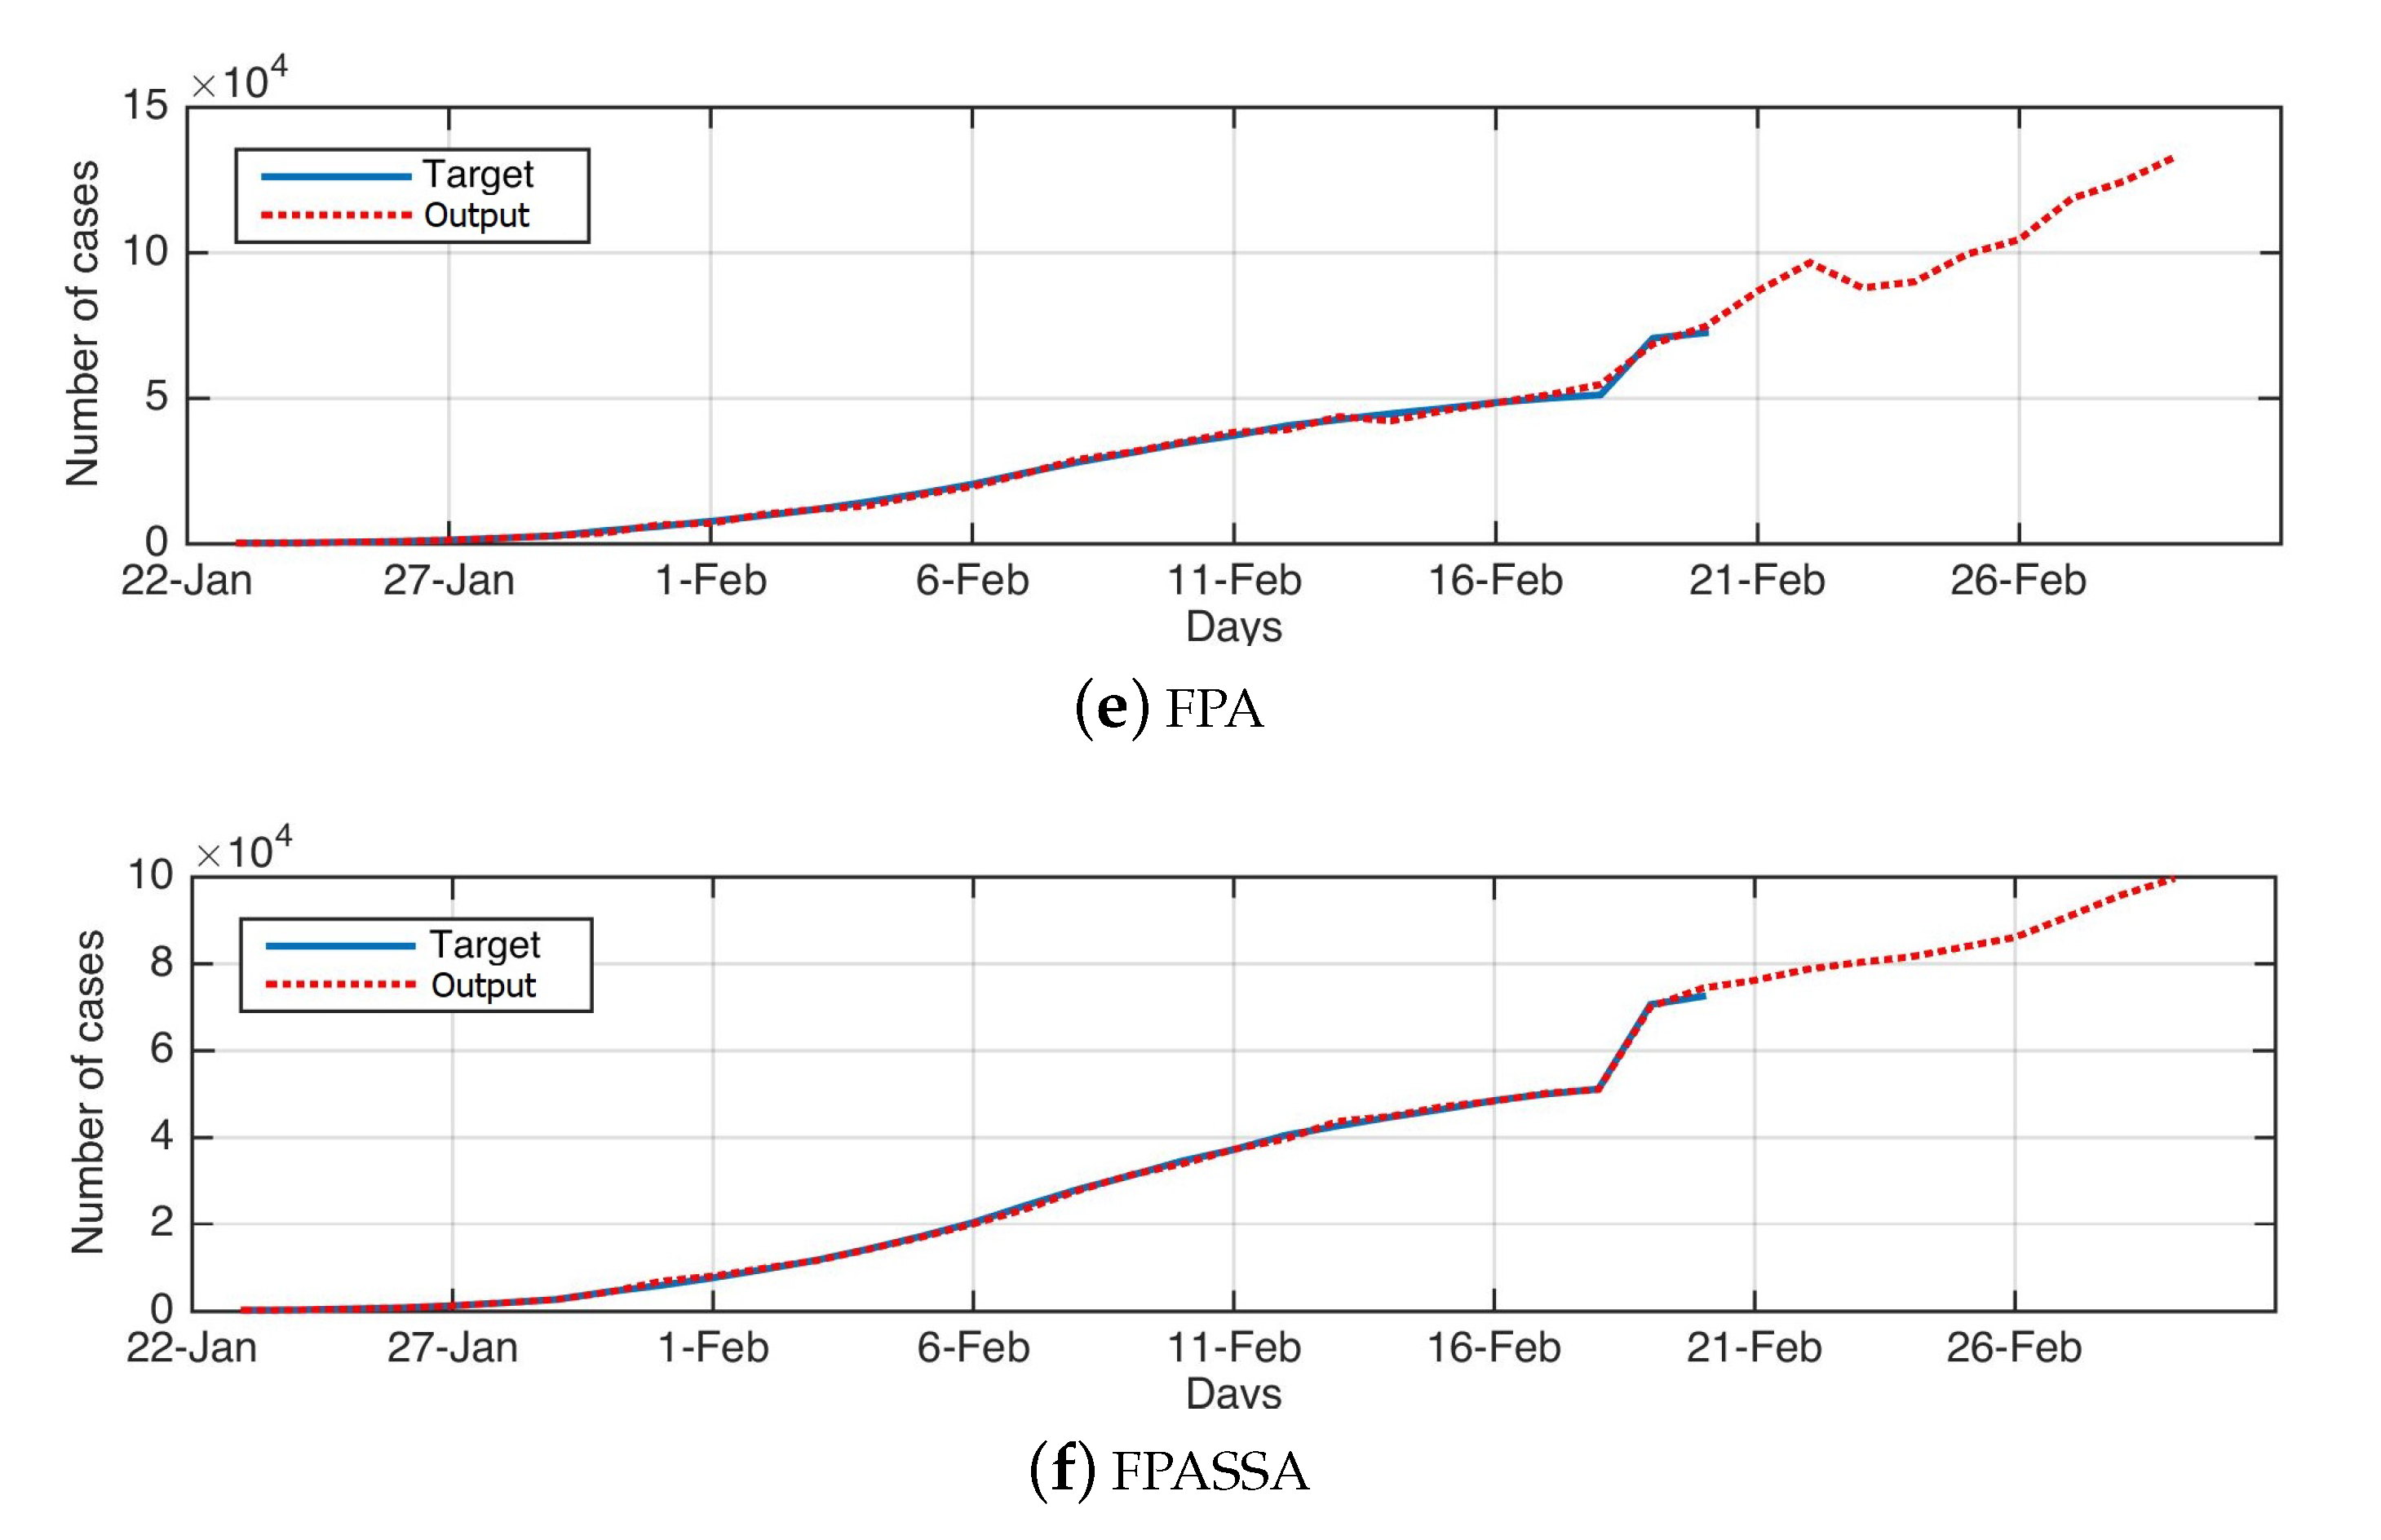
Moreover, the value of refers to the high correlation between the prediction obtained by the proposed FPASSA method and the original COVID-19, which has nearly 0.97. This can also be noticed from Figure 3, which depicts the training of the algorithms using the historical data of the COVID-19 as well as their forecasting values for ten days.
Table 5 depicts the forecasting value for the confirmed cases of the COVID-19 in China from 19/2/2020 to 28/2/2020. From these results, it can be noticed that the outbreak will reach its highest level on the day 28/2/2020. The average percentage of the increase over the forecasted period is 10%, the highest percentage is 12% on 28/2/2020, and the lowest percentage is 8.7% on 19/2/2020.
From the previous results, it can be concluded that the proposed FPASSA-ANFIS has a high ability to forecast the COVID-19 dataset. These results avoid the limitations of traditional ANFIS because of the combination with the modified FPA method. Moreover, the operators of SSA are combined with the local strategy of FPA to enhance their exploitation ability. However, the time computational of the proposed FPASSA method still requires more improvements.
5. Conclusions
This paper proposed a modified version for the flower pollination algorithm (FPA) using the salp swarm algorithm (SSA). This modified version, called FPASSA, is applied to improve the performance of the ANFIS through determining the optimal value for its parameters. The developed FPASSA-ANFIS model is applied as a forecasting technique for a novel coronavirus, called COVID-19, that was discovered in Wuhan, China at the end of last year and January of the current year. The proposed FPASSA-ANFIS model has a high ability to predict the number of confirmed cases within ten days. Besides, FPASSA-ANFIS outperforms other forecasting models in terms of RMSE, MAE, MAPE, RMSRE, and . Furthermore, two datasets of weekly influenza confirmed cases in the USA and China were used to evaluate the proposed method, and the evaluation outcomes showed its good performance. According to the promising results obtained by the proposed FPASSA-ANFIS, it can be applied in different forecasting applications.
Author Contributions
Data curation, M.A.A.A.-q.; Formal analysis, M.A.A.A.-q., A.A.E., and M.A.E.A.; Funding acquisition, H.F.; Methodology, M.A.A.A.-q., A.A.E., and M.A.E.A.; Software, M.A.E.A.; Supervision, H.F.; Validation, H.F.; Visualization, A.A.E.A.; Writing—original draft, M.A.A.A.-q., A.A.E., and M.A.E.A.; Writing—review & editing, H.F. All authors have read and agree to the published version of the manuscript.
Funding
This research was supported by the National Natural Science Foundation of China (Grant Nos., 91746206, 41471323).
Conflicts of Interest
The authors declare no conflict of interest.
References
- Chen, Y.; Liu, Q.; Guo, D. Emerging coronaviruses: Genome structure, replication, and pathogenesis. J. Med. Virol. 2020. [Google Scholar] [CrossRef]
- Ge, X.Y.; Li, J.L.; Yang, X.L.; Chmura, A.A.; Zhu, G.; Epstein, J.H.; Mazet, J.K.; Hu, B.; Zhang, W.; Peng, C.; et al. Isolation and characterization of a bat SARS-like coronavirus that uses the ACE2 receptor. Nature 2013, 503, 535–538. [Google Scholar] [CrossRef]
- Wang, L.F.; Shi, Z.; Zhang, S.; Field, H.; Daszak, P.; Eaton, B.T. Review of bats and SARS. Emerg. Infect. Dis. 2006, 12, 1834. [Google Scholar] [CrossRef]
- Cauchemez, S.; Van Kerkhove, M.; Riley, S.; Donnelly, C.; Fraser, C.; Ferguson, N. Transmission scenarios for Middle East Respiratory Syndrome Coronavirus (MERS-CoV) and how to tell them apart. Euro Surveill. Bull. Eur. Sur Les Mal. Transm. Eur. Commun. Dis. Bull. 2013, 18, 20503. [Google Scholar]
- WHO Organization. Novel Coronavirus (2019-nCoV) 2020. Available online: https://www.who.int/ (accessed on 27 January 2020).
- Lu, R.; Zhao, X.; Li, J.; Niu, P.; Yang, B.; Wu, H.; Wang, W.; Song, H.; Huang, B.; Zhu, N.; et al. Genomic characterisation and epidemiology of 2019 novel coronavirus: Implications for virus origins and receptor binding. Lancet 2020, 395, 565–574. [Google Scholar] [CrossRef] [Green Version]
- Cheng, Z.J.; Shan, J. 2019 Novel Coronavirus: Where We are and What We Know. Infection 2020. [Google Scholar] [CrossRef] [PubMed] [Green Version]
- Guan, W.J.; Ni, Z.Y.; Hu, Y.; Liang, W.H.; Ou, C.Q.; He, J.X.; Liu, L.; Shan, H.; Lei, C.L.; Hui, D.S.; et al. Clinical characteristics of 2019 novel coronavirus infection in China. medRxiv 2020. Available online: https://www.medrxiv.org/content/early/2020/02/09/2020.02.06.20020974.full.pdf (accessed on 9 February 2020). [CrossRef] [Green Version]
- Zhao, S.; Musa, S.S.; Lin, Q.; Ran, J.; Yang, G.; Wang, W.; Lou, Y.; Yang, L.; Gao, D.; He, D.; et al. Estimating the Unreported Number of Novel Coronavirus (2019-nCoV) Cases in China in the First Half of January 2020: A Data-Driven Modelling Analysis of the Early Outbreak. J. Clin. Med. 2020, 9, 388. [Google Scholar] [CrossRef] [Green Version]
- Nishiura, H.; Kobayashi, T.; Yang, Y.; Hayashi, K.; Miyama, T.; Kinoshita, R.; Linton, N.M.; Jung, S.m.; Yuan, B.; Suzuki, A.; et al. The Rate of Underascertainment of Novel Coronavirus (2019-nCoV) Infection: Estimation Using Japanese Passengers Data on Evacuation Flights. J. Clin. Med. 2020, 9, 419. [Google Scholar] [CrossRef] [Green Version]
- Tang, B.; Wang, X.; Li, Q.; Bragazzi, N.L.; Tang, S.; Xiao, Y.; Wu, J. Estimation of the Transmission Risk of the 2019-nCoV and Its Implication for Public Health Interventions. J. Clin. Med. 2020, 9, 462. [Google Scholar] [CrossRef] [Green Version]
- Thompson, R.N. Novel Coronavirus Outbreak in Wuhan, China, 2020: Intense Surveillance Is Vital for Preventing Sustained Transmission in New Locations. J. Clin. Med. 2020, 9, 498. [Google Scholar] [CrossRef] [PubMed] [Green Version]
- Jung, S.M.; Akhmetzhanov, A.R.; Hayashi, K.; Linton, N.M.; Yang, Y.; Yuan, B.; Kobayashi, T.; Kinoshita, R.; Nishiura, H. Real time estimation of the risk of death from novel coronavirus (2019-nCoV) infection: Inference using exported cases. J. Clin. Med. 2020, 9, 523. [Google Scholar] [CrossRef] [PubMed] [Green Version]
- DeFelice, N.B.; Little, E.; Campbell, S.R.; Shaman, J. Ensemble forecast of human West Nile virus cases and mosquito infection rates. Nat. Commun. 2017, 8, 1–6. [Google Scholar] [CrossRef] [PubMed] [Green Version]
- Ture, M.; Kurt, I. Comparison of four different time series methods to forecast hepatitis A virus infection. Expert Syst. Appl. 2006, 31, 41–46. [Google Scholar] [CrossRef]
- Shaman, J.; Karspeck, A. Forecasting seasonal outbreaks of influenza. Proc. Natl. Acad. Sci. USA 2012, 109, 20425–20430. [Google Scholar] [CrossRef] [Green Version]
- Shaman, J.; Karspeck, A.; Yang, W.; Tamerius, J.; Lipsitch, M. Real-time influenza forecasts during the 2012–2013 season. Nat. Commun. 2013, 4, 1–10. [Google Scholar] [CrossRef]
- Shaman, J.; Yang, W.; Kandula, S. Inference and forecast of the current West African Ebola outbreak in Guinea, Sierra Leone and Liberia. PLoS Curr. 2014, 6. [Google Scholar] [CrossRef] [PubMed]
- Massad, E.; Burattini, M.N.; Lopez, L.F.; Coutinho, F.A. Forecasting versus projection models in epidemiology: The case of the SARS epidemics. Med. Hypotheses 2005, 65, 17–22. [Google Scholar] [CrossRef]
- Ong, J.B.S.; Mark, I.; Chen, C.; Cook, A.R.; Lee, H.C.; Lee, V.J.; Lin, R.T.P.; Tambyah, P.A.; Goh, L.G. Real-time epidemic monitoring and forecasting of H1N1-2009 using influenza-like illness from general practice and family doctor clinics in Singapore. PLoS ONE 2010, 5. [Google Scholar] [CrossRef] [Green Version]
- Nah, K.; Otsuki, S.; Chowell, G.; Nishiura, H. Predicting the international spread of Middle East respiratory syndrome (MERS). BMC Infect. Dis. 2016, 16, 356. [Google Scholar] [CrossRef] [Green Version]
- Jang, J.S. ANFIS: Adaptive-network-based fuzzy inference system. IEEE Trans. Syst. Man Cybern. 1993, 23, 665–685. [Google Scholar] [CrossRef]
- Wei, L.Y. A hybrid ANFIS model based on empirical mode decomposition for stock time series forecasting. Appl. Soft Comput. 2016, 42, 368–376. [Google Scholar] [CrossRef]
- Cheng, C.H.; Wei, L.Y.; Liu, J.W.; Chen, T.L. OWA-based ANFIS model for TAIEX forecasting. Econ. Model. 2013, 30, 442–448. [Google Scholar] [CrossRef]
- Pousinho, H.M.I.; Mendes, V.; Catalão, J.P.d.S. Short-term electricity prices forecasting in a competitive market by a hybrid PSO–ANFIS approach. Int. J. Electr. Power Energy Syst. 2012, 39, 29–35. [Google Scholar] [CrossRef] [Green Version]
- Svalina, I.; Galzina, V.; Lujić, R.; ŠImunović, G. An adaptive network-based fuzzy inference system (ANFIS) for the forecasting: The case of close price indices. Expert Syst. Appl. 2013, 40, 6055–6063. [Google Scholar] [CrossRef]
- Ekici, B.B.; Aksoy, U.T. Prediction of building energy needs in early stage of design by using ANFIS. Expert Syst. Appl. 2011, 38, 5352–5358. [Google Scholar] [CrossRef]
- Cheng, C.H.; Wei, L.Y. One step-ahead ANFIS time series model for forecasting electricity loads. Optim. Eng. 2010, 11, 303–317. [Google Scholar] [CrossRef]
- Kumar, D.T.; Soleimani, H.; Kannan, G. Forecasting return products in an integrated forward/reverse supply chain utilizing an ANFIS. Int. J. Appl. Math. Comput. Sci. 2014, 24, 669–682. [Google Scholar] [CrossRef] [Green Version]
- Ho, Y.C.; Tsai, C.T. Comparing ANFIS and SEM in linear and nonlinear forecasting of new product development performance. Expert Syst. Appl. 2011, 38, 6498–6507. [Google Scholar] [CrossRef]
- Catalão, J.P.d.S.; Pousinho, H.M.I.; Mendes, V.M.F. Hybrid wavelet-PSO-ANFIS approach for short-term electricity prices forecasting. IEEE Trans. Power Syst. 2010, 26, 137–144. [Google Scholar] [CrossRef]
- Bagheri, A.; Peyhani, H.M.; Akbari, M. Financial forecasting using ANFIS networks with quantum-behaved particle swarm optimization. Expert Syst. Appl. 2014, 41, 6235–6250. [Google Scholar] [CrossRef]
- Ewees, A.A.; El Aziz, M.A.; Elhoseny, M. Social-spider optimization algorithm for improving ANFIS to predict biochar yield. In Proceedings of the 2017 8th International Conference on Computing, Communication and Networking Technologies (ICCCNT), Delhi, India, 3–5 July 2017; pp. 1–6. [Google Scholar]
- Al-Qaness, M.A.; Elaziz, M.A.; Ewees, A.A. Oil consumption forecasting using optimized adaptive neuro-fuzzy inference system based on sine cosine algorithm. IEEE Access 2018, 6, 68394–68402. [Google Scholar] [CrossRef]
- Al-Qaness, M.A.; Abd Elaziz, M.; Ewees, A.A.; Cui, X. A Modified Adaptive Neuro-Fuzzy Inference System Using Multi-Verse Optimizer Algorithm for Oil Consumption Forecasting. Electronics 2019, 8, 1071. [Google Scholar] [CrossRef] [Green Version]
- El Aziz, M.A.; Hemdan, A.M.; Ewees, A.A.; Elhoseny, M.; Shehab, A.; Hassanien, A.E.; Xiong, S. Prediction of biochar yield using adaptive neuro-fuzzy inference system with particle swarm optimization. In Proceedings of the 2017 IEEE PES PowerAfrica, Accra, Ghana, 27–30 June 2017; pp. 115–120. [Google Scholar]
- Elaziz, M.A.; Ewees, A.A.; Alameer, Z. Improving adaptive neuro-fuzzy inference system based on a modified salp swarm algorithm using genetic algorithm to forecast crude oil price. Nat. Resour. Res. 2019, 1–16. [Google Scholar] [CrossRef]
- Yang, X.S. Flower pollination algorithm for global optimization. In International Conference on Unconventional Computing and Natural Computation; Springer: Berlin, Germany, 2012; pp. 240–249. [Google Scholar]
- Alam, D.; Yousri, D.; Eteiba, M. Flower pollination algorithm based solar PV parameter estimation. Energy Convers. Manag. 2015, 101, 410–422. [Google Scholar] [CrossRef]
- Ram, J.P.; Babu, T.S.; Dragicevic, T.; Rajasekar, N. A new hybrid bee pollinator flower pollination algorithm for solar PV parameter estimation. Energy Convers. Manag. 2017, 135, 463–476. [Google Scholar] [CrossRef]
- Abdel-Raouf, O.; El-Henawy, I.; Abdel-Baset, M. A novel hybrid flower pollination algorithm with chaotic harmony search for solving sudoku puzzles. Int. J. Mod. Educ. Comput. Sci. 2014, 6, 38. [Google Scholar] [CrossRef]
- Rodrigues, D.; Yang, X.S.; De Souza, A.N.; Papa, J.P. Binary flower pollination algorithm and its application to feature selection. In Recent Advances in Swarm Intelligence and Evolutionary Computation; Springer: Berlin, Germany, 2015; pp. 85–100. [Google Scholar]
- Salgotra, R.; Singh, U.; Saha, S.; Nagar, A.K. Improved Flower Pollination Algorithm for Linear Antenna Design Problems. In Soft Computing for Problem Solving; Springer: Berlin, Germany, 2020; pp. 79–89. [Google Scholar]
- Priya, K.; Rajasekar, N. Application of flower pollination algorithm for enhanced proton exchange membrane fuel cell modelling. Int. J. Hydrog. Energy 2019, 44, 18438–18449. [Google Scholar] [CrossRef]
- Nguyen, T.T.; Pan, J.S.; Dao, T.K. An improved flower pollination algorithm for optimizing layouts of nodes in wireless sensor network. IEEE Access 2019, 7, 75985–75998. [Google Scholar] [CrossRef]
- Ahmed, K.; Ewees, A.A.; Hassanien, A.E. Prediction and management system for forest fires based on hybrid flower pollination optimization algorithm and adaptive neuro-fuzzy inference system. In Proceedings of the 2017 Eighth International Conference on Intelligent Computing and Information Systems (ICICIS), Cairo, Egypt, 5–7 December 2017; pp. 299–304. [Google Scholar]
- Al-Betar, M.A.; Awadallah, M.A.; Doush, I.A.; Hammouri, A.I.; Mafarja, M.; Alyasseri, Z.A.A. Island flower pollination algorithm for global optimization. J. Supercomput. 2019, 75, 5280–5323. [Google Scholar] [CrossRef]
- Mirjalili, S.; Gandomi, A.H.; Mirjalili, S.Z.; Saremi, S.; Faris, H.; Mirjalili, S.M. Salp Swarm Algorithm: A bio-inspired optimizer for engineering design problems. Adv. Eng. Softw. 2017, 114, 163–191. [Google Scholar] [CrossRef]
- Tubishat, M.; Idris, N.; Shuib, L.; Abushariah, M.A.; Mirjalili, S. Improved Salp Swarm Algorithm based on opposition based learning and novel local search algorithm for feature selection. Expert Syst. Appl. 2020, 145, 113122. [Google Scholar] [CrossRef]
- Neggaz, N.; Ewees, A.A.; Elaziz, M.A.; Mafarja, M. Boosting salp swarm algorithm by sine cosine algorithm and disrupt operator for feature selection. Expert Syst. Appl. 2020, 145, 113103. [Google Scholar] [CrossRef]
- Panda, N.; Majhi, S.K. How effective is the salp swarm algorithm in data classification. In Computational Intelligence in Pattern Recognition; Springer: Berlin, Germany, 2020; pp. 579–588. [Google Scholar]
- Alwerfali, H.S.N.; Elaziz, M.A.; Al-Qaness, M.A.; Abbasi, A.A.; Lu, S.; Liu, F.; Li, L. A Multilevel Image Thresholding Based on Hybrid Salp Swarm Algorithm and Fuzzy Entropy. IEEE Access 2019, 7, 181405–181422. [Google Scholar] [CrossRef]
- Alresheedi, S.S.; Lu, S.; Elaziz, M.A.; Ewees, A.A. Improved multiobjective salp swarm optimization for virtual machine placement in cloud computing. Hum.-Centric Comput. Inf. Sci. 2019, 9, 15. [Google Scholar] [CrossRef] [Green Version]
- Abualigah, L.; Shehab, M.; Alshinwan, M.; Alabool, H. Salp swarm algorithm: A comprehensive survey. Neural Comput. Appl. 2019. [Google Scholar] [CrossRef]
- Ahmed, K.; Ewees, A.A.; El Aziz, M.A.; Hassanien, A.E.; Gaber, T.; Tsai, P.W.; Pan, J.S. A hybrid krill-ANFIS model for wind speed forecasting. In International Conference on Advanced Intelligent Systems and Informatics; Springer: Berlin, Germany, 2016; pp. 365–372. [Google Scholar]
- Alameer, Z.; Elaziz, M.A.; Ewees, A.A.; Ye, H.; Jianhua, Z. Forecasting copper prices using hybrid adaptive neuro-fuzzy inference system and genetic algorithms. Nat. Resour. Res. 2019, 28, 1385–1401. [Google Scholar] [CrossRef]
Figure 1.
ANFIS model structure.

Figure 2.
The proposed FPASSA-ANFIS method.

Figure 3.
The real data (target) against the forecasted data (output) for all methods.


Table 1.
The dataset of the COVID-19.
| Date (D/M/Y) | Confirmed | Date (D/M/Y) | Confirmed | Date (D/M/Y) | Confirmed |
|---|---|---|---|---|---|
| 21/1/2020 | 278 | 31/1/2020 | 9720 | 10/2/2020 | 40,554 |
| 22/1/2020 | 309 | 1/2/2020 | 11,821 | 11/2/2020 | 42,708 |
| 23/1/2020 | 571 | 2/2/2020 | 14,411 | 12/2/2020 | 44,730 |
| 24/1/2020 | 830 | 3/2/2020 | 17,283 | 13/2/2020 | 46,550 |
| 25/1/2020 | 1297 | 4/2/2020 | 20,471 | 14/2/2020 | 48,548 |
| 26/1/2020 | 1985 | 5/2/2020 | 24,363 | 15/2/2020 | 50,054 |
| 27/1/2020 | 2741 | 6/2/2020 | 28,060 | 16/2/2020 | 51,174 |
| 28/1/2020 | 4537 | 7/2/2020 | 31,211 | 17/2/2020 | 70,635 |
| 29/1/2020 | 5997 | 8/2/2020 | 34,598 | 18/2/2020 | 72,528 |
| 30/1/2020 | 7736 | 9/2/2020 | 37,251 |
Table 2.
Parameters’ setting.
| Algorithm | Parameters Setting |
|---|---|
| ANFIS | |
| GA-ANFIS | |
| PSO-ANFIS | |
| ABC-ANFIS | |
| FPA-ANFIS | |
| FPASSA-ANFIS | ∈ [0, 1], ∈ [0, 1] |
Table 3.
Computational results for datasets of confirmed influenza cases.
| Dataset | Method | RMSE | MAE | MAPE | RMSRE | R2 | Time |
|---|---|---|---|---|---|---|---|
| DS1 | ANFIS | 952 | 570 | 37.61 | 0.551 | 0.969 | - |
| PSO | 798 | 494 | 34.13 | 0.510 | 0.978 | 25.43 | |
| GA | 766 | 480 | 35.44 | 0.530 | 0.98 | 28.70 | |
| ABC | 878 | 564 | 39.79 | 0.593 | 0.972 | 49.27 | |
| FPA | 618 | 411 | 37.69 | 0.570 | 0.979 | 24.58 | |
| FPASSA | 609 | 391 | 32.58 | 0.497 | 0.986 | 24.55 | |
| DS2 | ANFIS | 718 | 405 | 64.20 | 1.198 | 0.858 | - |
| PSO | 620 | 353 | 52.07 | 0.870 | 0.892 | 31.64 | |
| GA | 622 | 362 | 87.91 | 3.216 | 0.902 | 34.83 | |
| ABC | 696 | 433 | 53.30 | 1.101 | 0.887 | 60.87 | |
| FPA | 622 | 371 | 80.55 | 3.152 | 0.898 | 30.42 | |
| FPASSA | 619 | 367 | 45.02 | 0.887 | 0.909 | 30.39 |
Table 4.
Computational results for COVID-19.
| Method | RMSE | MAE | MAPE | RMSRE | R2 | Time |
|---|---|---|---|---|---|---|
| ANN | 8750 | 5413 | 13.09 | 0.204 | 0.8991 | - |
| KNN | 12,100 | 7671 | 8.32 | 0.130 | 0.7710 | - |
| SVR | 7822 | 5354 | 8.40 | 0.080 | 0.8910 | - |
| ANFIS | 7375 | 5523 | 5.32 | 0.09 | 0.9032 | - |
| PSO | 6842 | 4559 | 5.12 | 0.08 | 0.9492 | 24.18 |
| GA | 7194 | 4963 | 5.26 | 0.08 | 0.9575 | 27.02 |
| ABC | 8327 | 6066 | 6.86 | 0.10 | 0.7906 | 46.80 |
| FPA | 6059 | 4379 | 5.04 | 0.07 | 0.9439 | 23.41 |
| FPASSA | 5779 | 4271 | 4.79 | 0.07 | 0.9645 | 23.30 |
Table 5.
Forecasted confirmed cases of the COVID-19 by the proposed method.
| Data | Confirmed Cases (Expected) |
|---|---|
| 19/2/2020 | 74,406 |
| 20/2/2020 | 76,215 |
| 21/2/2020 | 78,728 |
| 22/2/2020 | 80,332 |
| 23/2/2020 | 81,617 |
| 24/2/2020 | 83,858 |
| 25/2/2020 | 86,115 |
| 26/2/2020 | 90,794 |
| 27/2/2020 | 95,695 |
| 28/2/2020 | 99,453 |
© 2020 by the authors. Licensee MDPI, Basel, Switzerland. This article is an open access article distributed under the terms and conditions of the Creative Commons Attribution (CC BY) license (http://creativecommons.org/licenses/by/4.0/).
Share and Cite
MDPI and ACS Style
Al-qaness, M.A.A.; Ewees, A.A.; Fan, H.; Abd El Aziz, M. Optimization Method for Forecasting Confirmed Cases of COVID-19 in China. J. Clin. Med. 2020, 9, 674. https://0-doi-org.brum.beds.ac.uk/10.3390/jcm9030674
AMA Style
Al-qaness MAA, Ewees AA, Fan H, Abd El Aziz M. Optimization Method for Forecasting Confirmed Cases of COVID-19 in China. Journal of Clinical Medicine. 2020; 9(3):674. https://0-doi-org.brum.beds.ac.uk/10.3390/jcm9030674
Chicago/Turabian StyleAl-qaness, Mohammed A. A., Ahmed A. Ewees, Hong Fan, and Mohamed Abd El Aziz. 2020. "Optimization Method for Forecasting Confirmed Cases of COVID-19 in China" Journal of Clinical Medicine 9, no. 3: 674. https://0-doi-org.brum.beds.ac.uk/10.3390/jcm9030674
Note that from the first issue of 2016, this journal uses article numbers instead of page numbers. See further details here.