Physiology and Yield of Confection Sunflower under Different Application Schemes of Mepiquat Chloride


Department of Agricultural Development, Democritus University of Thrace, GR-68200 Orestiada, Greece
*
Author to whom correspondence should be addressed.
Agriculture 2020, 10(1), 15; https://0-doi-org.brum.beds.ac.uk/10.3390/agriculture10010015
Submission received: 12 November 2019
/
Revised: 19 December 2019
/
Accepted: 8 January 2020
/
Published: 10 January 2020
(This article belongs to the Special Issue Innovative Agronomic Practices for Maximizing Crop Growth and Yield)
Abstract
:The use of plant growth regulator mepiquat chloride (MPC) has been a widespread practice for the control of vegetative growth in cotton production for several decades. As a growth retardant, MPC could potentially provide a means of controlling plant height in field sunflower (Helianthus annuus L.), but this possibility has not been studied. Field experiments over two years were conducted in northern Greece to study the influence of MPC at rates of 37.5 plus 37.5 g ha−1 (named double application) and 37.5 plus 37.5 plus 37.5 g ha−1 (named triple application) on sunflower growth and yield. MPC provided a height reduction of 9.5% (25 cm) with the double application and a height reduction of 14.4% (49.2 cm) with the triple application at maturity. The number of nodes was also reduced, indicating shorter plants, whereas stem width did not show a consistent response. Moreover, MPC resulted in increased crop growth rate with the triple application scheme. MPC reduced nitrogen utilization efficiency in both growing seasons. However, a reduction in achene yield per plant by 19.9% was observed with the triple application scheme. The achene yield reduction resulted by the reduction in the 100-achene weight (22.3%), given that the number of filled achenes was similar to control. None of the application schemes reduced seed nitrogen and oil content. The results from testing application schemes could be a basis for further research on the use of MPC in this crop, e.g., different timing of applications could be tested for benefits to height reduction.
1. Introduction
Plant growth regulators, both promoters and inhibitors, are chemicals designed to manipulate plant growth and development [1]. These regulators have been applied for specific purposes, e.g., to control plant height, to eliminate excessive vegetative growth, and to enhance flowering [2]. One of their main effects, particularly of the so-called growth retardants, is to limit stem growth (i.e., to shorten internode length). These substances usually do not affect flower development, although increased application rates or late applications can affect flower size and delay flowering. Growth retardants inhibit the production of gibberellic acid, which is involved in cellular elongation [3,4]. Consequently, cell elongation is reduced due to the lack of gibberellins, and plants do not grow as tall. Therefore, plants become more compact, with deep green foliage and prolonged postharvest life [2]. Nevertheless, applying plant growth regulators at incorrect rates or time can produce stunted plants that are of poor market suitability. This is often apparent for products that are effective at very low concentrations, such as paclobutrazol.
The substance mepiquat chloride (MPC) was introduced to the market as a plant growth regulator at the end of 1970s to limit excessive plant growth in cotton [5,6,7,8]. The mechanism of action of this growth regulator is related to the suppression of gibberellic acid, a growth stimulant that induces cell elongation in plants. In cotton, suppression of gibberellic acid decreases cell elongation as well as the vertical and horizontal elongation of stems and branches [5,9]. It should be noted that MPC inhibits cell expansion, but does not affect cell division. This growth regulator is not thought to be readily translocated through the plant. The overall effect of MPC on plant growth and development depends on growing conditions soon after application. Favorable growth conditions, such as optimal temperature and availability of soil moisture, typically increase the likelihood of realizing positive plant responses and benefits. Response of cotton yield to MPC has been inconsistent. The application of MPC led to increased yields in some studies [5], had no major impact in other studies [6,10], while causing a yield reduction in some others [11].
There is little information on the possibility of using MPC in sunflower. Nevertheless, it is often necessary to treat sunflower plants with a fungicide after flowering or apply a desiccant before harvest as a usual practice to achieve an economical and stable yield as well as to maintain oil quality. Given that the confection sunflower height may often reach 250 cm between flowering and harvest, these operations cannot be performed without some damage of the stand. Research pertaining to use of MPC for regulating plant height in sunflower is scarce, particularly under field conditions. Previous research showed that application of MPC at a rate of 25 g ha−1 provided a height reduction by 11.7% at maturity without any impact on achene and oil yields [12]. However, the same study suggested further research, including factors like different application schemes with multiple split applications at different rates or at different growth stages of the crop [12]. Moreover, a mepiquat application rate of 60 g a.i. ha−1 in the early growth stage (V4) of non-oilseed sunflower was the most effective on plant characteristics, and could be used as a means of reducing plant height in non-oilseed sunflower production [13]. Further research with plant growth regulators is always useful considering the inconsistent performance of these substances and the variable impact on growth pertaining to the application timing, application rate, and the interaction with the environmental conditions at the time or soon after application [14].
Control of plant height in sunflower is of great practical importance because it can provide lodging resistance to the plants and also facilitate mechanical harvest [15]. However, experimental data on this issue are limited. Thus, the goal of the current study was to investigate the impact of MPC applied on the foliage at 37.5 plus 37.5 g ha−1 (double application) and at 37.5 plus 37.5 plus 37.5 g ha−1 (triple application) on morphological traits and productivity of sunflower under field conditions.
2. Materials and Methods
2.1. Crop Establishment and Experimental Procedures
The effects of repeated foliar application of MPC were evaluated in two field experiments carried out for two growing seasons (GS) (2003 and 2004) in the area of Orestiada in Evros, Greece (41°33′ N, 26°31′ E). A locally adapted traditional variety of confection sunflower was tested. The soil was characterized as a clay loam soil (with a texture of 46.1% silt, 28.7% clay, and 25.2% sand). Basic properties of the soil included pH 6.6 (1:1 with water), organic matter 2.4%, and cation exchange capacity (CEC) 27.7 meq 100 g−1. Sugar beet (Beta vulgaris L.) was the previous land use in the field.
Seedbed preparation was done using conventional soil tillage (moldboard plough, chisel plough, and harrow twice). The crop was planted in spring (first week of May in the 1st GS and last week of April in the 2nd GS) in rows with a distance 75 cm and within-row distance of plants about 30 cm. A seed quantity of 7 kg ha−1 was used. A crop density of about 44,400 plants ha−1 was achieved according to common practices of farmers in the area. Plots consisted of 4 sunflower rows, each 8 m long. Before sowing, 50 kg N ha−1 as ammonium sulphate, 50 kg P2O5 ha−1 as superphosphate, and 50 kg K2O ha−1 as potassium sulfate were provided with broadcast application, followed by soil incorporation for meeting crop demands regarding the main macronutrients according to common practices of farmers in the area. Three irrigations were applied in each GS: two at the early vegetative stage and one before flowering. Weeds were removed by hand twice during the early vegetative stage.
In the 1st GS, MPC was applied twice at the rate of 37.5 plus 37.5 g ha−1 33 days after sowing (DAS) and ten days later. The first application took place at the stage of 5–6 true leaves of sunflower plants (growth stage BBCH 15–16) and the second application at the stage of 6–8 true leaves (growth stage BBCH 16–18) [16]. Because of poor results in terms of height reduction in the 1st GS, an additional earlier application of MPC was included in the 2nd GS to find an effective application plan. Therefore, in the 2nd GS, MPC was applied three times at 37.5 plus 37.5 plus 37.5 g ha−1. MPC was first applied 26 DAS at the 4–5 true leaves of sunflower plants (growth stage BBCH 14–15), followed by a second application two weeks later at the 5–6 leaves, and then by a third application within 6–8 true leaves, 10 days later. Non-treated plots were used as controls in both GS. A standard randomized complete block design (RCBD) was used. Treatments were replicated four times. A portable field plot sprayer was used for all MPC applications, calibrated to provide 500 L ha−1 at pressure of 250 kPa.
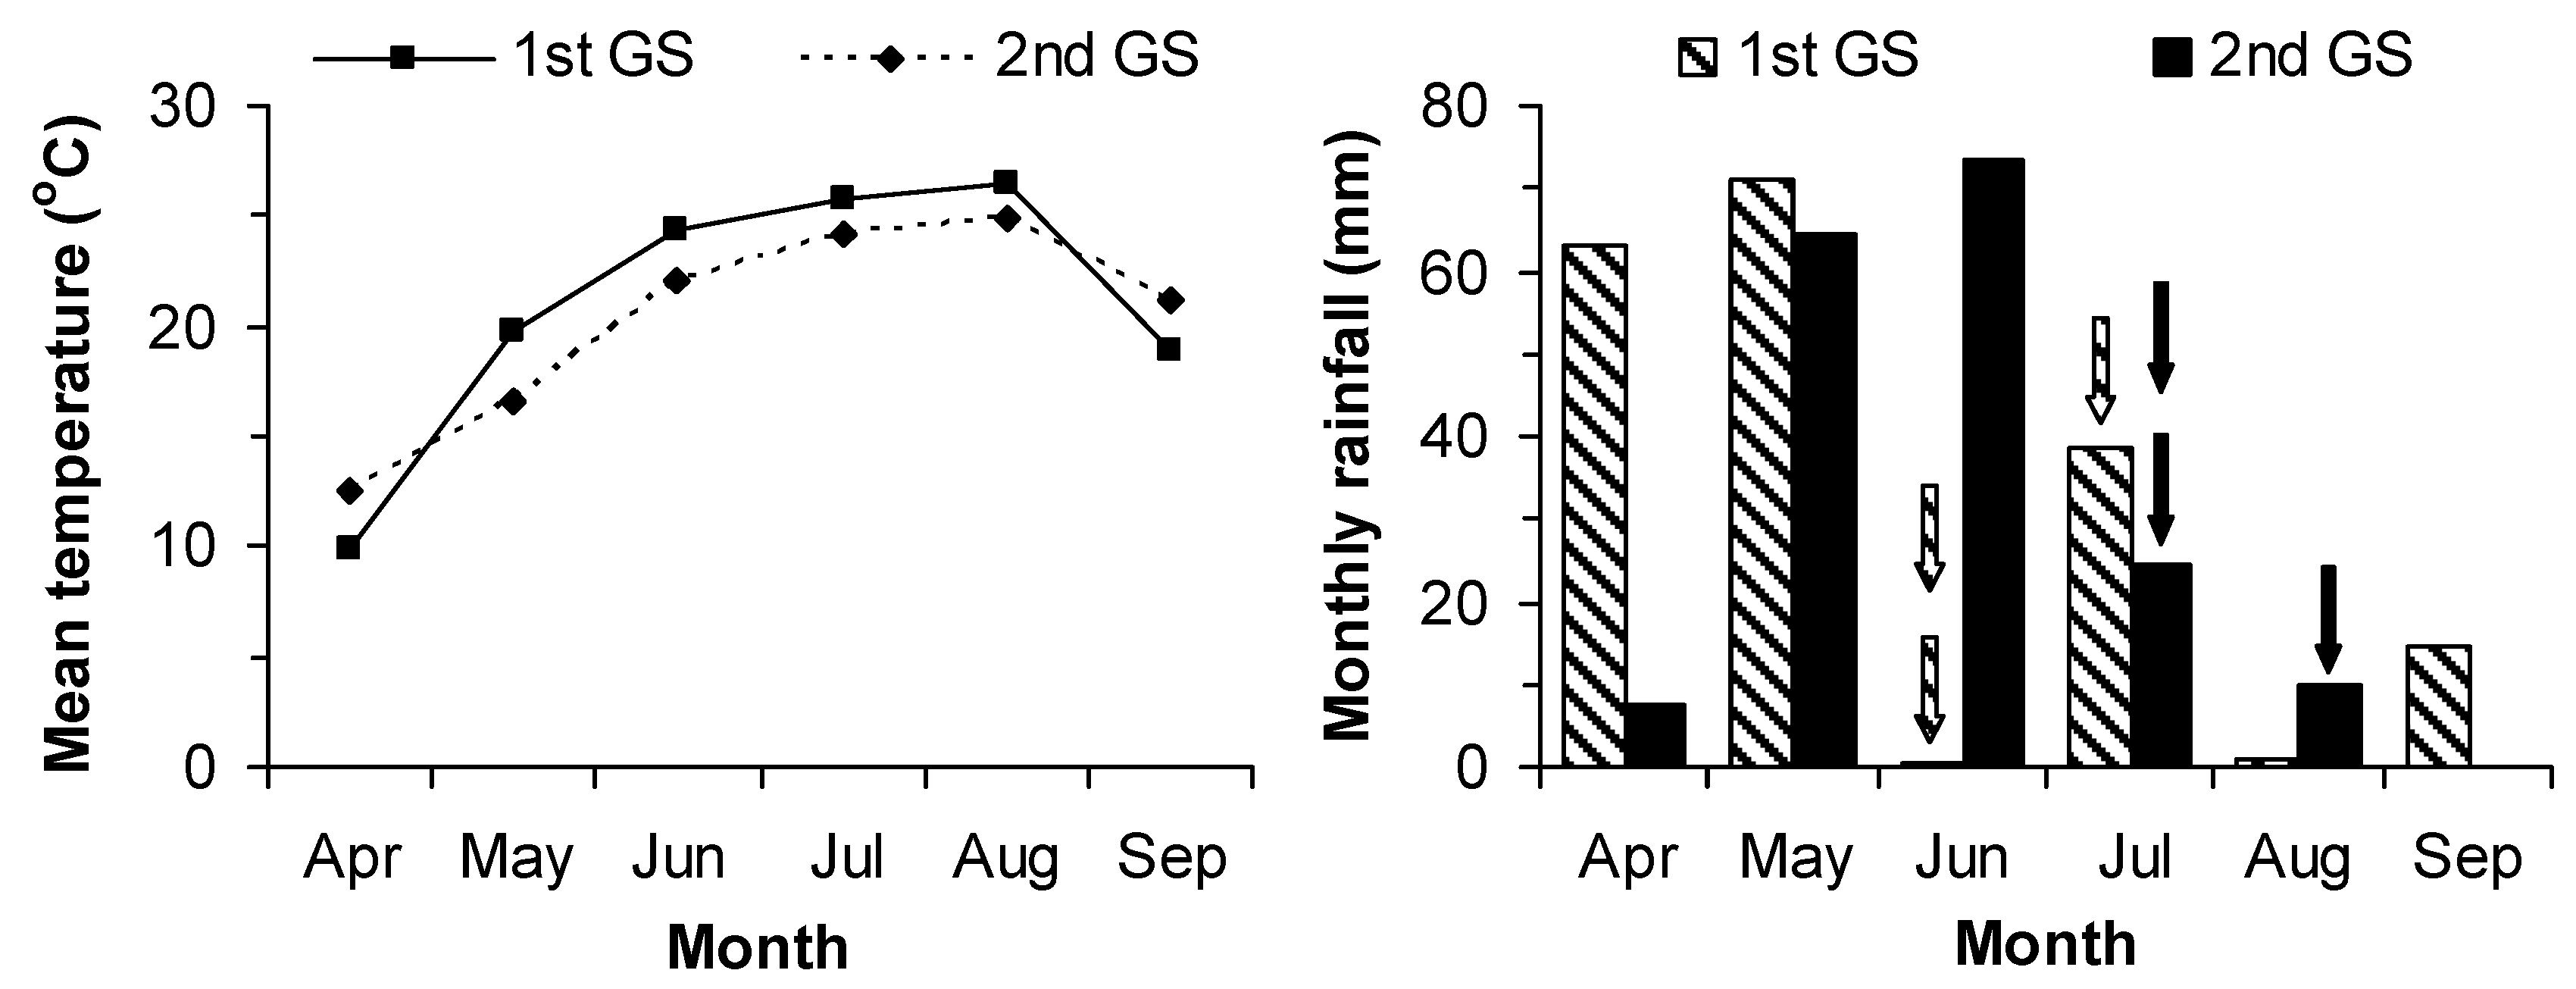
Temperature variation in each GS followed a similar pattern in both years (Figure 1). Mean temperature was 20.8 °C in the 1st GS and 20.2 °C in the 2nd GS. Total seasonal rainfall followed a different distribution pattern in each GS, but the total rainfall amount was similar in the two GS (188.3 mm vs. 180.1 mm). To avoid water stress, the crop was irrigated based on plants appearance and soil moisture depletion. In total, approximately 130 mm of irrigation water was applied in the 1st GS at 39, 57, and 75 DAS, and 110 mm in the 2nd GS at 67, 89, and 110 DAS (Figure 1).
2.2. Data Collection
Injury of sunflower plants was rated visually from 0% (indicating no injury) to 100% (indicating plant death) a week after MPC application. Ten plants from each plot were marked two days before the first application of MPC for the necessary recordings. At maturity, the variables of plant height, stem diameter, and stem nodes number were measured in those plants. Plant height was determined from the ground to the top point of the plant. The second plant internode was used for determining stem diameter. Moreover, plant samples consisted of an internal crop row 1 m long (i.e., three consecutive plants) from each plot taken at flowering and maturity to determine aboveground dry matter, according to the international literature [17,18]. At maturity, capitula were separated into achenes and vegetative parts and then achenes were manually separated into filled and empty. All plant samples were oven-dried at 70 °C until constant weight and then weighed. Achene yield (g per plant) was determined from filled achenes. Crop growth rate (CGR, kg ha−1 day−1) was determined as the ratio of dry matter increase between the two samplings to the corresponding number of days between samplings [19]. The macro-Kjeldahl procedure [20] was used for determining N content (%) in plant samples. In addition, the Soxhlet extraction method of the Society of American Oil Chemists [21] was employed to determine the percentage of achene oil. Nitrogen utilization efficiency (NUtE, kg kg−1) was calculated as the ratio between seed dry weight (kg ha−1) and total aboveground N content (kg ha−1) at maturity. Detection of mepiquat residues in harvests was not an objective of this study.
2.3. Data Analysis
An analysis of variance (ANOVA) was conducted with two treatments (MPC treatment and control) replicated four times [22] separately for each year, due to the extra application for MPC in the 2nd GS for finding an effective application plan. Means of each variable were compared with the Fisher’s protected LSD test at p < 0.05.
3. Results
No foliar injury on sunflower plants was detected 7 days after MPC application in both years. The double application of MPC (1st GS) provided shorter sunflower plants by 9.5% (or by 25 cm) compared with the control, while the triple application (2nd GS) caused a height reduction of 14.4% (i.e., by 49.2 cm) compared with the control (Figure 2a).
Fewer stem nodes per plant were observed with MPC treatments in both GS (17.4% in the 1st GS and 19% in the 2nd GS, Figure 2b), whereas stem width did not show a consistent response to MPC application (Figure 2c).
In both years, there was a trend for higher above ground biomass of plants treated with MPC compared with the control, both at flowering and maturity, but the effect was not significant (Figure 3a,b).
In the 1st GS, MPC treatment did not have any effect on achene yield per plant, whereas in the 2nd GS a significant reduction in achene yield per plant by 25% occurred (Figure 4a). MPC treatments did not affect the weight of 100-achenes (filled achenes) in the 1st GS, but provided lower 100-achene weight by 16.8% in the 2nd GS (Figure 4b).
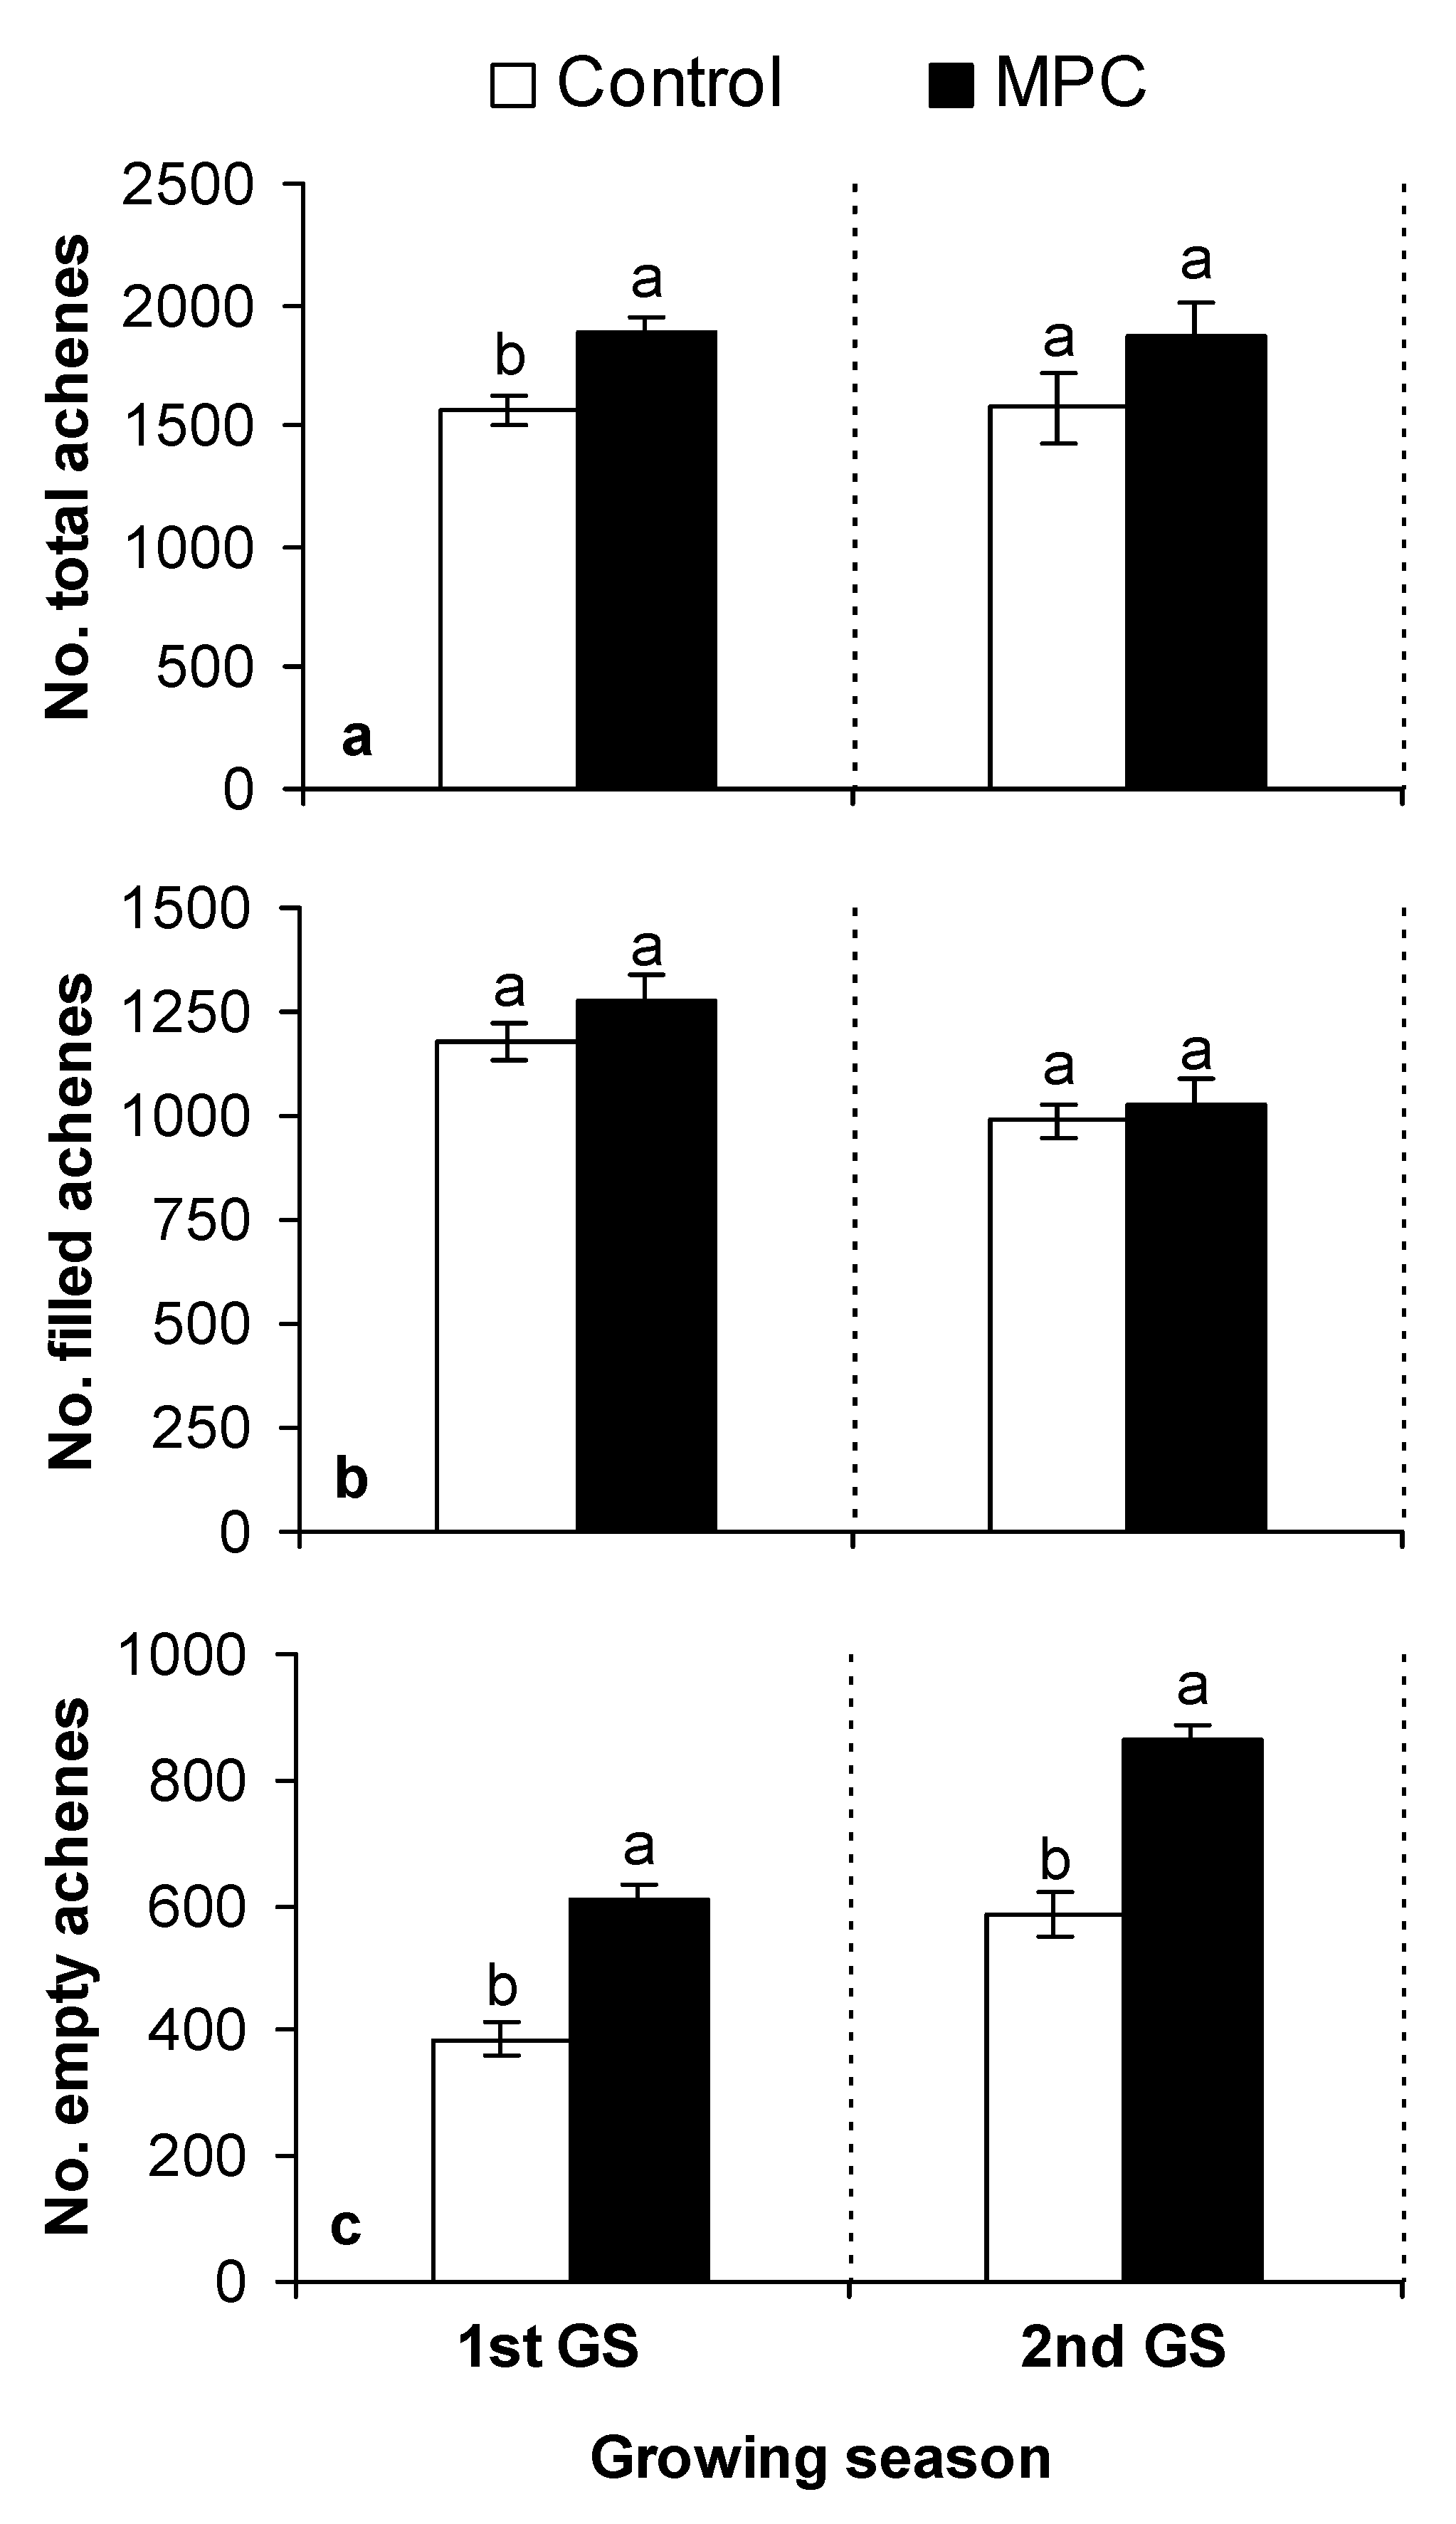
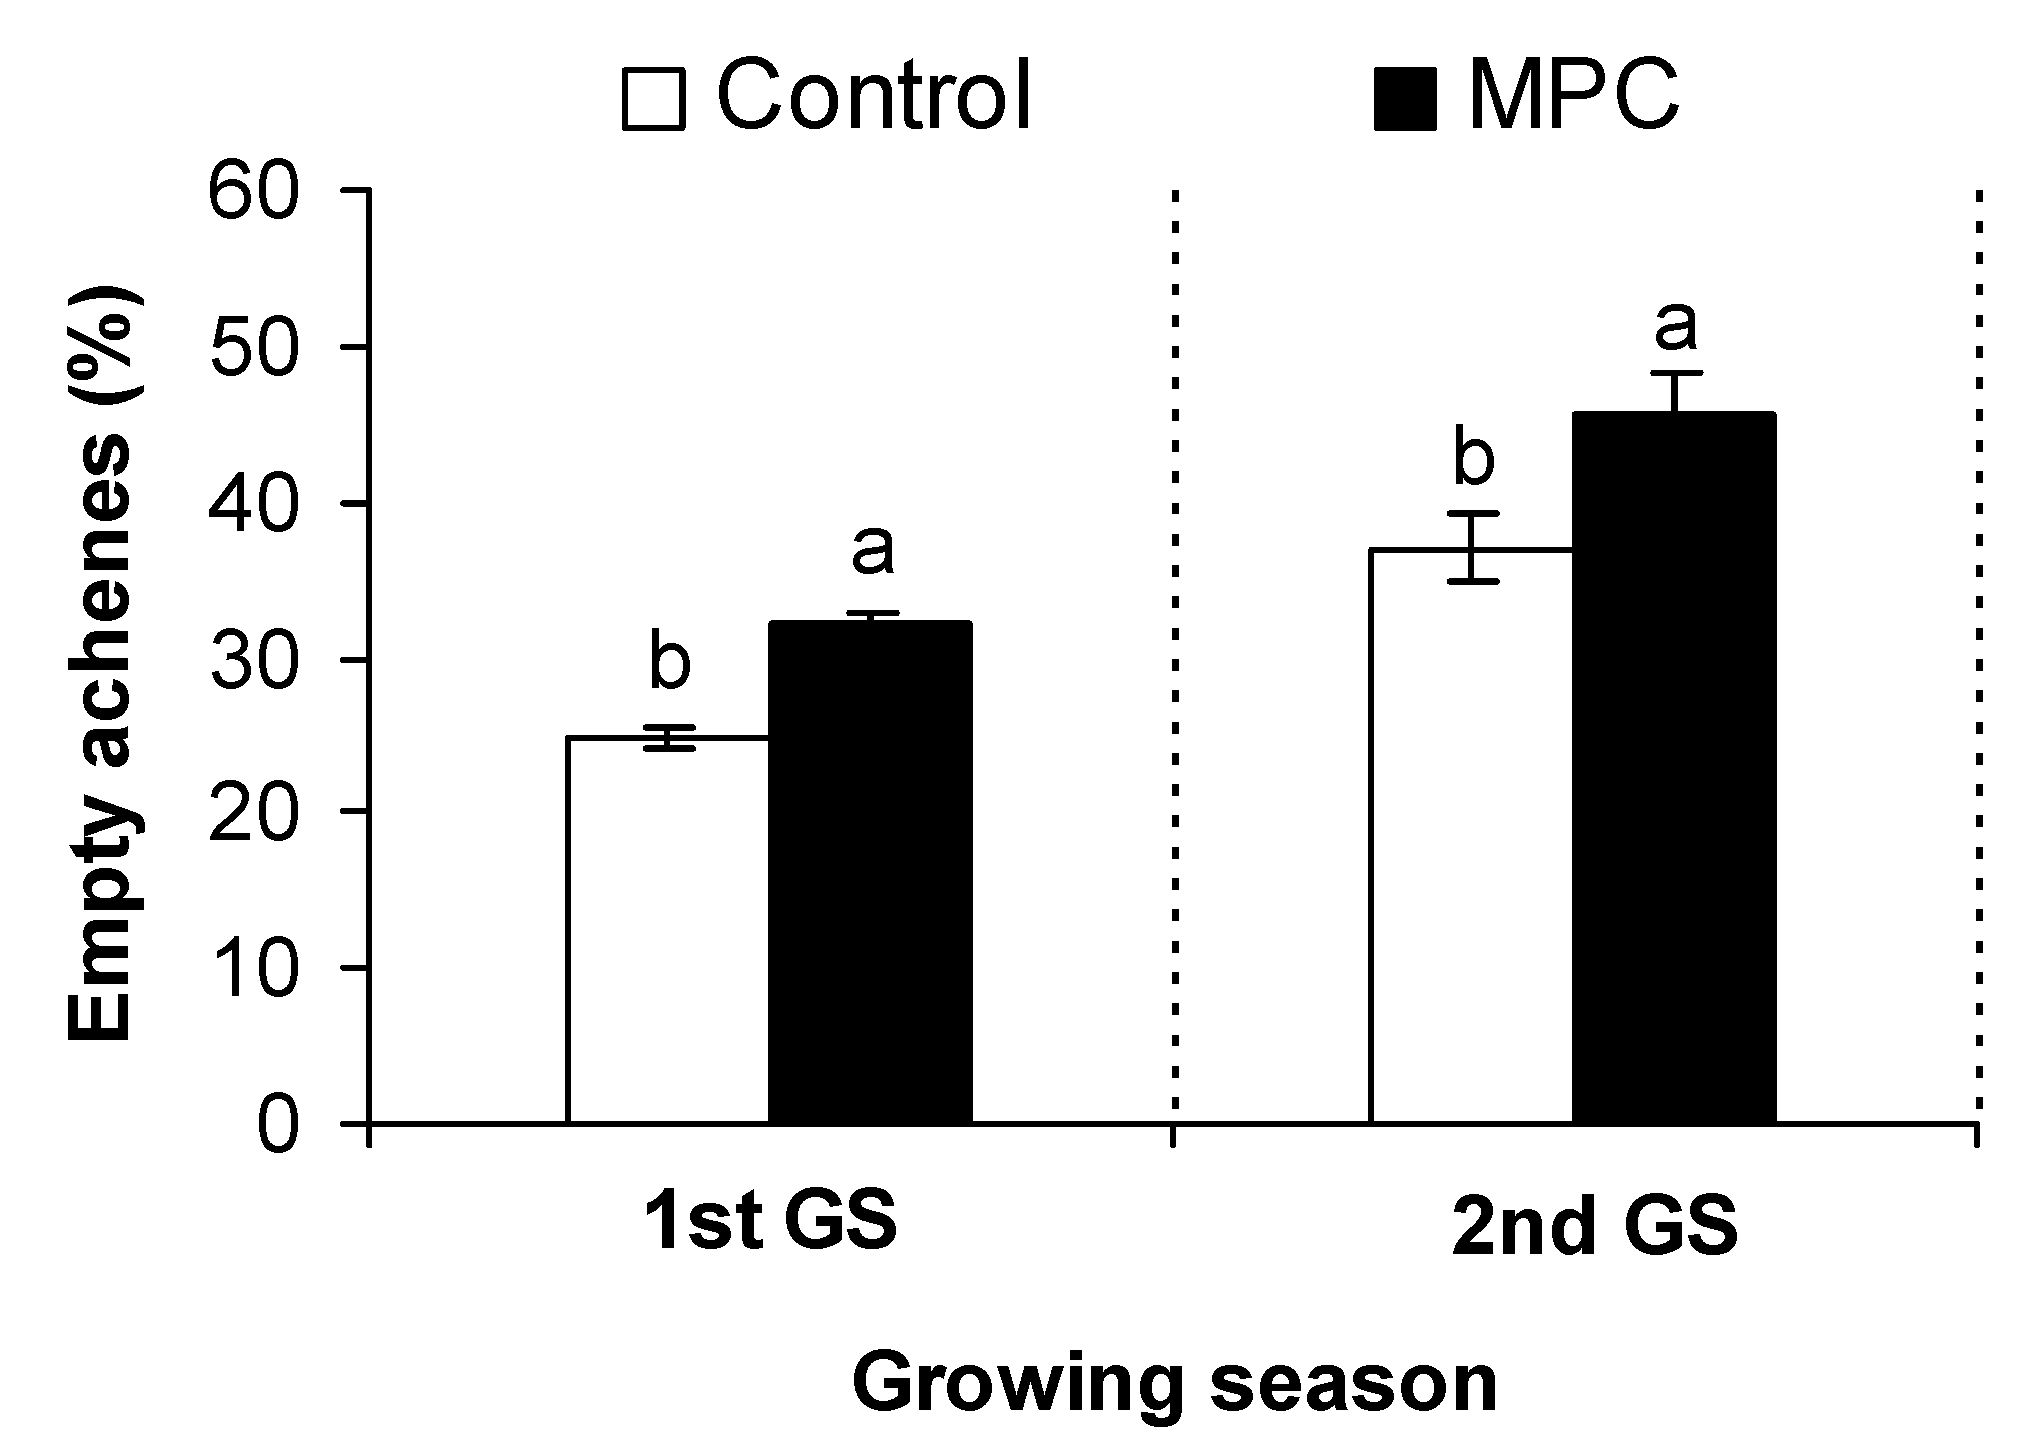
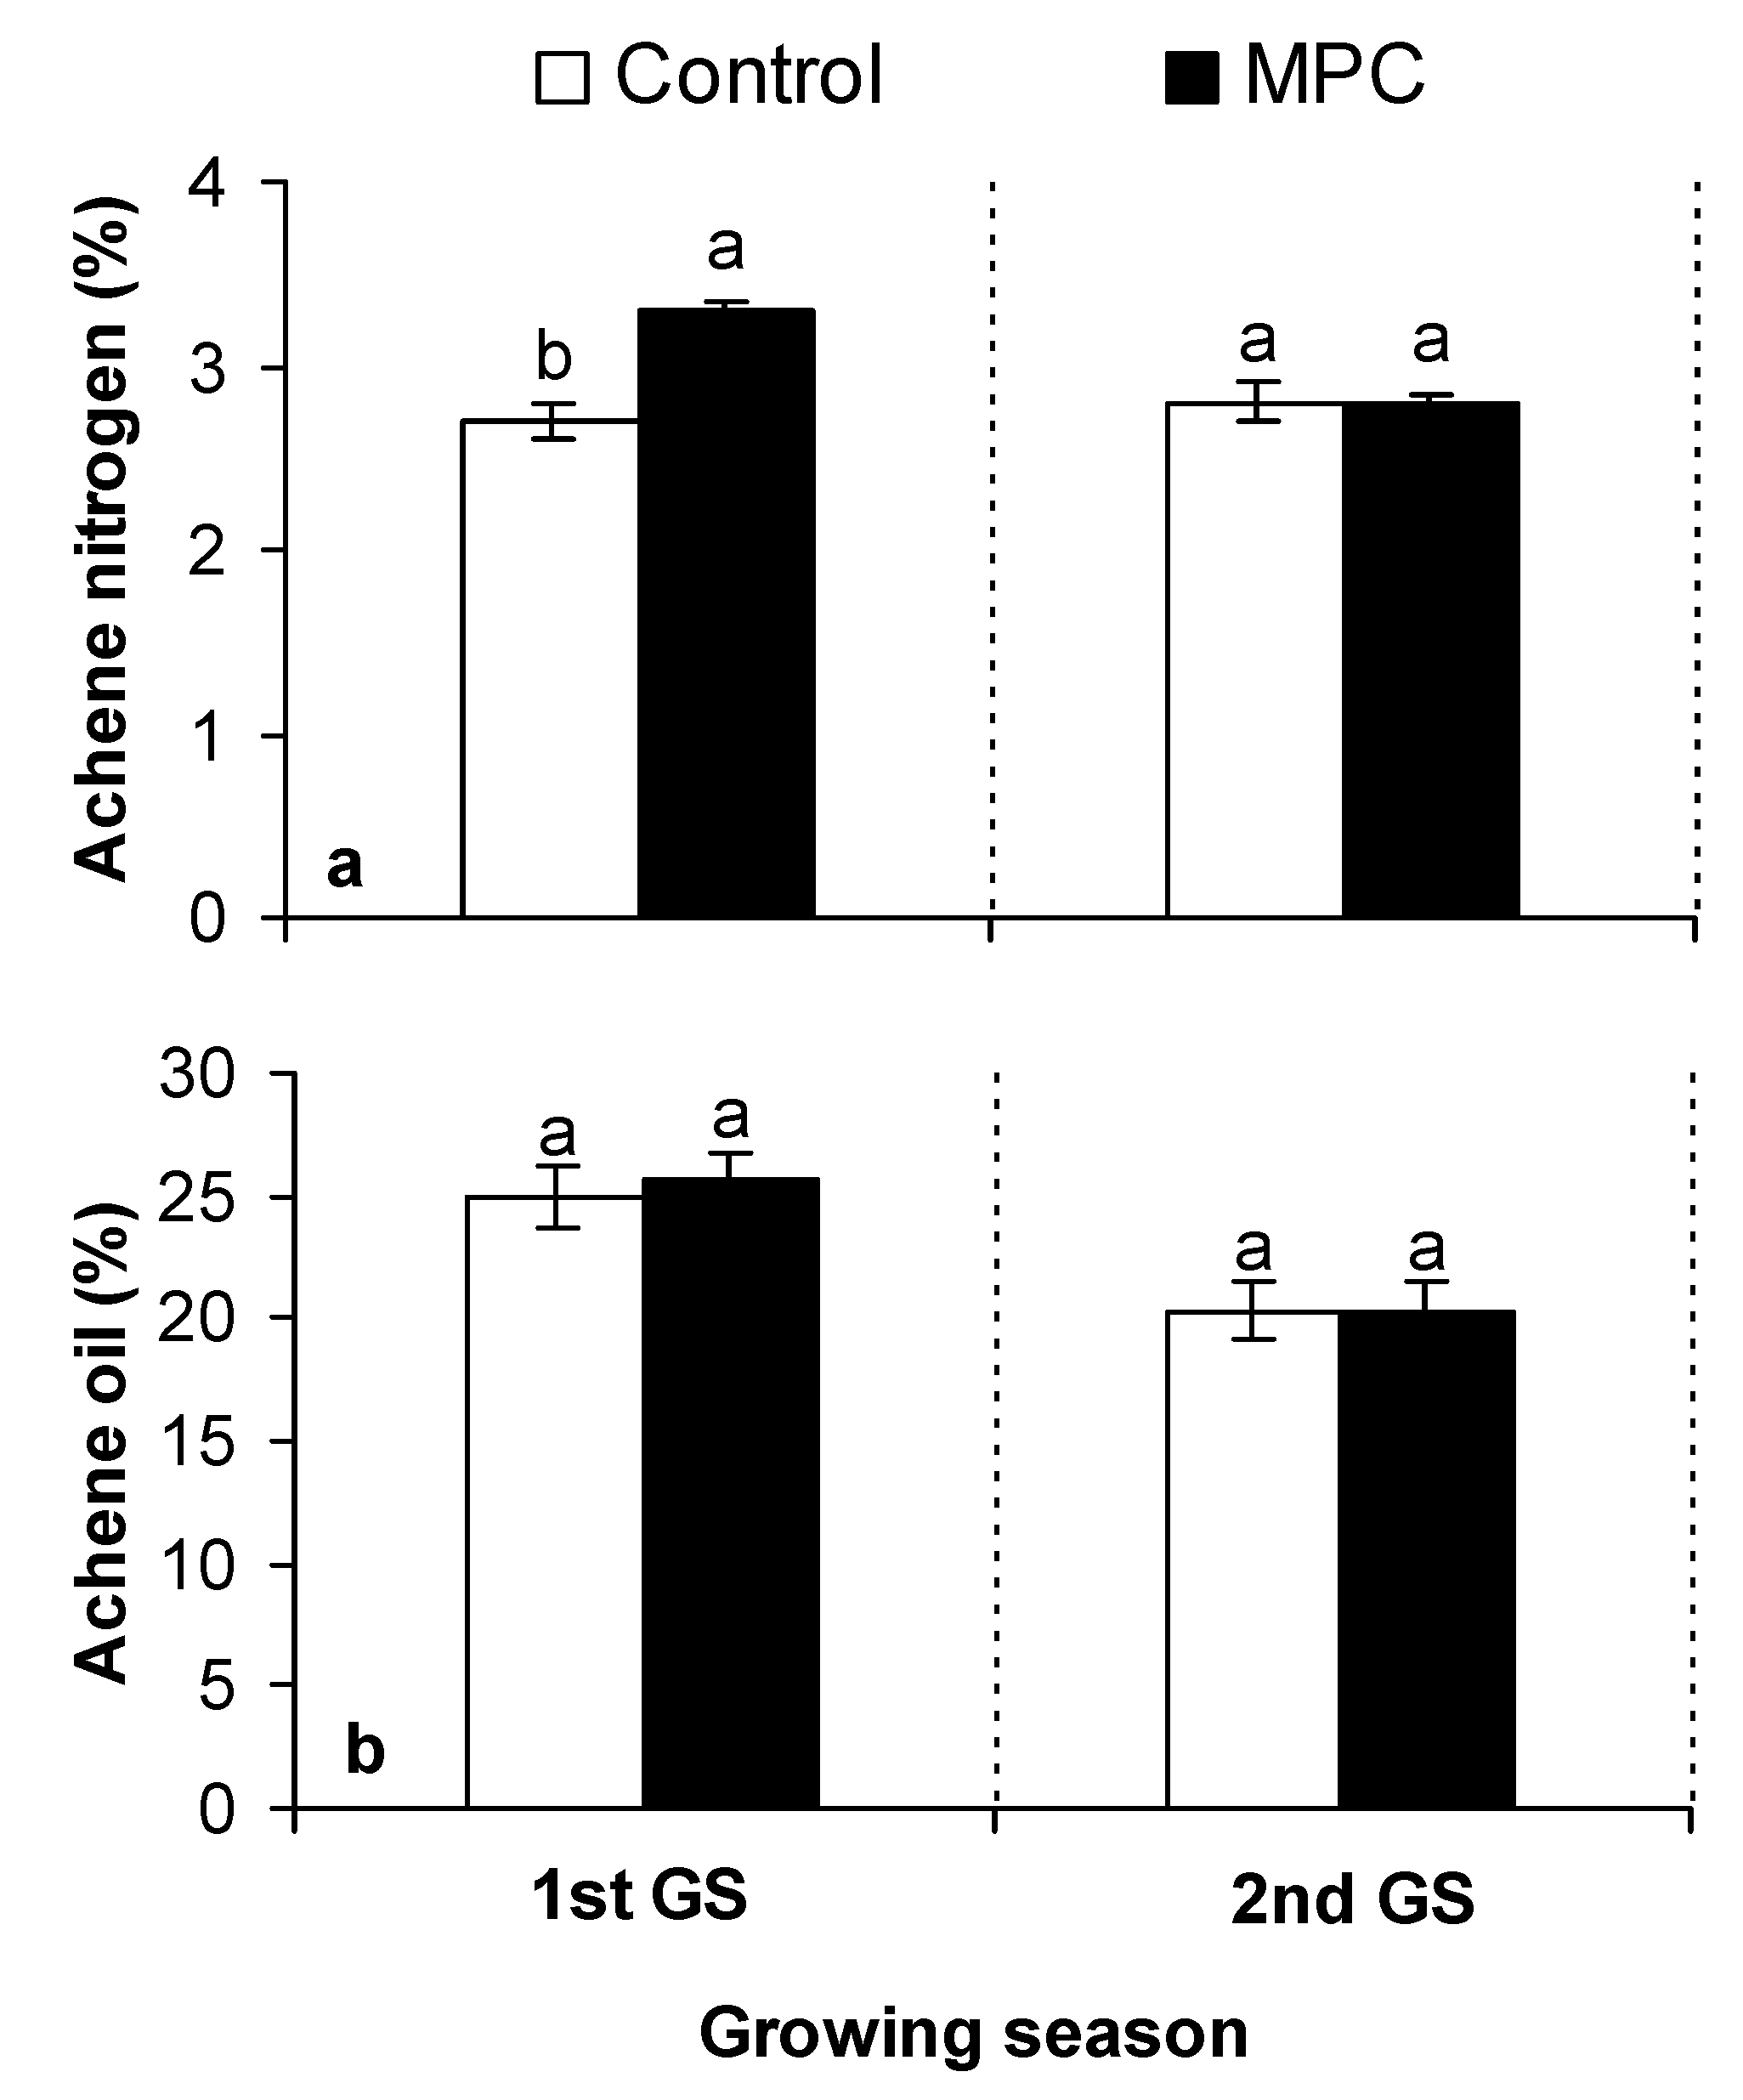
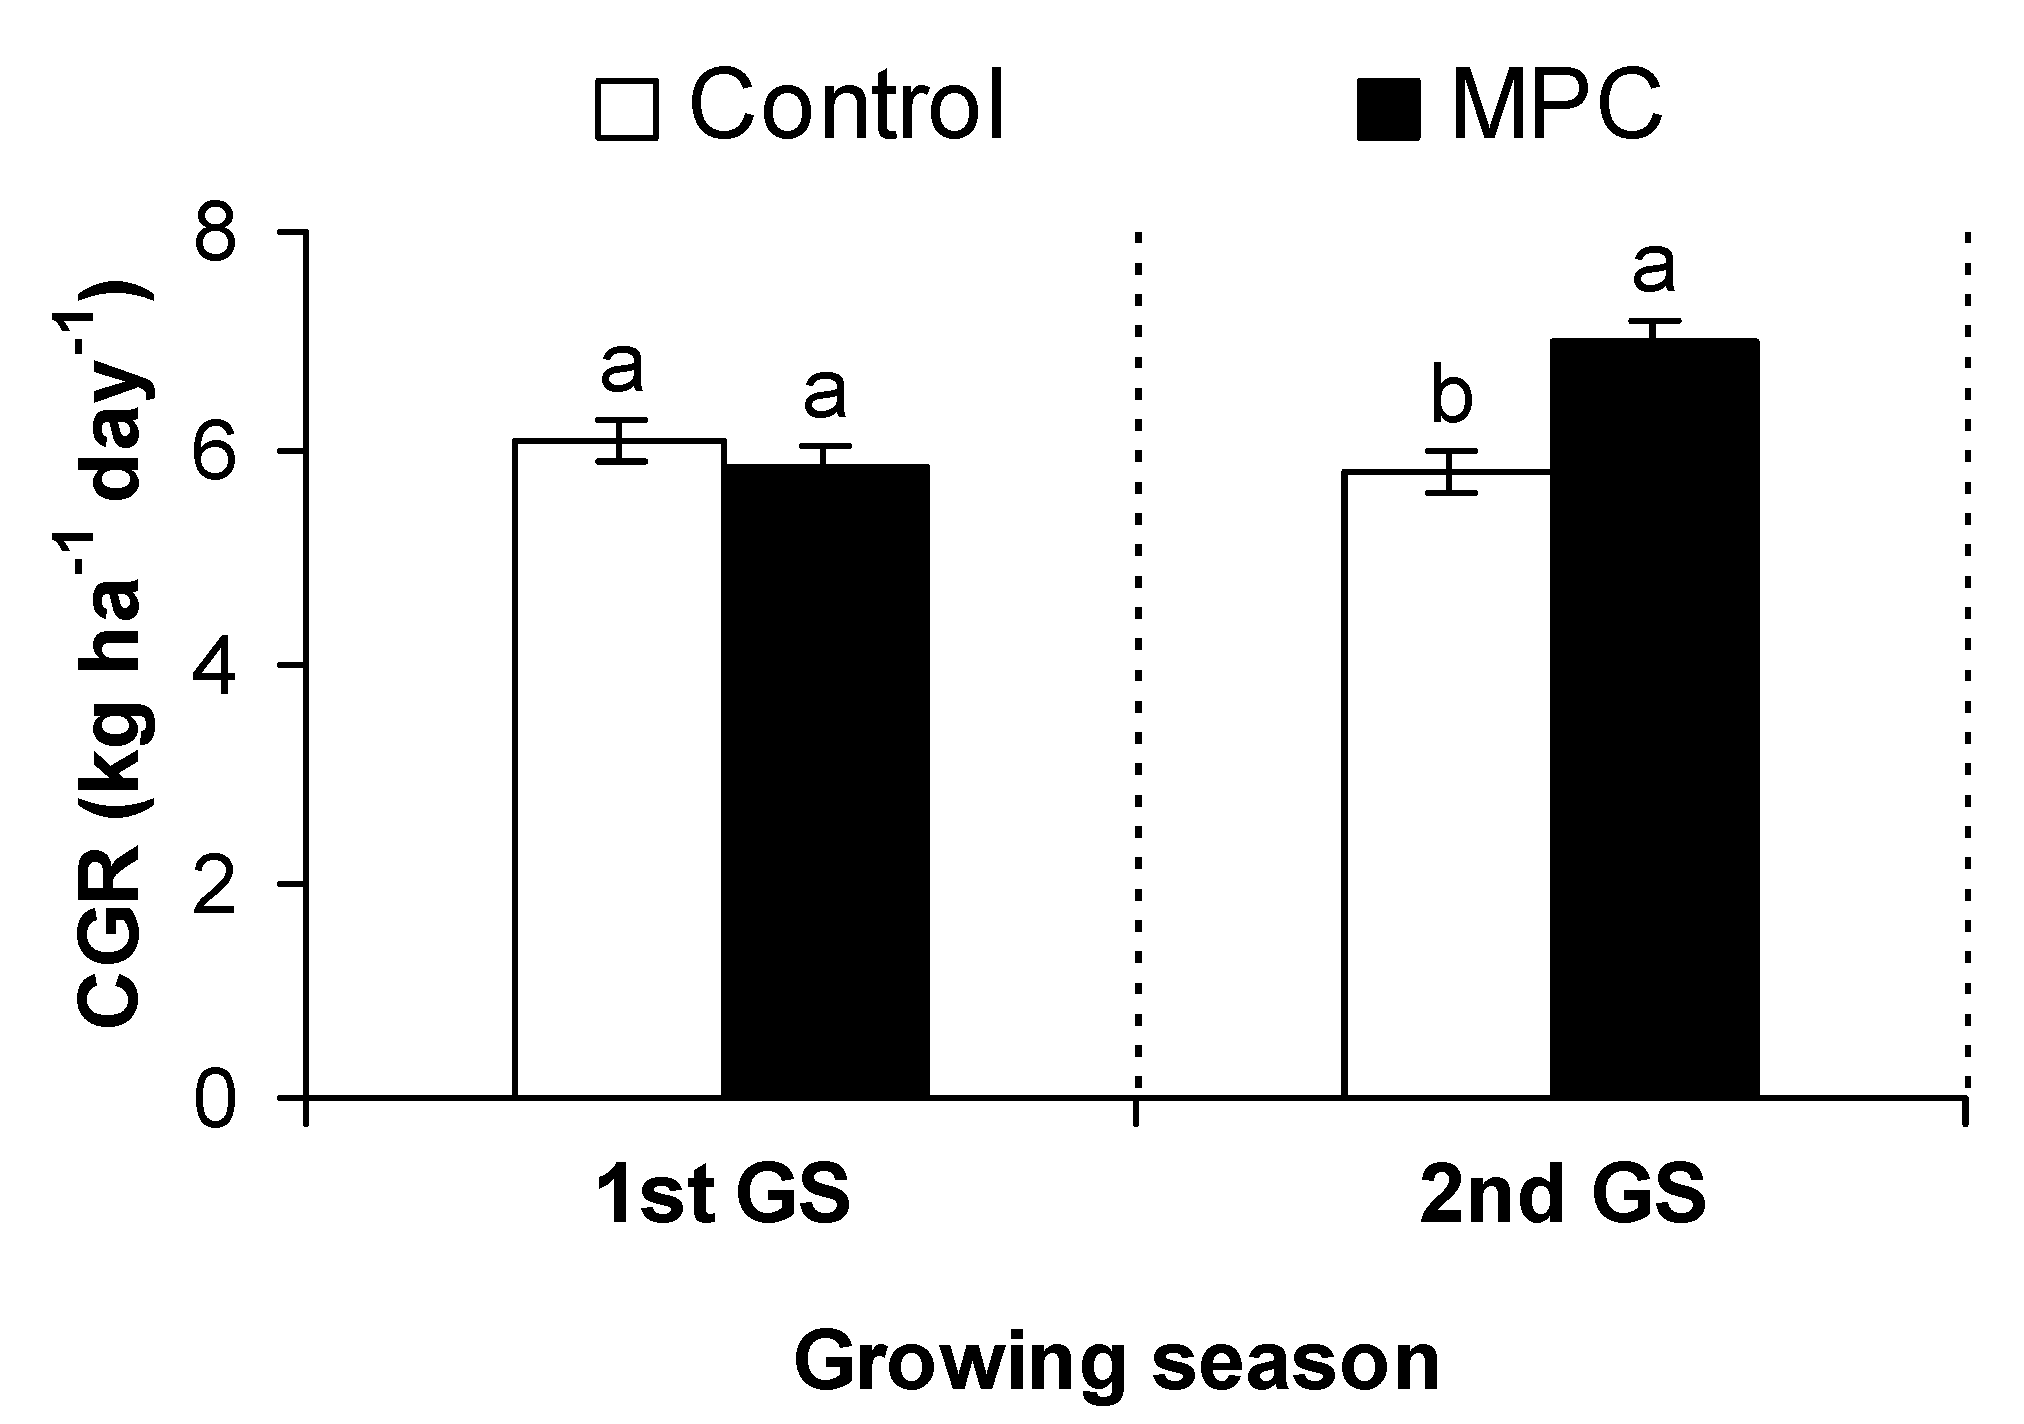
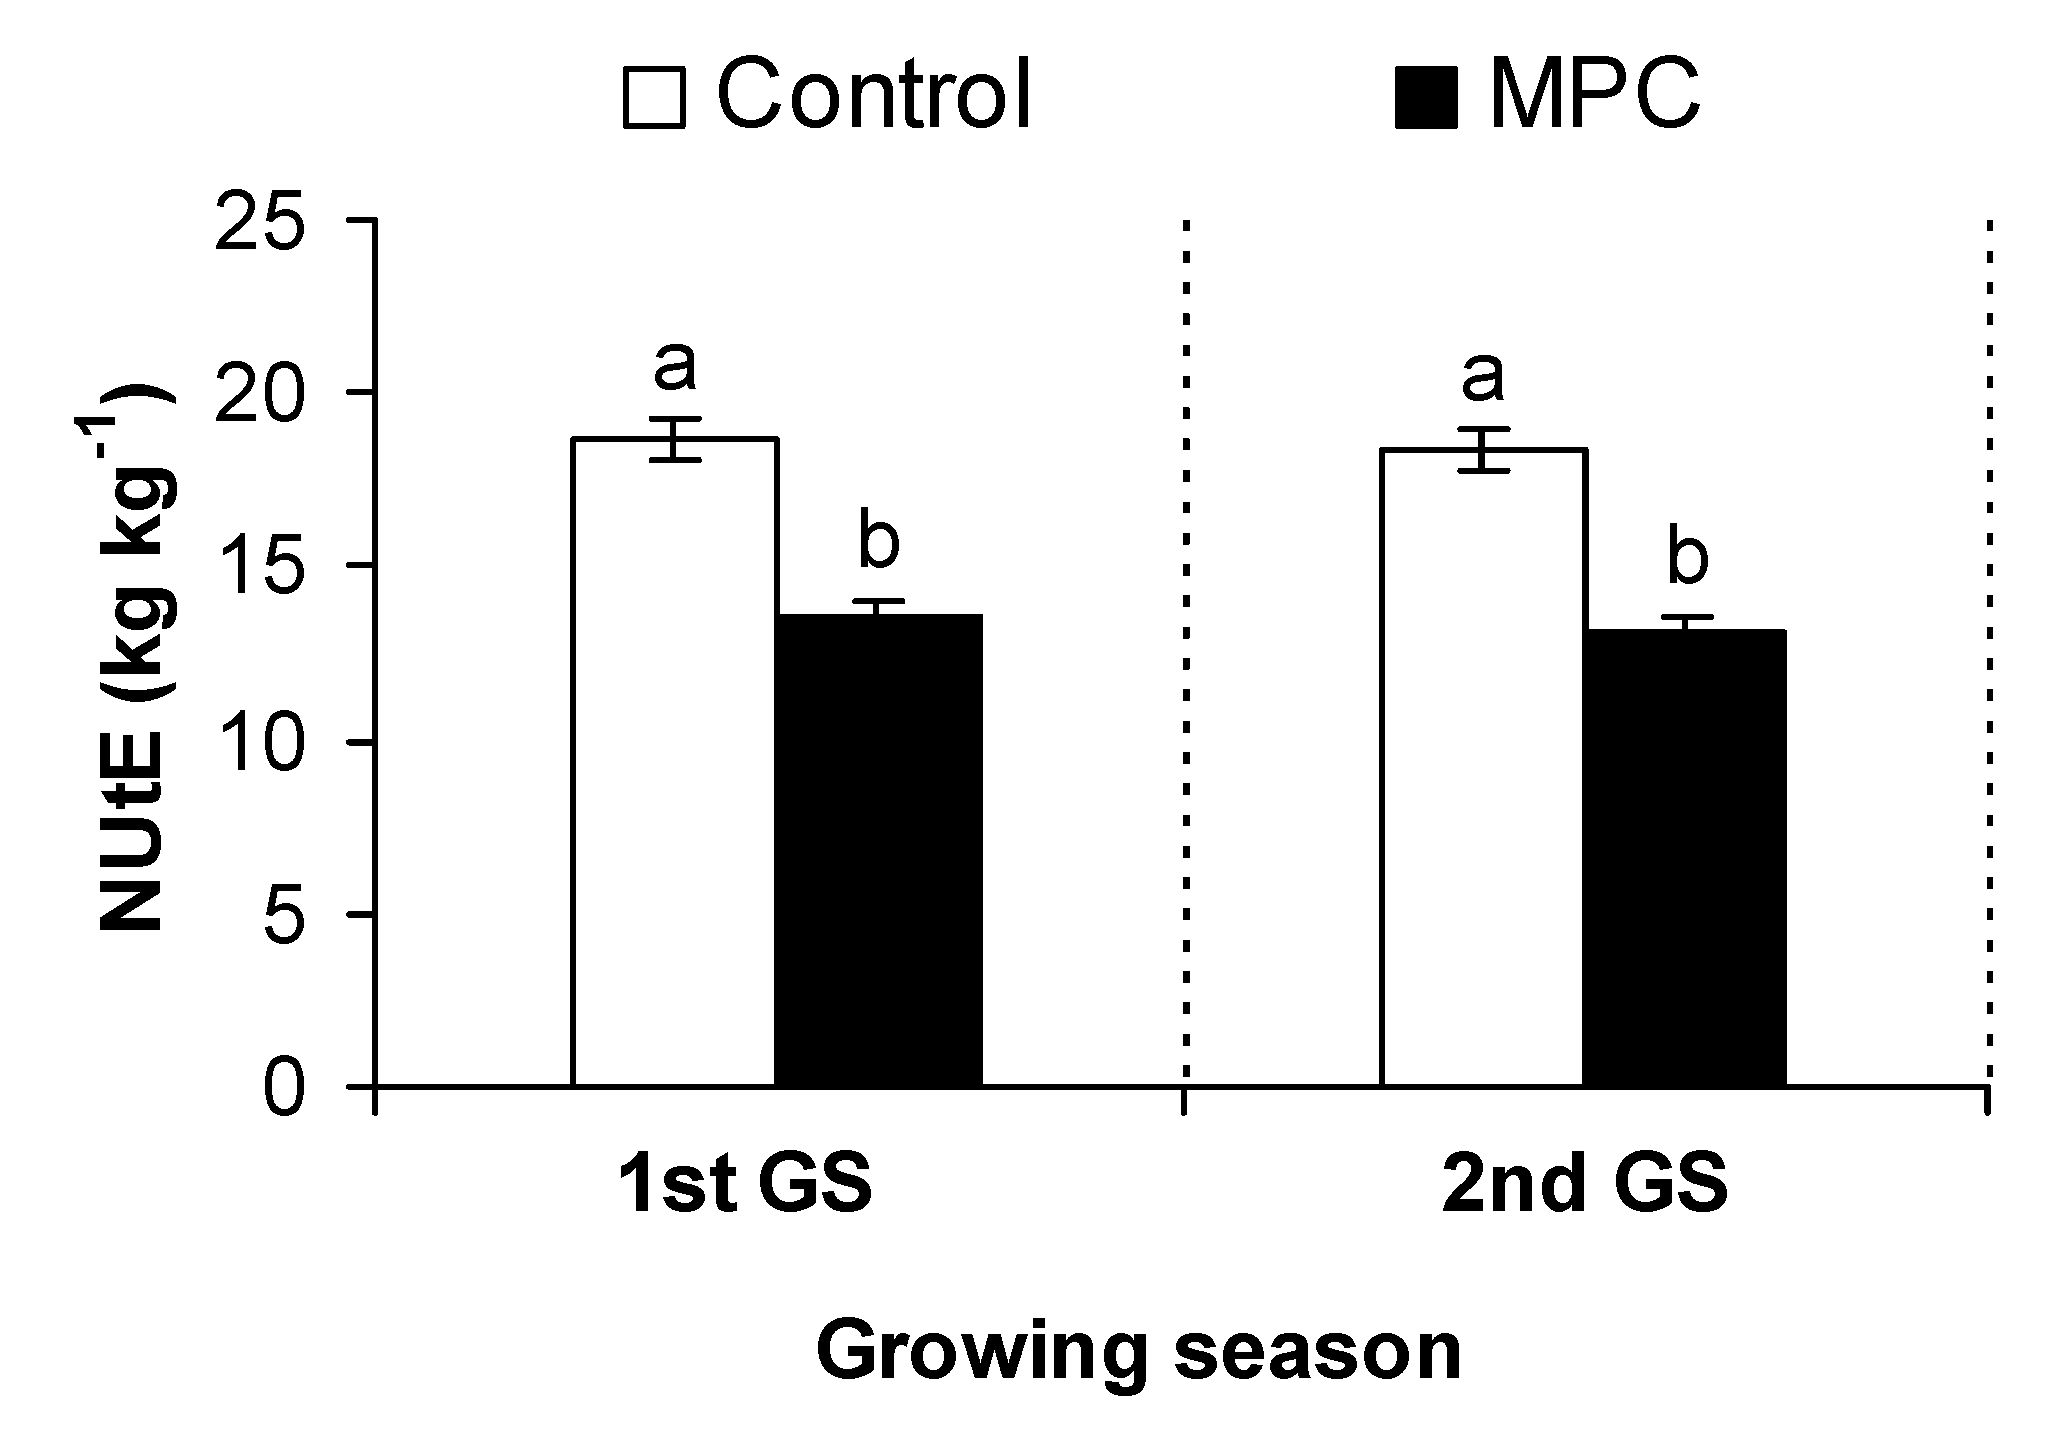
Despite the fact the total number of achenes in plants treated with MPC increased in both years (Figure 5a), the number of filled achenes did not increase significantly, albeit an increasing trend with application of MPC in both years (Figure 5b). Therefore, the increase in the number of total achenes was due to an increase in the number of empty achenes (Figure 5c). The percentage of empty achenes was significantly higher with MPC treatments in both GS (Figure 6). In the 1st GS, the percentage of empty achenes increased with application of MPC from 24.7% to 32.3% and in the 2nd GS, the percentage of empty achenes increased from 37.0% to 45.6%. MPC treatments increased achene N content only in the 1st GS (Figure 7a), but did not affect achene oil content in any GS (Figure 7b). Moreover, MPC increased CGR with the triple application scheme (Figure 8), whereas it reduced NUtE in both GS (Figure 9).
4. Discussion
Although extensive research has been conducted on the use of MPC in cotton, experimental data on the effect of MPC on field-grown sunflower are scarce. This study examined the possibility of MPC use for manipulating plant height in sunflower under field conditions. The differences in the response of plants between treatments were more apparent than those induced by the environment, as temperature followed a similar pattern across GS and the crop did not suffer from water stress due to the targeted irrigations applied in both GS. Moreover, the differences in rainfall distribution between seasons were normalized by the artificial irrigation applied and, therefore, were not crucial for sunflower growth and development. In addition, the application schemes tested did not allow the analysis of treatments × environment interaction. In this context, the discussion is focused on the differences between MPC treatments within each GS.
The double application of MPC produced shorter sunflower plants by 9.5%, whereas the triple application of MPC provided a greater reduction (14.4%), which, however, was accompanied by losses in achene yield and 100-achene weight. The practical value of the height reduction caused by the double application of MPC might be questionable for sunflower, particularly for the confection type, considering that this crop grows more than 250 cm in height. On the other hand, the losses in 100-achene weight caused by the triple application of MPC discourage the use of this MPC scheme for manipulating plant height, given that the seed weight, apart from being an important yield component, is linked with seed size and determines the commercial value of confection sunflower. In a previous study, MPC applied at 25 g ai ha−1 provided a height reduction of 11.7% in sunflower plants, whereas MPC applied at 25 plus 25 g ai ha−1 had detrimental effects on achene yield [12]. A similar response was also found in the present study, where the triple application scheme reduced the achene yield through a reduction in the 100-achene weight. Perhaps MPC application at an earlier stage of sunflower could be more effective in reducing plant height without causing any detrimental effects on yield, but this issue requires further investigation. Moreover, the application of MPC decreased the efficiency by which sunflower utilized the accumulated N to produce seeds (i.e., NUtE), raising additional concerns for the profitability and sustainability of this management practice [23]. The negative response of NUtE to MPC was caused mainly by either a decline in achene yield (e.g., at the triple MPC application) or an increase in total aboveground N accumulation (e.g., at the double MPC application).
In this study, the effect of MPC on sunflower in terms of plant height occurred by reducing the number of stem nodes. The findings are consistent with previous reports [24], stating that shorter plants in sunflower can be achieved by certain growth regulators that affect the internode length. This reduction in plant height is probably related to the hormone balance caused by the application of MPC, which interferes with the gibberellic acid biosynthesis, resulting in physiological changes and reduced growth. However, a different reaction may also exist depending on cultivar and the application rate [24]. Similarly to what was observed in sunflower, the morphological response of cotton treated with MPC was due to the suppression of vegetative growth through reducing the total number of main stem nodes and internode lengths [25]. Reduction of cotton plant height mainly caused by an internode length reduction by MPC treatment has been reported in several studies [9,25,26,27]. Application of MPC at 125 ppm at early vegetative stages of sesame (Sesamum indicum L.) decreased plant height and the number of primary branches per plant, whereas increased the number of secondary and tertiary branches per plant, capsules per plant, seeds per capsule, and 1000-seed weight [28]. An increased number of capsules and oil content of sesame was also reported with MPC application [29].
The total number of achenes was increased by MPC application, but the number of filled achenes did not differ significantly between the MPC-treated plants and the non-treated control. This finding means that MPC promoted flowering and induced production of more achenes, but this increase did not result in higher grain yield compared with the non-treated control. Practically, MPC increased empty achenes and reduced the weight of filled achenes, resulting in lower achene yield. Increase in the number of flowers with MPC has been reported in cotton [30,31] and groundnut (Arachis hypogaea L.) [32]. However, Nagashima et al. [33] reported that cotton seeds treated with MPC resulted in plants with a smaller number of flower buds. The application of MPC increased both the rate of flowering and the number of flowers per meter of cotton row, but did not impact the ability of flowers to survive to maturity [31]. The effect of MPC is a function of plant size and rate of product applied, and its application affects only the new growth [34]. Thus, MPC has no effect on portions of the plant that have ceased growing, which practically means that a given rate of product applied to a relatively small cotton plant has a much greater effect than that same rate applied to a larger plant at an advanced growth stage [34]. A similar response might be valid for sunflower.
It seems that the application of MPC caused poor seed development in sunflower resulting from insufficient assimilate supply (i.e., source limitation), which often accounts for empty achenes in sunflower under normal growth conditions [35]. Previous research on cotton showed that MPC promoted seed yield, probably due to increased redirection of assimilates towards reproductive development [36]. Similarly, the increased capacity of early buds and boll retention in cotton plants with application of MPC was linked to high nutrient availability, probably due to increased partitioning of assimilates from vegetative parts to reproductive organs, resulting in high crop yield [37]. This response may be due the relationship between source and sink, i.e., the reduction of elongation caused by MPC decreases the demand of assimilates for growth, which are used in higher proportion by the plant reproductive organs.
In the present study, the application of MPC probably resulted in suppression of gibberellic acid production that, in turn, might have reduced the photosynthetic activity of the source and the efficiency in assimilate transport, thus resulting in lower yield of sunflower. Gibberellic acid can influence the plant source by improving the photosynthetic potential of plants, whereas increased efficiency in assimilate transport contributes to sink strength, establishing its role in the source–sink system [38]. In addition, plant hormones and other signals, such as the availability of sugars, are important in the regulation of the source–sink relationships, because they control sink growth, leaf senescence, and other developmental processes, thereby affecting assimilate partitioning [39].
5. Conclusions
The present study shows the importance of evaluating different MPC application schemes (i.e., application rates, application periodicity, and application stages) to control excess vegetative growth of sunflower. In particular, MPC application rates used in the present study either did not provide any practical advantage, in terms of height reduction of sunflower plants, or the height reduction achieved was followed by a major reduction in achene yield. The effect of the double application at 37.5 plus 37.5 g ai ha−1 was similar to that of the double application at 25 plus 25 g ai ha−1 found in a previous study [12]. On the basis of all the above, MPC appeared partially effective for manipulating plant height in sunflower. Perhaps application of MPC at an earlier stage of sunflower could be more effective in reducing plant height, but the effect on yield should be also investigated. These issues along with testing other plant growth regulators and other sunflower types (e.g., oilseed types) or varieties can be main targets in future research for manipulating plant height in sunflower.
Author Contributions
S.D.K. conceived the idea, planned the research, conducted the study, gathered data, analyzed data, and wrote the article; C.A.D. contributed to data interpretation and writing of the article, and edited the article. All authors have read and agreed to the published version of the manuscript.
Funding
This research received no external funding.
Conflicts of Interest
The authors declare no conflicts of interest.
References
- Arteca, R.N. Introduction to Horticultural Science, 2nd ed.; Cengage Learning: Stamford, CT, USA, 2014. [Google Scholar]
- Grossmann, K. Plant growth retardants as tools in physiological research. Physiol. Plant. 1990, 78, 640–648. [Google Scholar] [CrossRef]
- Graebe, J. Gibberellin biosynthesis and control. Ann. Rev. Plant Physiol. 1987, 38, 419–465. [Google Scholar] [CrossRef]
- Rademacher, W. Growth retardants: Effects on gibberellin biosynthesis and other metabolic pathways. Ann. Rev. Plant Physiol. 2000, 51, 501–531. [Google Scholar] [CrossRef] [Green Version]
- York, A.C. Cotton cultivar response to mepiquat chloride. Agron. J. 1983, 75, 663–667. [Google Scholar] [CrossRef]
- Stuart, B.L.; Isbell, V.R.; Wendt, C.W.; Abernathy, J.R. Modification of cotton water relations and growth with mepiquat chloride. Agron. J. 1984, 76, 651–655. [Google Scholar] [CrossRef]
- Reddy, V.R.; Hodges, H.F.; Baker, D.N. Temperature and mepiquat chloride effects on cotton canopy architecture. Agron. J. 1990, 82, 190–195. [Google Scholar] [CrossRef]
- Nichols, S.P.; Snipes, C.E.; Jones, M.A. Evaluation of row spacing and mepiquat chloride in cotton. J. Cotton Sci. 2003, 7, 148–155. [Google Scholar]
- Kerby, T.A. Cotton response to mepiquat chloride. Agron. J. 1985, 77, 115–118. [Google Scholar] [CrossRef]
- Heilman, M.D. Effect of mepiquat chloride and nitrogen levels on yield, growth characteristics, and elemental composition of cotton. J. Plant Growth Regul. 1985, 4, 41–47. [Google Scholar] [CrossRef]
- Thomas, R.O. Cotton flowering and fruiting responses to application timing of chemical growth retardants. Crop Sci. 1975, 15, 87–90. [Google Scholar] [CrossRef]
- Koutroubas, S.D.; Vassiliou, G.; Damalas, C.A. Sunflower morphology and yield as affected by foliar applications of plant growth regulators. Int. J. Plant Prod. 2014, 8, 215–229. [Google Scholar]
- Polat, T.; Özer, H.; Öztürk, E.; Sefaoğlu, F. Effects of mepiquat chloride applications on non-oilseed sunflower. Turkish J. Agric. For. 2017, 41, 472–479. [Google Scholar] [CrossRef]
- Stover, E.W.; Greene, D.W. Environmental effects on the performance of foliar applied plant growth regulators: A review focusing on tree fruits. HortTechnology 2005, 15, 214–221. [Google Scholar] [CrossRef] [Green Version]
- Fick, G.N.; Miller, J.F. Sunflower breeding. In Sunflower Technology and Production; Schneiter, A.A., Ed.; Monograph No. 35; ASA/CSSA/SSSA: Madison, WI, USA, 1997; pp. 395–439. [Google Scholar]
- Meier, U. Growth Stages of Mono- and Dicotyledonous Plants: BBCH Monograph, 2nd ed.; German Federal Biological Research Centre for Agriculture and Forestry: Bonn, Germany, 2001. [Google Scholar]
- Li, W.P.; Shi, H.B.; Zhu, K.; Zheng, Q.; Xu, Z. The quality of sunflower seed oil changes in response to nitrogen fertilizer. Agron. J. 2017, 109, 2499–2507. [Google Scholar] [CrossRef] [Green Version]
- López Pereira, M.; Hall, A.J. Sunflower oil yield responses to plant population and row spacing: Vegetative and reproductive plasticity. Field Crop. Res. 2019, 230, 17–30. [Google Scholar] [CrossRef]
- Dwyer, L.M.; Anderson, A.M.; Stewart, D.W.; Ma, B.L.; Tollenaar, M. Changes in maize hybrid photosynthetic response to leaf nitrogen, from preanthesis to grain fill. Agron. J. 1995, 87, 1221–1225. [Google Scholar] [CrossRef]
- Bremner, J.M. Total nitrogen. In Methods of Soil Analysis; Black, C.A., Evans, D.D., Ensuinger, L.E., White, J.K., Clark, F.F., Eds.; Part 2, Agronomy 9; American Society of Agronomy: Madison, WI, USA, 1965; pp. 1149–1178. [Google Scholar]
- AOCS. Official and Tentative Methods of the American Oil Chemists’ Society, 3rd ed.; American Oil Chemists’ Society: Champaign, IL, USA, 1983. [Google Scholar]
- Steel, R.G.D.; Torrie, J.H. Principles and Procedures of Statistics: A Biometrical Approach, 2nd ed.; McGraw-Hill: New York, NY, USA, 1980. [Google Scholar]
- Koutroubas, S.D.; Fotiadis, S.; Damalas, C.A. Grain yield and nitrogen dynamics of Mediterranean barley and triticale. Arch. Agron. Soil Sci. 2016, 62, 484–501. [Google Scholar] [CrossRef]
- Weiss, E.A. Oilseed Crops, 2nd ed.; Blackwell Science: London, UK, 2000. [Google Scholar]
- Reddy, V.R.; Trent, A.; Acock, B. Mepiquat chloride and irrigation versus cotton growth and development. Agron. J. 1992, 84, 930–933. [Google Scholar] [CrossRef]
- Lamas, F.M.; Athayde, M.L.F.; Banzatto, D.A. Reactions of cotton CNPA-ITA 90 to mepiquat chloride. Pesquisa Agropecuária Brasileira 2000, 35, 507–516. [Google Scholar] [CrossRef] [Green Version]
- Zhao, D.L.; Oosterhuis, D.M. Pix plus and mepiquat chloride effects on physiology, growth, and yield of field-grown cotton. J. Plant Growth Regul. 2000, 19, 415–422. [Google Scholar] [CrossRef]
- Imayavaramban, V.; Panneerselvam, P.; Manuel, R.I.; Thanunathan, K. Effect of different nitrogen levels, clipping and growth regulators on the growth and yield of sesame. Sesame Safflower Newsl. 2004, 19, 40–44. [Google Scholar]
- Li, C.H.; Tu, Y.C.; Xie, L.H. A study on physiological effects of sesame seed treatment. Oil Crop. China 1987, 2, 44–47. [Google Scholar]
- Hodges, H.F.; Reddy, V.R.; Reddy, K.R. Mepiquat chloride and temperature effects on photosynthesis and respiration of fruiting cotton. Crop Sci. 1991, 31, 1301–1308. [Google Scholar] [CrossRef]
- Biles, S.P.; Cothren, J.T. Flowering and yield response of cotton to application of mepiquat chloride and PGR-IV. Crop Sci. 2001, 41, 1834–1837. [Google Scholar] [CrossRef]
- Jeyakumar, P.; Thangaraj, M. Effect of mepiquat chloride on certain physiological and yield characteristics of groundnut (Arachis hypogaea L.). J. Agron. Crop Sci. 1996, 176, 159–164. [Google Scholar] [CrossRef]
- Nagashima, G.T.; Marur, C.J.; Yamaoka, R.S.; Miglioranza, E. Development of cotton plant from seeds soaked with mepiquat chloride. Pesquisa Agropecuária Brasileira 2005, 40, 943–946. [Google Scholar] [CrossRef]
- Jost, P.; Whitaker, J.; Brown, S.M.; Bednar, C. Use of Plant Growth Regulators as a Management Tool in Cotton; Bulletin 1305; University of Georgia Cooperative Extension: Athens, GA, USA, 2006. [Google Scholar]
- Alkio, M.; Schubert, A.; Diepenrock, W.; Grimm, E. Effect of source-sink ratio on seed set and filling in sunflower (Helianthus annuus L.). Plant Cell Environ. 2003, 26, 1609–1619. [Google Scholar] [CrossRef]
- Sawan, Z.M. Cottonseed yield and its quality as affected by mineral fertilizers and plant growth retardants. Agric. Sci. 2014, 5, 186–209. [Google Scholar] [CrossRef] [Green Version]
- Kerby, T.A.; Keeley, M. Genotypes and plant densities for narrow row cotton system, height nodes, earliness and location yield. Crop Sci. 1990, 30, 644–649. [Google Scholar] [CrossRef]
- Iqbal, N.; Nazar, R.; Khan, M.I.R.; Masood, A.; Khan, N.A. Role of gibberellins in regulation of source–sink relations under optimal and limiting environmental conditions. Curr. Sci. 2011, 100, 998–1007. [Google Scholar]
- Taiz, L.; Zeiger, E. Plant Physiology, 4th ed.; Sinauer Associates: Sunderland, MA, USA, 2006. [Google Scholar]
Figure 1.
Mean monthly air temperature and cumulative monthly rainfall during each growing season (GS) of experimentation (arrows denote irrigation events in each GS).
Figure 1.
Mean monthly air temperature and cumulative monthly rainfall during each growing season (GS) of experimentation (arrows denote irrigation events in each GS).

Figure 2.
Plant height (a), number of nodes (b), and stem diameter (c) of sunflower plants at maturity as influenced by foliar applications of MPC (37.5 + 37.5 g ha−1 in the 1st growing season (GS) and 37.5 + 37.5 g + 37.5 g ha−1 in the 2nd GS). Different letters within each GS show statistically significant differences at p < 0.05 and vertical bars denote standard errors of means (n = 40). MPC, mepiquat chloride.

Figure 3.
Aboveground dry weight (dw) of sunflower plants at flowering (a) and at maturity (b) as influenced by foliar applications of MPC (37.5 + 37.5 g ha−1 in the 1st growing season (GS) and 37.5 + 37.5 g + 37.5 g ha−1 in the 2nd (GS). Different letters within each GS show statistically significant differences at p < 0.05 and vertical bars denote standard errors of means (n = 12). MPC, mepiquat chloride.

Figure 4.
Achene yield (a) and 100-achenes weight (b) of sunflower plants as influenced by foliar treatments of MPC (37.5 + 37.5 g ha−1 in the 1st growing season (GS) and 37.5 + 37.5 + 37.5 g ha−1 in the 2nd GS). Different letters within each GS show statistically significant differences at p < 0.05 and vertical bars denote standard errors of means (n = 12). MPC, mepiquat chloride.

Figure 5.
Total achenes (a), filled achenes (b), and empty achenes (c) per capitulum of sunflower plants as influenced by foliar treatments of MPC (37.5 + 37.5 g ha−1 in the 1st growing season (GS) and 37.5 + 37.5 + 37.5 g ha−1 in the 2nd GS). Different letters within each GS show statistically significant differences at p < 0.05 and vertical bars denote standard errors of means (n = 12). MPC, mepiquat chloride.

Figure 6.
Percentage of empty achenes of sunflower plants as influenced by foliar treatments of MPC (37.5 + 37.5 g ha−1 in the 1st growing season (GS) and 37.5 + 37.5 + 37.5 g ha−1 in the 2nd GS). Different letters within each GS show statistically significant differences at p < 0.05 and vertical bars denote standard errors of means (n = 12). MPC, mepiquat chloride.

Figure 7.
Achene nitrogen content (a) and achene oil content (b) of sunflower plants as influenced by foliar treatments of MPC (37.5 + 37.5 g ha−1 in the 1st growing season (GS) and 37.5 + 37.5 + 37.5 g ha−1 in the 2nd GS). Different letters within each GS show statistically significant differences at p < 0.05 and vertical bars denote standard errors of means (n = 12). MPC, mepiquat chloride.

Figure 8.
Crop growth rate (CGR) of sunflower plants as influenced by foliar treatments of MPC (37.5 + 37.5 g ha−1 in the 1st growing season (GS) and 37.5 + 37.5 + 37.5 g ha−1 in the 2nd GS). Different letters within each GS show statistically significant differences at p < 0.05 and vertical bars denote standard errors of means (n = 12). MPC, mepiquat chloride.

Figure 9.
Nitrogen utilization efficiency (NUtE) of sunflower plants as influenced by foliar treatments of MPC (37.5 + 37.5 g ha−1 in the 1st growing season (GS) and 37.5 + 37.5 + 37.5 g ha−1 in the 2nd GS). Different letters within each GS show statistically significant differences at p < 0.05 and vertical bars denote standard errors of means (n = 12). MPC, mepiquat chloride.

© 2020 by the authors. Licensee MDPI, Basel, Switzerland. This article is an open access article distributed under the terms and conditions of the Creative Commons Attribution (CC BY) license (http://creativecommons.org/licenses/by/4.0/).
Share and Cite
MDPI and ACS Style
Koutroubas, S.D.; Damalas, C.A. Physiology and Yield of Confection Sunflower under Different Application Schemes of Mepiquat Chloride. Agriculture 2020, 10, 15. https://0-doi-org.brum.beds.ac.uk/10.3390/agriculture10010015
AMA Style
Koutroubas SD, Damalas CA. Physiology and Yield of Confection Sunflower under Different Application Schemes of Mepiquat Chloride. Agriculture. 2020; 10(1):15. https://0-doi-org.brum.beds.ac.uk/10.3390/agriculture10010015
Chicago/Turabian StyleKoutroubas, Spyridon D., and Christos A. Damalas. 2020. "Physiology and Yield of Confection Sunflower under Different Application Schemes of Mepiquat Chloride" Agriculture 10, no. 1: 15. https://0-doi-org.brum.beds.ac.uk/10.3390/agriculture10010015
Note that from the first issue of 2016, this journal uses article numbers instead of page numbers. See further details here.