1. Introduction
The concept of sustainable development is increasingly becoming an element of political strategies. This is particularly visible at the European Union level, where the modern vision of the idea comprises such priorities as: smart growth, knowledge, and innovation-based inclusive development accompanied by a high level of employment, while ensuring social and territorial cohesion; development promoting more efficient and greener resources, leading to a more competitive economy [
1]. Concurrently, it is worth stressing that the concept of sustainable development requires an integrated approach at all levels and in all sectoral policies. An example is the Common Agricultural Policy, one of the main purposes of which is to ensure a fair standard of living for the agricultural community, e.g., through stable income and improvement of the quality of life in rural areas.
The economic sustainability (or socio-economic sustainability if we assume that income inequalities are part of social sustainability), can be seen in terms of the income gap between agricultural and non-agricultural sectors. Many scientists have stressed the importance of increasing employment in rural areas supported by the Common Agricultural Policy (CAP), which may be a remedy for social exclusion, depopulation of these areas, and the income gap [
2,
3,
4,
5]. There is evidence that sustainable agriculture coincides with filling the income gap and social viability. The human capital, i.e., qualifications and education, has a direct impact on the income of the agricultural population [
6,
7,
8]. The income aspect is usually raised in the context of sustainable farming. Examples from various countries (Argentina, Austria, Bulgaria, and other developing countries, including the Third World) show that sustainable agriculture is better than industrial agriculture because it does not have a negative impact on the rural population, impoverishing farmers and thus depriving them of opportunities for development [
9,
10,
11,
12]. Bacon et al. [
13] and Hediger [
14] argued that sustainable agriculture reduces some of the social costs of industrial farming and vice-versa: the higher socio-economic stability, the stronger the willingness to manifest pro-ecological attitudes, and, for instance, to participate in agri-environmental schemes [
15]. Although there is a vast literature dealing with agricultural incomes in the EU Member States [
16,
17], the link between relative farmers’ income gap and factors influencing this phenomenon is less well documented. Among a few studies dealing with this issue there are the articles by Cai and Pandey [
18] and Czyżewski and Poczta-Wajda [
19] which raise similar ideas to our study.
The purpose of the paper is to determine the impact of the Common Agricultural Policy on the level of economic sustainability of agricultural holdings in the European Union. The authors formulate a hypothesis that the existing solutions within CAP serve the achievement of economic sustainability (defined by the parity of agricultural to non-agricultural income), but do not reduce the income disparity within the agricultural sector, which could be treated as an element of socio-economic sustainability (it does not mean, however, that they do not enhance other elements of sustainability, such as the improvement of working conditions or access to infrastructure). In other words, thanks to the support, the average agricultural income of farms is coming closer to the average income in non-agricultural sectors; however, the distribution of the support between small, medium-sized, and large holdings is highly varied. Although in absolute terms the quality of life in each of the above groups may be improving, in fact relative deprivation of the smallest entities occurs. In this publication the critical analysis of literature, inductive reasoning, and selected methods of quantitative analysis, i.e., panel regression, are employed. The time range of the research is 2005–2015. The spatial scope—EU countries, EU-15 (countries that joined the EU before 2004, i.e., Belgium, Denmark, Germany, Ireland, Greece, Spain, France, Italy, Luxembourg, Netherlands, Austria, Portugal, Finland, Sweden, United Kingdom) and EU-8 (countries that joined the EU in 2004 without Cyprus and Malta, i.e., Czech Republic, Estonia, Latvia, Lithuania, Hungary, Poland, Slovenia, Slovakia) separately. The analyzed units are country and economic class representative farms from the EU Farm Accountancy Data Network (FADN).
2. Literature Review
The idea of economic sustainability is very broad and depending on the adopted concept, various characteristics describing this state are listed. It has been pointed out that sustainable development must meet the needs of the present without compromising the ability of future generations to meet their own needs [
20], assuming properly structured relationships between economic growth and the social sphere [
21]. A significant role is attributed here to activities aimed at increasing social cohesion, including limiting income disparities, providing equal opportunities, and counteracting marginalization, access to employment, education, and healthcare. It can be said that the primary and most frequently used measures of the economic effect are the quantitative indicators of the increase in output produced or indicators of the quantitative increase in consumption (i.e., output sold). On the macroeconomic level, they take the form of gross domestic product (alternatively gross national product or national income). On the microeconomic scale, economists use the amount of income per person within a household, the amount of the holding’s expenses, less often the wage level. For measuring economic efficiency, the following indicators are used: employment and professional activity indicators, workforce productivity, fixed asset capital intensity and energy intensity indicators, investment level, outlays on research, and development activity [
22,
23]. A special set of economic sustainability indicators was developed for the assessment of farms activities. Production results (e.g., the amount of revenue, income, and production costs) and the indices of cost-effectiveness, liquidity, stability, and productivity are the most popular [
24]. The economic dimension can also be equated with the concept of the viability of a farm, i.e., the ability to last in changeable market conditions for a long period of time [
7]. In the article, the authors focused on income as an indicator for the economic condition of the farm. However, measuring income cannot disregard the issue of its distribution. Even income distribution is often treated as a social element of sustainability. The Gini coefficient based on the Lorenz curve is usually used in this case [
25]. However, FADN does not allow the computation of the Gini coefficient due to aggregated data on national, regional, or standard output level. Based on the Gini coefficient, A. Sen proposed a measure of well-being, taking into consideration the level and distribution of income per capita. It turns out that a high level of income per capita is not always tantamount to a high level of socio-economic development [
26]. Another example is the Index of Sustainable Economic Welfare (ISEW) created by H.E. Daly and J.B. Cobb, where individual expenses on consumption adjusted for losses resulting from uneven distribution of income are the key point [
27]. In view of the above, the publication indicates the diversity of income and the impact of agricultural policy on this diversity, grouping agricultural holdings by economic strength. It should be noted that the level of income achieved in a given group of farms determines the quality of life and contributes to achieving social goals of sustainability In this sense, sustainability analysis has a broader dimension than just economic.
Sustainable development is one of the main challenges of economic policy today. From the perspective of the economic sustainability of agriculture in the European Union the key dilemma related to the functioning of the Common Agricultural Policy (CAP) may be indicated. It answers the question regarding the effectiveness of intervention mechanisms in the creation of an adequate standard of life for agricultural producers. It was, after all, the initial motive to create, in the 1960s, a single agricultural policy of the European Economic Community, and this remains valid also in the current assumptions underlying the CAP [
28,
29]. The implementation of the above would require the involvement of a significant portion of total expenditures in the EU’s budget. Nonetheless, relatively high CAP expenditures are criticized by advocates of the neoliberal approach, who raise concerns about disturbing markets by capitalizing subsidies in prices [
30,
31,
32,
33,
34,
35]. In the shared opinion of the authors, taking into account the neoliberal perspective while assessing the agricultural sector support is unfounded, as it does not take into consideration the specific conditions of the agricultural market and the land factor, including, for instance: pressure to consume food and absence of substitutes thereof, low price and income elasticity of demand for agricultural products, limited mobility of assets invested in farms, or a long period of return on investment. Moreover, changing weather conditions and natural (biological) adjustment processes translate into the higher seasonality and cyclical nature of supply and prices, thus resulting in an absence of income stability and difficulties in management [
36]. Thus, the conditions of production, which are unfavorable for agriculture, imply ineffective (in the Pareto sense) allocation of production factors. This means that the production factors may not be put to other use that would improve the situation of at least some farms without any losses for other agricultural producers or non-agricultural sector. In market conditions farmers are under tremendous pressure to increase the scale of production and concentrate land. This farm cost squeeze makes it difficult to exercise non-commercial functions such as includes keeping the biodiversity and landscape values, taking care of rural culture, animal welfare, and high food quality which has negative external environmental results. At the same time, the market, following the principle of balancing marginal costs, contributes to the creation of strong oligopolistic structures, thus leading to the relative income deprivation of economically weaker farms [
37,
38]. The effect thereof is the continued disparity between agricultural and non-agricultural income in the conditions of an increase in average salary in the economy. This is because, in the process of determining the indirect and final demand, a farmer participates in the distribution of added value to an inadequate degree due to an absence of internalization, i.e., taking into consideration many costs (e.g., maintaining the environmental welfare) and the absence of fees for the public goods provided. The economic surplus provided by agricultural producers does not meet the optimum allocation criteria in the input-output analysis and is largely captured by the purchasers, processors, sellers, and finally consumers. The notion of relative deprivation is used deliberately, as it demonstrates the relation of agricultural to non-agricultural income. In order to ensure an adequate standard of life for rural residents, not only an absolute increase in income is needed, but also a reduction in the disparity between incomes in the agricultural and other sectors of the economy. It may be assumed that when assessing their economic situation, people usually do so by way of comparison with others [
39].
The consequence of the above relationship is the need to return the portion of economic surplus that came from the producers of raw materials. To solve this problem, the Common Agricultural Policy was created and introduced in the 1960s as the first sectoral policy. Initially, five CAP objectives were defined, as the basis for its functioning [
40]: (1) increasing the productivity of agriculture through technical progress and optimal use of production factors, mainly work; (2) ensuring a fair standard of living for the agricultural population, in particular by increasing wages (income); (3) stabilization of agricultural markets; (4) guaranteeing regular food supplies; (5) ensuring rational food prices for consumers. Improvement of the agriculture production output and increase in the supply of food (objectives 1 and 4) with growing farm incomes (objective 2) in just a few years was a success. The alternative cost of the intervention, mainly involving the administrative purchasing of agricultural raw materials at a fixed price, was related to the relatively high prices of food and excess supply in the sectors covered by support (milk, butter, cereals), with a large import of non-supported agricultural products. Two of the above-mentioned objectives (3 and 5) were therefore not achieved. This was the reason for the reforms that were undertaken in subsequent periods.
The external effects of interventions and growing integration within the European Union as well as with the global economy (including influence of the World Trade Organization (WTO) negotiations) have changed the point of view of the role of the Common Agricultural Policy. The preferences of Europeans regarding the consumption of food and their attitudes in terms of social and environmental issues have changed [
41]. The answer to the incorrectly designed policy was to change the mechanisms of the CAP and adapt them to new conditions. After the first 30 years of operation, there was a reorientation of the policy with the market-price policy towards income and structural policies, and later also environmental ones. Introduced in 1992, EU Commissioner MacSharry’s reform abolished import tariffs, lowered price support, and withdrew production quotas, and in their place introduced direct payments (originally defined as compensatory and related to the size and structure of agricultural production) and instruments focused on rural development. Two further reforms—Agenda 2000 from 1999 and Fischler from 2003—continued the reduction of market support, increasing the share of the budget for direct payments (attributed to the first pillar of the CAP, from 2005 increasingly decoupled from production and rural areas (Pillar II of the CAP). There were also activities for the natural environment (e.g., afforestation, agri-environmental payments, organic farms) [
30,
42,
43,
44]. The solutions adopted for 2014–2020 support most of the earlier mechanisms, putting even more emphasis on environmental goals. Today’s priorities can be divided into three areas—income, environment, and rural population. In conclusion, the current shape of the CAP exposes the multifunctionality of the agricultural sector—in addition to food production, it contributes to the attainment of social goals and provides environmental public goods. There has been a reorientation of budget expenditures from those aimed at a continuous increase in the productivity of production factors through high food prices to those that directly form the farmer’s income, while at the same time taking care of the development of rural areas and nature. Thus, the scope of the impact of today’s EU agricultural policy is wider than assumed in the treaty objectives and to a greater extent meets the expectations of farmers and the entire society, in line with the principle of socio-economically sustainable development. This type of support mechanism is an important premise to continue the EU Common Agricultural Policy [
45]. However, although the directions and instruments of support have changed, the analyzed policy still remains ineffective in solving certain important structural problems. First of all, it mainly supports big, large-area farms. About 80% of direct payments go to less than 20% of entities, which risks a deepening of the income gap between small and large producers [
46,
47]. Hence, the authors hypothesized that although CAP support increases the overall level of farm income, it does not lead to equalization within the agricultural sector. The research presented further will demonstrate the correctness of this reasoning.
3. Materials and Methods
In the first stage of the research the income gap ratio was estimated based on the non-agricultural sectors’ income and income gained in a representative farm (belonging to the European Union Farm Accountancy Data Network—EUFADN) by fully-employed family members (Family Work Unit—FWU) in all years within 2005 and 2015 (this scope covers all hitherto accomplished CAP programming periods in the “new” member states, provided that the agri-environmental schemes have usually a few years contract lag; the last period, 2014–2020, is still on-going). Family Work Unit is the full-time equivalent employment of the member of farm, i.e., the total hours worked divided by the average annual hours worked in full-time jobs in the country. One family work unit corresponds to the work performed by one person (member of farm family) who is occupied on an agricultural holding on a full-time basis. Average income from non-agricultural sectors was adopted as the average annual gross salary per employee in USD for each of the analyzed countries, separately and in the individual years of the research period. The values of average annual gross salary per employee came from the World Bank database and were expressed in USD. Then, they were converted into EUR using the average annual USD/EUR exchange rate. In this way, both the average annual gross salary per employee in each country and income of a representative FADN farm per person working full-time in the family from these countries was expressed in the same currency and could be comparable. The implementation of constant prices was not necessary due to the fact that both average salaries and agricultural incomes related to the same period. However, we made EUFADN values consistent, adopting a constant exchange rate multiplier, as mentioned above, for those countries which had national currencies in the EU. The formula for calculating the income gap is presented below. As we worked on the panel data (i.e., cross-sectional and time series data) there was no tradition to weight units, because estimated fix or random effects are designed to address the space heterogeneity of analyzed countries, regions, or classes. So, in the vast majority of panel analyses objects are not weighted. However, to make our study more interesting for readers we decided to present both panel averages and weighted averages for the EU-23 (countries of the EU-15 and the EU-8, as explained before), EU-15, and UE-8. In the latter case we used the family labor force (in 1000 Annual Work Units) engaged in agriculture at the country level as weights to calculate the income gap indices. Higher index values mean a larger spread between non-agricultural and agricultural incomes, index values equal to 0 and lower mean there is no income gap.
Although we considered weighting the income with power purchasing parity, this operation performed both in the nominator and the denominator would not have any effect from a mathematical point of view. In the consecutive steps of the analysis, the relative ratio (
Table 1,
Figure A1,
Figure A2,
Figure A3,
Figure A4 and
Figure A5) and also absolute value of the income gap (the nominator) are presented (
Table 2). By this means, one can see whether differences for larger categories (i.e., farms with higher production expressed in standard output (SO) classes) are not only self-fulfilling prophecies.
The year 2004 was not included as in the countries that joined the EU in May 2004 the payments to agricultural production did not cover the full 12 months, and therefore the income from agriculture could be understated against the next years. The analyses also excluded Malta and Cyprus, because neither the OECD nor EUROSTAT databases included any data regarding the average annual salary in the national economy per full time worker, which made it impossible to calculate the index (however, due to the low importance of the agricultural sector in these countries compared to the entire EU, the omission thereof should not cause any obstacles in further reasoning). Therefore, we analyzed the impact of CAP on the level of economic sustainability of farms in the EU for EU-15 countries (Belgium, Denmark, Germany, Ireland, Greece, Spain, France, Italy, Luxembourg, Netherlands, Austria, Portugal, Finland, Sweden, United Kingdom) and UE-8 countries (Czech Republic, Estonia, Latvia, Lithuania, Hungary, Poland, Slovenia, Slovakia). Bulgaria, Romania, and Croatia were excluded from the analysis due to their late accession to the EU and lack of data for the whole period under study. In the first variant the income from the representative EUFADN agricultural holding included payments under CAP funds, which comprised the total payments to the operating activity and the balance of payments to and taxes on investment activity; in the other variant these payments were excluded. The comparison of these two variants made it possible to assess the influence of the CAP support on the economic sustainability of agriculture in the EU, separately for EU-15 and EU-8, in each year between 2005 and 2015.
In the second stage of research a comparative analysis was carried out to find the impact of CAP payments on the economic sustainability of agricultural holdings of various economic strengths in EU-15 and EU-8. The time scale of the research covered the years 2005–2015. Two variants were applied in comparisons. In the first one, as previously, the income from an agricultural holding included the value of payments obtained from Common Agricultural Policy funds, in the second one it was reduced by this value. Agricultural holdings were once again divided into six classes of SO (the economic size of an agricultural holding is expressed in SO units and it is the average value over five reference years of plant and livestock production obtained from 1 ha or from one animal, in conditions average for a specific region). Further on, we compared the changes in the income gap ratio of the difference of annual per capita salary in the national economy and income from an agricultural holding per FWU in these two variants to the average annual salary per full time employee in EUR in individual years. We assumed that a similar impact of payments under CAP on the ratio between agricultural incomes and salaries in the national economy in various economic classes of farms meant that none of these classes was privileged as regards the impact of payments on economic sustainability, which would also be an argument for the social sustainability of agriculture itself (as one of the elements of social sustainability is an even distribution of incomes in the researched group).
In the last stage of research a panel regression was estimated in order to determine which group of payments and subsidies under CAP between 2005 and 2015 had a significant impact on the income of individual economic size classes in the European Union countries (sample of 253 observations—11 years × 23 countries). Estimated coefficients allowed the assessment of how the value of respective subsidies should change (increase or decrease) to fill the identified income gap. As the analyzed data combined cross-section data (for the European Union states in individual size class) and time series data (2005–2015), panel regression was used to study the dependence of net farm income in FWU on various groups of subsidies. We expected all the subsidies coefficients to have positive signs, which was the result of earlier work of the authors [
48]. A linear model was used in the analysis, which seems to be substantively justified. The impact of subsidies on income was examined, so it could be assumed that an increase in subsidies by one unit leads to a proportional increase in income (all the more, the impact relates to the same period). There was no reason to assume that an increase in subsidies would result in less (such as in logarithmic function) or more (as in exponential function) proportional increase in income. Besides, in other similar works, subsidies also appeared as a linear element [
18,
19,
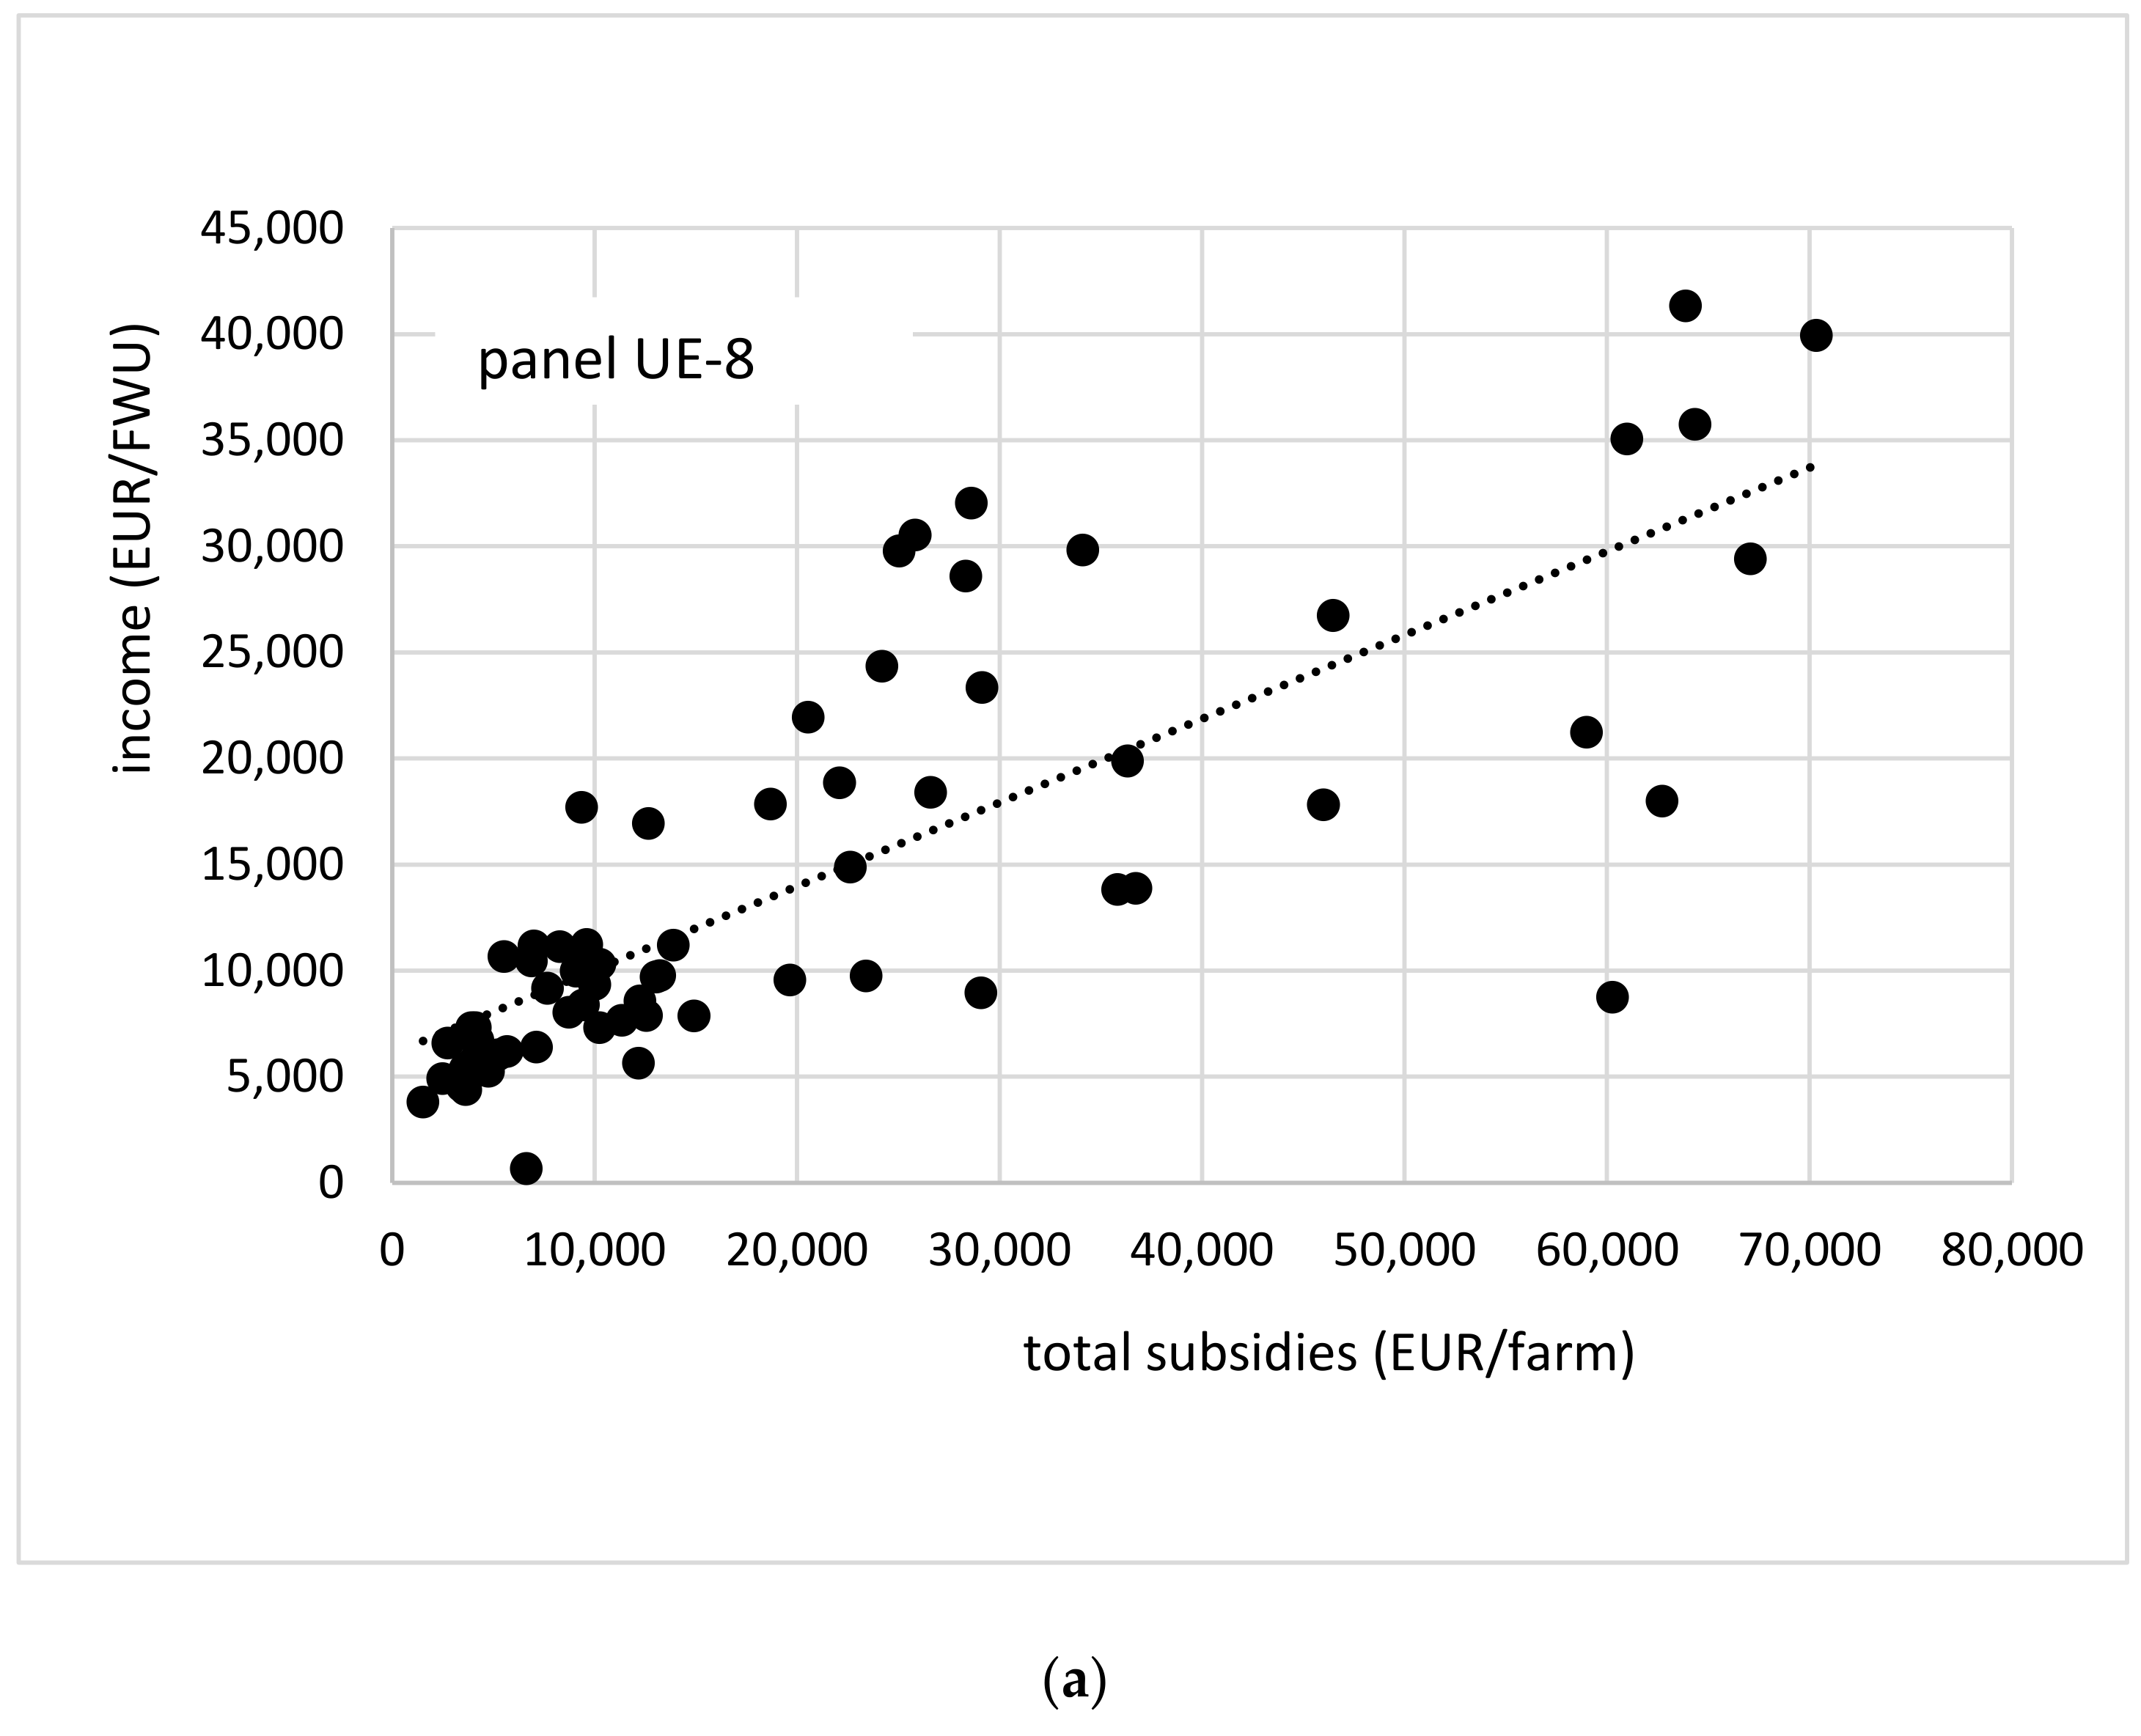
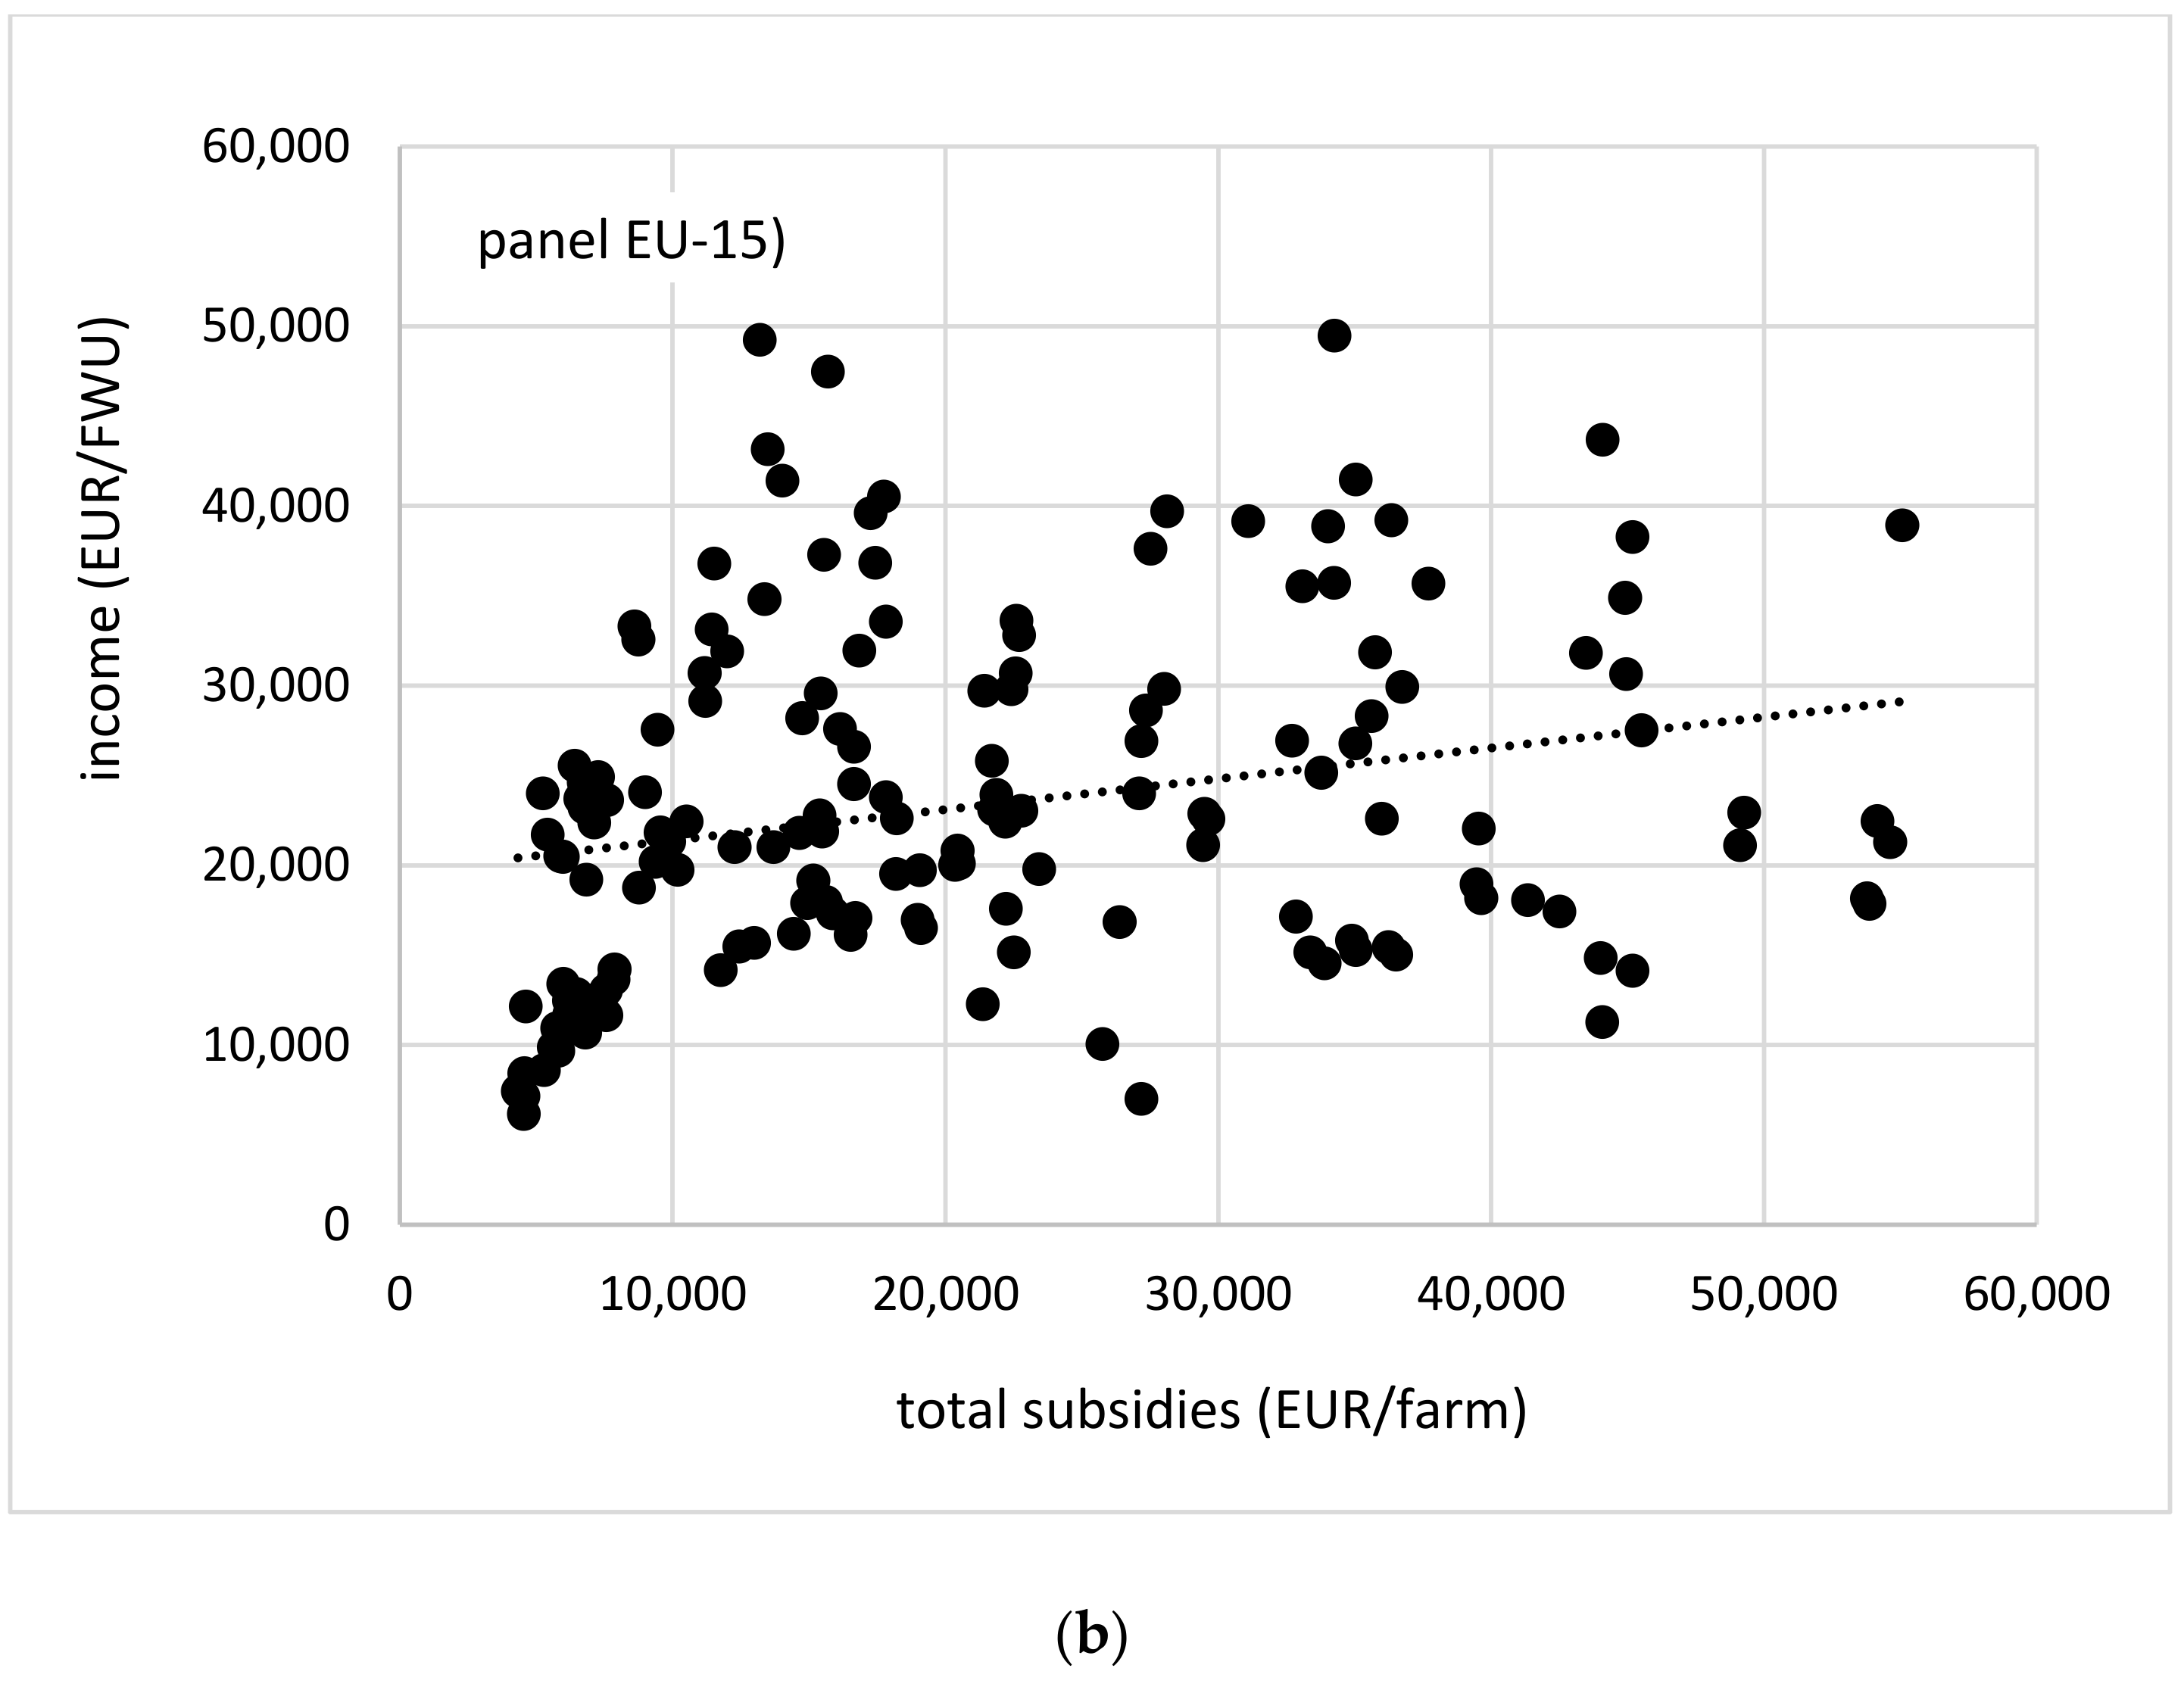
49]. Following the scatter plot analysis it was also decided to use a linear model. Although scatterplots for panel data are not very transparent (there should be a sperate scatterplot for each cross-section and time series) we present them in the
Appendix A for the income and total subsidies in the EU-8 and EU-15 panels (
Figure A6). In this situation, a linear fit proved to be the most appropriate The following model was finally adopted:
where panel data consist of:
Yit—net income (less depreciation) of i country representative EUFADN farm per FWU and in year t;
X1it—value of payments to public goods (understood as the total of set-aside payments, agri-environmental payments, support to less-favored areas, and other payments under rural areas support programs per FWU);
X2it—value of payments to plant and livestock production (total payments to plant and livestock production, balance of payments, and penalties for milk producers, payments to bovine animals, sheep, and goats per FWU);
X3it—value of decoupled payments per FWU;
X4it—value of payments to intermediate consumption per FWU;
X5it—value of payments to investments per FWU;
X6it—value of additional support.
Next, ordinary regression models were constructed using the classical method of least squares (CMLS). To assess which of the models (fixed or random effects models) were appropriate, the Breusch–Pagan, Hausman, and Welch tests were carried out. The final models were estimated using robust HAC errors. The collinearity of variables was assessed based on the variance inflation factor (VIF). All variables did not exceed the critical value of VIF = 10 (only three variables in six models exceeded VIF = 2, which is the most restrictive approach in literature). In this part of the research FADN holdings were divided according to economic classes expressed by the values of standard output of a farm in Euro.
4. Results
For EU-23, agricultural income gap ratio in the years 2005–2015 accounted, on average, for 34%, including the payments under CAP, and 131% without payments. If considering weighted averages, the latter improved to 86%, which results mainly from the relatively high share of Poland and Italy, as the countries with labor-intensive agriculture (the result including payments is at a similar level). At the same time, the ratio without subsidies in the EU-15 countries was almost 50% lower than in EU-8 countries, for panel arithmetic calculation, and more than 30% for weighting data (
Table 1). Thus, weighting the data reduced differences in the income gap between “old” and “new” member states. On the other hand, income gap, including subsidies for EU-15 countries was 20% lower, in the arithmetic average variant, and slightly over 60% for weighted data. In this case, the use of weights increased the disparity in income gap. However, regardless of whether a country belongs to EU-15 or EU-8, absence of an agricultural policy in the EU would cause the average costs in EU agriculture to exceed incomes, and thus render agriculture unprofitable. This is proven by higher values of income gap for the variant without payments. Simultaneously, it should be noted, while taking into account average values, that the profitability of agriculture in countries accessing the EU in 2004 and at the same time its economic sustainability between 2005 and 2015 were more dependent on the EU support than the agricultural sectors of EU-15 countries. Concurrently, the diversification in this respect was higher among EU-8 than among EU-15 states. The countries whose agricultural sectors benefited the most from CAP (in terms of income) between 2005 and 2015 were Slovakia and the Czech Republic, i.e., countries with relatively large agricultural holdings (it turns out that the main beneficiaries of payments under CAP are highly productive farms, which will be demonstrated further on). In these countries the income gap ratio, including payments under CAP, changed the most—farm incomes exceeded the national average income and the ratio became negative. The least support under CAP was received by representative farms from Poland, as the difference in the income gap with payments under CAP (66%) and without them (86%) was definitely the smallest in this case and amounted only to 20 percentage points. Among the EU-15 countries small differences were observed in Italy (25 percentage points), Greece and Portugal (29 percent points), and Spain (32 percentage points), and Scandinavian farms in Finland, Sweden, and Denmark benefited the most.
As for the division of holdings into economic classes, payments under CAP between 2005 and 2015 contributed to the increase in the income gap ratio of agricultural income to average income in each such class, however this impact was varied. In the smallest holdings, payments improved the income gap ratio of agricultural to non-agricultural incomes by about 50 percentage points, and by over 2000 percentage points in the case of the largest holdings. A distinctive feature is that the larger the holding’s output, which determines its economic class, the higher the beneficial impact of payments under CAP on economic sustainability. In this respect the asymmetry was very high, which was proven at least by differences in the impact made by payments under CAP on the income gap ratio in the smallest holdings, as well as the largest ones (see
Table 2). A typical characteristic was also that in EU-8 countries the asymmetry in this respect was much higher than in the EU-15 countries. Similar results were obtained by Matthews [
50], who suggested that the inequalities in the allocation of support between small and large agricultural producers were higher in the case of new member states, most of all Bulgaria and Romania.
The purpose of further analysis was to determine the trends regarding the impact of payments under CAP on the economic sustainability of individual classes of FADN holdings.
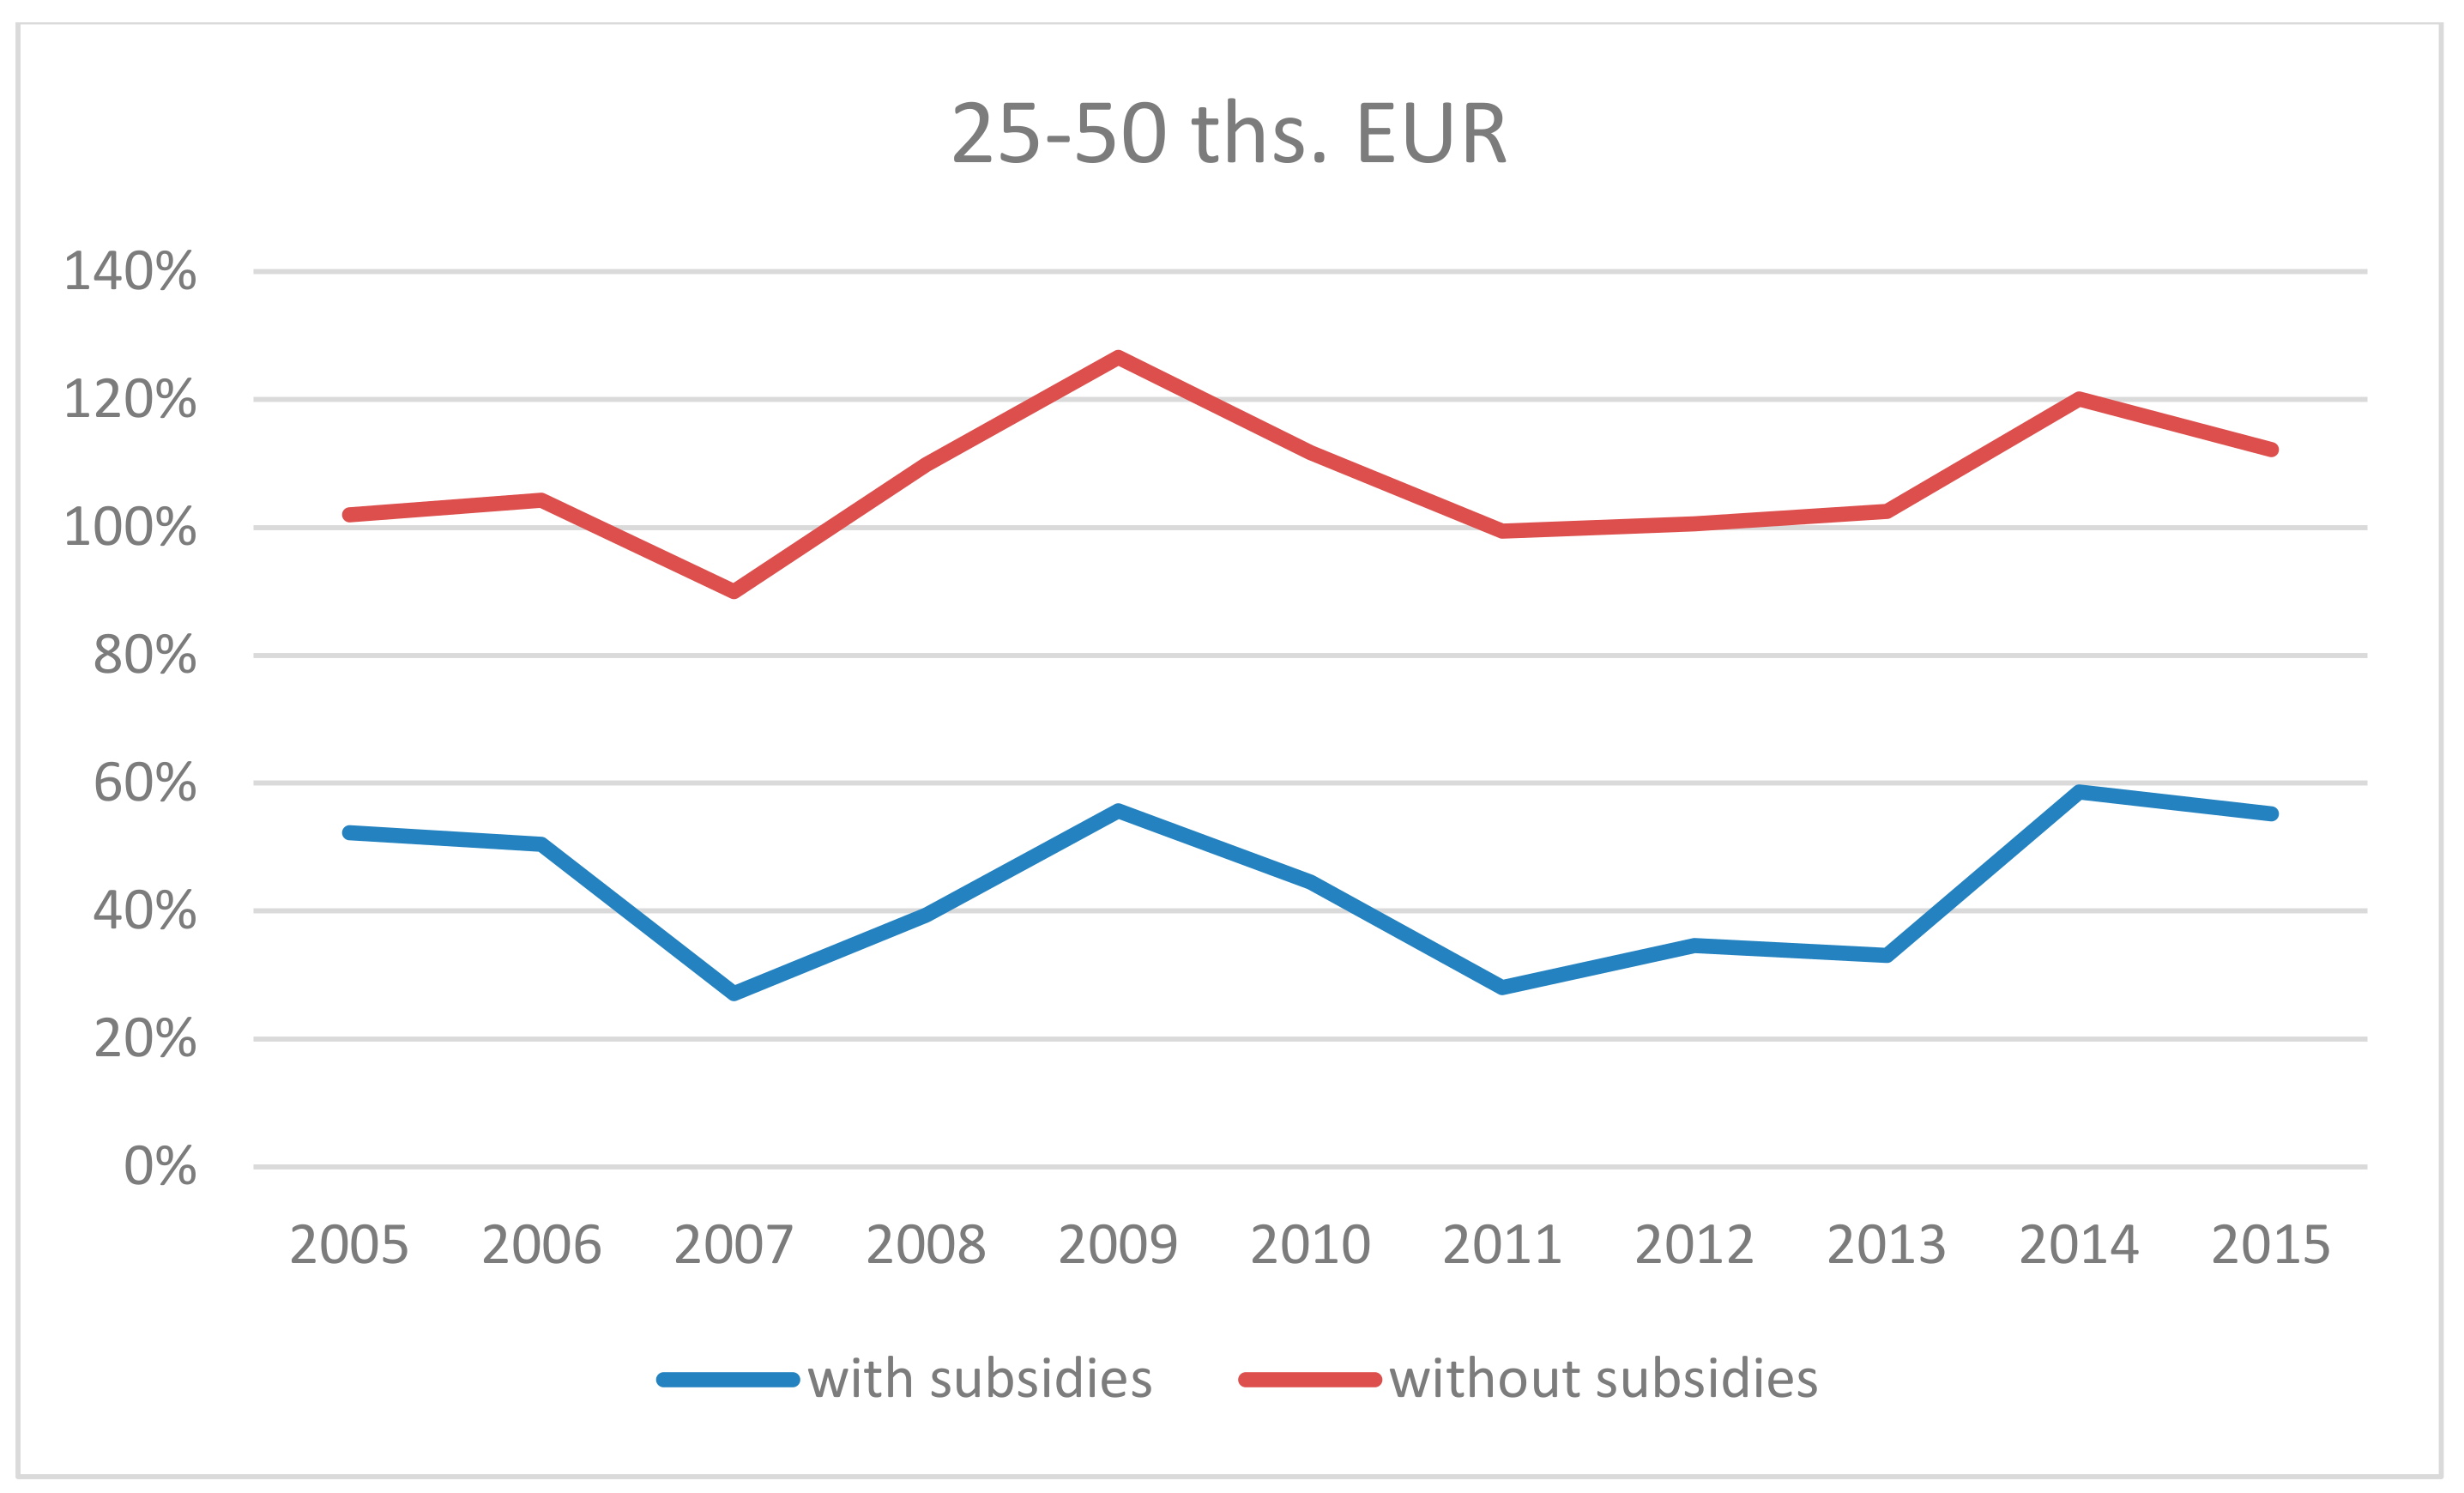
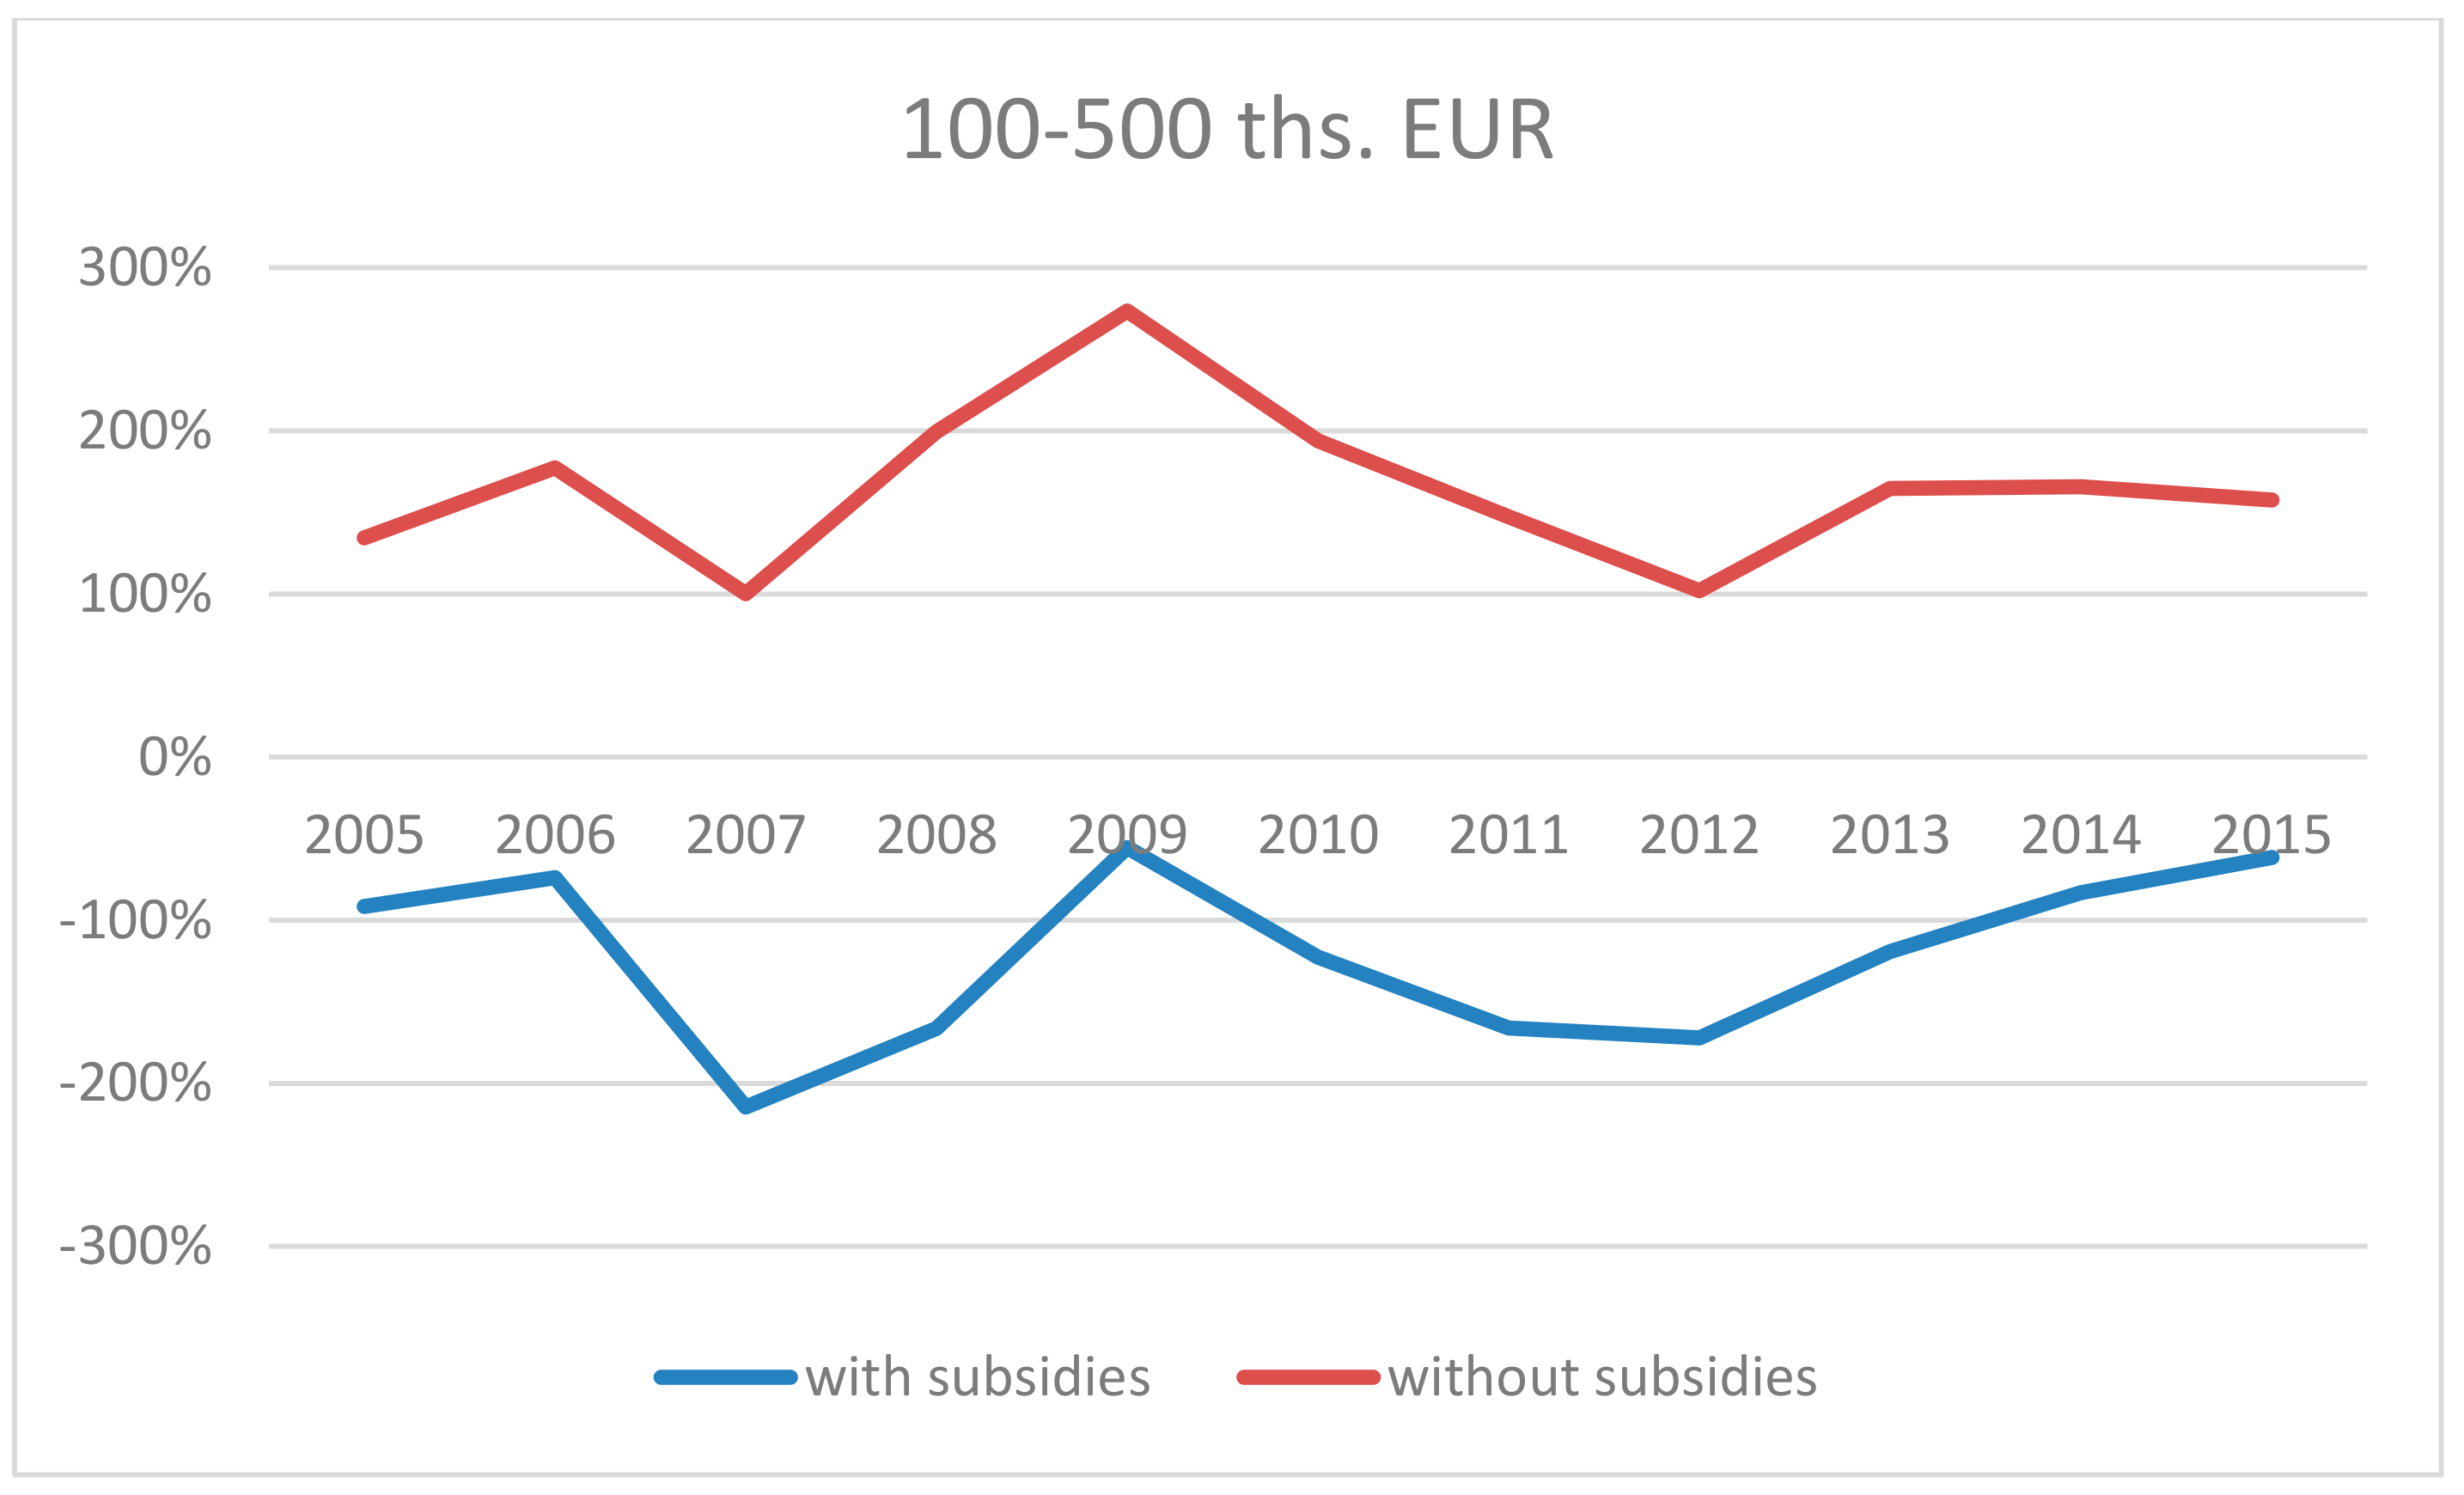
Figure A1,
Figure A2,
Figure A3,
Figure A4 and
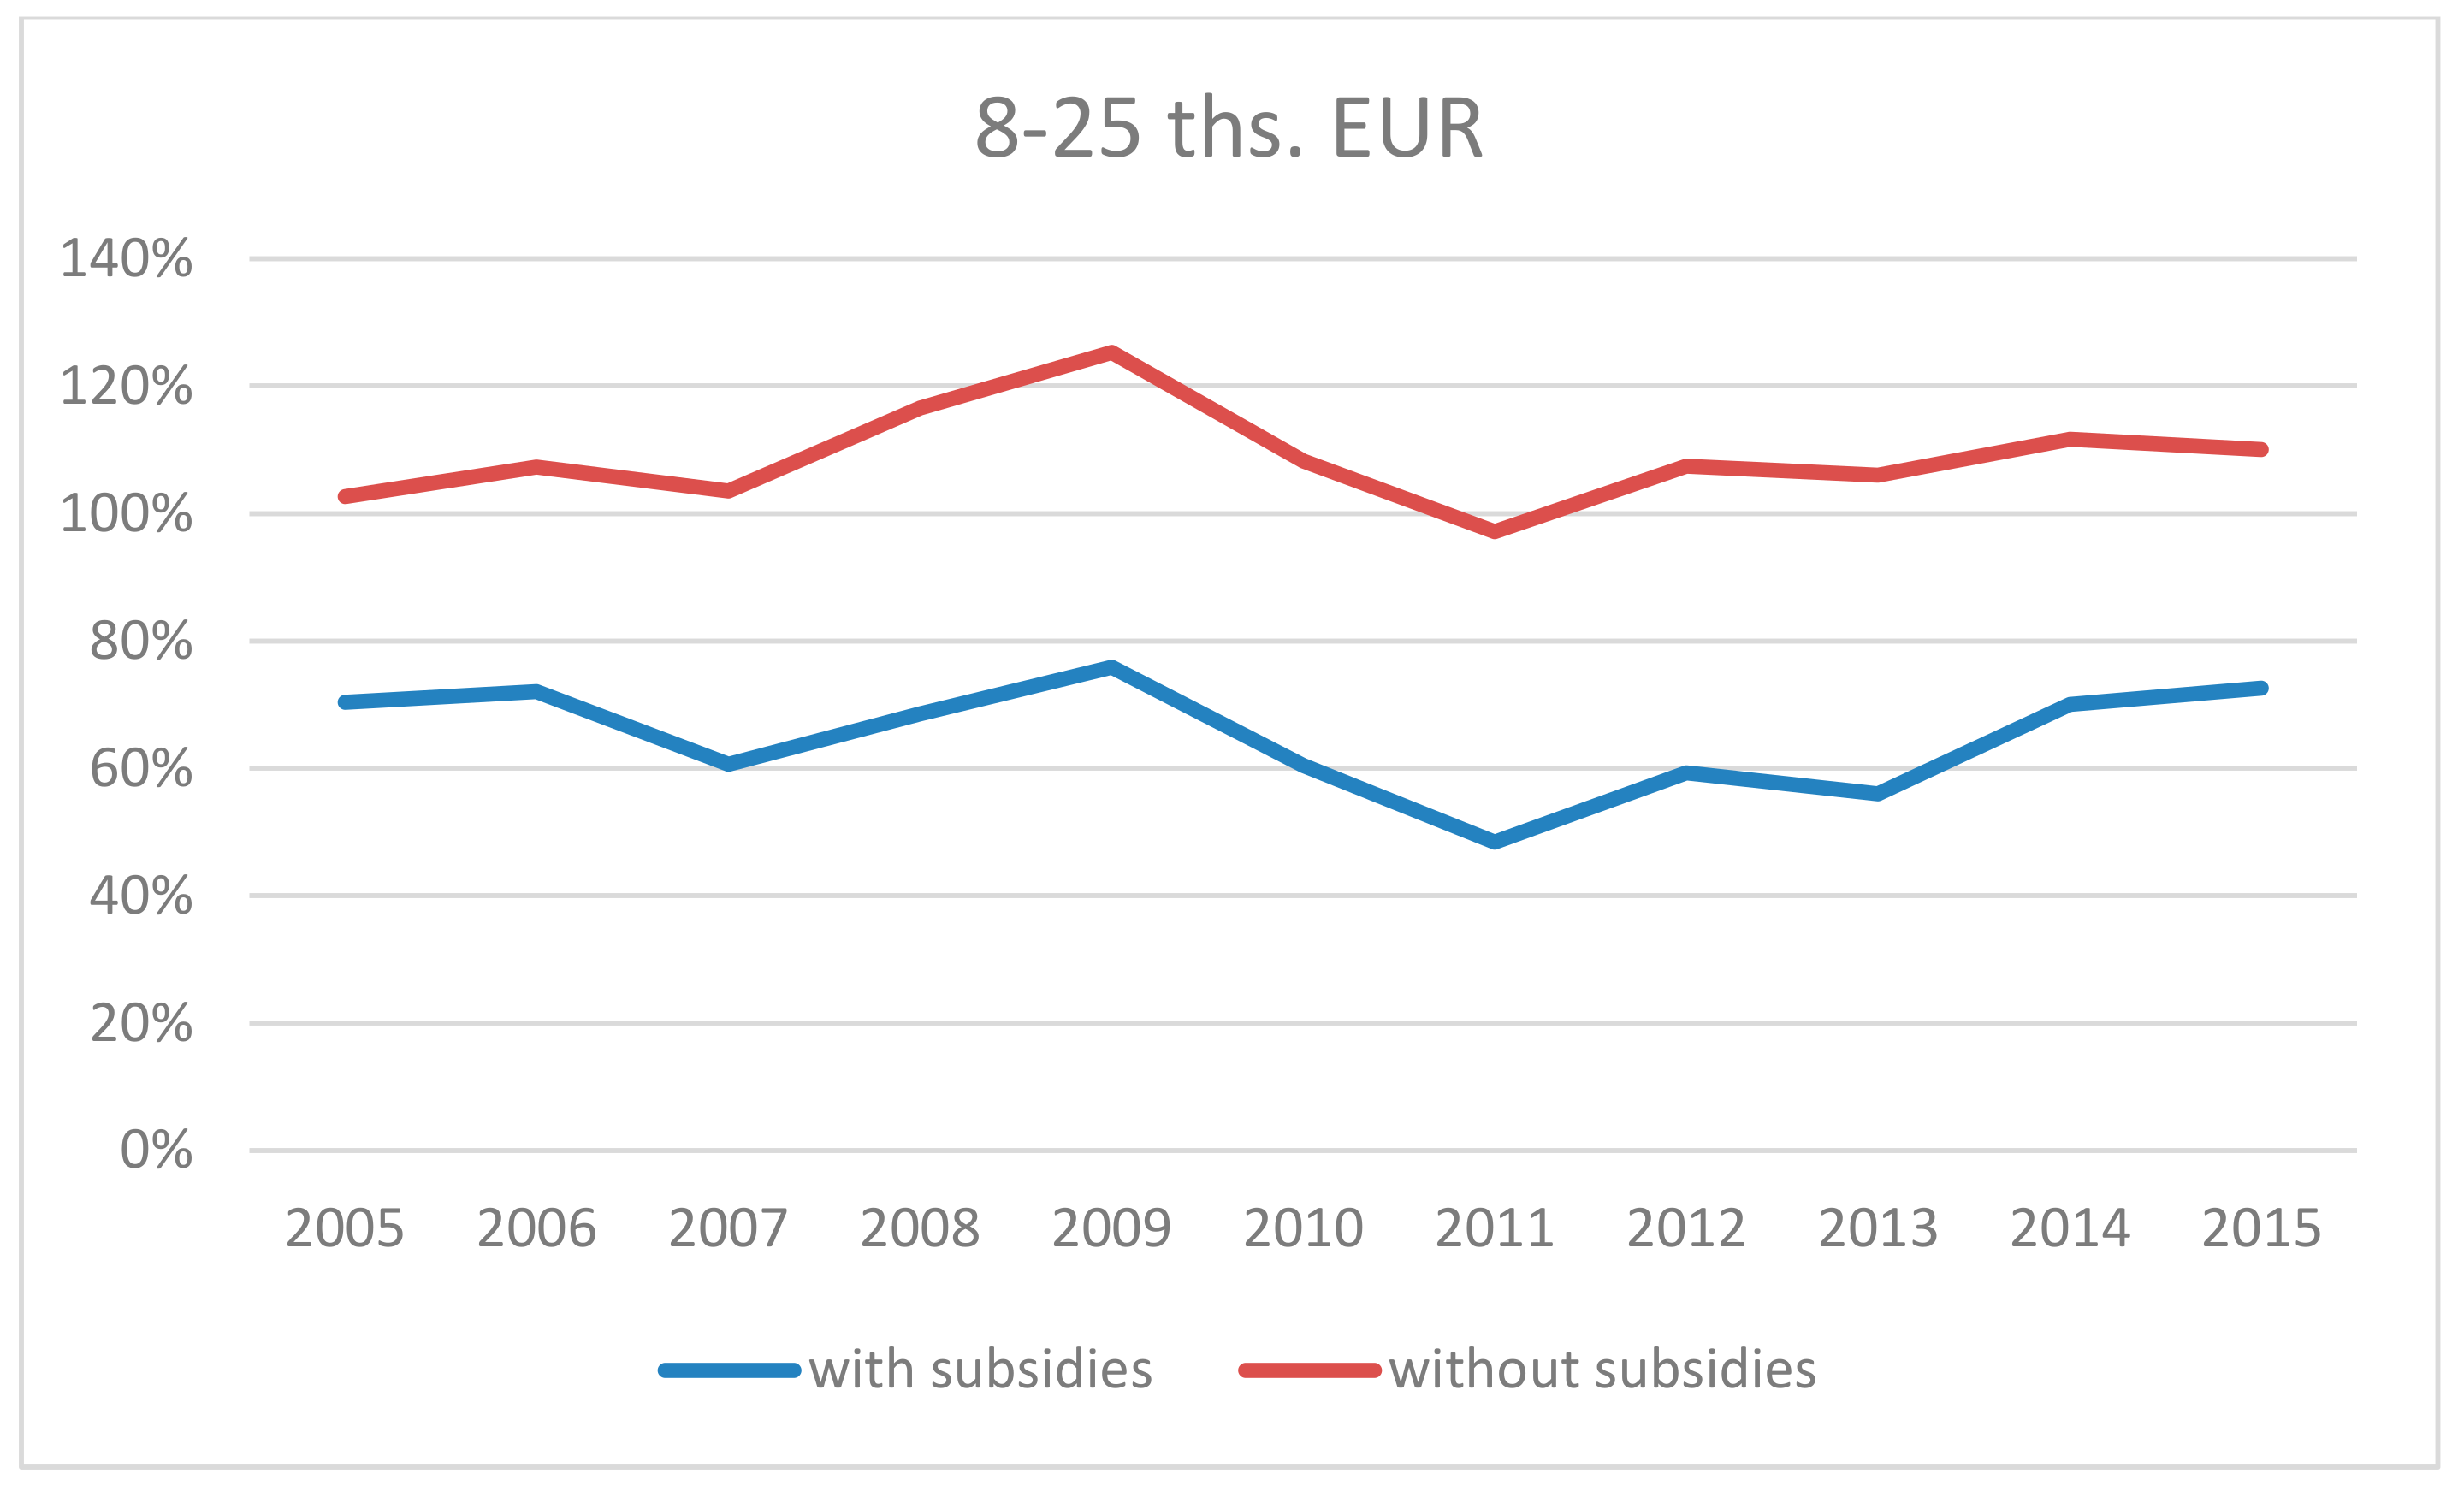
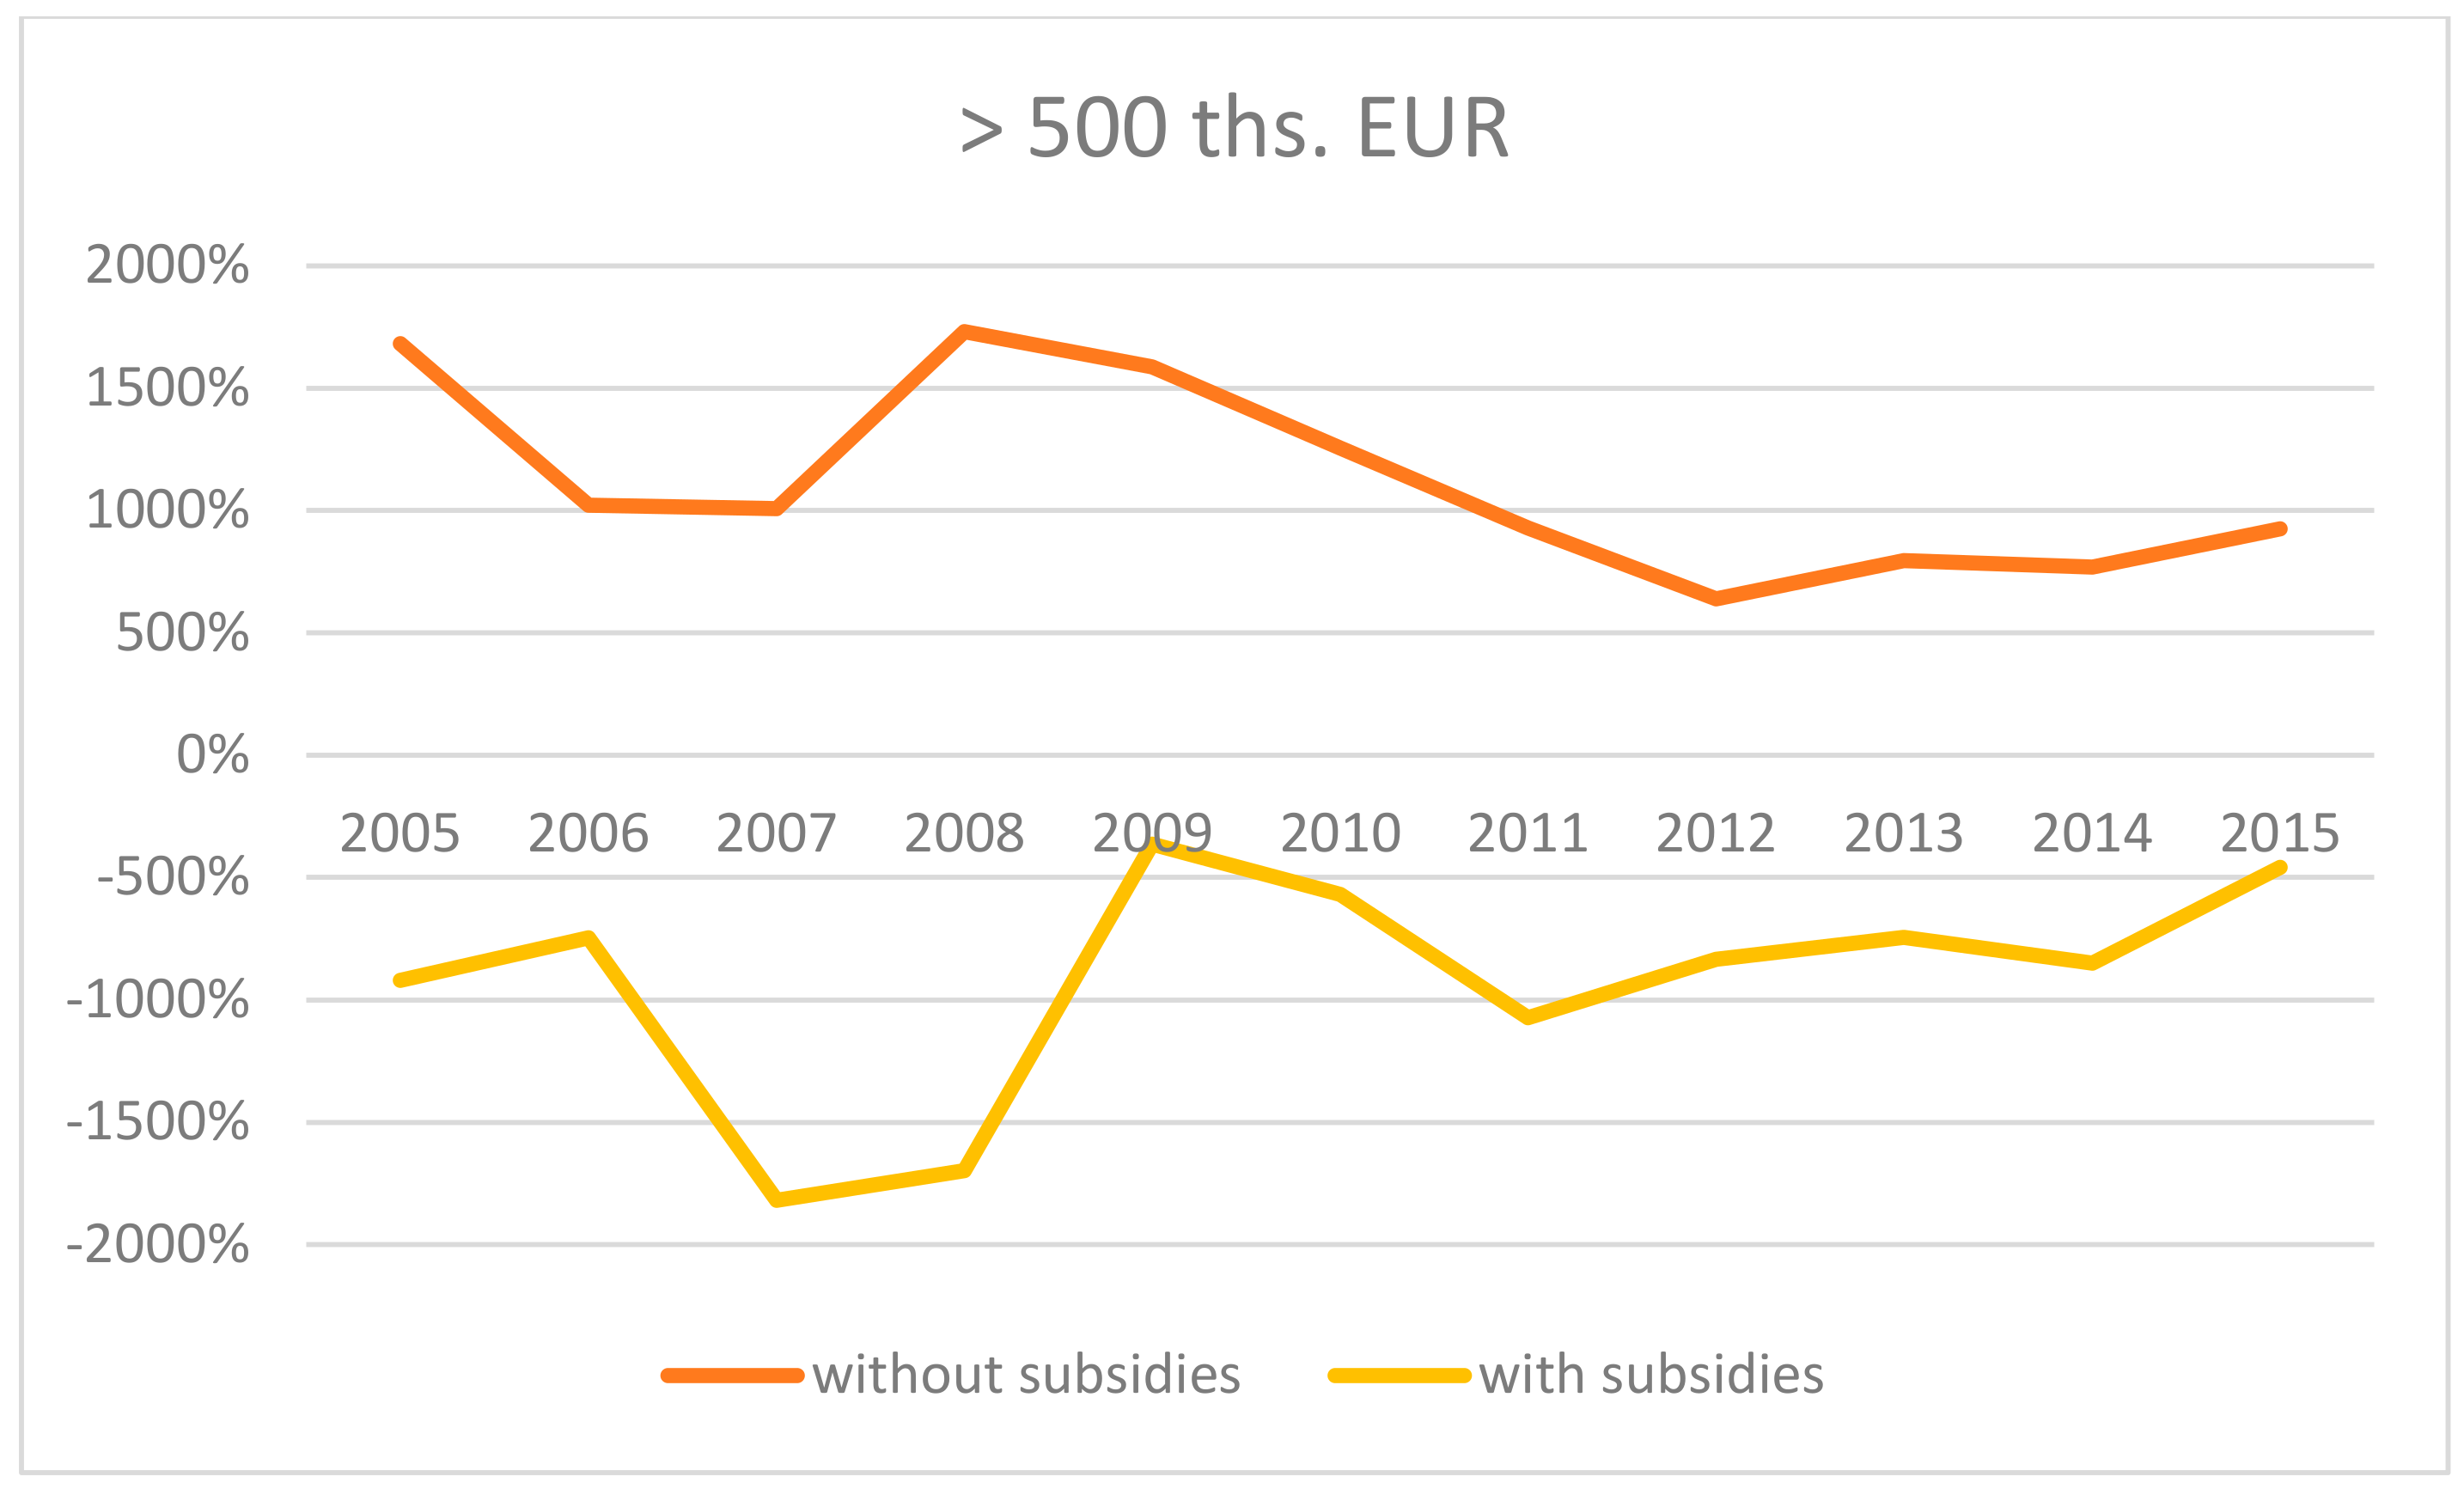
Figure A5 present the income gap ratio of agricultural to non-agricultural incomes, both with and without payments, in the years 2005–2015. It is clear that the changes were irregular in various classes of holdings. Definitely the largest difference between the ratio with and without payments was noted in the two final economic size classes grouping the biggest holdings. In the years 2005–2015, the income gap ratio of their incomes to total average income after including payments under CAP did not practically exist—the relationship was negative for the whole period (see
Figure A4 and
Figure A5). If the support is excluded, the ratio of agricultural to non-agricultural incomes would be much less favorable. For classes with EUR 8–25k and EUR 50–100k the difference in the ratio of incomes with payments and the ratio of incomes without payments changed on average by 44 percentage points and 63 percentage points, respectively.
The final stage of the research was to estimate, using panel regression, which CAP programs had an impact on incomes gained by agricultural holding of various economic size classes. It was concluded that the fixed effects model was adequate for class 1, 3, 5, and 6 of economic size. In classes 2 and 4 SO the random effects model was more adequate. It should be reminded that the analysis covered a pile of time series (years 2005–2015 for each group of economic size) and therefore
within R2 assigned the changeability of incomes to explanatory variables, which also changed over time. The significance of variables in models is presented in
Table 3. Statistically significant variables (whose
p-values did not exceed 0.1) are marked with the asterisks and bold.
The models show that in different classes of economic size, other groups of subsidies under the Common Agricultural Policy proved to be significant and diversified income in many ways. For instance, in the first SO class, which includes agricultural holdings gaining the lowest income (EUR 2000–8000), the payments to public goods, payments to investments, and additional support (this specific support is granted under article 68 of regulation (EC) no. 73/2009, taking into account other payments to the operating activity of a holding, as well as grants and subsidies to losses and extraordinary payments ) proved to be significant, while in the sixth class, including the economically largest entities, production aid and payments to intermediate consumption were significant. On the other hand, farms receiving more public goods support had, on average, a lower income than those receiving more other support. The negative impact of payments to public goods results from the fact that gaining such support means the need to give up some portion of production (e.g., by allocating potentially arable land for agri-environmental purposes), which as a result causes a reduction in potential revenues from agricultural activity. While analyzing the significance of individual groups of payments in various size classes, it should be noted that payments to public goods were significant in almost all SO classes except the second. Nevertheless, the direction of the flow of these payments impacted the income differently. A positive impact on income was observed only for classes of 1 and 5 SO. It should be stressed that as the economic power of a holding grew, the significance of payments decreased, similarly to their negative impact on income, which was demonstrated by lower values of slope coefficients. Production aid was in fact a significant condition influencing income gained in economic size class 3 and in economically strongest holdings (class 6 SO), however in this area the impact on income was lower, which was expressed in the lower value of slope coefficient. This was a result of a significant share of penalties for exceeded production limits, therefore in relatively large-scale holdings (and with higher income per FWU) the payments did not play a significant role in income-making.
Results from
Table 4 show that the CAP support had the relatively weakest income effect in the medium SO class of farms (25–50k EUR).
Hence, both the smallest and medium-size farms would need a similar increase in payments to fill the income gap. However, the most striking observation concerns the large and largest EU farms, in which “excessive” support might cover the income gap of all other classes with a big surplus (
Table 2 and
Table 4).
5. Discussion
It should be recalled that the absence of agricultural policy in the EU would make agriculture unprofitable. This is one of the key arguments in favor of maintaining the support for the agricultural sector in the EU [
51]. Many studies show that without CAP support farms’ incomes would be much lower, or even negative [
49,
52,
53,
54,
55], providing that this support does not affect market price structure. Based on the observation of data, it may be stressed that owing to CAP subsidies, the average incomes of agricultural holdings in individual EU states almost reached average incomes in national economies, which surely had a favorable impact on the economic sustainability of agriculture in the EU, which is visible in the smallest income gap ratio scores [
56]. The situation has evidently improved since 2004 (i.e., the accession date of new members states) compared to Cai and Pandey’s results [
18], who reported persistent agricultural value added gap for 15 European countries over 1970–2004. It is also worth noting that the income gap ratio of income including payments for the second half of the analyzed period was on average lower than at the beginning of period, which may result from the increase in support under the so-called phasing-in in the years following the accession to the EU. It may be assumed with high probability that in some EU-8 states (mainly Baltic Republics), these ratios will be improving in the coming years, as they were effective in lobbying in favor of more equitable distribution of direct payments after 2013 [
57]. In general, however, it may be concluded that the research hypothesis adopted in the introduction was confirmed through the analysis. Although the average income of agricultural holdings in all EU countries was reaching the average income in the national economy, the distribution of the support was uneven, in favor of larger holdings. This led to an increase in income disparity between small, medium-sized, and large agricultural holdings in the EU. These results are consistent with Bereżnicka’s research conclusions [
58], according to which the differences in incomes between various groups of holdings are large, and their value has been impacted not only by payment levels but also by the allocation of resources, allowing high output by the strongest holdings. The author also showed that in large holdings there is a very strong one-way interdependence between the income value and payments. On the other hand, the paper by Graca-Gelert [
59] demonstrated that in the years 2005–2010 direct payments deepened the difference in incomes, and early retirement as of 2007 contributed to the inequality of incomes. As direct payments account for the largest portion of support for agricultural holdings in the EU, the increase in income disparity was generally visible. Szarfenberg [
60] also indicated a steady increase in income disparity, which results from the system of payment calculation: larger holdings receive higher payments, smaller ones receive only nominal amounts. The consequence thereof is the adopted proportion between the cumulative share held by beneficiaries and the cumulative value of transfers from the EU budget defined as 80/20. This means that 80% of the economically weakest agricultural holdings in the EU receive 20% of the total funds earmarked for CAP payments, and on the other hand, 20% of the strongest holdings capture 80% of support; nevertheless it is worth noting that those 20% of farms cultivate more than 60% of land [
61]. On the other hand, Matthews [
50] indicated that for FADN holdings, the 20% of the strongest beneficiaries took approximately 65% of direct payments, and 10% of the economically strongest (i.e., 750k holdings out of 5 million FADN farms) received 45% of support. Lower asymmetry in this case results from the fact that the research covered FADN holdings, i.e., relatively stronger economically, therefore the disparity in the distribution of subsidies is lower. This, of course, changes the perception of the inequality to some extent. Moreover, one may ask the question: do small farms add something more to economic value for their smaller size (e.g., more public goods). A debate on whether small farms are really more environmentally and socially friendly, and then should be more supported, is still on going.
The decoupled payments proved to be important for class 4 and 5 SO, corresponding with the results of research by Czyżewski and Matuszczak [
62]. The authors demonstrated that direct payments were not judged as significant financial support by Polish farmers; such patterns are also visible in other EU-10 states dominated by economically weaker holdings. These trends (although not value of impact) have also been corroborated by conclusions made by Gołasa [
63] following research on the impact made by selected instruments of the Common Agricultural Policy on the income of agricultural holdings in Poland. Payments to indirect consumption were significant only in class 4 and 6 SO, whereas payments to investments significantly diversified income in classes 1, 2, 4, and 5. The value of additional support was significant for the first four groups of holdings with relatively lower economic power. In EU-15, there is different evidence. Rizov et al. [
64] said that decoupled subsidies negatively influence revenues. The impact of support on the production and productivity of farms in EU-15 has been also studied by many authors [
65]. These studies indicate that the subsidies before the introduction of the decoupling reform (Luxembourg 2003) had a positive effect on production, but after the reform and the introduction of the Single Payment Scheme (SPS) system the effects were ambiguous, and there is even some evidence of a negative impact.
The above results allow the conclusion that there is no single, universal answer to the question regarding the impact of various types of support on the incomes gained by agricultural holdings. The results are varied depending on the economic class, the incomes in each class are influenced by a different set of variables, which results from different structural and production conditions of these groups of entities.
6. Conclusions
The authors demonstrated, based on the analysis performed, that owing to funds granted under the Common Agricultural Policy the average incomes of agricultural holdings are reaching the average income in the non-agricultural sector, which confirms the hypothesis of a favorable impact of CAP on the economic sustainability of the agricultural sector. All evaluated support groups (i.e., decoupled payments, production aid, payments to public goods, investment support, payments to indirect consumption, and the value of additional support) proved to be significant for agricultural incomes, and the impact of individual categories of support on the increase in the profitability of holdings was different for various classes of economic size. Also, the combined impact of EU subsidies on incomes gained in farms was diverse—the strongest units benefited the most, even though they are the least vulnerable to market fluctuations, as the recent research on market treadmill showed [
46]. Thus, the Common Agricultural Policy was not an instrument serving to even out the incomes in the agricultural sector, and in this sense it did not offset it in the social aspect [
66]. Taking into consideration the above, future reforms of the CAP should be aimed at maintaining the support for the sector as regards the financial flows volume, and at changing the cash distribution systems. This applies mostly to the “old” EU countries (but also, e.g., Czech Republic and Slovakia), in the case of which a relatively high support for large holdings discourages from boosting productivity [
67]. In this situation, budgetary financing becomes a decision variable in the profitability and optimization account and it somewhat makes the managers of agricultural holdings “indolent”. On the other hand, the influence of productivity on incomes in agriculture is debatable. Some fifty years ago, Cochrane [
68] and then Levins and Cochrane [
69] presented the view that farmers are on a “treadmill”, which, in spite of their constant efforts to improve factor productivity, i.e., by adopting new technologies, wears away any profits that might result. The treadmill is caused by market imperfections, which result from the high flexibility of agricultural prices in response to productivity growth. Cochrane claimed that the agricultural sector would not automatically return to equilibrium and lost rents would never be regained, even though economic conditions had changed to the upward swing of the agricultural business cycle. The above theory was recently tested in Europe, proving that since the mid-1990s, the market treadmill in its traditional sense has not been present in European agriculture [
46]. The disappearance of the treadmill in European agriculture may be linked to the evolution of the CAP, consisting of decoupling the subsidies from production, combined with support for rural development and the provision of public goods that have undermined the effect of the market treadmill. At present, the agricultural value added might be enhanced not only by bigger output but also by higher value added, avoiding unfavorable changes in flexible prices. So, the CAP in old member states should develop the rural development and public goods support instead of direct payments. However, as for EU-12 countries, the situation is quite different, which may result from the gap in the agricultural productivity between the “new” and the “old” EU member states. Differences in the productivity between these groups of countries are the result of differentiated levels of support, mainly due to direct payments. Higher subsidies in the so-called old member countries are the result of higher historical yields, which were the basis for calculating the support rate per unit area. In the new member states the yield level was much lower, hence the rate of subsidies (as a form of compensation for lowering intervention prices) was also lower and this situation still exists. However, one should not forget that the old member states have been supported since the 1960s, so they were able to achieve higher productivity, while the new member states had such an opportunity. Agriculture in new member states still demonstrates a large potential for increase in productivity, whereas in EU-15 states it has reached its upper limit and, in a sense, arrested its development in a classical economic way.
It is also important to allocate money within countries to higher transfers to smaller entities. Although CAP for the years 2014–2020 proposed some solutions aimed as a more even distribution of direct payments, in practice they proved ineffective, also because the implementation thereof was voluntary for the member states. In the case of degressivity/capping of payments in 2015 only EUR 109 million were distributed, which accounted for less than 1% of total funds for the first pillar of CAP. The second element, redistributive payment, resulted in transfers of EUR 1.25 billion, i.e., approximately 3% of CAP first pillar’s budget [
50]. The application of the redistributive payment mechanism allows the EU states to earmark 30% of the total direct payments envelope for smaller holdings (the target area group is determined by the state). As the distribution is effected through the reduction of the entire budget of payments (and not only the largest), its impact on the general allocation among the holdings is limited. Eight countries have used this mechanism. Therefore, new solutions in this area should be sought. This is a good time for it, as we are now facing the new financial perspective for 2021–2026. The results referred to herein may become an argument in favor of a Common Agricultural Policy that is both economically effective and more equitable for farmers.


