Article

Quality Evaluation of Potato Tubers Using Neural Image Analysis Method

Institute of Biosystems Engineering, Faculty of Agronomy and Bioengineering, Poznan University of Life Sciences, ul. Wojska Polskiego 28, 60-637 Poznan, Poland
*
Author to whom correspondence should be addressed.
Submission received: 12 February 2020 / Revised: 26 March 2020 / Accepted: 1 April 2020 / Published: 4 April 2020
(This article belongs to the Special Issue Image Analysis Techniques in Agriculture)

Abstract

:
This paper describes the research aimed at developing an effective quality assessment method for potato tubers using neural image analysis techniques. Nowadays, the methods used to identify damage and diseases are time-consuming, require specialized knowledge, and often rely on subjective judgment. This study showed the use of the developed neural model as a tool supporting the evaluation of potato tubers during the sorting process in the storage room.

1. Introduction

Potato (lac. Solanum tuberosum L.) is one of the main crop plants in Poland, as well as in other countries. Although the potato is no longer the basis of the European diet, it is a very important part of it. Poland is one of the leading potato producers not only in Europe but also in the world—7th place with 2.5% share; resulting in a harvested 10 million tons (390 million tons of potatoes are harvested worldwide) [1]. Potato production represents a significant share of farm income. Consequently, the development of modern production and storage technologies is extremely important. Limiting both quantitative and qualitative losses is crucial to the profitability of potato production [2]. The basis for the high quality product intended for consumption is the use of the high quality potato seeds. Tubers that are free of disease and mechanical damage are essential in the professional cultivation of potatoes [3]. In Poland, the storage period of tubers for planting is about seven months. During this period it is important to provide suitable storage conditions such as the right temperature, ranging from 3 to 5 °C and humidity of 90%–95%. However, even optimal conditions will not prevent loss during storage. Water loss has an influence on both quantity and quality. There is also a loss caused by pathogens during the storage period. The most common are Phytophtora infestans; potato plague; Fusarium ssp., which causes dry rot (responsible for high losses in Chinese potato production); Helminthosporium solani causing silver scurf; Pseudomonas ssp. causing wet rot; Clavibacter michiganensis septonicus causing ring bacilli; and other infections. The infected tubers are characterized by discoloration, from brown to leaden, ranging from a few millimeters to the whole in case of severe infestation of pink mycelium and mucosal bacteria. Such symptoms also indicate the presence of Phytophtora infestans bacteria. The pathogenic fungicide is mainly used during the vegetative season by fungicide applications up to 10 times or more [4,5]. In the storage season, various physical methods such as magnetic fields or microwaves [6] and negative selection, which involves the removal of diseased or damaged tubers, are used. The identification of damaged and infested tubers and their elimination prior to planting is crucial to reduce further losses in the growing season, whereas the selection of tubers before the storage period influences their quality and reduces storage losses [7]. The origin of all kinds of mechanical damage, greening, bruises, and peel cracking caused by improper farming or unfavorable soil and climatic conditions, and damage caused by pathogens increases not only storage costs, but also disqualifies the tubers from the point of view of their suitability for consumption. Identification of bruises and damage is often difficult due to soil debris contamination that remains after harvest. However, it cannot be removed excessively while preparing the tubers for storage due to the possibility of mechanical damage resulting in storage and consumption losses. High quality requirements for producers make it necessary to select the product at the time of its harvest, preparation for packaging, and storage. Therefore, non-invasive methods for identifying lesions are investigated [8].
More and more often, particular stages of agricultural production are supported by modern technologies (such as computer image analysis and signal analysis) or are replaced by fully- automated product evaluation systems [9,10]. This is due to the pursuit of a high level and repeatability of the assessment. For example, if the image contains large amounts of data, the key is to choose the right features and parameters, that will allow accurate description of the examined object. Analytical systems are designed to mimic the behavior of human experts [11,12]. The basic task of image analysis is to determine which information is necessary for the problem under investigation. This is related to a significant reduction in the amount of information. From a few hundred thousand (or a few million) bytes representing typical conditions, the digital image leaves only a few dozen or several hundred bytes, containing information about the values extracted during the analysis of the parameters of the objects constituting the image [13,14].
One of the most common issues encountered in the literature concerning agricultural production using artificial neural networks (ANNs) are classification and prediction problems. Examples of the use of this type of modern method are research on the application of modern methods as an alternative or support for processes encountered in agriculture [15], both in classification and prediction issues.
One such approach to applying image analysis was presented in research of developing a method for detecting pathogens and potato plant traits, where an unmanned aerial vehicle (UAV) was used as the image acquisition instrument to obtain aerial photos of a plantation. These observations were verified by tests carried out in the laboratory. The developed models were able to correctly recognize approximately 70% of cases [16].
Recently, there has been a considerable interest in researching potato issues, in terms of tuber evaluation and classification, and identification of lesions, diseases, and contaminants. Examples of this include studies related to the detection of the tuber placement and the presence of contamination on the sorting line, as well as the placement of tubers during the packaging process. For this purpose, the authors have used edge detection algorithms based on digital image data [17]. The developed algorithm achieved 90%–100% efficiency in successful edge recognition. The possibility of using this type of method at the harvest stage, in the combine, and during the pre-cleaning process was shown.
The issue of automation of potato tuber evaluation was based on an analysis of their surface images presented by Tian and Zhao [18]. The authors analysed issues related to the types of damage and the selection of effective methods for their identification. The benefits of using computer image analysis to automatically detect damage and measurements of tubers were also reported by Razmjooy’s research team. They presented an approach to using image information at the product sorting stage. The developed system was characterized by high accuracy and rate (depending on speed), which translated into the efficiency of the entire sorting module [19].
A similar utilitarian aspect was presented by Przybył, along with his team in the study of the classification of potato tubers [20]. The identification process was carried out on a sorting line, using image analysis techniques in combination with a neural classifier. The studies demonstrated the superiority of the developed technique over the previously-used methods of recognizing potato species, with the ANN model achieving accuracy of approximately 99% correct classifications.
An early detection of insect infestation or fungal diseases is crucial to prevent yield mass and quality losses. Therefore, methods based on different spectra of light wavelengths, based on hyperspectral or x-ray imaging were developed. Those techniques allow for a non-invasive inside view and provide additional information on the analyzed object. During the research it was proved that these methods are suitable for accurate detection in all tested classification models [21,22].
Literature studies on this subject indicate that the image is validated as a source of data in modern methods to support agricultural production. An interesting approach was presented by Rutolo’s work, where gas sensors [23,24] were used to detect decay processes in stored products. Predictive models have been shown to be effective in early detection of fungal diseases in stored products.
The aim of this study was to investigate the application of modern image analysis techniques and neural modeling methods in the qualitative assessment process of stored potato tubers, based on information encoded in the form of digital images. For this purpose, identification and extraction of descriptors describing the objects presented in the photographs were made.

2. Materials and Methods

2.1. Materials

The research material consisted of potatoes of the Gala variety, obtained from a farm located in Dabrowa Biskupia (Poland, Kujawsko-Pomorskie province, Inowrocław district). Potatoes were grown on medium and light soils (classes IIIa, IIIb, IVa, IVb, and V, in a six-class system (plus subclasses) where class I represents the best arable soils and class VI the weakest arable soils) with a traditional system (tillage with moldboard for soil inversion), in rows of 75 cm in width and 20 to 23 cm in height. The one-stage harvest was carried out in the second half of October with a single-row harvester with roller separators equipped with a tank. The unloading stage was carried out using a receiving hopper with a roller separator, spiral rollers, and polyurethane rollers. During picking and loading of the crates, the tubers were inspected and selected manually. Parameters and storage conditions were as follows:
  • Box pallets (120 × 160 × 125 cm), about 1200 kg) of the Dutch type;
  • Storage height up to 5 m;
  • Storage compartment with a chimney ventilation system;
  • Humidity 88%–97%;
  • Temperature 5.5–6.5 °C.
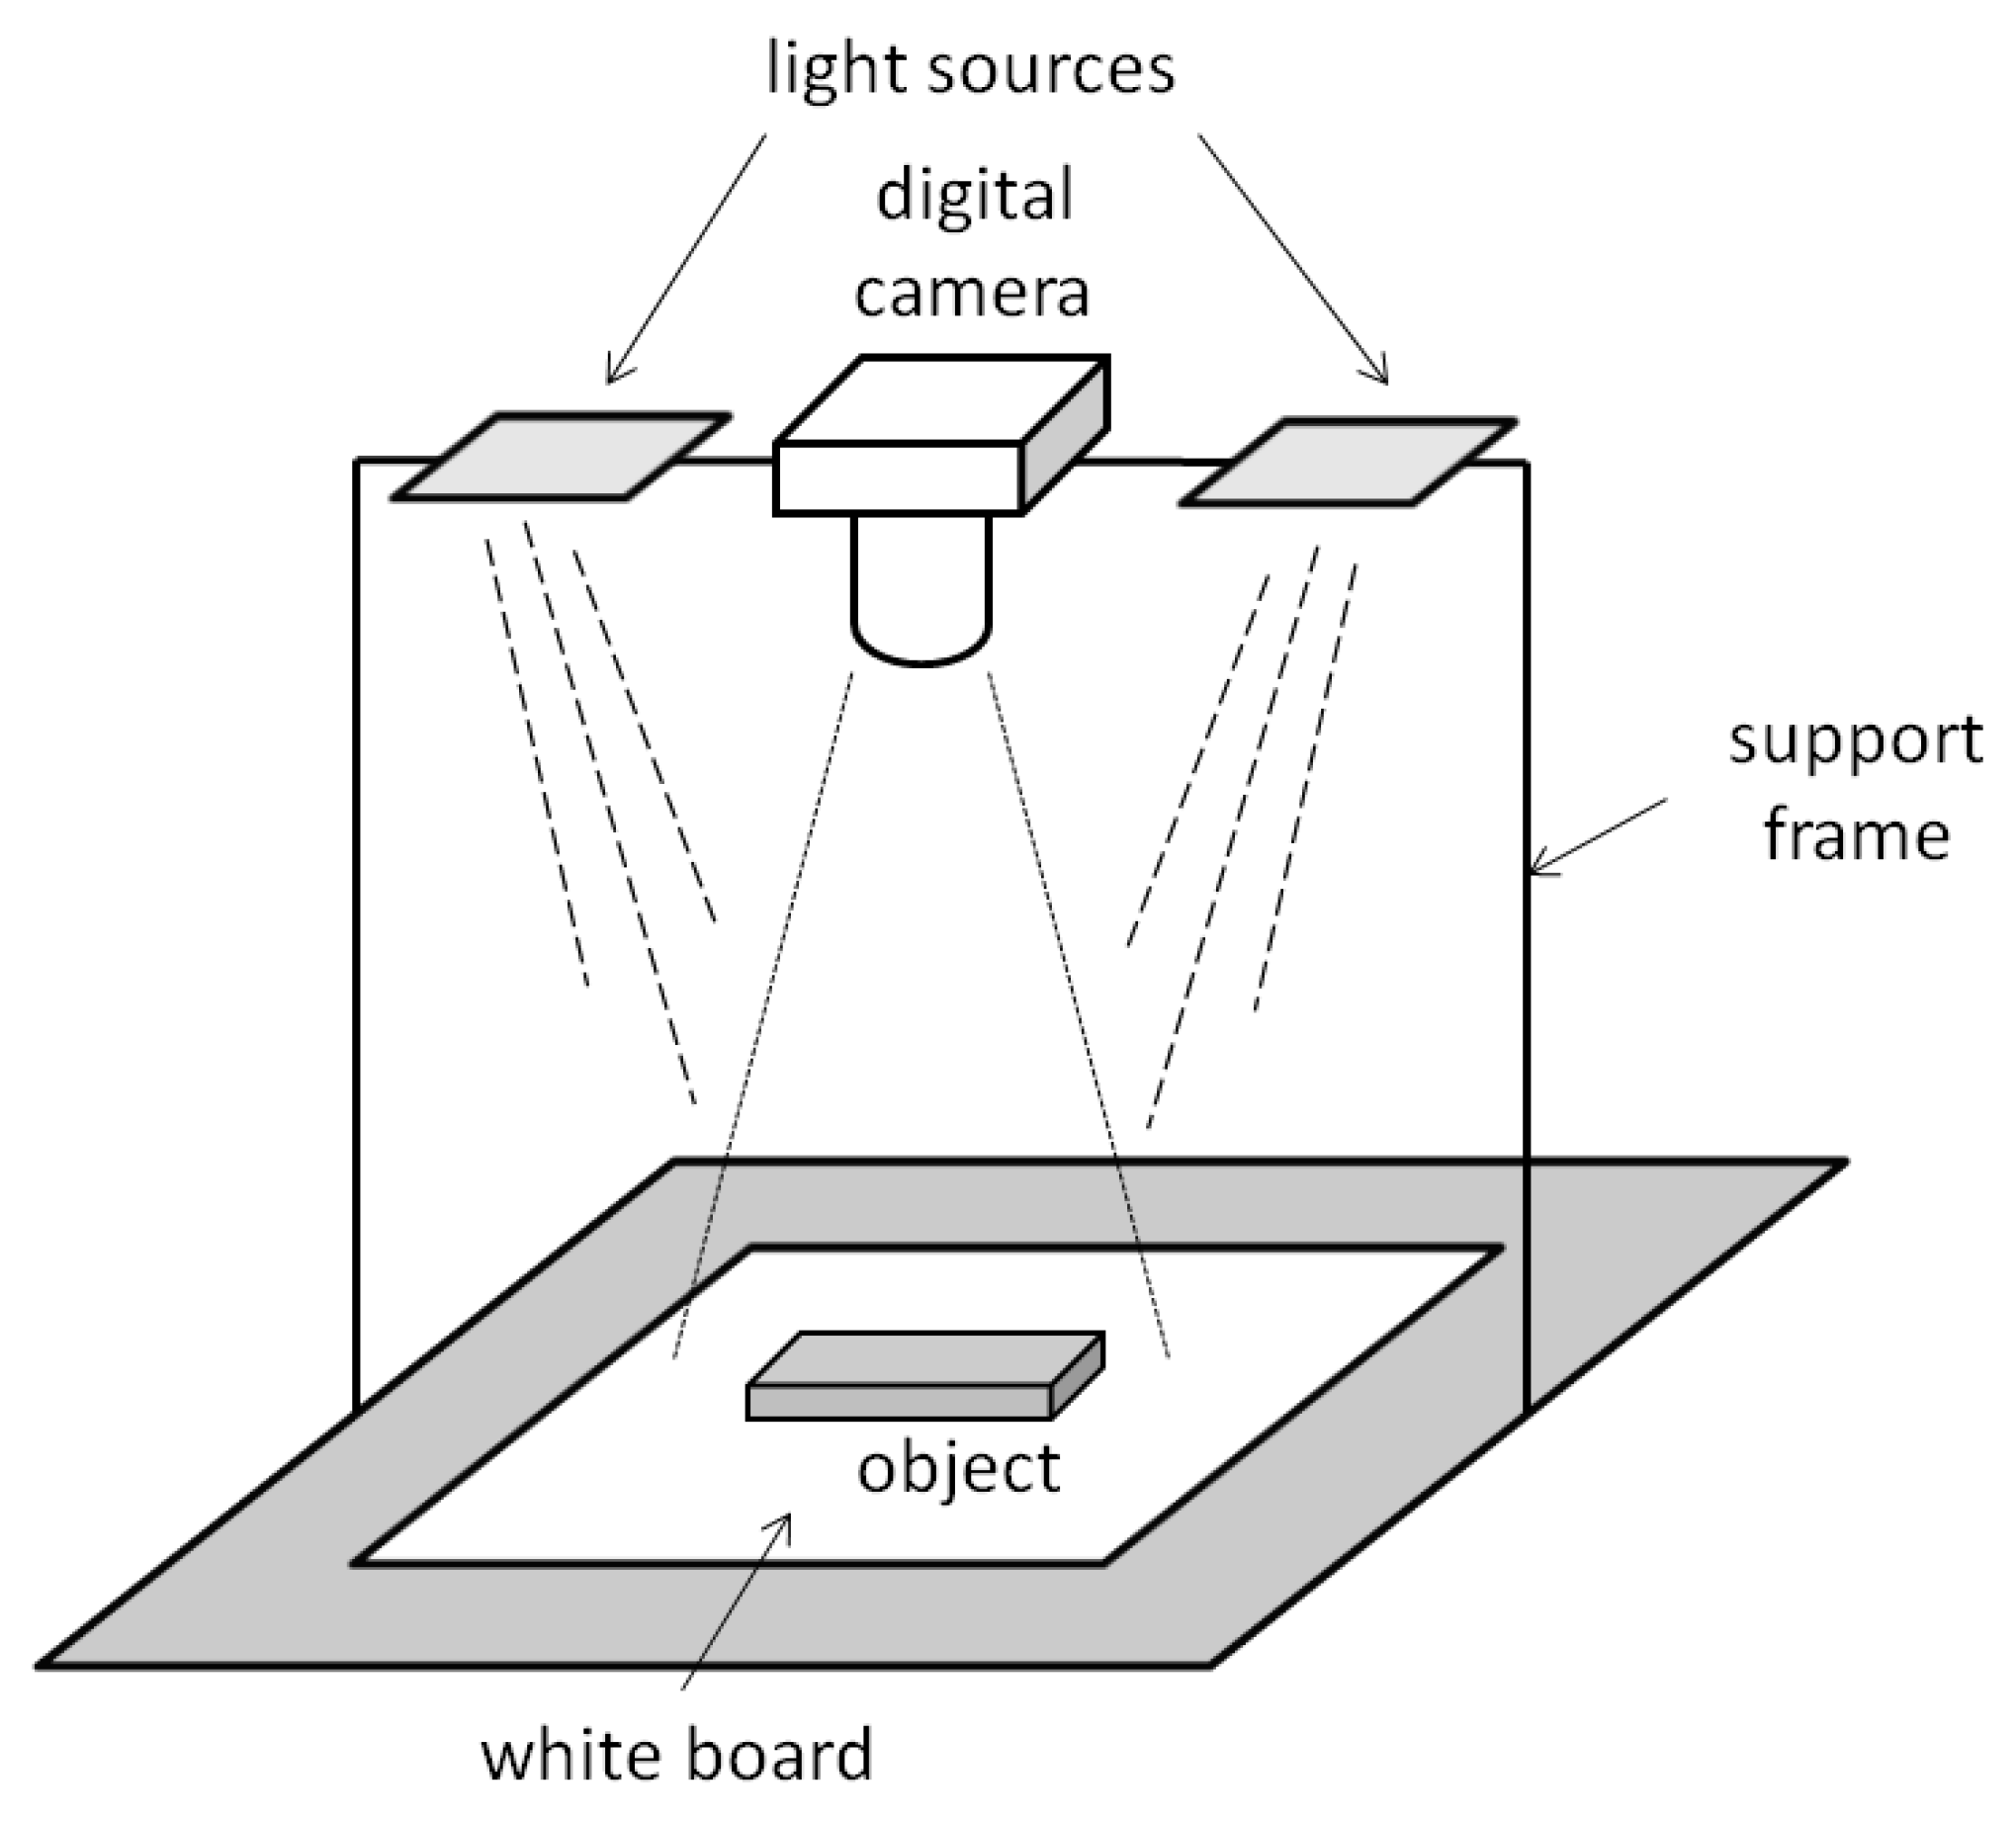
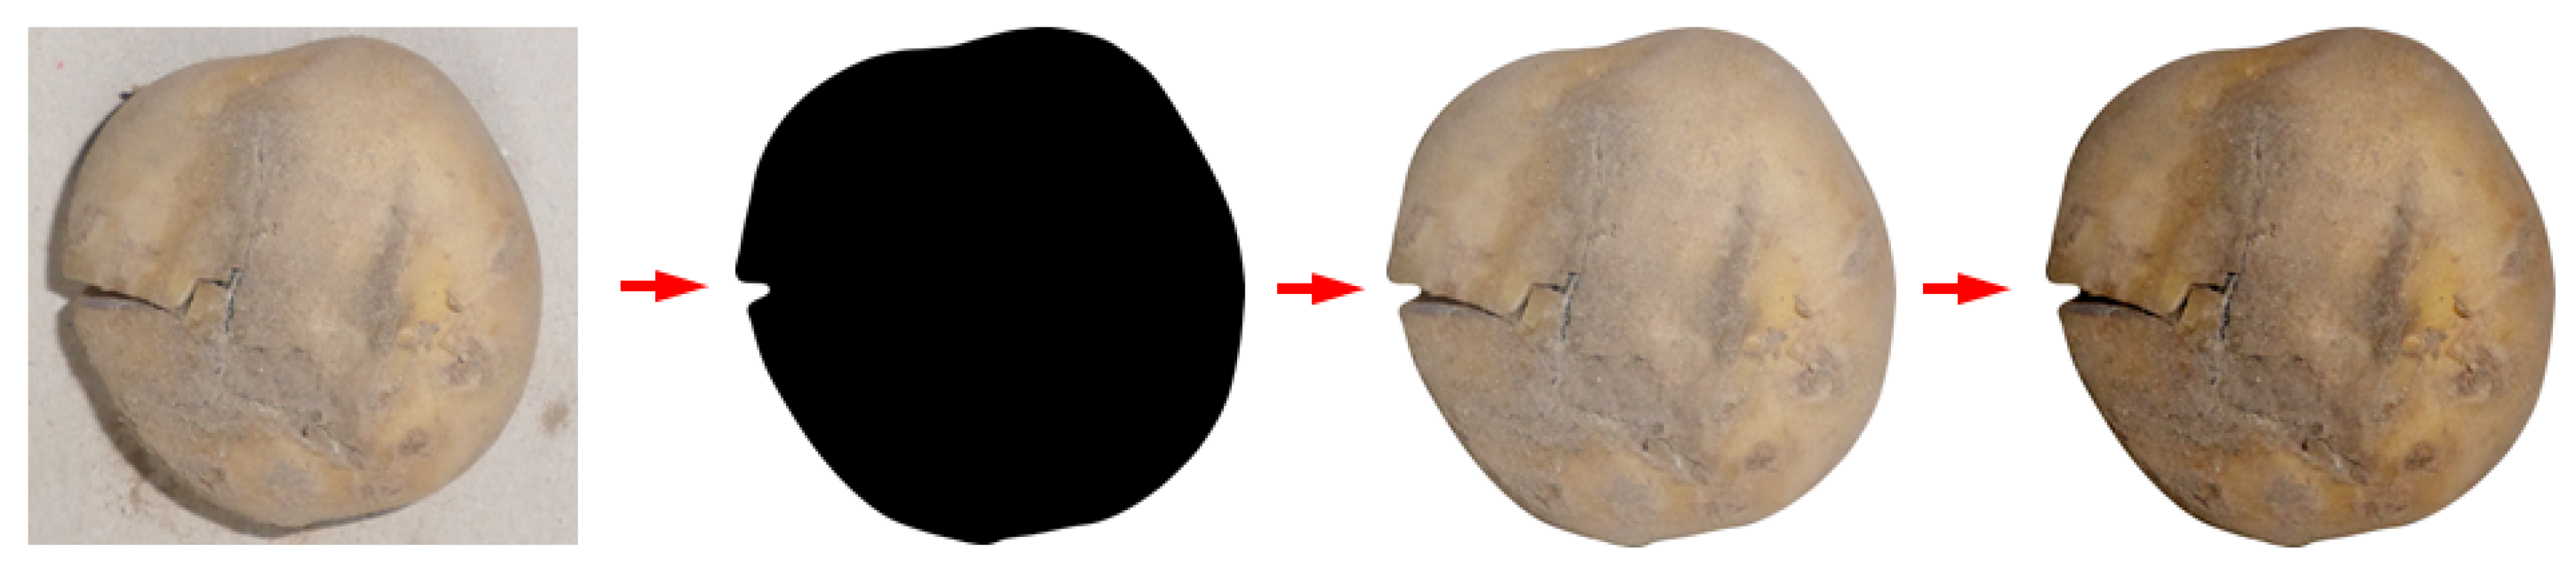
For the purpose of the study, several batches were selected randomly from the storage.

2.2. Methods

Digital photo of potatoes was taken on a portable test stand, which was created for this research. This acquisition included a uniform, white 50 cm by 50 cm background plate on which the subject was placed. The light sources were a SMD LED light bar split in half. The camera was centrally mounted 50 cm above the plate on a beam and located next to the light source so that the exposure was vertically photographed from above (Figure 1). A Samsung WB30F camera (equipped with a 16 Mpix CCD matrix) was used. The selected camera was slightly modified (the trigger has been extracted and placed outside the camera housing using an extension cable) to facilitate photo acquisition. The photographs were taken with the sensitivity set to ISO 100, without the white balance adjustment and without the built-in flash lamp. The autofocus was used in the course of taking photographs of the potatoes. After the test shots, it turned out that it was not necessary to use a shadow-free tent, so the main series of tests was performed without using any light diverging device. Furthermore, that station design was deliberately chosen to imitate conditions when this part of evaluation will be done with a mobile device (e.g., a smartphone with a built-in camera, with typically a SMD LED diode as a light source).
Using the method described above, a series of 240 digital photos of potato tubers was taken. For each of the four specified classes (corresponding to the state of objects), 60 items were selected, which finally gave a total number of 240 cases in the prepared set. The selected tubers were assessed and evaluated before they were photographed. The condition of the objects was determined by a team of experts. The defined classes are described further in the article. The acquired digital images were preselected and the damaged and defective images were repeated.
The image processing stage started with the source images subjected to a filtration process to reduce noise and improve the quality and enhance the characteristics of the objects. For this purpose, a series of filters (mainly for normalization, noise reduction, and contrast control) from ImageMagick software pack were used. This enabled the use of batch processing mode. The next step was to transform the image from raster to vector graphics. The vectorization process was performed using Peter Selinger’s Potrace algorithm, which uses information about the brightness of the individual pixels of the image and algorithms of color quantization and edge detection. This made it possible to obtain information about the geometry of the tested objects, including diameter, area, and circumference. This has also resulted in flat object masks that were used at a later stage in the automatic segmentation process to exclude the background and object extraction. All captured image parameters contain information only about the object, ignoring the background.
The whole process, starting from the source image, through the segmentation stage, the mask creation, and the background removal, to the final image with applied graphical filters is shown on Figure 2. This process was accomplished using a dedicated IT tool created for image analysis applications.
In the neural network type analysis, representative variables extracted from digital images were selected on the basis of literature studies, analysis of the problem domain, and experience gained in the previous work on classification problems using image analysis. Variables, due to their specificity, were divided into groups including: object geometry parameters, texture analysis parameters, and object color statistics.
The first group of features included quantitative indicators characterizing the geometry of potato tubers. These features were obtained by making measurements directly on the image using a scaled diagram. The shape factors for the object were also determined.
The basic, selected geometrical parameters of the analyzed object were as follows:
  • Diameter 1 (the largest diameter of the object vertically);
  • Diameter 2 (largest object diameter horizontally);
  • Surface area (sum of pixels in the highlighted object);
  • Circumference (the number of pixels at the edge of the object).
The above variables are expressed as pixels and converted to cm2 according to an algorithm based on a scaled model.
A further description of the geometry of the object was possible by applying shape coefficients. The following coefficients were used:
  • Dimensionless shape coefficient, where L is the circuit and S is the area
    R s = L 2 4 π · S
  • Feret coefficient, where: L h represents the maximum horizontal length and L v represents the maximum vertical length
    R F = L h L v
  • Regularity coefficient
    R G = S L h · L v
  • Circulation coefficient 1
    R c 1 = 2 · S π
  • Circulation coefficient 2
    R C 2 = L π
  • Malinowska coefficient
    R M = L 2 · π · S 1
Selected shape coefficients are fast calculating and should be sensitive to variations in the shape of the figure, but they should remain invariant to change the way the figure is presented.
The second group of features contained parameters derived from the use of texture analysis methods, based on the gray-level co-occurrence matrix (GLCM). The following features were distinguished:
  • Contrast (local variations in the gray-level co-occurrence matrix);
  • Correlation (joint probability occurrence of the specified pixel pairs);
  • Energy (sum of squared elements in the GLCM);
  • Homogeneity (closeness of the distribution of elements in the GLCM to the GLCM diagonal).
The third group of features constituted the statistical values characterizing the color of the examined objects:
  • Saturation mean;
  • Saturation median;
  • Saturation standard deviation;
  • Saturation mean without black color;
  • Saturation median without black color;
  • Saturation standard deviation without black color;
  • Luminance mean;
  • Luminance median;
  • Luminance standard deviation;
  • Luminance mean without black color;
  • Luminance median without black color;
  • Luminance standard deviation without black color;
  • Red channel mean;
  • Red channel median;
  • Red channel standard deviation;
  • Red channel mean without black color;
  • Red channel median without black color;
  • Red channel standard deviation without black color;
  • Green channel mean;
  • Green channel median;
  • Green channel standard deviation;
  • Green channel mean without black color;
  • Green channel median without black color;
  • Green channel standard deviation without black color;
  • Blue channel mean;
  • Blue channel median;
  • Blue channel standard deviation;
  • Blue channel mean without black color;
  • Blue channel median without black color;
  • Blue channel standard deviation without black color.
The feature generation process shown above was based on the transformation of graphical data, encoded as an image, into a form dedicated to the ANN. For this purpose, a set of scripts was developed and used in the MATLAB computing environment. The prepared scripts were characterized by the fact that they ignored background information (encoded as null) in the calculations, analyzing only the parameters of the object. The data obtained in this way constituted a set of input variables in the prepared training set for the ANN simulator.
The set of output variables was prepared for all analyzed images and then added to the training set. The following object states were specified:
  • Tuber without any visible damage;
  • Tuber with visible mechanical damage;
  • Green tuber (too high concentration of solanine);
  • Rotten tuber / tuber infected with fungal disease.
Neural models were generated using the ANN module in the Statistica computing environment. At the pre-testing stage, the Automatic Network Designer module was used to enable the creation of simplified neural models. In turn, detailed analysis used the Network Designer module.
The Automatic Network Designer is a heuristic algorithm that experimentally determines the optimum network structure for the current training set. The user cannot interfere with the network structure, except for determining its boundary conditions and general network parameters. Generation of models takes place automatically. In turn, the User Network Designer gives the user complete control over the neural network modeling process. In addition to the ANN, the user can define individual inputs, layers and number of neurons in the layers, the network training method, and the optimum model selection criteria.
Preliminary analysis on the prepared training set was carried out on all available variables. As expected, due to the fact that the ratio of the number of variables to the number of training cases was less than 1:10, the generated neural models (known as the memorized learning patterns case) did not function properly, although one could observe a tendency toward the usefulness of individual variables. Preliminary analysis also showed that most information about the studied phenomena related to variables describing the color. Hence, the decision to make the neural model step was performed by analyzing selected and grouped sets of variables. These sets were identical to the types of variables (geometric, texture, and tuber color statistics).

3. Results and Discussion

Using the methodology presented, sets of neural models for the constructed training sets were generated. For potato images (without the selection of a tuber fragment), three analyses were carried out for the obtained training sets containing, in turn, information about the geometry of the object, the texture of the surface, and the color statistics of the object’s pixels.
The set containing variables with information about the geometry of the object enabled the generation of a neural model that managed to distinguish between undamaged tubers and mechanical damage. Based on the geometry of the object, it was impossible to detect other lesions and diseases. These cases were incorrectly classified by the generated model. The overall quality of the model based on this data set was 41% of the correct classification.
On the other hand, the set based on surface texture information proved to be the least useful in the discussed process. Based on the information encoded in the calculated variables, the cases were classified incorrectly which was reflected in the quality of the tested models, which did not exceed 30% of the correct classification.
The best results were observed when testing a neural network model based on data containing statistical information about the color of individual pixels covering the examined object. The generated model correctly classified each of the defined output states with an error level of 15%.
The test quality of the best generated MLP (multilayer perceptron) network model for this variant was 85%. The number of input variables from the initial 30 (set with color statistics) was reduced to eight parameters, later marked as “rivs#” (which stands for reduced input variable set with the following number):
  • Red channel standard deviation (rivs1);
  • Red channel standard deviation without black color (rivs2);
  • Green channel median (rivs3);
  • Green channel standard deviation (rivs4);
  • Green channel median without black color (rivs5);
  • Green channel standard deviation without black color (rivs6);
  • Blue channel standard deviation (rivs7);
  • Blue channel standard deviation without black color (rivs8).
The reduction in the number of input variables was possible due to the sensitivity analysis performed on the generated optimal neural model. The sensitivity analysis consisted of showing the utility of the individual input variables. It indicated variables that, without loss of network quality, could be ignored and key variables that must never be ignored. This analysis highlighted the most important features affecting the correctness of classification. They are presented in Table 1.
These variables refer directly to the RGB (red–green–blue) color model. In subsequent analyses, only these eight input variables were used. This network was trained by backward error propagation (BP) and conjugate gradient (CG) algorithms.
The improvement in the quality of classification was achieved by further modifying and retesting the ANN model. This stage was mainly based on changing the structure (number of neurons) of the hidden layer and controlling the model’s performance based on the error rates. This resulted in improvement of the classification of the previously generated model to 92%. The classification statistics for the test file are shown in Table 2. Results show that the ANN model had the most problem with distinguishing the first two states (tubers without damage and tubers with mechanical damage). This is due to the great similarity in the object’s appearance in these states). Other states stood out significantly more from each other. The generated MLP model assigned all cases; there was not one that would not belong to any of the other classes than the four specified earlier.
The final network model (Figure 3) is the multilayer perceptron MLP with 8–13–4 layer structure (input layer with 8 neurons, hidden layer with 13 neurons, and output layer with 4 neurons).
The training process of the optimal generated ANN model utilized BP50 and CG155 algorithms. The quality of a neural classifier is usually defined by the percentage of its proper classifications. A comparison was made using all available input variables, however, the simulator again pointed to the eight variables described in Table 1 as the most relevant for the issue in question.
The results obtained corresponded to the previous research that were carried out at the Institute of Biosystems Engineering [25] and other results presented by research teams, for example by Manickavasagan’s team, where a color-based system achieved classification accuracy within the 80% to 90% range [26]. Important features, once again, were related to the color information. Interestingly, from the point of view of the problem, the information associated with the texture of the analyzed objects was insignificant. In all cases, results achieved by models based on data describing the geometric characteristics could be correlated with similarity of shape. These parameters generally are more suitable for objects with more complex shapes. This may also be related to the lighting used. Research that includes the use of, e.g., ultraviolet light (to emphasize the characteristics of the objects) often produces good results—for example with 1.56% classification error level [27]. In turn, one of the drawbacks of that approach is high complexity in the design of the test stand. By using variables that contain color information statistics, the neural network model and the entire data gathering procedure have been significantly simplified, which is very important when attempting to transfer the method to a mobile device. The use of computer image analysis methods is also advisable during the measurement of geometric features of objects, due to the high efficiency and accuracy of such a solution.
For potato damage classification there are confirmed results with 97% level accuracy, where the optimal ANN model is very complex and the data acquisition process was carried out in the laboratory condition [28].
The proposed method can present significant help in the storage period and it can be a helpful tool to prevent significant losses in stored yield. A quick problem recognition is crucial in in such cases. The generated ANN model, which is characterized by repeatability and objectivity of evaluation in the identification process can, for example, be adapted as an application in mobile devices.

4. Conclusions

The conducted research allowed us to formulate the following conclusions:
  • The proposed set of representative features, based on the selected statistical parameters of the RGB color model of potato tubers images, proved to be adequate in the process of identifying and classifying selected lesions.
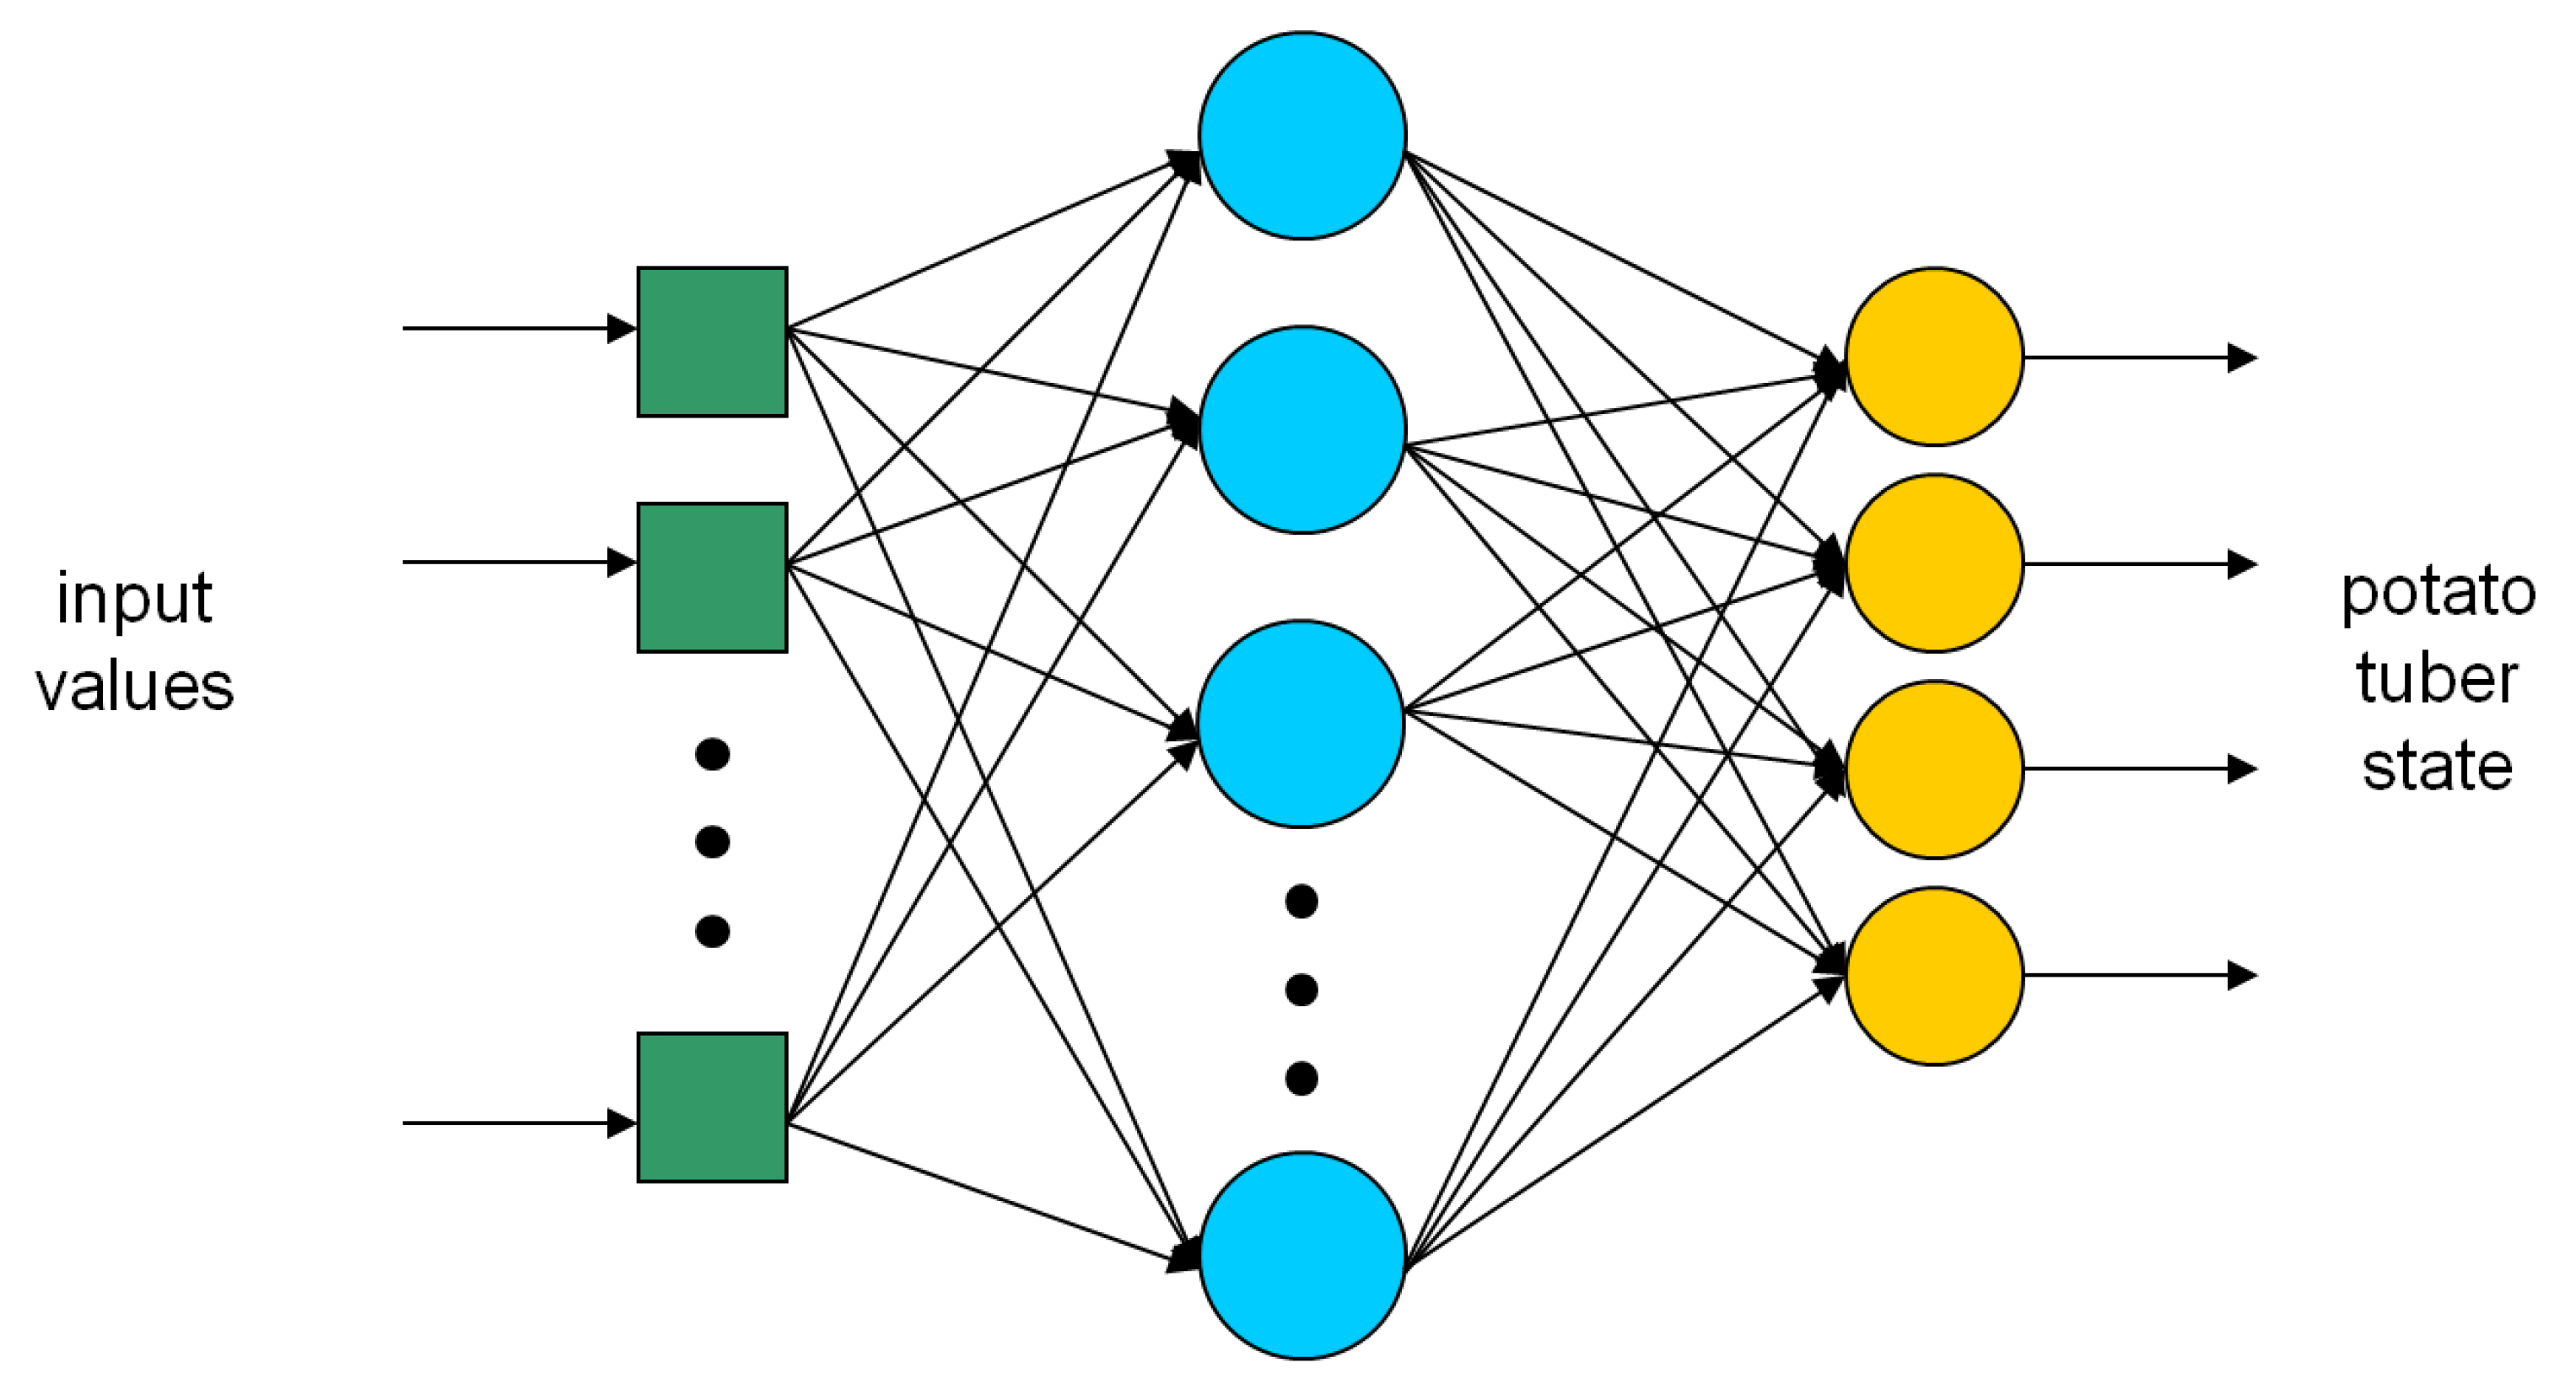
  • Among the generated neural models, the best-performing classification system with the highest test quality was a three-layer perceptron with an 8–13–4 layer structure.
  • The proposed and tested method allowed for a fast and non-invasive assessment of potato tubers, with high accuracy (up to 92%).
  • The research showed the utilitarian aspect of the developed model, supporting the decision-making process in the process of storing and sorting potato tubers, that can be further implemented in mobile devices.

Author Contributions

Conceptualization, A.P.; methodology, A.P., R.K., and A.O.; software, R.K.; validation, A.P., R.K., A.O., and P.R.; formal analysis, A.P. and R.K.; investigation, E.O., A.O., and P.P.; resources, P.P., E.O., and A.O.; data curation, A.P. and R.K.; writing—original draft preparation, A.P.; writing—review and editing, A.P. and R.K.; visualization, A.P.; supervision, P.R. All authors have read and agreed to the published version of the manuscript.

Funding

This research received no external funding.

Acknowledgments

The publication was co-financed within the framework of Ministry of Science and Higher Education programme as “Regional Initiative Excellence” in years 2019-2022, Project No. 005/RID/2018/19.

Conflicts of Interest

The authors declare no conflict of interest.

References

  1. Li, F.; Jiang, X.; Sun, M.; Xu, H.L.; Shi, L.; Shan, W.; Feng, Y. Screening of culture conditions for pathogens of potato dry rot. J. Acta Agric. Scand. Sect. B Soil Plant Sci. 2014, 64, 694–699. [Google Scholar] [CrossRef]
  2. Lombardo, S.; Pandino, G.; Mauromicale, G. The effect on tuber quality of an organic versus a conventional cultivation system in the early crop potato. J. Food Compos. Anal. 2017, 62, 189–196. [Google Scholar] [CrossRef]
  3. Lakesh, K.S.; Sukhwinder, K.B.; Dwyer, J.D.; Plant, A.B.; Bhowmik, A. A case study of improving yield prediction and sulfur deficiency detection using optical sensors and relationship of historical potato yield with weather data in Maine. Sensors 2017, 17, 1095. [Google Scholar] [CrossRef] [Green Version]
  4. Bentini, M.; Caprara, C.; Martelli, R. Physico-mechanical properties of potato tubers during cold storage. Biosyst. Eng. 2009, 104, 25–32. [Google Scholar] [CrossRef]
  5. Jensen, P.; Nielsen, B. Development of potato late blight (Phytophthora infestans) in differently developed potato crops and the potential to graduate the fungicide dose according to crop biomass. J. Acta Agric. Scand. Sect. B Soil Plant Sci. 2015, 65, 667–672. [Google Scholar] [CrossRef]
  6. Marks, N.; Lipiec, J.; Jakubowski, T. Ocena przydatności metod fizycznych do zwalczania przechowalniczych chorób bulw ziemniaka. Inż. Rol. 2005, 7, 169–175. [Google Scholar]
  7. Jakubowski, T.; Królczyk, J.B. Method for the Reduction of Natural Losses of Potato Tubers during their Long-Term Storage. Sustainability 2020, 12, 1048. [Google Scholar] [CrossRef] [Green Version]
  8. Boniecki, P.; Piekarska-Boniecka, H.; Koszela, K.; Zaborowicz, M.; Przybył, K.; Wojcieszak, W.; Zbytek, Z.; Ludwiczak, A.; Przybylak, A.; Lewicki, A. Neural Classifier in the Estimation Process of Maturity of Selected Varieties of Apples. In Proceedings of the Seventh International Conference on Digital Image Processing (ICDIP 2015), Los Angeles, CA, USA, 9–10 April 2015. [Google Scholar] [CrossRef]
  9. El-Sanhoty, R.; Shahwan, T.; Fawzy, M.R. Application of artificial neural networks to develop a classification model between genetically modified maize (Bt-176) and conventional maize by applying lipid analysis data. J. Food Compos. Anal. 2006, 19, 628–636. [Google Scholar] [CrossRef]
  10. Zaborowicz, M.; Boniecki, P.; Koszela, K.; Przybylak, A.; Przybył, J. Application of neural image analysis in evaluating the quality of greenhouse tomatoes. Sci. Hortic. 2017, 218, 222–229. [Google Scholar] [CrossRef]
  11. Przybylak, A.; Boniecki, P.; Koszela, K.; Ludwiczak, A.; Zaborowicz, M.; Lisiak, D.; Stanisz, M.; Ślósarz, P. Estimation of intramuscular level of marbling among Whiteheaded Mutton Sheep lambs. J. Food Eng. 2016, 168, 199–204. [Google Scholar] [CrossRef]
  12. Yang, Y.S.; Chang, C.H.; Wu, C.L. Damage indexing method for shear critical tubular reinforced concrete structures based on crack image analysis. Sensors 2019, 19, 4304. [Google Scholar] [CrossRef] [PubMed] [Green Version]
  13. Burks, T.F.; Shearer, S.A.; Heath, J.R.; Donohue, K.D. Evaluation of neural-network classifiers for weed species discrimination. Biosyst. Eng. 2005, 91, 293–304. [Google Scholar] [CrossRef]
  14. Kozłowski, R.J.; Kozłowski, J.; Przybył, K.; Niedbała, G.; Mueller, W.; Okoń, P.; Wojcieszak, D.; Koszela, K.; Kujawa, S. Image analysis techniques in the study of slug behavior. In Proceedings of the Eighth International Conference on Digital Image Processing (ICDIP 2016), Chengdu, China, 20–22 May 2016. [Google Scholar] [CrossRef]
  15. Ludwiczak, A.; Ślósarz, P.; Lisiak, D.; Przybylak, A.; Boniecki, P.; Stanisz, M.; Koszela, K.; Zaborowicz, M.; Przybył, K.; Wojcieszak, D.; et al. Different Methods of Image Segmentation in the Process of Meat Marbling Evaluation. In Proceedings of the Seventh International Conference on Digital Image Processing (ICDIP 2015), Los Angeles, CA, USA, 9–10 April 2015. [Google Scholar] [CrossRef]
  16. Siebring, J.; Valente, J.; Domingues Franceschini, M.H.; Kamp, J.; Kooistra, L. Object-Based Image Analysis Applied to Low Altitude Aerial Imagery for Potato Plant Trait Retrieval and Pathogen Detection. Sensors 2019, 19, 5477. [Google Scholar] [CrossRef] [PubMed] [Green Version]
  17. Al-Mallahia, A.; Kataoka, T.; Okamoto, H.; Shibata, Y. An image processing algorithm for detecting in-line potato tubers without singulation. Comput. Electron. Agric. 2010, 70, 239–244. [Google Scholar] [CrossRef] [Green Version]
  18. Tian, H.; Zhao, J. The Summary of Researches on Detections of Potato Surface Defects by Machine Vision. In Proceedings of the 2nd Workshop on Advanced Research and Technology in Industry Applications, Dalian, China, 14–15 May 2016; pp. 1468–1472. [Google Scholar]
  19. Razmjooy, N.; Somayeh, M.B.; Soleymani, F. A real-time mathematical computer method for potato inspection using machine vision. Comput. Math. Appl. 2012, 63, 268–279. [Google Scholar] [CrossRef] [Green Version]
  20. Przybył, K.; Górna, K.; Wojcieszak, D.; Czekała, W.; Ludwiczak, A.; Przybylak, A.; Boniecki, P.; Koszela, K.; Zaborowicz, M.; Janczak, D.; et al. The Recognition of Potato Varieties using Neural Image Analysis Method. In Proceedings of the Seventh International Conference on Digital Image Processing (ICDIP 2015), Los Angeles, CA, USA, 9–10 April 2015. [Google Scholar] [CrossRef]
  21. Boniecki, P.; Koszela, K.; Świerczyński, K.; Skwarcz, J.; Zaborowicz, M.; Przybył, J. Neural Visual Detection of Grain Weevil (Sitophilus granarius L.). Agriculture 2020, 10, 25. [Google Scholar] [CrossRef] [Green Version]
  22. Lopez-Maestresalas, A.; Keresztes, J.C.; Goodarzi, M.; Arazuri, S.; Jaren, C.; Saeys, W. Non-destructive detection of blackspot in potatoes by Vis-NIR and SWIR hyperspectral imaging. Food Control 2016, 70, 229–241. [Google Scholar] [CrossRef] [Green Version]
  23. Rutolo, M.; Covington, J.A.; Clarkson, J.; Iliescu, D. Detection of potato storage disease via gas analysis: A pilot study using field asymmetric ion mobility spectrometry. Sensors 2014, 14, 15939–15952. [Google Scholar] [CrossRef] [Green Version]
  24. Rutolo, M.; Iliescu, D.; Clarkson, J.; Covington, J.A. Early identification of potato storage disease using an array of metal-oxide based gas sensors. Postharvest Biol. Technol. 2016, 116, 50–58. [Google Scholar] [CrossRef]
  25. Ślósarz, P.; Stanisz, M.; Boniecki, P.; Przybylak, A.; Lisiak, D.; Ludwiczak, A. Artificial neural network analysis of ultrasound image for the estimation of intramuscular fat content in lamb muscle. Afr. J. Biotechnol. 2011, 10, 11792–11796. [Google Scholar] [CrossRef]
  26. Manickavasagan, A.; Al-Mezeini, N.K.; Al-Shekaili, H.N. RGB color imaging technique for grading of dates. Sci. Hortic. 2014, 175, 87–94. [Google Scholar] [CrossRef]
  27. Kujawa, S.; Nowakowski, K.; Tomczak, R.J.; Dach, J.; Boniecki, P.; Weres, J.; Mueller, W.; Raba, B.; Piechota, T.; Rodríguez Carmona, P.C. Neural image analysis for maturity classification of sewage sludge composted with maize straw. Comput. Electron. Agric. 2014, 109, 302–310. [Google Scholar] [CrossRef]
  28. Przybył, K.; Boniecki, P.; Koszela, K.; Gierz, Ł.; Łukomski, M. Computer vision and artificial neural network techniques for classification of damage in potatoes during the storage process. Czech J. Food Sci. 2019, 37, 135–140. [Google Scholar] [CrossRef]
Figure 1. Image-acquisition station scheme (source: own materials).
Agriculture 10 00112 g001
Figure 2. Image processing scheme (source: own materials).
Agriculture 10 00112 g002
Figure 3. Structure of the optimal neural network type multilayer perceptron (MLP) 8-13-4 (input layer with 8 neurons, hidden layer with 13 neurons, and output layer with 4 neurons) (source: own materials).
Agriculture 10 00112 g003
Table 1. Artificial neural network (ANN) model responses to input values.
rivs1rivs2rivs3rivs4rivs5rivs6rivs7rivs8
rank24718356
quotient177116871017517711008175916151532
rivs#”—reduced input variable set with the following number.
Table 2. Classification statistics for the generated ANN model.
Tuber Without Visible DamageTuber With Visible Mechanical DamageGreen TuberRotten Tuber
Total60606060
Correct54515857
Wrong6923
Unknown0000

