Article

The Role of Soil N2O Emissions in Agricultural Green Total Factor Productivity: An Empirical Study from China around 2006 when Agricultural Tax Was Abolished

1
School of Economics, Chongqing Technology and Business University, Chongqing 400067, China
2
Research Center for Economy of Upper Reaches of the Yangtse River/School of Economics, Chongqing Technology and Business University, Chongqing 400067, China
3
School of Mathematics and Statistics, Chongqing Technology and Business University, Chongqing 400067, China
4
School of Public Administration, Sichuan University, Chengdu 610065, China
*
Author to whom correspondence should be addressed.
Submission received: 16 March 2020 / Revised: 18 April 2020 / Accepted: 20 April 2020 / Published: 4 May 2020
(This article belongs to the Special Issue Thematic of Soil Ecological Functions in Agriculture)

Abstract

:
The decision in 2006 to abolish the agricultural tax, which had lasted for thousands of years, contributed to the prosperity of agriculture, and with it the growing importance of soil N2O emissions in China. However, most of the previous literature ignored soil N2O emissions due to their too small share in total agricultural greenhouse gas (GHG) emissions. This paper attempts to take soil N2O emissions as an important variable in the measurement of agricultural green total factor productivity (AGTFP), which incorporates environmental pollution into the analytical framework of agricultural production efficiency. Three impressive results were found. Firstly, soil N2O emissions play an increasingly important role in agricultural GHG emissions. The proportion of soil N2O emissions in agricultural GHG emissions increased from 4.52% in 1998 to 4.83% in 2006, and then to 5.36% in 2016. Secondly, the regional difference of soil N2O emissions in AGTFP is visible. In 2016, although soil N2O emissions accounted for a small proportion (about 5%) of the total agricultural GHG emissions in China, the AGTFP including soil N2O emissions was much lower than that excluding soil N2O emissions, especially in areas with high agricultural and population density. Finally, over time, soil N2O emissions have had an increasing effect on AGTFP. Compared with 1998–2006, the impact of excluding soil N2O emissions on AGTFP in 2007–2016 was more evident than that including soil N2O emissions.

1. Introduction

The prosperity and development of agriculture in China has entered a new stage since the abolition, in 2006, of the agricultural tax, which had lasted for two thousand years. [1]. According to the National Bureau of Statistics of China, the total real value of China’s agriculture was 3.636 trillion yuan in 2005 and reached 5.856 trillion yuan in 2016, an increase of 61.06% [2]. In the process of China’s transformation from a big agricultural country to a power agricultural country, pollution generated by the development of agriculture has, in addition to industrial pollution and its impact on health, become one of the social concerns [3,4,5,6,7]. As a result, a high number of studies on agricultural pollution have appeared [8,9]. Developing low-carbon agriculture (which refers to agriculture with high efficiency, low energy consumption, and low emissions) is not only a necessary step for China to meet its commitment to reduce emissions in response to climate change but also a necessary means to ultimately achieve sustainable development of agriculture. Therefore, it is of considerable significance to analyze greenhouse gas (GHG) emissions from agricultural production and their impact on agricultural total factor productivity.
Total factor productivity (TFP), which is generally regarded as an essential indicator of scientific and technological progress, refers to the part where the output growth rate of factors exceeds the input growth rate. TFP is usually caused by technological development, organizational innovation, specialization and production innovation, and so on [10]. In recent years, there have been many types of research on agricultural TFP. These can be sorted into the following three types according to their calculation methods. The first type of accounting method was adopted in most of the earlier studies. Some researchers used the algebraic exponential method to discuss agricultural productivity [11,12], while other scholars took the Solow residual value [13,14]. In the second type, data envelopment analysis (DEA) was often applied to analyze changes in agricultural productivity of China. This can cope with multiple input–output factors, facilitating the dismantling of agricultural productivity, and revealing the internal motive force of agricultural productivity growth [15,16,17]. The third method is stochastic frontier analysis (SFA), which can be grouped with the parametric and non-parametric methods, based on a specific form of production function or can consist of the stochastic frontier method and deterministic frontier method [18,19]. However, the gross agricultural product was used as the output variable in the calculation of agricultural production efficiency, and the cultivated area, agricultural machinery, chemical fertilizer, and labor force in rural were used as input variables in the articles above, ignoring the non-point source pollution problems caused by agricultural production, such as the residues of chemical fertilizers and pesticides, and the emissions of livestock and poultry feces. In the actual production process, the production unit often inevitably produces some non-desired or “bad” output, such as pollution, in addition to the desired “good” output. How to deal with the non-expected output becomes the key to the scientific measurement of agricultural production efficiency. Agricultural green total factor productivity (AGTFP) brings environmental pollution into the analysis framework of agricultural production efficiency [20]. This paper adopts agricultural GHG emissions as the non-expected output to measure the AGTFP of China. Besides, better progress should be made in the selection of GHG emissions sources since it is difficult to make a breakthrough in the calculation method [21,22,23,24].
The measurement of agricultural GHG emissions sources is a critical link in the research on agricultural GHG emissions. First of all, in terms of the definition of agriculture, there is not only research on narrow agriculture [25,26], which only refers to the planting industry but also research which analyses broad agriculture, including animal husbandry [27,28]. Secondly, considering regional studies on agricultural GHG emissions, most of them take the whole country or a province as the research object [29], while studies on the heterogeneity between different regions was rare [30]. Then, for the selection of agricultural GHG emissions sources, there are not only mainstream studies that take four categories, namely, livestock breeding, rice planting, agricultural materials and straw burning, as GHG emissions sources [31,32], but also a few scholars start to include soil N2O in the GHG emissions measurement system [33,34].
Nitrous oxide (N2O), as one of the important GHG. It has a global warming potential 190–270 times that of CO2 and continues to increase at a rate of 0.25% per year [35]. At the same time, N2O is a significant factor in destroying the ozone layer [36]. Therefore, N2O emissions have been widely concerned with the studies of global climate and ecological environment change. Agricultural activities are the most significant anthropogenic emission source of N2O, to which farmland soils contribute the most [37,38,39]. The annual N2O emissions from farmland soils account for about 42% of the total (6.7 × 10⁶ t) global anthropogenic activities [40]. Taking China’s farmland soils as an example, N2O emissions in 2014 were about 1.21t, accounting for 31% of the global N2O emissions [41]. Agricultural taxes, which had lasted for one thousand years, were abolished in 2006, and the subsidies and other incentives for agricultural arable land from the Chinese government have greatly promoted enthusiasm in agricultural production. One of the biggest effects is that soil N2O emissions, as one of the GHG emissions sources of agriculture, are becoming more and more important. In recent years, the study of soil GHG emissions has become a frontier issue. The focus of this paper is to include soil N2O emissions into the estimation of agricultural GHG and explore the role of soil N2O emissions in AGTFP.
The structure of the paper is as follows: the measurement of agricultural GHG emissions and AGTFP is discussed in detail in Section 2; the empirical results of the comparison of AGTFP, including whether soil N2O emissions can be seen or not, is discussed in Section 3; and the discussion and conclusion of empirical analysis is provided in Section 4 and Section 5.

2. Materials and Methods

Corresponding to the previous literature review, the writing process of this paper was divided into two steps: (a) measurement of the scale and density of agricultural GHG emissions, including soil N2O emissions and (b) measurement of AGTFP including soil N2O emissions, if present.

2.1. Measurement of Agricultural GHG Emissions

The comprehensiveness of emission sources and the operability of measurement methods were the essential principles and the most difficult parts in the process of measuring agricultural GHG emissions. Therefore, the availability of data must be fully considered. This paper intended to make efforts in two aspects. Firstly, select livestock-breeding CH4, rice-planting CH4, straw-burning CO2, soil N2O, and agricultural materials’ CO2 as the sources of agricultural GHG emissions. Secondly, relevant agricultural GHG emissions calculation formulae were constructed, as shown in Formula (1).
E = E i = Q i a i
where, E represents the scale of agriculture GHG emissions (unit: 10,000 tons) and E i represents the quantity of agriculture GHG emissions (unit: 10,000 tons) that came from different emissions sources. The amount of agriculture GHG emissions sources is represented by Q i (unit: kg when i is agricultural materials or straw burning; unit: head when i is livestock breeding; unit: hm2 when i is soil N2O; and unit: m2 when i is rice planting) and a i represents the coefficient of agriculture GHG emissions from different emissions sources. It should be noted that, due to the inconsistency of units, when GHG emissions are added up in Formula (1), CH4 and N2O emissions must be converted into standard carbon emissions. According to the Intergovernmental Panel on Climate Change (IPCC) (IPCC fourth assessment report), the greenhouse effect caused by 1 t CH4 and 1 t N2O is equivalent to that caused by 6.8182 t CO2 and 181.2727 t CO2, respectively (1t = 1000 kg) [42]. Some scholars call this carbon emissions, but to avoid unnecessary misunderstanding, the name GHG emissions was still used in this paper.
The coefficients of different agriculture GHG emissions sources are an important part of Formula (1). The related reference data from some authoritative institutions or previous research are listed in Table 1.
The relevant explanation of Table 1 is shown as follows.
(1) Agricultural materials: Carbon emissions from agricultural materials production fall into two main categories. First, CO2 emissions produced by agricultural materials directly as inputs of fertilizers, agricultural film, or other inputs will inevitably cause carbon emissions. Carbon emissions are also caused by energy consumption, such as diesel, in agricultural activities.
(2) Straw burning: In the context of China’s efforts to promote green development in recent years, the use of burning straw has been greatly reduced, but straw burning remains an important source of agricultural GHG emissions. Six major crops, including wheat, rape, or soybean, were measured as the GHG emissions sources of straw combustion [8].
(3) Livestock breeding: GHG emissions produced from livestock and poultry farming were mainly CH4 and N2O. GHG production comes mainly from fecal processing and intestinal fermentation. Due to the different feeding cycles of livestock and poultry, it is necessary to properly regulate the feeding quantity in the calculation. For example, the average life cycle of pigs, rabbits, and poultry is 200 days, 105 days, and 55 days, respectively, and the feeding rate is greater than 1. According to existing research and data, the IPCC report selected the CH4 and N2O emissions of the most important animals in the breeding industry to be included in the calculation system. Livestock and poultry breeding N2O emissions are not large and these are temporarily ignored in this paper.
(4) Soil N2O: N2O emissions are mainly in the soil, and tilling the soil while planting crops causes N2O from the soil to flow into the air. CO2 also flows into the air when soil is turned over, but because of its small amount and the absorption of CO2 for photosynthesis during the growth of crops, CO2 is temporarily ignored in this paper.
(5) Rice planting: GHG emissions from rice cultivation play an important role in China’s agricultural GHG emissions, mainly the production of CH4. CH4 is produced in both rice cultivation and dryland crop production, but it can be ignored as dryland itself will absorb CH4, and dryland CH4 emissions are low. In addition, because different rice varieties differ in CH4, the calculation of carbon emissions from rice planting needs to consider the factor of rice varieties.

2.2. Measurement of Agricultural Green Total Factor Productivity (AGTFP)

The measurement method of AGTFP was constructed as Formulae (2)–(7) (Table 2) by referring to [8] and [32], as illustrated in the following steps.
Firstly, the global production possibility set was designed as Formula (2), where all the provinces in China were taken as decision-making units. Here Z k is the density variable, which represents the weight of each of k decision-making units in the construction of the environmental technical structure. G is the global benchmark, and T is the time, the input/output vector is ( x k t + y k t + b k t ) . The specific calculation process is referred to as the study of Xu.et al [32]. Suppose each unit uses n kinds of input (x, x ∊ Rn+) in the production process, and obtains both m kinds of desired output (y, y ∊ Rm+) and undesired output—agricultural GHG emissions (b), the possible production set (P) is expressed as Formula (2a). Further, the union set of all production technology sets in the current period can be expressed as Formula (2b). Then the global production possibility set is expressed as Formula (2).
Secondly, the slacks-based measure (SBM) of directional distance function is applied to Formulae (3)–(6). The SBM directional distance function explores the effect of input and output slack variables on efficiency and can also avoid the bias of traditional radial DEA on efficiency evaluation. According to the non-radial and non-angle SBM efficiency model proposed by Tone [20], both input reduction and output increase should be considered in research. Based on Formula (3), the non-radial, non-angle SBM directional distance function, which contains an undesired output in time t of a decision-making unit, k ( x k t + y k t + b k t ) is constructed. In Formulae (3)–(6),   D 0 G is the average distance between the production frontier and input/output, and represents the degree of input–output inefficiency. s n x ,   s m y , and s i b imply the relaxation variables of the input, expected output, and non-expected output, respectively, and they are all greater than or equal to 0.
Finally, the global Malmquist–Luenberger (GML) index was adopted to build the agricultural green total factor productivity index (AGTFP). It is generally acknowledged that the GML index is based on the common global frontier structure of each period, which is multiplicative and transitive. What is more, GML reflects the changes in total factor productivity, effectively eliminating the phenomenon of “technical regression” of GML index. The indexes mentioned above are reflected in Formula (7), where the variable in stage t+1 is bigger than that in stage t when the index was above 1.

2.3. Data Source

Relevant data of 31 Chinese provinces (except Hong Kong, Macao, and Taiwan) from 1998 to 2016 were selected to calculate agricultural GHG emissions. Most of the data came from the China Rural Statistical Yearbook, the China Agricultural Yearbook, China agricultural statistical data, and the China Animal Husbandry Yearbook. Treatment method for specific data and data sources have been mentioned above.

3. Results

By using the measurement method of agricultural GHG emissions, we first calculated the emissions scale and emissions intensity of each agricultural GHG emissions source in China for about ten years around 2006 and then calculated the AGTFP on this basis.

3.1. Temporal Evolution of the Scale and Intensity of Agricultural GHG Emissions Including and Excluding Soil N2O Emissions

The scale and intensity of different agricultural GHG emissions sources in China from 1998 to 2016 are shown in Table 3.
First, in general, agricultural GHG emissions in China totaled 320.2922 million tons in 1998 but reached 373.9129 million tons in 2016, which was an increase of 16.74% over the past 19 years and an average annual increase of 0.88%. The intensity of agricultural GHG emissions was 1.23 tons/10,000 yuan in 1998 but dropped to 0.65 tons/10,000 yuan in 2016, a decrease of nearly 50%.
Second, although the scale of agricultural GHG emissions rose from 1998 to 2016, the intensity of agricultural GHG emissions declined year by year, especially in 2005 and 2006, which was a significant turning point. The intensity of agricultural GHG emissions was 1 or above (tons/10,000 yuan) in 1998–2004, and it began to fall below 1 (tons/10,000 yuan) in 2005. The following two factors may have played important roles in agricultural efficiency and carbon reduction: (a) advances in agricultural production technology and (b) the stimulus that may be expected and realized to abolish agricultural tax in China around 2006.
Third, from the perspective of GHG emissions sources, of all the five primary sources of GHG emissions, agricultural materials and straw burning contributed the most significant amount, exceeding 10 million tons. Among them, the GHG emissions of agricultural materials increased significantly from 70.6486 million tons in 1998 to 106.1024 million tons in 2016, with an increase of 50.18%.
Finally, with respect to the role of soil N2O emissions: (a) Among all five types of GHG emission sources, the proportion of soil N2O emissions was the lowest. In 2016, for example, the scale of soil N2O emissions was 2006.77 million tons, only 18.91% of the GHG emissions of agricultural materials (106.1024 million tons), and 5.36% of the total GHG emissions of agriculture (373.9129 million tons). However, the proportion of soil N2O emissions increased year by year from 1998 to 2016 and the percentage of soil N2O in total agricultural GHG emissions increased from 4.52% in 1998 to 4.83% in 2006, and then to 5.36% in 2016. (b) The intensity of agriculture GHG emissions excluding soil N2O emissions was lower than that including soil N2O emissions. Despite this, it also shows that soil N2O emissions play an important role in agricultural GHG emissions.

3.2. Comparison of AGTFP Including and Excluding Soil N2O Emissions

Based on the calculation of the emissions scale and intensity of each agricultural GHG emissions source, this paper calculated AGTFP.

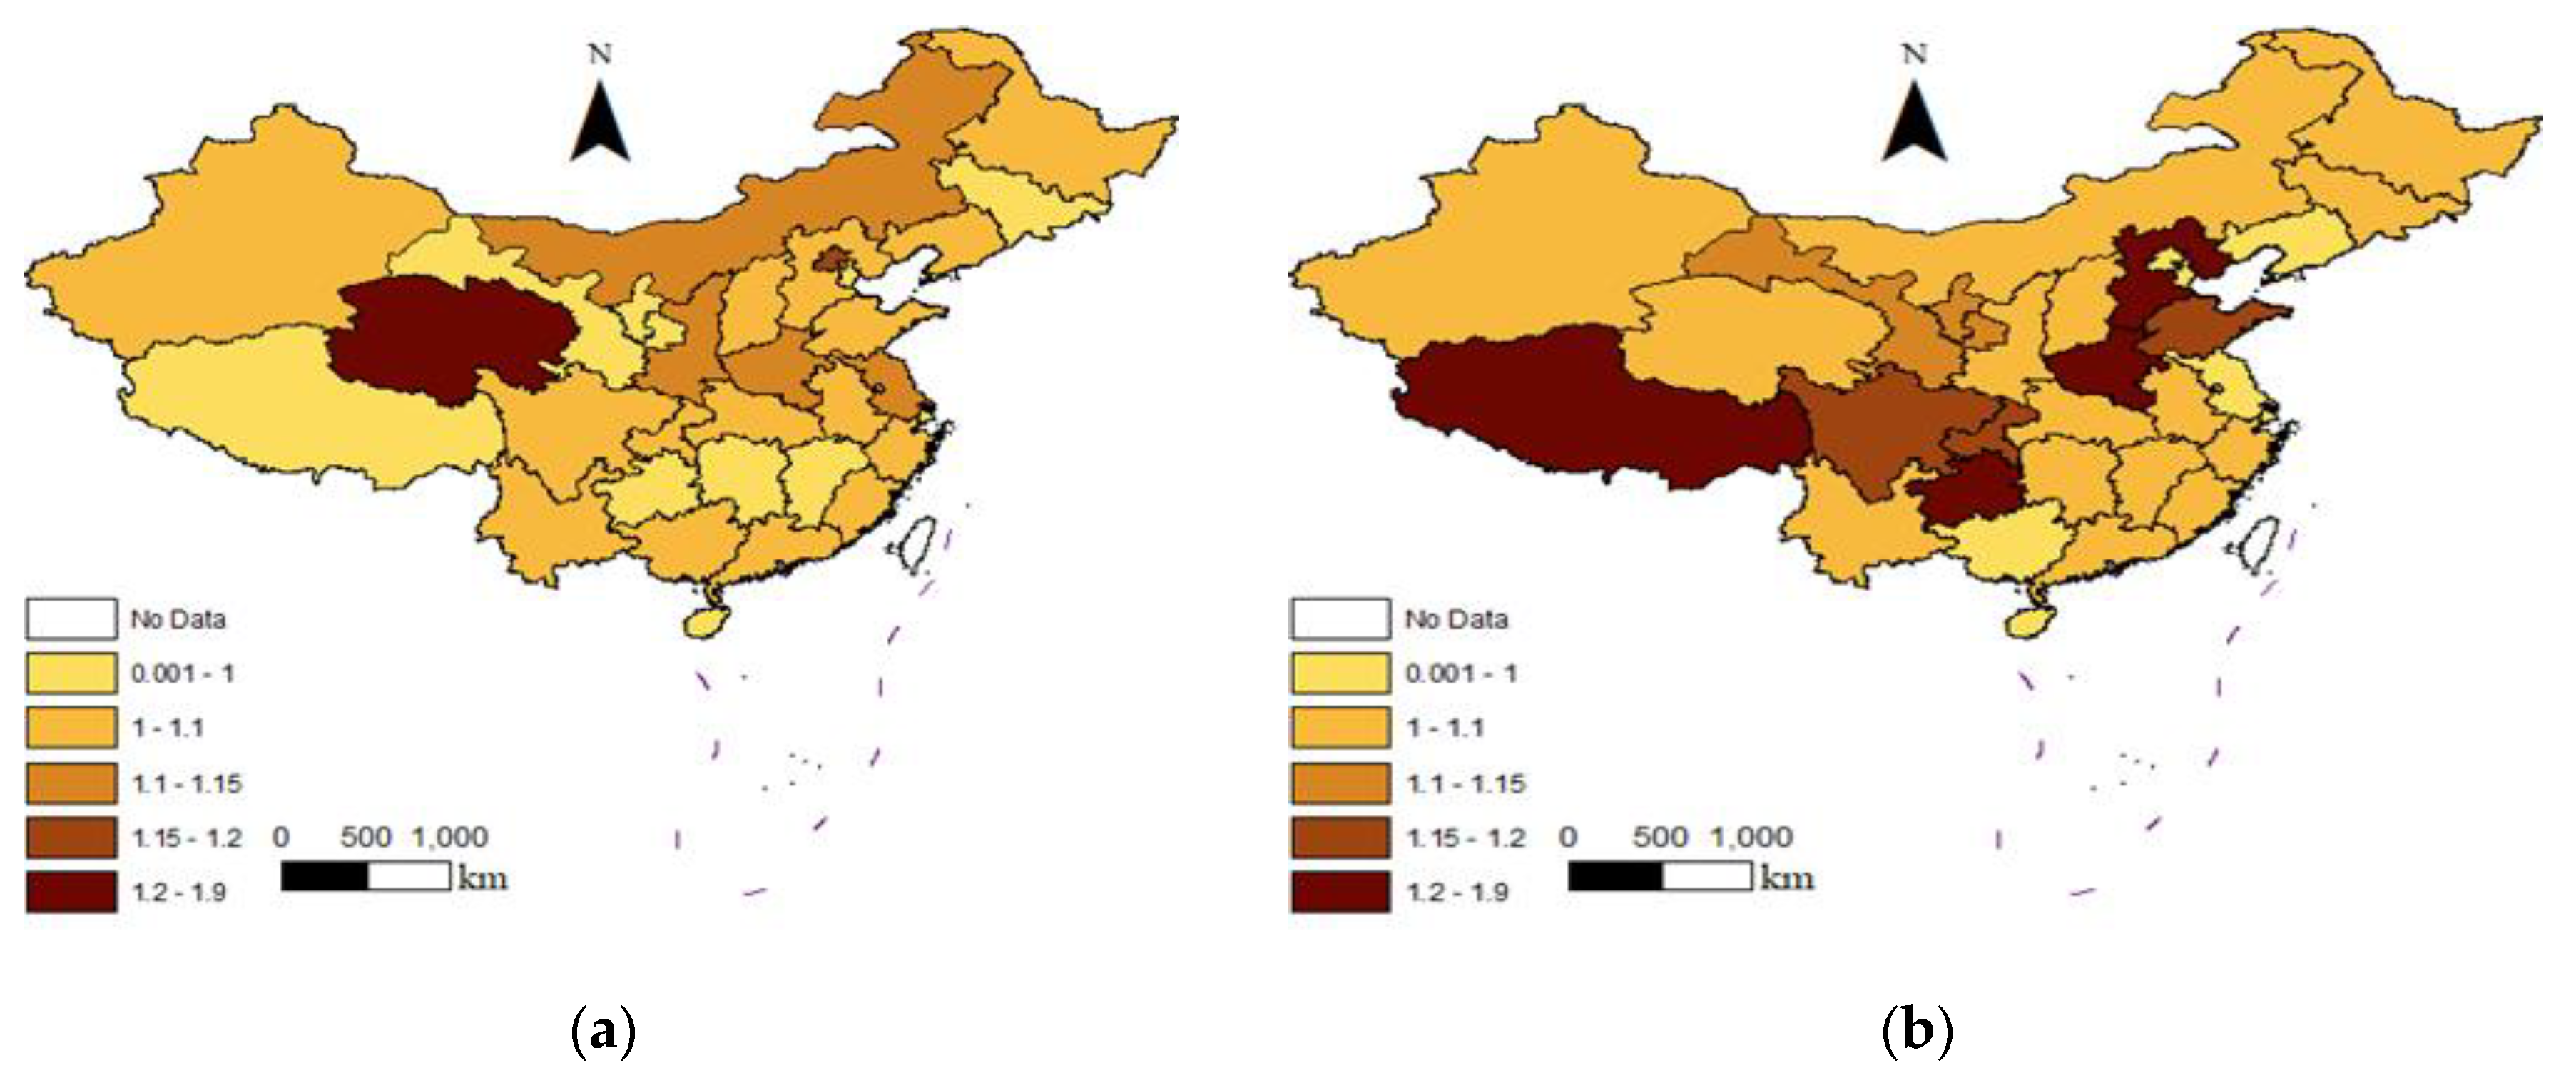
3.2.1. Regional Comparison of AGTFP Including and Excluding Soil N2O Emissions in 2016

AGTFP included soil N2O emissions in 2016 is shown in Figure 1a, and AGTFP excluding soil N2O emissions in 2016 is demonstrated in Figure 1b.
As seen from Figure 1, although soil N2O emissions account for a small proportion (about 5%) of the total agricultural GHG emissions in China, their performance varies significantly among different provinces. Compared with Figure 1b, it can be observed from Figure 1a that the AGTFP including soil N2O emissions is much lower than that excluding soil N2O emissions, and the regional differences are particularly visible, especially in Hebei, Henan, Shandong, and Chongqing. These provinces all belong to areas with high population density (Hebei: population density = 355 people/km2, ranking 12/32 in China; Henan: population density = 553 people/km2, ranking 7/32 in China; Shandong: population density = 579 people/km2, ranking 6/32 in China; Chongqing: population density = 374 people/km2, ranking 11/32 in China) [43]. In these areas, the amount of labor per unit of soil is relatively high, so soil emissions play an important role. On the other hand, the AGTFP of Qinghai, Inner Mongolia, and other provinces increased when considering soil N2O emissions, which may have something to do with the fact that these areas are sparsely populated (Qinghai: population density = 7.2 people/km2, ranking 31/32 in China; Inner Mongolia: population density = 20 people/km2, ranking 29/32 in China) [43]. As a result, it can be predicted that the size of the population plays a significant role.

3.2.2. Regional Comparison of AGTFP Including and Excluding Soil N2O Emissions in Two Phases around 2006

Next, we took the agricultural tax abolition in China in 2006 as the time node to analyze the role of soil N2O emissions in AGTFP in two stages.
Some useful information can be found in Table 4. First, AGTFP excluding soil N2O emissions is higher than AGTFP including soil N2O emissions in any region, regardless of the time period (either 1998–2006 or 2007–2016). Therefore, it is obvious that soil N2O emissions play a certain role in AGTFP. Second, compared with 1998–2006, the change range of AGTFP excluding soil N2O emissions in 2007–2016 was larger than AGTFP including soil N2O emissions. This indicates that soil N2O emissions play a more and more important role in AGTFP.

3.3. Further Analysis of the Comparison between AGTFP and TATFP (Traditional Agricultural Total Factor Productivity)

Next, unlike most previous literature [8,10], this paper divided the whole country into three regions, that is, areas with high agricultural output ratio(HAOR-Areas), areas with low agricultural output ratio(LAOR-Areas)and areas with medium agricultural output ratio(MAOR-Areas), which may be more scientific than simple division by geographical location. As shown in Table 5, the analysis can be grouped to two stages, namely 1998–2006 and 2007–2016, taking the abolition of the agricultural tax in 2006 as the dividing line, and comparing them in the three central regions, namely HAOR-Areas, LAOR-Areas, and MAOR-Areas.
Table 5 reveals some interesting information. Firstly, there is a difference in the influence of soil N2O emissions on AGTFP in different regions in the whole period from 1998 to 2016. Although there is an increasing trend in all the three regions, the role of soil in the LAOR-Areas is small but is most significant in HAOR-Areas.
Secondly, all three types of TFP in 2007–2016 were more extensive than those in 1998–2006 in all regions, which indicated that agricultural technology has made significant progress in recent years. At the same time, soil N2O emissions had a more substantial impact on the TFP in 2007–2016 than in 1998–2006. In HAOR-Areas, for example, the difference between AGTFP (excluding soil N2O emissions) and AGTFP (including soil N2O emissions) was 0.017 (1.076–1.059) in 1998–2006 and increased to 0.031 (1.109–1.078) in 2007–2016.

4. Discussion

Research on soil N2O emissions has gained popularity worldwide due to the boom in low-carbon agriculture in recent years. However, most of them focused on the effects of factors such as soil properties and soil temperature on soil N2O emissions [44,45], and little literature discusses its role in Agricultural green production efficiency due to its too small share in total GHG emissions or treated it as just one of several GHG emissions sources from agriculture [8,24]. The decision in 2006 to abolish the agricultural tax, which had lasted for two thousand years, contributed to the prosperity of agriculture, and with it the growing importance of soil N2O emissions in China. Soil N2O emissions gradually become a more important emissions source of the agriculture GHG emissions that should not be ignored. Therefore, one innovation of this paper is to take soil N2O emissions as a separate variable in the measurement of AGTFP and to reveal its role around 2006 when Agricultural Tax was abolished. Besides, unlike many previous studies [8,10], which devised the whole country into east-region, middle-region, and west-region. This paper reclassified it to HAOR-Areas, LAOR-Areas, and MAOR-Areas, which is maybe more scientific than just geographical division. For example, it feels a bit unconvincing that the total factor productivity that they get with GHG emissions is higher than the total factor productivity that they get without. Some other interesting things about the role of soil N2O emissions in AGTFP were found.
Firstly, soil N2O emissions play an increasingly important role in agricultural GHG emissions sources. a) from the perspective of GHG emissions scale. Among all the five types of GHG emissions sources, the proportion of soil N2O emissions is the lowest. In 2016, for example, soil N2O emissions were 20.0677 million tons, only 18.91% of the agricultural materials GHG emissions (106.1024 million tons), and 5.36% of the total GHG emissions of agriculture (373.9129 million tons). However, the proportion of soil GHG emissions increased year by year from 1998 to 2016, and the ratio of total agricultural GHG emissions increased from 4.52% in 1998 to 4.83% in 2006, and then to 5.36% in 2016. b) from the perspective of GHG emissions intensity. The intensity of GHG emissions excluded soil N2O emissions is lower than that included soil N2O emissions. It shows that soil N2O emissions also play an increasingly important role in agricultural GHG emissions, which may be caused by the advances in agricultural production techniques and the policy expectation or realization to abolish agricultural tax in China around 2006. This conclusion is basically consistent with [46] but has some differences from [47], which may reveal that the utilization efficiency of agricultural waste is not high, and further improvement is needed in China.
Secondly, the regional difference of soil N2O emissions in AGTFP is visible. For example, although soil N2O emissions in 2016 accounted for a small proportion (about 5%) of the total agricultural GHG emissions in China, the AGTFP included soil N2O emissions is much lower than that excluded soil N2O emissions, especially in areas with high density of agriculture and population, such as Hebei, Henan, Shandong, and Chongqing, but it is not evident in other areas such as northwest China or Tibet. This conclusion is like the study of [48] and may be due to the labor per unit of soil is relatively more, as a result, soil N2O emissions have a more significant impact in these areas.
Finally, soil N2O emissions have an increasing impact on AGTFP over time. (a) AGTFP excluded soil N2O emissions is higher than that included soil N2O emissions in any region, regardless of the period from 1998–2006 to 2007–2016. (b) Compared with 1998–2006, the impact of excluding soil N2O emissions on AGTFP in 2007–2016 is more evident than included soil N2O emissions. Taking HAOR-Areas as an example, the difference between AGTFP (excluded soil N2O emissions) and AGTFP (included soil N2O emissions) is 0.017 (1.076–1.059) in 1998–2006, while the difference expanded to 0.031 (1.109–1.078) in 2007–2016. In a word, it is indicated from these data that soil N2O emissions play an increasingly important role in AGTFP.
In conclusion, soil N2O emissions play an increasingly important role in GHG emissions and agricultural productivity in China, especially since the agricultural tax was abolished in 2006. From the discussion above, we can get the enlightenment that the government should take more policy measures to improve the utilization efficiency of agricultural waste. At the same time, there is some regional heterogeneity in its role. Different regions should adopt different agricultural produce stimulus policies and environmental regulation policies according to their environment and local conditions.

5. Conclusions

The decision of China to abolish the agriculture tax, which had lasted for two thousand years in 2006 led to the prosperity of agriculture and the increasingly important role of soil N2O emissions. Therefore, the purpose of this study is to evaluate the role of soil N2O emissions in AGTFP by taking 2006 as the dividing line and calculating the AGTFP, and. As a result, lots of interesting conclusions have been reached. For example, soil N2O emissions have an increasing effect on AGTFP with time. Compared with 1998–2006, the impact of excluding soil N2O emissions on AGTFP in 2007–2016 is more evident than that included soil N2O emissions. However, there are also some potential problems which need to be studied more in the future. For instance, the availability and accuracy of data for each province, such as Tibet, the rational and scientific division of different provinces, etc. Furthermore, it is generally believed that nitrification and denitrification processes are the main pathways for the generation of soil N2O. Meanwhile, environmental factors (soil type, humidity, type of crop, soil pH, temperature, etc.) and management measures (fertilization, irrigation, etc.) mainly affect these two processes to affect N2O emission. However, most scholars explored the impact of these environmental factors on N2O emissions based on the research scope of environmental science. In future research, it may be a very good and insightful novel topic to incorporate the above factors into our impact on agricultural output efficiency, which is also conducive to strengthening the theoretical basis for us to further propose reasonable N2O emission reduction measures.

Author Contributions

Conceptualization, X.X.; Methodology, L.C.; Software, X.X.; Formal analysis, L.C.; investigation, L.Z.; Resources, L.C.; Data curation, L.Z.; Writing—original draft preparation, X.X.; Writing—review and editing, L.C.; Visualization, X.X.; Supervision, C.L.; Project administration, X.X.; Funding acquisition, C.L. All authors have read and agree to the published version of the manuscript.

Funding

This research was funded by the MOE Project of Key Research Institute of Humanities and Social Sciences of Research Center for Economy of Upper Reaches of the Yangtse River “Research on agricultural modernization and industrial innovation and development”, grant number No: CJSYTD201710, Open subject of Collaborative Innovation Center for Urban Industries Development in Chengdu-Chongqing Economic Zone“ Study on spatiotemporal differences and influencing factors of low carbon agricultural productivity in China”, grant number No: KFJJ2019029, and Chongqing education commission humanities and social science planning “Research on the innovation of agricultural socialization service system in Chongqing”, grant number No: 19SKGH280.

Acknowledgments

We thank Timothy Kyng and Fei Guo at Macquarie University for their thoughtful guidance.

Conflicts of Interest

The authors declare no conflict of interest.

Abbreviations

GHGgreenhouse gas
AGTFPAgricultural Green Total Factor Productivity
TFPTotal factor productivity
TATFPTraditional agricultural total factor productivity
HAOR-AreasAreas with High agricultural output ratio
LAOR-AreasAreas with Low agricultural output ratio
MAOR-AreasAreas with Medium agricultural output ratio

References

  1. Committee of National People’s Congress. The Decision on Abolishing “The Regulations of the People’s Republic of China on Agricultural Tax”, 29 December 2005. Available online: http://www.moj.gov.cn/Department/content/2006-05/08/592_201212.html (accessed on 8 May 2006).
  2. National Bureau of Statistics of China. Available online: http://www.stats.gov.cn/ (accessed on 30 July 2017).
  3. Xu, X.; Xu, Z.; Chen, L.; Li, C. How Does Industrial Waste Gas Emission Affect Health Care Expenditure in Different Regions of China: An Application of Bayesian Quantile Regression. Int. J. Environ. Res. Public Health 2019, 16, 2748. [Google Scholar] [CrossRef] [PubMed] [Green Version]
  4. Luo, Y.; Li, Q.; Yang, K.; Xie, W.; Zhou, X.; Shang, C.; Xu, Y.; Zhang, Y.; Zhang, C. Thermodynamic analysis of air-ground and water-ground energy exchange process in urban space at micro-scale. Sci. Total Environ. 2019. [Google Scholar] [CrossRef]
  5. Chen, L.; Zhang, X.; Xu, X. Health Insurance and Long-Term Care Services for the Disabled Elderly in China: Based on CHARLS Data. Risk Manag. Healthc. Policy 2020, 13, 155–162. [Google Scholar] [CrossRef] [PubMed] [Green Version]
  6. Xu, X.; Chen, L. Projection of Long-Term Care Costs in China, 2020–2050: Based on the Bayesian Quantile Regression Method. Sustainability 2019, 11, 3530. [Google Scholar] [CrossRef] [Green Version]
  7. Yang, K.; Yu, Z.; Luo, Y.; Zhou, X.; Shang, C. Spatial-Temporal Variation of Lake Surface Water Temperature and its Driving Factors in Yunnan-Guizhou Plateau. Water Resour. Res. 2019, 55, 4688–4703. [Google Scholar] [CrossRef]
  8. Huang, X.; Xu, X.; Wang, Q.; Zhang, L.; Gao, X.; Chen, L. Assessment of Agricultural Carbon Emissions and Their Spatiotemporal Changes in China, 1997–2016. Int. J. Environ. Res. Public Health 2019, 16, 3105. [Google Scholar] [CrossRef] [PubMed] [Green Version]
  9. Xu, X.; Huang, X.; Zhang, X.; Chen, L. Family Economic Burden of Elderly Chronic Diseases: Evidence from China. Healthcare 2019, 7, 99. [Google Scholar] [CrossRef] [Green Version]
  10. Yigen, W.; Kaiwen, F. Spatial-temporal differentiation features and correlation effects of provincial agricultural carbon emissions in China. Environ. Sci. Technol. 2019, 42, 180–190. (In Chinese) [Google Scholar]
  11. Wu, S.; Walker, D.; Deva doss, S. Productivity Growth and its Component in Chinese Agriculture after Reforms. Rev. Dev. Econ. 2001, 5, 375–391. [Google Scholar] [CrossRef] [Green Version]
  12. Wong, L.F. Agricultural Productivity in the Socialist Countries; West views Press: Boulder, CO, USA, 1986. [Google Scholar]
  13. Lambert, D.K.; Parker, E. Productivity in Chinese Provincial Agriculture. J. Agric. Econ. 2010, 49, 378–392. [Google Scholar] [CrossRef]
  14. McmiIlan, J.; Whalley, J.; Zhu, L. The Impact of China’s Economic Reforms on Agricultural Productivity Growth. J. Polit. Econ. 1989, 97, 781–807. [Google Scholar] [CrossRef]
  15. Coelli, T.J.; Rao, D.S. Total factor productivity growth in agriculture: A Malmquist index analysis of 93 countries, 1980–2000. Agric. Econ. 2005, 32, 115–134. [Google Scholar] [CrossRef] [Green Version]
  16. Huang, Z.; Fu, Y.; Liang, Q.; Song, Y.; Xu, X. The Efficiency of Agricultural Marketing Cooperatives in China’s Zhejiang Province. Manag. Decis. Econ. 2013, 34, 272–282. [Google Scholar] [CrossRef]
  17. Coelli, T.J.; Rao, D.S.P. Implicit Value Shares in Malmquist TFP Index Numbers; CEPA Working Papers No. 4/2001; School of Economics, University of New England: Armidale, NSW, Australia, 2001; p. 27. [Google Scholar]
  18. Bayarsaihan, T.; Coelli, T. Productivity growth in pre- 1990 Mongolian agriculture: Spiraling disaster or emerging success. Agric. Econ. 2003, 28, 121–137. [Google Scholar]
  19. Liu, Y.; Feng, C. What drives the fluctuations of “green” productivity in China’s agricultural sector? A weighted Russell directional distance approach. Resour. Conserv. Recycl. 2019, 147, 201–213. [Google Scholar] [CrossRef]
  20. Tone, K. A slacks-based measure of super-efficiency in data envelopment analysis. Eur. J. Op. Res. 2002, 143, 32–41. [Google Scholar] [CrossRef] [Green Version]
  21. West, T.O.; Marland, G. A synthesis of carbon sequestration, carbon emissions, and net carbon flux in agriculture: Comparing tillage practices in the United States. Agric. Ecosyst. Environ. 2002, 91, 217–232. [Google Scholar] [CrossRef]
  22. Johnson, J.M.F. Agricultural opportunities to mitigate greenhouse gas emissions. Environ. Pollut. 2007, 150, 107–124. [Google Scholar] [CrossRef]
  23. Tan, Q. Greenhouse Gas Emission in China’s Agriculture: Situation and Challenge. China Popul. Resour. Environ. 2011, 29, 69–75. (In Chinese) [Google Scholar]
  24. Chen, L.; Long, C.; Wang, D.; Yang, J. Phytoremediation of cadmium (Cd) and uranium (U) contaminated soils by Brassica juncea L. enhanced with exogenous application of plant growth regulators. Chemosphere 2020, 242, 125112. [Google Scholar] [CrossRef]
  25. Akrofi-Atitianti, F.; Ifejika Speranza, C.; Bockel, L.; Asare, R. Assessing Climate Smart Agriculture and Its Determinants of Practice in Ghana: A Case of the Cocoa Production System. Land 2018, 7, 30. [Google Scholar] [CrossRef] [Green Version]
  26. Su, M.; Jiang, R.; Li, R. Investigating Low-Carbon Agriculture: Case Study of China’s Henan Province. Sustainability 2017, 9, 2295. [Google Scholar] [CrossRef] [Green Version]
  27. Wu, Y.; Feng, K.; Li, G. Spatiotemporal differentiation and dynamic evolution of non-point source pollution in China. J. China Agric. Univ. 2017, 22, 186–199. (In Chinese) [Google Scholar]
  28. Xu, K.; Bossink, B.; Chen, Q. Efficiency Evaluation of Regional Sustainable Innovation in China: A Slack-Based Measure (SBM) Model with Undesirable Outputs. Sustainability 2020, 12, 31. [Google Scholar] [CrossRef] [Green Version]
  29. Guo, S.; Qian, Y.; Zhao, R. In the western region agricultural carbon efficiency and convergence analysis -based on SBM Undesirable model. J. Rural Econ. 2018, 11, 80–87. (In Chinese) [Google Scholar]
  30. Min, J.; Hu, H. Measurement of greenhouse gas emissions from agricultural production in China. China Popul. Resour. Environ. 2012, 22, 21–27. [Google Scholar]
  31. Tian, Y.; Zhang, J.; Yin, C.; Wu, X. Evolution of agricultural carbon emission distribution in China—Based on panel data analysis of 31 provinces (cities and districts) from 2002 to 2011. China Popul. Resour. Environ. 2014, 24, 91–98. (In Chinese) [Google Scholar]
  32. Xu, X.; Huang, X.; Huang, J.; Gao, X.; Chen, L. Spatial-Temporal Characteristics of Agriculture Green Total Factor Productivity in China, 1998–2016: Based on More Sophisticated Calculations of Carbon Emissions. Int. J. Environ. Res. Public Health 2019, 16, 3932. [Google Scholar] [CrossRef] [Green Version]
  33. Ogbonnaya, U.; Semple, K.T. Impact of Biochar on Organic Contaminants in Soil: A Tool for Mitigating Risk? Agronomy 2013, 3, 349–375. [Google Scholar] [CrossRef]
  34. Tan, Q. Agricultural greenhouse gas emissions in China: Status and challenges. China Popul. Resour. Environ. 2011, 21, 69–75. (In Chinese) [Google Scholar]
  35. Wuebbles, D.J. Nitrous oxide: No laughing matter. Science 2009, 326, 56–57. [Google Scholar] [CrossRef] [PubMed]
  36. Ravishankara, A.R.; Daniel, J.S.; Portmann, R.W. Nitrous oxide (N2O): The dominant ozone–depleting substance emitted in the 21st century. Science 2009, 326, 123–125. [Google Scholar] [CrossRef] [PubMed] [Green Version]
  37. Reay, D.S.; Davidson, E.A.; Smith, K.A.; Smith, P.; Melillo, J.M.; Dentener, F.; Crutzen, P.J. Global agriculture and nitrous oxide emissions. Nat. Climate Chang. 2012, 2, 410–416. [Google Scholar] [CrossRef]
  38. Smith, K.A.; Mosier, A.R.; Crutzen, P.J.; Winiwarter, W. The role of N2O derived from crop–based biofuels, and from agriculture in general, in Earth’s climate. Philos. Trans. R. Soc. Biol. Sci. 2012, 367, 1169–1174. [Google Scholar] [CrossRef] [PubMed] [Green Version]
  39. Montzka, A.S.; Dlugokencky, E.J.; Butler, J.H. Non–CO2 greenhouse gases and climate change. Nature 2011, 476, 43–50. [Google Scholar] [CrossRef]
  40. Denman, K.L.; Brasseur, G.; Chidthaisong, A.; Ciais, P.; Cox, P.M.; Jacob, D. Couplings between Changes in the Climate System and Biogeochemistry; Solomon, A., Qin, D., Manning, M., Eds.; International Panel on Climate Change; Cambridge University Press: Cambridge, UK, 2007; pp. 499–587. [Google Scholar]
  41. Food and Agriculture Organization. FAOSTAT database collections [EB/OL]. 2015. Available online: http://www.apps.fao.org (accessed on 1 September 2018).
  42. IPCC. Climate Change 2007: Mitigation of Climate Change; Contribution of Working Group III to the Fourth Assessment Report of the Intergovernmental Panel on Climate Change; IPCC: Geneva, Switzerland, 2008; Volume 45. [Google Scholar]
  43. Ministry of Housing and Urban-Rural Development of China. Statistical yearbook of urban construction. 2018. Available online: http://www.mohurd.gov.cn/xytj/index.html (accessed on 1 September 2018).
  44. Pareja-Sanchez, E.; Cantero-Martinez, C.; Alvaro-Fuentes, J.; Plaza-Bonilla, D. Impact of tillage and N fertilization rate on soil N2O emissions in irrigated maize in a Mediterranean agroecosystem. Agric. Ecosyst. Environ. 2020, 287, 106687. [Google Scholar] [CrossRef]
  45. Vargas, V.P.; Soares, J.R.; Oliveira, B.G.; Loureno, K.S.; Martins, A.A.; Del Grosso, S.J.; do Carmo, J.B.; Cantarella, H. Sugarcane Straw, Soil Temperature, and Nitrification Inhibitor Impact N2O Emissions from N Fertilizer. Bioenergy Res. 2019, 12, 801–812. [Google Scholar] [CrossRef]
  46. Niu, Y.H.; Cai, Y.J.; Chen, Z.M.; Luo, J.F.; Di, H.J.; Yu, H.Y.; Zhu, A.N.; Ding, W.X. No-tillage did not increase organic carbon storage but stimulated N2O emissions in an intensively cultivated sandy loam soil: A negative climate effect. Soil Tilage Res. 2019, 195, 104419. [Google Scholar] [CrossRef]
  47. Anastopoulos, I.; Omirou, M.; Stephanou, C.; Oulas, A.; Vasiliades, M.A.; Efstathiou, A.M.; Ioannides, I.M. Valorization of agricultural wastes could improve soil fertility and mitigate soil direct N2O emissions. J. Environ. Manag. 2019, 250, 109389. [Google Scholar] [CrossRef]
  48. Yin, M.Y.; Gao, X.P.; Tenuta, M.; Gui, D.W.; Zeng, F.J. Presence of spring-thaw N2O emissions are not linked to functional gene abundance in a drip-fertigated cropped soil in arid northwestern China. Sci. Total Environ. 2019, 695, 133670. [Google Scholar] [CrossRef]
Figure 1. Regional comparison of AGTFP in 2016. (a) AGTFP including soil N2O emissions and (b) AGTFP excluding soil N2O emissions.
Agriculture 10 00150 g001
Table 1. Different agriculture greenhouse gas (GHG) emission sources and their emission coefficients.
Source
(1)
Emission CoefficientsSource
(2)
Emission CoefficientsSource
(3)
Emission CoefficientSource
(4)
Emission CoefficientsSource
(5)
Emission Coefficients
Agricultural Materials CO2 (kgC/kg)Straw Burning CO2 (kgC/kg)Livestock Breeding CH4 (kg/each head)Soil N2O (kg/hm2)Rice Planting CH4 (g/m2)
Fertilizer0.89Rice0.18Cow84Rice0.24Early rice14.66
Pesticide4.93Wheat0.16Water buffalo57Winter wheat2.05Late rice29.83
Mulching films5.18Corn0.17Scalpers48.8Spring wheat0.4Mid-season rice33.25
Diesel0.59Rapeseed0.22Camel47.92Soybean0.77
Irrigation266.48Soybean0.15Horse19.64Corn2.53
Cotton0.13Pig4.5Vegetables4.21
Sources: ORNL (American Oak Ridge National Laboratory, 2009), IPCC (Intergovernmental Panel on Climate Change) report. Note: This table only lists sources of relatively large amounts of pollution. hm2 = hectare (ha.).
Table 2. List of measurement formulae of AGTFP.
StepsCalculation FormulaeNumerical Order
The first step P ( x ) = { ( x , y , b ) : x   c a n   p r o d u c e   ( y , b ) } Formula (2a)
P G ( x ) = P 1 ( x 1 ) P 2 ( x 2 ) P T ( x T ) Formula (2b)
P G ( x ) = { ( x t + y t + b t ) : t = 1 T k = 1 K z k y k m t y m t ; t = 1 T k = 1 K z k b k t = b t ; t = 1 T k = 1 K z k x k n t x n t } Formula (2)
The second step D 0 G ( x k t + y k t + b k t ) = m i n 1 [ 1 N n = 1 N s n x / k n k ] 1 + [ 1 M + 1 ( m = 1 M s m y / y m k + i = 1 I s i b / b i k ) ] Formula (3)
x k n t = t = 1 T k = 1 K Z k t x k n t + s n x , n = 1 , 2 , , N Formula (4)
y k m t = t = 1 T k = 1 K Z k t y k m t s m y , m = 1 , 2 , , M Formula (5)
b k i t = t = 1 T k = 1 K Z k t b k i t + s i b , i = 1 , 2 , , I Formula (6)
The third step A G T F P = 1 + D 0 G ( X t , y t , b t ; y t , b t ) 1 + D 0 G ( X t + 1 , y t + 1 , b t + 1 ; y t + 1 , b t + 1 )     = 1 + D 0 G ( X t , y t , b t ; y t , b t ) 1 + D 0 t + 1 ( X t + 1 , y t + 1 , b t + 1 ; y t + 1 , b t + 1 )     * 1 + D 0 t + 1 ( X t + 1 , y t + 1 , b t + 1 ; y t + 1 , b t + 1 ) 1 + D 0 G ( X t + 1 , y t , b t + 1 ; y t + 1 , b t + 1 ) Formula (7)
Table 3. Scale and intensity of agricultural GHG emissions from 1998 to 2016.
YearAgricultural Materials Soil N2ORice PlantingLivestock BreedingStraw BurningScale of GHG EmissionsIntensity of GHG Emissions
Included Soil N2O EmissionsExcluded Soil N2O Emissions
19987064.861448.616576.378878.348061.0432029.221.231.17
19997217.291478.776256.819157.327880.1731990.361.171.11
20007303.981486.776197.029074.697106.3631168.821.111.05
20017515.691547.36168.349489.737187.6231908.681.091.03
20027668.711584.26131.989660.697192.3232237.91.040.99
20037802.361566.895836.8310172.566789.9932168.6310.95
20048236.911577.76247.2510727.217543.8434332.9110.95
20058496.071540.696355.910305.677785.9134484.240.950.90
20068761.831655.556323.919518.388036.4834296.150.890.84
20079082.561683.826294.537927.268209.1333197.30.830.79
20089233.991712.866351.277597.178670.8633566.150.80.76
20099501.431766.76398.978024.368749.4134440.870.780.74
20109781.471811.736414.488227.748971.3935206.810.770.73
201110042.181852.186427.348270.99937235964.690.750.71
201210283.941901.76408.798379.119700.9136674.450.730.69
201310443.841944.926417.818492.869909.3737208.80.710.67
201410608.11978.826415.538647.399990.137639.940.690.65
201510680.172018.596432.368638.8110227.937997.830.670.63
201610610.242006.776140.768529.2410104.2837391.290.650.61
Note: agricultural GHG intensity = total agricultural GHG emissions/agricultural output value. The total agricultural output value was adjusted according to the constant price in 1998. The unit of columns 2–7 is 10,000 tons (ten thousand tons), and the unit of columns 8–9 is tons/10,000 yuan.
Table 4. Agricultural green total factor productivity (AGTFP) in two periods in different provinces.
Regions1998–20062007–2016
AGTFP Including Soil N2O EmissionsAGTFP Excluding Soil N2O EmissionsAGTFP Including Soil N2O EmissionsAGTFP Excluding Soil N2O Emissions
Beijing1.0361.0881.0611.221
Tianjin1.0211.0721.1241.292
Hebei1.0571.1101.1441.315
Liaoning1.0521.1041.0921.255
Shanghai1.0021.051.0011.151
Jiangsu1.0741.1281.0441.200
Zhejiang1.0691.1221.0391.194
Fujian1.0411.0921.0581.216
Shandong1.1061.1611.1081.274
Guangdong1.0391.0921.0411.197
Guangxi1.0351.0871.0291.183
Hainan0.9621.0111.0331.187
Shanxi1.0271.0781.0411.197
Inner Mongolia1.0021.0521.0071.158
Jilin1.0261.0771.0251.178
Heilongjiang1.0331.0841.0371.192
Anhui1.0591.1121.0411.197
Jiangxi1.0181.0691.0531.211
Henan1.0551.1081.0841.246
Hubei1.0361.0881.0461.202
Hunan1.0351.0861.0341.189
Chongqing1.0361.0881.1071.273
Sichuan1.0451.0971.1231.291
Guizhou1.0041.0541.1031.268
Yunnan1.0301.0811.0341.189
Tibet0.9991.0491.0011.151
Shaanxi1.0821.1361.0911.254
Gansu0.9931.0421.0231.176
Qinghai0.9691.0170.9741.120
Ningxia0.9080.9541.0111.162
Xinjiang1.0271.0781.0261.179
Table 5. Comparison between AGTFP (included soil N2O emissions or not) and traditional agricultural total factor productivity (TATFP).
RegionsVariables1998–20062007–20161998–2016
The whole countryAGTFP (including soil N2O emissions)1.0221.0561.035
AGTFP (excluding soil N2O emissions)1.0371.1021.066
TATFP1.1061.1531.130
Low agricultural output ratio areas (LAOR-Areas)AGTFP (including soil N2O emissions)1.0271.0641.042
AGTFP (excluding soil N2O emissions)1.0291.0861.054
TATFP1.1011.1621.137
Medium agricultural output ratio areas (MAOR-Areas)AGTFP (including soil N2O emissions)1.0331.0521.034
AGTFP (excluding soil N2O emissions)1.0431.0831.049
TATFP1.1081.1481.129
high agricultural output ratio areas (HAOR-Areas)AGTFP (including soil N2O emissions)1.0591.0781.025
AGTFP (excluding soil N2O emissions)1.0761.1091.107
TATFP1.0031.1441.118

