Article

Potential Adoption of Integrated Pest Management Strategy for Suppression of Mango Fruit Flies in East Africa: An Ex Ante and Ex Post Analysis in Ethiopia and Kenya

International Centre of Insect Physiology and Ecology (icipe), P.O. Box 30772-00100 Nairobi, Kenya
*
Author to whom correspondence should be addressed.
Submission received: 3 June 2020 / Revised: 30 June 2020 / Accepted: 1 July 2020 / Published: 8 July 2020
(This article belongs to the Section Agricultural Economics, Policies and Rural Management)

Abstract

:
To sustain agricultural development in Africa, innovative strategies for addressing a myriad of biotic and abiotic constraints facing the agricultural systems must be established. One current biotic stress is the mango infesting fruit flies. In the effort to contain the widely spreading and damaging invasive species of tephritid fruit fly (Bactrocera dorsalis) (Hendel), an area-wide integrated pest management (IPM) program is being promoted in the horticultural sub-sector in sub-Saharan Africa. Such a new technology in which farmers have limited information before commercialization may have diffusion paths that are different from the often-assumed sigmoid (or “s”) shaped curve. We apply the descriptive and econometric analysis of ex ante and ex post integrated fruit fly management used by mango farmers in Kenya and Ethiopia. The results reveal that this technology has a relatively high adoption rate and high prospects for adoption growth in Kenya compared to Ethiopia in the near future.

1. Introduction

Agriculture remains the main economic activity in many developing countries in sub-Saharan Africa. Horticultural farming is the fastest-growing agricultural sector in these countries [1] and contributes significantly to poverty reduction, food security, and export earnings [2]. Subsequently, any effort to strengthen the horticultural sector could contribute greatly to the success in attaining the millennium development goals of sub-Saharan Africa [3].
Mango is one of the most economically important tropical fruit in sub-Saharan Africa. In Kenya and Ethiopia, mango is particularly important to smallholder farmers who are dominantly involved in fruit production. The fruit provides them with employment opportunities, food and nutrition security, and income from the regional and international markets. Although production of mango is widespread in the world, with estimated area coverage and annual production of 3.69 million hectares and 35 million tons, respectively [4], only about 5% of this production is exported, with fruit flies cited as the main challenge that contributes to this disparity [5].
In sub-Saharan Africa, including Kenya and Ethiopia, the fruit fly problem is embellished by a myriad of other challenges including low productivity, limited capacity to buy farm inputs including improved mango varieties, fertilizer, and infestation by other insect pests and diseases. The yield gaps are evident in Kenya and Ethiopia, as production in the two countries is far below its potential. In Africa, annual losses of horticultural produce due to fruit flies are estimated at US$2 Billion, both directly where the pest fed to the fruit pulp or indirectly through loss of market opportunities as a result of quarantine restrictions to export to the global markets [6,7,8,9].
Like many developing countries, mango farmers in Kenya and Ethiopia use a combination of modern and traditional methods of managing pests and diseases. However, over-reliance on chemical pesticides for the control of fruit flies is evident in both countries. The overuse (misuse) of pesticides has resulted in the development of resistance in the pest to certain pesticides [10,11], in addition to causing adverse effects on the environment and human health [12]. Furthermore, increased use of insecticides on the fruit reduces their marketability in the global markets due to high insecticide residue levels [9]. Integrated pest management (IPM) is recommended as an effective and sustainable alternative to the conventional use of synthetic pesticides [13]. The IPM approach involves the management of pests using a combination of biological, cultural, and physical pest control strategies. The approach draws on a range of management tools intending to use the least ecologically disruptive techniques to manage pests in a way that maintains their damage at economically acceptable levels. While the IPM approach has been widely adopted in developed countries, the uptake is still slow but growing in developing countries. A few successful cases from developing countries include the adoption of IPM for control of aubergine fruit and shoot borer in West Bengal, India [14], IPM use in cotton production in Haryana and Punjab, India [15], IPM in rice production in Bangladesh [16], IPM in vegetable production in Nicaragua [17], and fruit fly management in mango production in India [18]. In Africa, the IPM approach has also been adopted to address biotic constraints in a variety of crop enterprises. Examples include IPM in cotton production in Zimbabwe [19], coffee in Uganda [20], and control of false coding moth (FCM) and Africa Trioza (ACT) in citrus orchards in South Africa [21].
To address the challenge of fruit flies in the sub-Saharan Africa horticultural industry, the International Center of Insect Physiology and Ecology (icipe) and development partners have devised an IPM strategy for suppression of the pest to increase returns to farmers through improved yield and market competitiveness of the crop while minimizing the use of synthetic chemicals [6,7,22,23,24,25,26,27,28]. The strategy consists of (1) spot application of food bait, (2) male annihilation technique (MAT), (3) use of biopesticide, (4) releases of parasitoids (Fopius arisanus (Sonan) and Diachasmimorpha longicaudata (Ashmead) (both Hymenoptera: Braconidae), and (5) use of orchard sanitation [7,22,23,24,28,29,30]. The practices have been tested and demonstrated to be effective in the management of the most destructive fruit fly species B. dorsalis (Hendel) under the tropical conditions in Africa [28]. Initial trials were conducted in Kenya but have since been widely upscaled to other countries in eastern, southern, and western Africa. An earlier study on the adoption of the icipe fruit fly IPM by Korir et al. [31] was mainly based on field trials. However, a recent study by Midingoyi et al. [32] explored the adoption of the IPM strategy after the commercialization of the two of the IPM components (i.e., the MAT and biopesticide), which are supplemented by a massive release of parasitoids. In Ethiopia, however, most of the components are still in the introduction phase. Based on the current phase of dissemination and promotion effort of the fruit fly IPM practices, we perceive adoption in Kenya and Ethiopia as ex post and ex ante, respectively, and thus the title of our study.
According to Grilliches et al. [33], farmers make technology adoption decisions by matching their objectives against the knowledge they have acquired about the attributes of the technology. Although the IPM strategy is being promoted widely across several African countries, including Kenya and Ethiopia, farmers’ adoption decisions are a time-dependent process. While some components of the IPM have been commercialized, some are still undergoing registration. However, information about the different packages is widely available based on field trials that have been conducted by icipe and partners. Therefore, many mango farmers have developed perceptions as to the effectiveness of technology in the management of the target fruit fly species (Bactrocera dorsalis).
In Kenya, the potential for fruit fly IPM adoption for commercialized packages (mainly fruit fly traps) and the cultural method of orchard sanitation have been assessed previously [31]. The authors found about 19% of the surveyed respondents were using the commercialized fruit fly traps or the male annihilation technique, while about 50% were using some cultural mechanisms including burying and burning fallen fruits. Similarly, the potential impact of these packages among others on field trials has been assessed [24,25]. The studies estimate that the packages can reduce pesticide expenditure by between 30–46.3%, reduce mango losses by 19–55%, and increase mango income between 22–48%, comparing the treatment farmers and the control. Providing this information to the farmers may shape their perceptions and may change the timing of their ex post adoption decisions. While the study of Korir et al. [31] provides useful insights into the potential uptake of the IPM technology, it does not consider the timing of the adoption decisions. Similarly, Midingoyi et al. [32], assessing the household and environmental benefits of adopting one versus a bundle of the fruit fly IPM strategies, did not consider the time-dependent process of adoption of this technology. It is important to consider the length of time it takes for the farmers to adopt the fruit fly IPM technology, as this shapes the expected ex post diffusion path of the technology. Furthermore, predicting adoption rates ex ante permits the identification of potential gainers and losers for the anticipation of policy implications [34]. The outcome should inform policymakers and development partners in understanding and designing policies aimed at promoting and disseminating the IPM practices and enhancing their adoption.
Survey data gathered ex ante and ex post on fruit fly IPM use and willingness to adopt the technology by mango farmers in Ethiopia and Kenya respectively, are used in this paper to examine its adoption path. Although IPM is not a new concept in the developed world, its application in sub-Saharan Africa, particularly among the smallholder farmers, is still very limited. However, in the case of fruit fly IPM, rigorous dissemination and promotion efforts have made the technology feasible. This presents a research gap that justifies the need to evaluate what appears as an increasing trend based on ongoing promotion activities by the African fruit fly program [24,25,32]. The current study attempts to address this research gap.
The surveys involved face-to-face interviews with 660 and 366 mango growing households in Kenya and Ethiopia, respectively, conducted between July and December 2016 in both countries. We test the hypothesis on characteristics associated with knowledge and receptiveness towards fruit fly IPM and the role of training and information on fruit fly IPM adoption, among other farmers, farm, and social capital characteristics. We also compare the adoption probabilities of different categories of mango growers and make predictions of adoption. Categories of mango growers are compared for significant differences in control variables to establish the differences based on these categorizations. Based on selected awareness, knowledge, perception, and training variables, we assess the structural changes in probabilities of fruit fly IPM adoption patterns for the different categories of respondents.

2. Materials and Methods

2.1. Econometric Approach
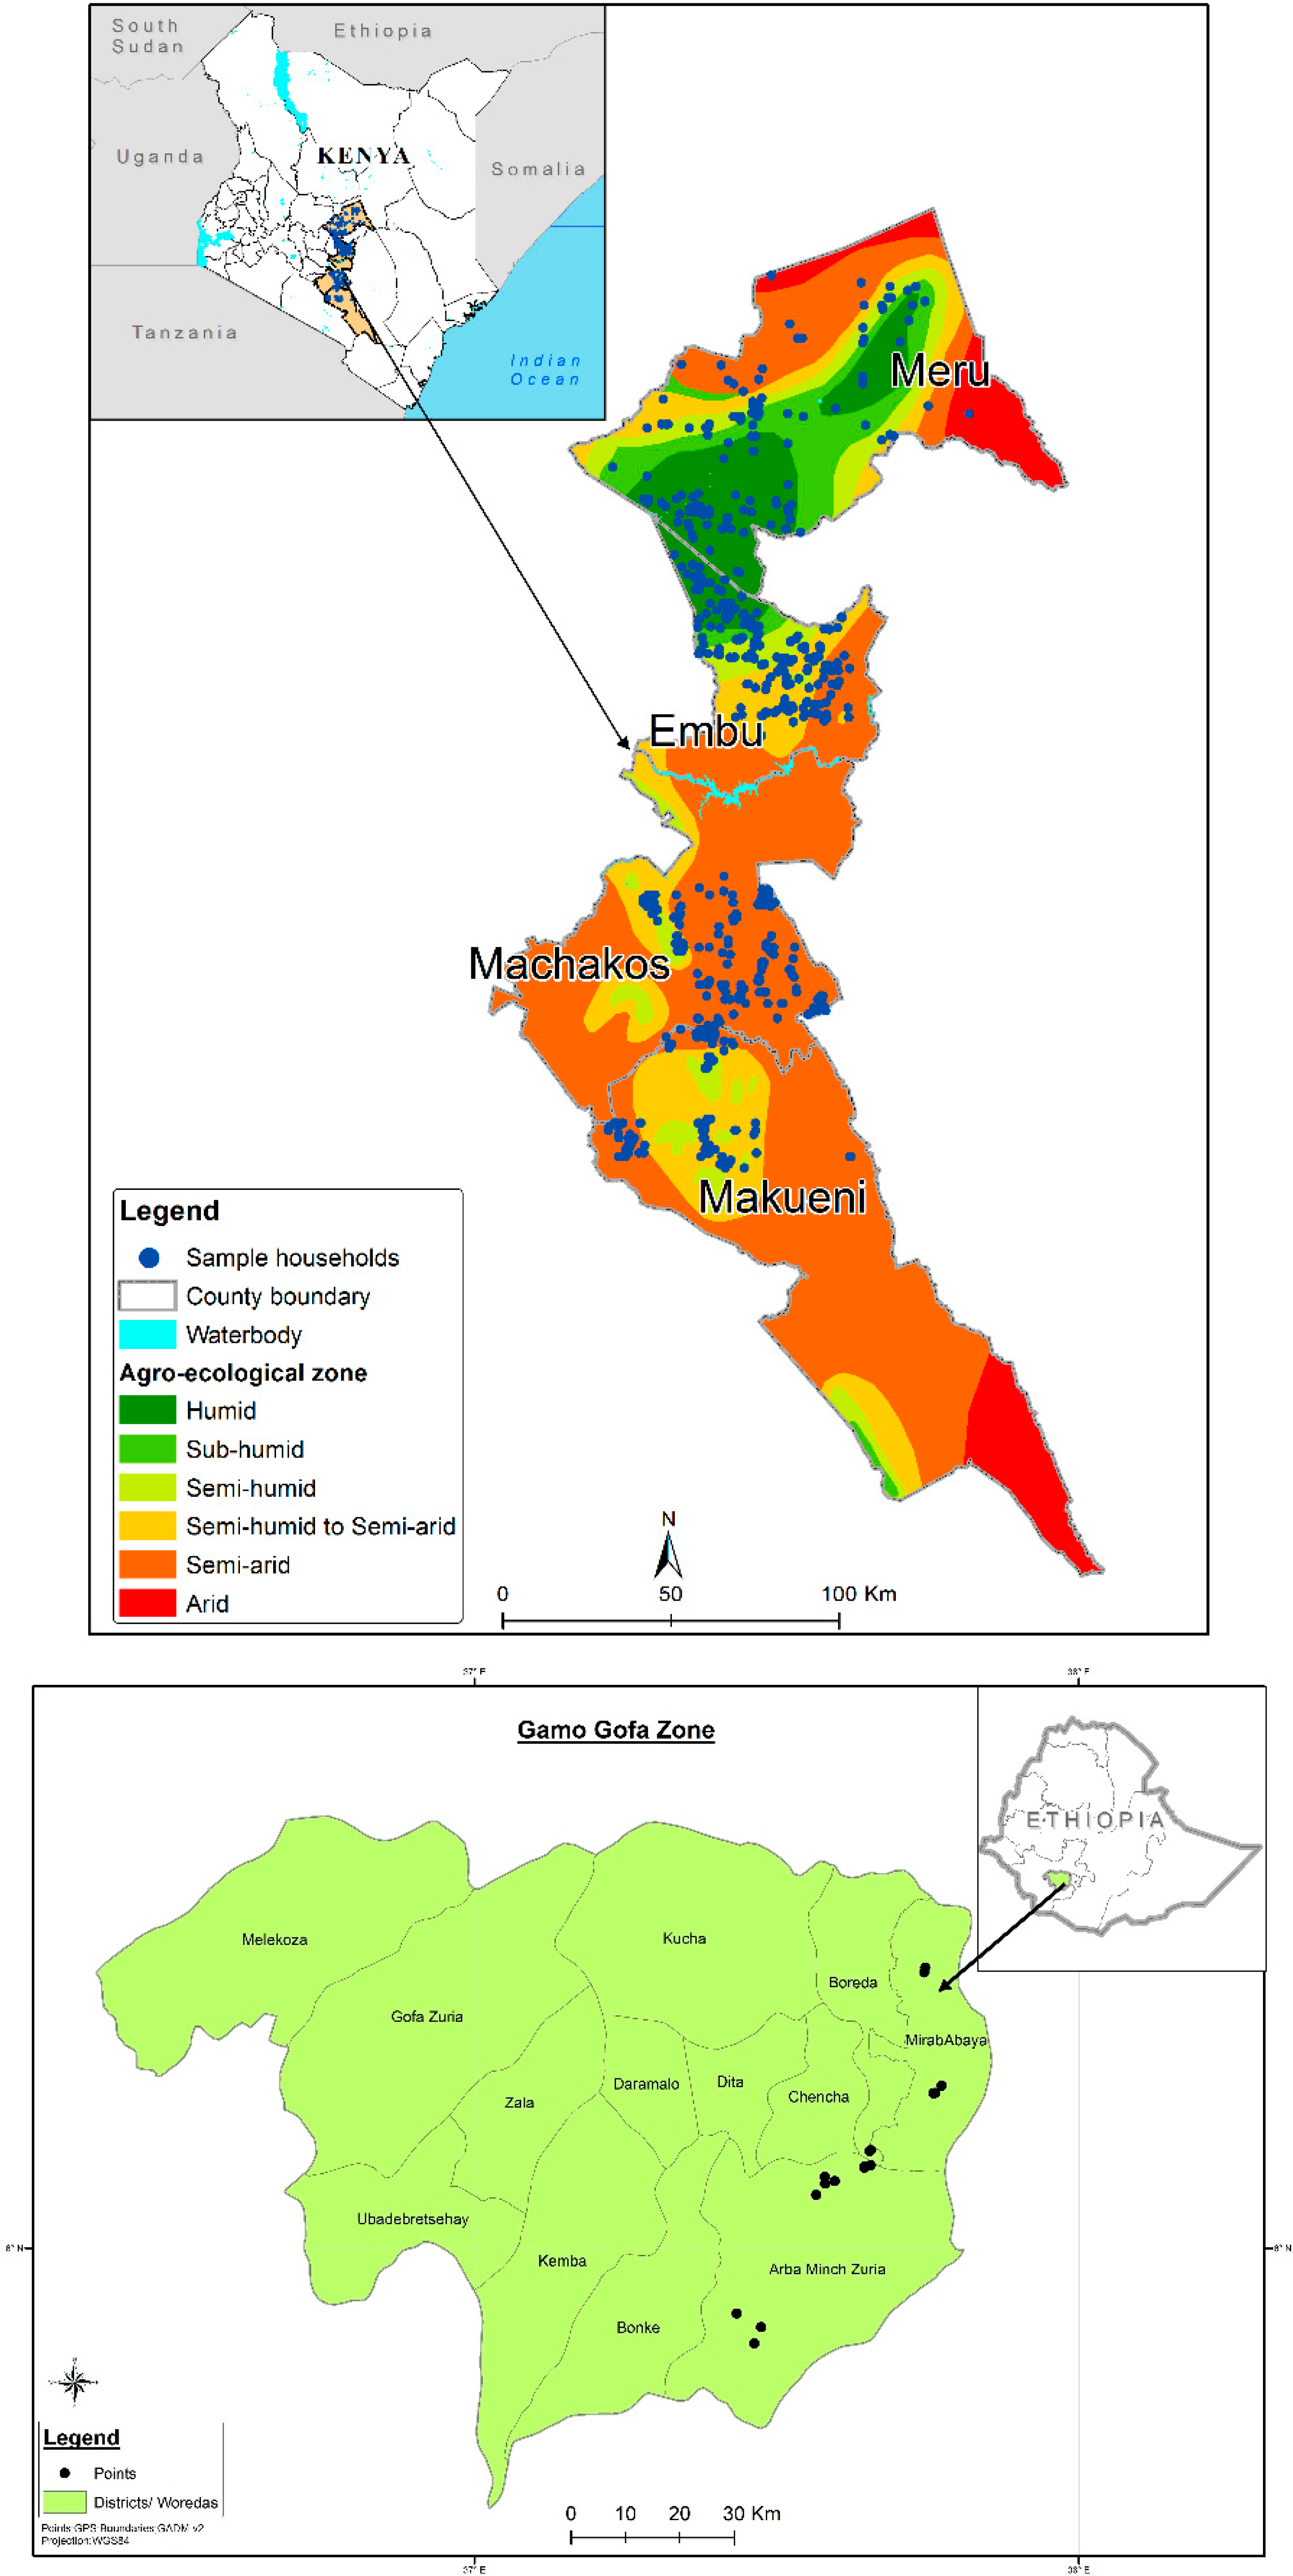
Modeling adoption of agricultural technologies began as early as the work of Griliches [33], which highlighted the importance of evaluating economic factors in the adoption decisions. Many studies have then followed in conducting factors influencing technologies using both ex post and ex ante adoption frameworks, with most studies in developing countries adopting the former frameworks [35]. Ex ante adoption models are however limited in Africa but widely applied in agricultural disciplines in developed countries. A good example is the case of rBST (recombinant bovine somatotropin) technology in the dairy sub-sector in the USA [34,36,37,38]. Various econometric models have been used to make ex ante projections of agricultural technologies. Lesser et al. [38], for example, applied a multinomial logit model to project the diffusion rates of rBST technology among dairy farmers in New York state. Similarly, Zepeda et al. [34] and Barham et al. [39] used multinomial logit models to predict ex ante adoption of the same technology among dairy farmers in California and Wisconsin, respectively. Kolady et al. [40] applied the bivariate probit model to estimate the probability of adoption of the genetically modified eggplant in their study on ex ante adoption of modified eggplant in India. Atanu et al. [41] similarly used a bivariate probit model to estimate the adoption of emerging dairy farming technologies under output uncertainty among Texas dairy producers. Kinnucan et al. [42] applied the logit model to determine the potential effect of rBST, on the size distribution of dairy farms in the southeastern United States.
Although binary models are widely used to estimate ex ante adoption of agricultural technologies as outlined above, the multinomial logit model allows the survey response to indicate adoption rates at discrete periods in the future following the availability of the technology [37]. Subsequently, following the work of MacFadden [43] and the authors mentioned above, we adopt a multinomial logit model to assess the potential adoption of the fruit fly IPM technology and the determinants of fruit fly IPM adoption behavior among mango farmers in Kenya and Ethiopia.
The model is based on a random utility approach. With respect to the adoption of fruit fly IPM, assume a farmer attempts to maximize the expected utility of the present value of profit by choosing among J discrete technologies. The expected utility of the present value of profit by choosing the jth technology for the ith farmer is denoted as:
E i ( U i j ) = β X i + ε i j ,
where X is a (1 × q) vector of attributes of the ith farmer and ε i j is an unobserved component of the objective function of the ith farmer given the jth technology. The X vector comprises of the ith farmer and farm characteristics, social capital, and information access variables that may affect the preferences of a technology. In this context, the ith farmer chooses the jth technology that maximizes the expected utility of the present value of profit. Suppose y i j = 1 if the ith farmer chooses the jth technology, and   y i j = 0 otherwise. It follows that:
y i j = 1   i f   U i j > U i k ,   and   0   otherwise ,   k = 1 , 2 , .. , J .
Subsequently, from Equation (1), the probability of the ith farmer choosing the jth technology is:
P i j = P ( y i j = 1 ) = P [ U i j   U i k   ; k j ,   k = 1 , 2 , . , J = P [ ε i j   ε i k   f j ( X i   ) f k ( X i ) ] .
If the ε i j in Equation (1) is independently and identically distributed with the Weibull density function, the P i j can be expressed as follows [43]:
P i j = P ( y i j = 1 ) = exp   f i   ( X i ) k = 1 J exp f k ( X i ) .
Equation (4) can be written as conditional logit or multinomial logit model as follows:
P i j = exp   f i   ( X i ) 1 + k = 1 J 1 exp f k ( X i )   j = 1 , 2 , , J 1 ,
P i j = 1 1 + k = 1 J 1 exp f k ( X i ) ,
where the Ps are conditional probabilities of adoption given the explanatory variables, which can be estimated by the maximum-likelihood estimation (MLE) method [44]. Following a priori information on f k ( X k ) , we adopt a linear form [34], f j ( X i ) = X i β j , for our analysis.
In our context of fruit fly IPM adoption, we let U i j   in Equation (1) represent the expected utility of the ith farmer facing the jth adoption scheme, j = 1,……, J. Letting j to be greater than 1 reflects the dynamics of decision making with respect to adoption decisions. Specifically, mango growers can be differentiated with respect to what they know about the fruit fly IPM technology and their willingness to use it. Our conditional probabilities for the different adoption patterns, therefore, are as given in Equations (5a) and (5b), that is P o ,   P 1   ,   P 2 , . P J .
Since the coefficients ( β s ) enter the probabilities ( P s ) non-linearly, they cannot be interpreted directly [34]. The coefficient estimates for the different adoption categories can be interpreted by taking the logarithm of the ratio of the different categories relative ( P 1   ,   P 2 , . P J ) to the benchmark ( P 0 ) such that:
In ( P i j P i o ) = β j X i     j = 1 , 2 , J ,
where P i j / P i 0 are the odds in favor of outcome j relative to the benchmark outcome 0, and β j is the marginal effect of the qth regressor in X i   on the odds ratio. The multinomial logit regressions are estimated using the maximum likelihood estimation procedure from STATA. The odds ratio coefficients, however, are difficult to interpret. Associating β j with the jth outcome would be misleading. By differentiating Equation (4), we find the marginal effects of the independent variables on the probabilities are [45]:
δ i j = P i j β i = P i j [ β j k = 0 J P i k β k ] = P i j ( β j β ) ¯ .
Subsequently, every subsector of β enters every marginal effect, both through the probabilities and through the weighted average that appears in δ i j . The marginal values are computed from the parameter estimates.
Following Zepeda [34], Lesser et al. [38], and Barham [39], we classify the different technology adoption possibilities based on the mango farmers’ willingness to adopt the technology and how fast they plan to use it. We distinguish three adoption categories based on their plan to use it; early adopters ( P 1   ) ,   late adopters ( P 2   ) , and non-adopters ( P 0   ) . The early adopters are those who were willing to pay for the IPM package immediately, late adopters are those who were willing to buy the packages after one year, while non-adopters were mango growers that were willing to buy the package after two years or more or were not willing to pay for the technology.
The choice of attributes (Xs) associated with the adoption of fruit fly IPM is guided by the ex ante and ex post adoption literature, which includes the human capital theory and sociological research, and contextual characteristics that may influence the adoption of agricultural technologies. The explanatory variables can be broadly classified into five categories; household characteristics (including household education, age, household size, and gender of the household head, and the highest education in the household) [31,46,47,48]; household resources (including the size of a mango orchard, livestock ownership, farm size, per capita expenditure, access to off-farm income, and credit constraint) [31,46,49,50,51,52]; access to market and institutional information including government extension services and training [31,32,47,53,54,55]; farmers’ knowledge, attitude, and perceptions regarding mango production constraints and the attributes of the technologies (such as IPM) that respond to such constraints [14,34,54]; and social capital and network variables (including membership in mango growers’ groups, the number of people in and outside the village that a household can rely on in times of critical need, and having relatives in government positions [46,56,57,58]. We also include the location (districts in Ethiopia and counties in Kenya) dummy variables to capture spatial and regional differences between the survey sites.

2.2. Survey Data

The data utilized in this study was obtained from household-level surveys that involved face-to-face interviews with 660 mango and citrus growing households in Kenya and 366 mango growing households in Ethiopia. In Kenya, the survey was conducted from four major mango-growing counties in eastern Kenya, namely Embu, Machakos, Makueni, and Meru (Figure 1), while in Ethiopia, the survey was conducted the Southern Nations Nationalities and Peoples’ Regional State (SNNPR), regarded as the third largest administrative region of Ethiopia and a major mango production zone. A multi-stage sampling technique was utilized in both countries. In Kenya, the first stage involved a purposive selection of the four major mango producing counties of the eastern region, following icipe’s previous dissemination and promotional activities of the mango fruit fly IPM practices. The next step was to select mango-growing wards and villages in each county, in collaboration with the local agricultural extension workers. A census of mango and citrus growers in the selected wards and villages who had ten or more mango trees in each village was then developed, from which a sample of 660 mango and citrus growing households were selected based on probability proportional to size sampling technique. The sampled households were then interviewed by well-trained enumerators, who understood the local language and were supervised by an icipe researcher.
Similarly, in Ethiopia, the first stage involved a purposive selection of two districts in Gamo Gofa where mango production is predominant (namely Mirab Abaya and Arbaminch Zuria). In the second stage, 11 villages were selected from the two districts, two from Mirab Abaya and 9 from Arbaminch Zuria, again based on the intensity of mango production. Since the size of mango growers across the villages differs and to ensure every producer in the target population had an equal chance of being included in the sample, the probability proportional to size sampling technique was used to select the survey respondents. Lists of all the mango farmers in each village, which were compiled by the village (Each village (Kabbelle) has a comprehensive list of the households that resides in that village, along with a few socio-economic indicators including household size, main crops produced, etc. For this study, we requested the village elders to filter out the mango growers from the list, which served as the sampling frame for the survey), elders, served as a sampling frame for this study. Overall, 366 mango growing households were randomly selected and interviewed by trained and local language speaking enumerators.
Data collection using semi-structured questionnaires, programmed in tablets, took place in November and December 2016 in Kenya and July and August 2016 in Ethiopia. Detailed information on five broad categories of control variables highlighted in the previous section was collected for analysis during the survey. A stack of photographs of the most common mango pests and diseases was used to capture farmers’ knowledge and perceptions on mango pests and diseases. Similarly, photos of different fruit fly IPM components were presented to capture farmer’s awareness, utilization, willingness to pay for different IPM strategies. Farmers’ preferences for the fruit fly IPM strategy were elicited through the presentation of a short explanation of the scientific background of the strategy, the costs and benefits of using IPM as an alternative to the commonly used synthetic pesticides in the control of fruit flies. Those who responded positively to the willingness to pay for the IPM package were asked structured questions about their proposed adoption plans. Five adoption schemes were investigated: 0 = immediately; 1 = after 1 year; 2 = after 2 years; 3 = after how many years (specify), and (4) other specify. For our analysis, we reduced those plans into three categories. Those who were not willing to pay the package, we label as “non-adopters”. The rest of the categories were willing to buy the fruit fly IPM package. Those who said they would buy the package immediately were labeled as “early adopters”. Those who would wait until one year, we called “late adopters”, while all remaining responses we merged the “non-adopters” category. After removing missing data and apparent enumerators’ errors, we use a final sample of 508 and 348 mango growing households in Kenya and Ethiopia, respectively. Besides individual interviews, informal farmer group discussions were also conducted to complement the household survey.

3. Results and Discussion

3.1. Descriptive Statistics

3.1.1. Potential Fruit Fly IPM Adoption Patterns

Table 1 shows the potential fruit fly IPM adoption patterns among mango growers in Kenya and Ethiopia based on the willingness to pay responses obtained during the survey. In Kenya, 51% of the respondents were in the “early adopter” category, 32% were in the “late adopter category”, and the remaining 17% were in the “non-adopter” category. In Ethiopia, the number of respondents was in the same range across the three categories with 36%, 34%, and 30% in the “early adopter”, “late adopter”, and “non-adopter” categories, respectively. Comparing the two countries, in Kenya where the IPM strategy was initially piloted, the proportion of “non-adopters” is less than in Ethiopia, suggesting the importance of technology awareness in determining the farmers’ decisions to adopt the strategy.

3.1.2. Selected Socio-Economic Factors that Influence the Adoption

The definition and summary statistics of the variables used in the analysis are given in Table 2. Tests for differences of the variables across the three categories were conducted using ANOVA. Some variables were significantly different across the three potential fruit fly IPM adoption groups. Among the household characteristics, age, and gender of the household head and household size are distinguishable across the different adoption categories. Older age is associated with short-planning horizons and being more risk-averse [46]. In Kenya, age is significantly different, with non-adopters category having the oldest household heads, which makes them less willing to take up the new technology. Agreeing with existing literature, non-adopters in Ethiopia had more female heads, confirming the argument that women have less access to critical productive resources (land, labor, and credit), as well as information, in comparison with men, that limit them from accessing agricultural technologies [48]. In Ethiopia, early adopters had the largest household size compared to the other two categories of farmers. Large household size has been shown to be important in determining the adoption of innovations as it provides labor endowment needed for performing agricultural activities [50], such as mango production. Large household size, therefore, makes the early adopters better able to adopt the IPM practices, which may require additional farm effort.
With respect to household resources, we controlled for size of a mango orchard, livestock herd size in tropical livestock units (TLU), farm size, per capita expenditure, access to off-farm income, and credit constraint. Wealthier households are often viewed as better able to bear possible risks associated with the adoption of new farm innovations and can also finance the investment outlay required for the new technologies [46]. Size of mango orchard (or mango tree ownership), farm size, and per capita expenditure were defined as categorical variables (high, medium, and low) derived from the quantitative data collected from the mango growers. In Ethiopia, the “high” group of mango ownership was significantly different across the three categories of fruit fly IPM adoption, suggesting that the fruit fly IPM may not be a scale neutral technology [31]. The number of mango trees considered across the three classifications differed between the two study countries. In Ethiopia, the “small” group of mango ownership comprised respondents who had less than 11 mature mango trees, the “medium” group owned between 11 and 26 mature trees, while the “high” group owned over 26 mature trees. In Kenya on the hand, the small, medium, and high mango ownership groups had “less than 25”, “25–102”, and “over 102” mature trees respectively. Similarly to the size of a mango orchard, a bigger size of land has been shown to have a comparative advantage when it comes to the adoption of agricultural technologies, especially crop productivity-improving technologies [53,55]. The proportion of respondents in the “high” group of land ownership was significantly different across the three adoption categories in Ethiopia, with the early adopters reporting the highest respondents (30%) compared to the late adopters (29%) and non-adopters (14%). Income proxied in our study by per capita expenditure was significantly different among the “medium” and “high” groups in Ethiopia, with “non-adopters” having a bigger proportion of respondents compared to the other two categories in the “high” income group. This is in contrast with Kenya, where the category of “non-adopters” had fewer respondents than in the “medium” and “high” groups of income (per capita expenditure). The literature on the effect of income on adoption decisions of new technology shows indeterminate findings. Households with higher income may be better able to adopt technologies since they can finance investments but may also divert their time and effort away from agricultural activities, reducing investments in new technologies [46,52]. Similar arguments can be attached to access to off-farm income, which is significantly different across the three categories of farmers in Kenya, with late adopters reporting the highest proportion (53%) of households who had access to off-farm income. Credit constrained variable defined in this study as 1 if a household needed credit but was unable to get and zero otherwise [51,52], may influence agricultural technology adoption decisions. The proportion of credit-constrained mango growers was also significantly different across the three adoption categories in Kenya, with “late adopters” reporting the biggest proportion of credit-constrained farmers.
Although the results show that the three categories of farmers are not distinguishable in terms of market and institutional information access, knowledge and perception, and social capital and network variables, they have been shown to be important in determining agricultural adoption decisions. For instance, better access to the output market may provide easy access to the technology, and disposal of the produce to the buyers, but may also influence the availability of information and support institutions, such as credit institutions, as well as the opportunity cost of labor [47,55]. Government extension services and training remain important in agricultural technology adoption in Africa [48]. On the other hand, farmers’ knowledge and perceptions regarding a production constraint and the attributes of the technologies that respond to such constraints have been shown to influence adoption decisions of such technologies [34,39,54]. Besides, with inadequate sources of information and imperfect rural markets, social networks facilitate the exchange of information, enable farmers to access inputs, and overcome credit constraints [56,57,58], and also reduce transaction costs and increase farmers’ bargaining power, enabling them to acquire and invest high earning innovations and earn higher returns when marketing their products [46,57,58,59].

3.2. Empirical Results and Discussion

3.2.1. Determinants of the Potential Adoption of Fruit Fly IPM

In this section, we test the hypothesis that the independent variables affect the potential IPM adoption pattern. The multinomial logit regressions are estimated with the maximum likelihood estimation procedure from STATA. Explanatory variables used in the model are defined earlier in Table 2. The coefficients measure the change of being in one adoption versus another. We compare the “early” and “late” adopters versus “non-adopters” (Columns (1), (2), (4), and (5)), but also “early” versus “late” adopters in Columns (3) and (6). The latter comparison is mostly ignored in binary adoption models, where both categories are considered together and compared to the non-adopters. A positive coefficient implies that the explanatory variable increases the probability of being one adoption category versus being in the other as listed across the top of Table 3.
With respect to household characteristics, age decreases the probability of being an early and late adopter relative to the non-adopters in Kenya. Similar findings were found for the adoption of sustainable agricultural practices in rural Ethiopia [52]. This is comparable to Ethiopia, but only between late adopters and non-adopters. However, age increases the probability of being an early adopter relative to a late adopter, again confirming the reverse expectation of age of the household head in relation to uptake of agricultural technologies, where a farmer has accumulated capital to facilitate investments in innovations [60]. Having a male household head increases the probability of being an early adopter in Kenya, and a late adopter in Ethiopia, relative to non-adopters. The probability of early adopters versus non-adopters increases with the level of education. Similarly, Shiferaw et al. [61] found that education had a positive influence on the adoption of improved wheat varieties in Ethiopia. Educated farmers may be more aware of the benefits of new technologies and greater ability to interpret new information and search for suitable technologies that address their production constraints [31,47].
The probability of being an early adopter increased with the size of the mango orchard (over 26 mature trees) in Ethiopia relative to late adopters. Households with bigger plots of a farm enterprise, with commercial orientation, are likely to invest in technologies that enhance the quality of their supply by ensuring they have less pesticide residues, at more cost-effective control measures, and subsequently, increase their farm returns, as observed by Korir et al. [31] in their study on fruit fly IPM adoption in Kenya, and Heltberg and Tarp. [49] in their study on agricultural supply response in Mozambique. Consistent with our priori expectation, in Kenya, the probability of being an early adopter of the fruit fly IPM increases with tropical livestock units relative to non-adopter. Crop and livestock production are common farming practices in developing countries, where livestock serve as a source of manure and draft power for crop production, but also a source of capital to finance new technologies. A positive correlation between livestock ownership and IPM adoption decisions is therefore plausible. In Ethiopia, ownership of medium or high farm size increases the probability of being an early or late fruit fly IPM adopter relative to non-adopters. This corroborates with finding by Shiferaw et al. [61] in Ethiopia, who found farm size to be correlated with the probability of adopting improved wheat varieties. This suggests that farmers with larger farm sizes have the incentive to increase their farm returns by adopting innovations such as fruit fly IPM technology. In the same country, while a household with medium income levels is likely to be early or late adopters relative to non-adopters, the probability of being in those two categories decreases as income level moves to a high level. Our priori expectation of this variable was indeterminant, implying that income may affect technology adoption in either direction. Consistent with earlier studies on agricultural technology adoption (e.g., Heltberg and Tarp. [49] and Muriithi et al. [62]), access to off-farm income decreases the probability of being an early adopter relative to late adopters in Kenya. Farmers with alternative sources of income may divert their time and labor away from agricultural activities, and therefore reducing their probability of investing in modern agricultural technologies [52].
In terms of access to market and institutional information, we find that the probability of being an early or late adopter increases with decrease in distance to the extension officer in Ethiopia. The finding suggests that government extension services in Ethiopia provide an essential channel for disseminating production and marketing information among the rural households and can, therefore, be exploited in promoting new technologies such as fruit fly IPM. This is also confirmed by the positive coefficients of the confidence in government extension variable for the early and late adopters relative to non-adopters, which is consistent with the findings of Kassie et al. [53] and Muriithi et al. [62] in their studies on the adoption of sustainable agricultural practices in Ethiopia and Kenya, respectively.
The results show that mango growers’ perceptions and knowledge of fruit fly infestation symptoms in Ethiopia increased the probability of being a late adopter relative to non-adopters. However, in contrast with our expectation, the probability of being an early adopter of fruit fly IPM decreased with this variable relative to late adopters. This suggests that farmers with better knowledge of the pest may also wait until others have tried the technology on their farms, and confirmed its effectiveness, before trying it out. This highlights the need for field trials to enhance farmers’ confidence in new technologies and subsequently try them on their farms. In Ethiopia, the probability of being an early adopter increased with farmers’ awareness about the negative effects of pesticides relative to the non-adopters. This corroborates with the finding by Schreinemachers et al. [63] and Flor et al. [64] in South Asia, who found that awareness and use of non-pesticide practices reduced pesticide use among leaf mustard and yard-long bean farmers in Laos, Cambodia, and Vietnam. The results also uncover that the awareness of the IPM technology may enhance its adoption, as shown by a significant coefficient of this variable between late adopters and non-adopters in Kenya. Similar results were found for olive production IPM in Iran [65]. The importance of intrinsic factors such as the knowledge, perceptions, and attitudes of individuals in the adoption of new agricultural technologies have also been alluded to by Meijer et al. [66] in their review on uptake of agricultural and agroforestry innovations among smallholders in sub-Saharan Africa.
With respect to social capital and networks, the probability of being an early adopter of the fruit IPM technology increases with the number of people that can be relied on in critical needs in Ethiopia. In developing countries where credit and information access are limited due to imperfect markets, such networks provide alternative sources of inputs, information, and capital for investing in innovation. Teklewold et al. [52] found a similar result in their study on the adoption of sustainable agricultural practices in Ethiopia. Similar to findings by Kassie et al. [46] and Di Falco and Bulte [67], we find that households with relatives in government positions are less likely to be early or late adopters relative to non-adopters in Ethiopia. The argument behind this finding is that such networks may reduce individual motivations to adopt new technology due to the insurance role provided by the network, as an alternative source of livelihood [46].
Generally, although we observe the most difference between non-adopters relative to the other two categories of adoption (early and late adoption), the results indicate there are significant differences between all the categories. This verifies the importance of including more than two adoption categories in ex ante and ex post adoption models. Ignoring the late adopters’ respondents, by aggregating them with early adopters may misstate the probabilities of adoption.

3.2.2. Marginal Effects

The size of the effect of the covariates estimated using MNL, on the dependent variable may be difficult to interpret. We calculate the marginal effect of changing their values on the probability of observing the outcome. The marginal effects are presented in Table 4. As an example, with respect to household characteristics, increase in age of the household head by one year reduced the probability of being an early adopter by 0.4% in Kenya and Ethiopia, but increased the probability of being a non-adopter by 0.5% and 0.3% in the two countries respectively. Being a male in Ethiopia decreased the probability of being a non-adopter by 13% but increased the probability of being a late adopter by 14%. The differential impact of bigger mango orchard on early adoption is noteworthy. Having a large mango orchard (“high’’ category) increases the probability of being an early adopter by 13%.

3.2.3. Forecasting Adoption

In the above analysis, we estimated Equations (5a) and (5b) to derive coefficients of the independent variables and test for their significant differences between the adoption categories. However, the MNL results can be used to examine how the explanatory variables affect the probability of being in each adoption category [34,39,44]. The predicted probabilities are estimated on different levels of explanatory variables, where only one variable is changed at a time. The baseline estimates are created using the mean values of the explanatory variables (as given in Table A1), then each variable is changed at a time. The results are provided in Table 5. The first row presents the predicted conditional probabilities for the mean values of the explanatory variables, while the rest of the rows presents the sensitivity analysis of adoption outcome when each of the explanatory variables is changed. In this study, we select variables that are most likely to change in the short run as a result of the on-going fruit fly IPM promotion and dissemination efforts. These include the size of mango orchard (the proportion of mango growers that are likely to become medium growers is increased to 75%), mango training (100% of the growers receive training), and perception indicators (know fruit fly infestation symptoms, aware about negative effects of pesticides, and aware about fruit fly IPM) (100%), while fruit fly severity and perceived pesticide effectiveness are assumed to decrease with IPM promotion and therefore reduced to 20%.
As shown in Table 5, in the short-run, training all mango growers, for example, increases the probability of being in the early adopter category to 40% in Ethiopia, while increasing knowledge on identification of fruit fly infestation also increases the probability of being in the early adopter category by 10%, with respect to the observed level (36%) (Table 1). In Kenya, a significant marginal increase in the probability of being in the early adopter category increases with an increase in fruit fly IPM awareness, size of mango orchard (proportion of households the medium category of mango ownership), and reduced pesticide effectiveness perception. These results are consistent with findings by Gautam et al. [10] in their study on the impact of training vegetable farmers in Bangladesh in IPM. The authors find that IPM trained farmers had better knowledge on the identification of insect pests, proper use of pesticides, adopted more IPM practices, and reduced the frequency of spraying and mixing different pesticides, suggesting they were better aware of the negative effects of synthetic chemicals. Investing in farmer training can change crop protection from chemically dependent, to more sustainable practices such as IPM [68]. In addition to training farmers on the use and benefits of different IPM practices, farmers are made aware of correct identification of the pest and associated symptoms, as well as negative effects related to the use of synthetic pesticides [10].
Although increasing the size of mango orchard seems to be a favorable option to increasing probability of IPM adoption, the adoption rates may speedily reach a plateau as shown by the small proportion of probability of being an early adopter if we increase the proportion of farmers in the medium ownership group for both Kenya and Ethiopia. As noted, Kassie et al. [53] land scarcity may limit the expansion of cultivated land, but instead, induce agricultural intensification through the adoption of productivity-enhancing practices such as fruit fly IPM.
Considering the base adoption levels, the results generally show that in the short run, the projects’ promotion and upscaling efforts may impact positively in adoption probabilities in both countries, with higher adoption rates and prospects for adoption growth in Kenya compared to Ethiopia. This is plausible as greater IPM promotion efforts have been made in Kenya, while in Ethiopia, the technology is still at the introduction phase.

4. Conclusions and Implications

The objective of this paper was to estimate the probability of adoption of the fruit fly IPM strategy for suppression of fruit flies as a time-dependent process and to understand the determinates of the separate adoption categories. Considering the timing of the adoption decisions, is an important contribution to existing IPM adoption literature, as it provides useful insights on the expected diffusion pathway of the technology that could be important for designing policies and dissemination strategies for enhanced adoption. We classified the farmers as “early adopters”, “late adopters”, and “non-adopters” based on the respondent’s willingness to pay for the strategy and how fast they planned to use it. Results from both the descriptive and multinomial models show significant differences between all the three categories of respondents. This is an important implication since ignoring the late adopters’ category, by aggregating the respondents with early adopters, as done in binomial adoption models, would over or understate the probabilities of fruit fly IPM adoption.
A second contribution to this research is to test the hypothesis on the mango producers’ characteristics. In Kenya, factors which significantly increase the probability of early adoption include; younger age of household heads, highest education in the households, male head, livestock ownership, and mango training; while in Ethiopia, the probability of being in this category increases with farm size, medium per capita expenditure, closeness to the extension office, mango training, and awareness of the negative effects of pesticides. These findings are consistent with most literature on the adoption of agricultural innovations and other sustainable agricultural practices. Policy effort can enhance early adoption by focusing on mango training and increasing awareness of the negative use of synthetic pesticides.
Some of the factors that significantly increase the probability of late adopters are like those of the early adopters. However, credit constraint and access to off-farm income increase the probability of being a late adopter relative to an earlier adopter in Kenya, while the age of the household head, awareness of negative effects of pesticides, and number of people that can be relied on in critical needs decreases the probability in Ethiopia. These characteristics reflect more risk-averse behavior of late adopters in comparison with early adopters.
The probability of not using the fruit fly IPM strategy increase with the age of household head, high per capita expenditure, longer distance to the extension office, and having relatives in government positions. High per capita expenditure and having relatives in government positions reflect access to alternative sources of livelihood that would demotivate households from investing in new technologies for higher income. Age, however, indicates greater risk aversion and loss of energy to invest in new technologies.
Our forecasting results also provide important highlights to the IPM literature and the African fruit fly program. In the short-term, fruit fly IPM technology dissemination efforts should focus on increasing awareness of the technology, pesticide use implications, and perceived fruit fly severity to enhance the early adoption of the technology. Wider awareness of the technology can be done through mass media but also improved direct contacts with farmers through farmer field schools, demonstration/learning sites, trainers of trainers, among other channels. Some of these channels have been widely adopted in Kenya but can be enhanced to reach a wider audience. Fruit fly IPM adoption growth in Ethiopia seems to be slow but could also upsurge gradually in the short run, especially through mango training and increasing knowledge on fruit fly infestation symptoms. Mango farmers in Ethiopia could also reap vast benefits from the technology if they expanded their orchards.
While this study provides useful insights on time-dependent adoption decisions of the fruit fly IPM strategy promoted by icipe and partners, the results may not be broadly generalized due to expected heterogeneity among regions and across time and therefore impact on decision making patterns across different farming communities. We recommend further studies to explore adoption decision patterns utilizing panel data sets and focus on different cultures where the technology is being promoted in sub-Saharan Africa.

Author Contributions

S.E., and S.A.M., B.W.M., and G.M.D. conceptualized the study and wrote the project proposal. B.W.M., G.M.D., and N.G.G., designed and conducted the household survey and analyzed the data. All co-authors contributed to writing the manuscript. All authors have read and agreed to the published version of the manuscript.

Funding

This research was funded by the European Union (Grant number DCI-FOOD/2014/346-739): The Integrated Biological Applied Research Programme (IBCARP), and the Biovision Foundation Switzerland (Grant number PH-07/2016-2018). The article processing charge (APC) was funded by icipe core funding provided by the UK Aid from the UK Government, the Swedish International Development Cooperation Agency (Sida), the Swiss Agency for Development and Cooperation (SDC), the Federal Democratic Republic of Ethiopia, and the Kenyan Government. The funding bodies have no role in the design of the study and collection, analysis, and interpretation of data and in writing the manuscript. The views and opinions expressed in this publication are those of the authors and do not necessarily reflect those of icipe or the donors.

Acknowledgments

The authors are grateful for the useful comments from the participants of the 6th African Conference of Agricultural Economists (6thACAE) at Abuja, Nigeria, where an earlier version of this paper was presented.

Conflicts of Interest

The authors declare that they have no conflict of interest.

Appendix A

Table A1. Mean values of farm household, social capital, and village level characteristics of sample households from Kenya and Ethiopia.
Kenya N = 508 Ethiopia = 348
Mean SDMeanSD
Household characteristics
Age of household head57.81711.99356.16114.032
Gender of head (0 = Female, 1 = Male)0.9070.2910.7330.443
Household size (adult equivalent)2.5510.8283.0490.961
Highest education in households 11.8862.9859.8533.302
Credit constrained (1 = Yes 0 = No)0.0880.2840.1780.383
Household resources
Number of mango producing trees
Medium0.5400.4990.4800.500
High0.2470.4320.2500.434
Livestock owned in TLU2.5162.2462.3222.311
Total farm size (hectare)
Medium0.5400.4990.5000.501
High0.2510.4340.2500.434
Per capita expenditure (USD/year)
Medium0.5020.5000.4970.501
High0.2510.4340.2530.435
Have access to off-farm income 0.4550.4980.3790.486
Access to market and institutional information
Distance to output market (walking minutes)60.69459.95632.55234.809
Distance to extension office (walking minutes)78.45557.32312.30710.212
Attended mango training 0.7420.4380.3100.463
Perceptions
Know fruit fly infestation symptoms 0.8300.376
Aware about negative effects of pesticides 0.6010.490
Perceived pesticide effectiveness 0.7040.4570.4540.499
Aware about fruit fly IPM0.9030.2960.7960.404
Fruit fly severity 0.5930.4920.8160.388
Social capital and networks
Mango group membership 0.1890.392
Confidence in government extension 0.6030.490
Number of people that can be relied on in critical needs 4.5635.753
Have relatives in government positions 0.4340.496
Location dummies
Miraba Abaya 0.1210.326
Meru0.2510.434
Machakos 0.2540.436
Makuenni 0.2210.416

References

  1. Weinberger, K.; Lumpkin, T.A. Diversification into Horticulture and Poverty Reduction: A Research Agenda. World Dev. 2007, 35, 1464–1480. [Google Scholar] [CrossRef]
  2. Billah, M.; Afreh-Nuamah, K.; Obeng-Ofori, D.; Nyarko, G. Review of the pest status, economic impact, and management of fruit-infesting flies (Diptera: Tephritidae) in Africa. Afr. J. Agric. Res. 2015, 10, 1488–1498. [Google Scholar]
  3. World Bank. Agriuclture for Development; World Bank: Washington, DC, USA, 2008. [Google Scholar]
  4. FAO Food and Agriculture Organization of the United Nations (2010): Production and Trade 2010. Available online: http://www.fao.org/ (accessed on 11 July 2019).
  5. Vayssières, J.F.; Goergen, G.; Lokossou, O.; Dossa, P.; Akponon, C. A new Bactrocera species in Benin among mango fruit fly (Diptera: Tephritidae) species. Fruits 2005, 60, 371–377. [Google Scholar] [CrossRef] [Green Version]
  6. Ekesi, S. Field infestation and suppression of the invasive fruit fly Bactrocera invadens (Drew, Tsuruta and White) on citrus in Kenya. Acta Hortic. 2015, 1065, 1019–1026. [Google Scholar] [CrossRef]
  7. Ekesi, S.; Mohamed, S.; Tanga, C.M. Comparison of Food-Based Attractants for Bactrocera invadens (Diptera: Tephritidae) and Evaluation of Mazoferm–Spinosad Bait Spray for Field Suppression in Mango. J. Econ. Entomol. 2014, 107, 299–309. [Google Scholar] [CrossRef] [PubMed] [Green Version]
  8. Ekesi, S.; Nderitu, P.; Rwomushana, I. Field infestation, life history and demographic parameters of the fruit fly Bactrocera invadens (Diptera: Tephritidae) in Africa. Bull. Entomol. Res. 2006, 96, 379–386. [Google Scholar]
  9. Lux, S.; Ekesi, S.; Dimbi, S.; Mohamed, S.; Billah, M. Mango-Infesting Fruit Flies in Africa: Perspectives and Limitations of Biological. In Biological control in IPM systems in Africa; CAB International: Wallingford, UK, 2003; pp. 277–293. [Google Scholar]
  10. Gautam, S.; Schreinemachers, P.; Uddin, M.N.; Srinivasan, R. Impact of training vegetable farmers in Bangladesh in integrated pest management (IPM). Crop Prot. 2017, 102, 161–169. [Google Scholar] [CrossRef]
  11. Vontas, J.; Hernández-Crespo, P.; Margaritopoulos, J.T.; Ortego, F.; Feng, H.T.; Mathiopoulos, K.D.; Hsu, J.C. Insecticide resistance in Tephritid flies. Pestic. Biochem. Physiol. 2011, 100, 199–205. [Google Scholar] [CrossRef]
  12. Macharia, I.N.; Mithöfer, M.; Waibel, H. Potential environmental impacts of pesticides use in the vegetable sub-sector in Kenya. Afr. J. Hortic. Sci. 2009, 2, 138–151. [Google Scholar]
  13. Norton, G.W.; Rajotte, E.G.; Gapud, V. Participatory research in integrated pest management: Lessons from the IPM CRSP. Agric. Hum. Values 1999, 16, 431–439. [Google Scholar] [CrossRef]
  14. Baral, K.; Roy, B.C.; Rahim, K.M.B.; Chatterjee, H. Socio-Economic Parameters of Pesticide Use and Assessment of Impact of an IPM Strategy for the Control of Eggplant Fruit and Shoot Borer in West Bengal, India; AVRDC: Tashkent, Uzbekistan, 2006; ISBN 92-9058-147-6. [Google Scholar]
  15. Singh, A.; Vasishtb, A.; Kumara, R.; Dasc, D. Adoption of integrated pest management practices in paddy and cotton: A Case study in Haryana and Punjab. Agric. Econ. Res. Rev. 2008, 21, 221–226. [Google Scholar]
  16. Dasgupta, S.; Meisner, C.; Wheeler, D. Is environmentally friendly agriculture less profitable for farmers? Evidence on integrated pest management in Bangladesh. Appl. Econ. Perspect. Policy 2007, 29, 103–118. [Google Scholar] [CrossRef]
  17. Garming, H.; Waibel, H. Pesticides and farmer health in Nicaragua: A willingness-to-pay approach to evaluation. Eur. J. Health Econ. 2009, 10, 125–133. [Google Scholar] [CrossRef]
  18. Verghese, A.; Sreedevi, K.; Nagaraju, D. Pre and post-harvest IPM for the mango fruit fly, Bactrocera dorsalis (Hendel). In Proceedings of the 7th International Symposium on Fruit Flies of Economic Importance, Salvador, Brazil, 10–15 September 2006; pp. 179–182. [Google Scholar]
  19. Maumbe, B.; Swinton, S. Why do smallholder cotton growers in Zimbabwe adopt IPM. The Role of Pesticide-Related Health Risks and Technology Awareness. In Proceedings of the 2000 Annual Meeting of the American Agricultural Economics Association, Tampa, FL, USA, 30 July–2 August 2000. [Google Scholar]
  20. Isoto, R.E.; Kraybill, D.S.; Erbaugh, M.J. Impact of integrated pest management technologies on farm revenues of rural households: The case of smallholder Arabica coffee farmers. Afr. J. Agric. Resour. Econ. 2008, 9, 119–131. [Google Scholar]
  21. Coombes, C.; Hill, M.; Moore, S.; Dames, J.; Fullard, T. Persistence and virulence of promising entomopathogenic fungal isolates for use in citrus orchards in South Africa. Biocontrol Sci. Technol. 2013, 23, 1053–1066. [Google Scholar] [CrossRef]
  22. Ekesi, S.; Billah, M.K. A Field Guide to the Management of Economically Important Tephritid Fruit Flies in Africa, 2nd ed.; ICIPE Science Press: Nairobi, Kenya, 2007; ISBN 92 9064 209. [Google Scholar]
  23. Ekesi, S.; De Meyer, M.; Malacrida, A. Taxonomy, Bioecology, and Management of Native and Exotic Fruit Fly Species in Africa. Annu. Rev. Entomol. 2015, 61, 219–238. [Google Scholar] [CrossRef]
  24. Muriithi, B.W.; Affognon, H.D.; Diiro, G.M.; Kingori, S.W.; Tanga, C.M.; Nderitu, P.W.; Mohamed, S.A.; Ekesi, S. Impact assessment of Integrated Pest Management (IPM) strategy for suppression of mango-infesting fruit flies in Kenya. Crop Prot. 2016, 81, 20–29. [Google Scholar] [CrossRef] [Green Version]
  25. Kibira, M.; Affognon, H.; Njehia, B.; Muriithi, B.; Ekesi, S. Economic Evaluation of Integrated Management of Fruit Fly in Mango Production in Embu County, Kenya. Afr. J. Agric. Resour. Manag. 2015, 10, 343–353. [Google Scholar]
  26. Ekesi, S.; Chabi-Olaye, A.; Subramanian, S.; Borgemeister, C.; Wesonga, J.; Kahane, R. Horticultural Pest Management and the African Economy: Successes, Challenges and Opportunities in a Changing Global Environment. Acta. Hortic. 2011, 911, 165–184. [Google Scholar] [CrossRef]
  27. Mohamed, S.; Ekesi, S.; Hanna, R. Evaluation of the impact of Diachasmimorpha longicaudata on Bactrocera invadens and five African fruit fly species. J. Appl. Entomol. 2008, 132, 789–797. [Google Scholar] [CrossRef]
  28. Ekesi, S.; Mohamed, S.A.; De Meyer, M. Fruit Fly Research and Development in Africa-towards a Sustainable Management Strategy to Improve Horticulture; Springer International Publishing: Cham, Switzerland, 2016; ISBN 3-319-43226-5. [Google Scholar]
  29. Lux, S.A.; Copeland, R.S.; White, I.M.; Manrakhan, A.; Billah, M.K. A New Invasive Fruit Fly Species from the Bactrocera dorsalis (Hendel) Group Detected in East Africa. Insect Sci. Appl. 2003, 23, 355–361. [Google Scholar] [CrossRef]
  30. Muriithi, B.W.; Diiro, G.M.; Affognon, H.; Ekesi, S. Economic Impact of Integrated Pest Management Strategies for the Suppression of Mango-Infesting Fruit Fly Species in Africa. In Fruit Fly Research and Development in Africa—Towards a Sustainable Management Strategy to Improve Horticulture; Ekesi, S., Mohamed, S.A., De Meyer, M., Eds.; Springer International Publishing: Cham, Switzerland, 2016; pp. 755–770. ISBN 978-3-319-43226-7. [Google Scholar]
  31. Korir, J.K.; Affognon, H.D.; Ritho, C.N.; Kingori, W.S.; Irungu, P.; Mohamed, S.A.; Ekesi, S. Grower adoption of an integrated pest management package for management of mango-infesting fruit flies (Diptera: Tephritidae) in Embu, Kenya. Int. J. Trop. Insect Sci. 2015, 35, 80–89. [Google Scholar] [CrossRef]
  32. Midingoyi, S.G.; Kassie, M.; Muriithi, B.; Diiro, G.; Ekesi, S. Do Farmers and the Environment Benefit from Adopting Integrated Pest Management Practices? Evidence from Kenya. J. Agric. Econ. 2019, 70, 452–470. [Google Scholar] [CrossRef]
  33. Griliches, Z. Hybrid corn: An exploration in the economics of technological change. Econom. J. Econom. Soc. 1957, 25, 501–522. [Google Scholar] [CrossRef] [Green Version]
  34. Zepeda, L. Predicting bovine somatotropin use by California dairy farmers. West. J. Agric. Econ. 1990, 15, 55–62. [Google Scholar]
  35. Feder, G.; Just, R.E.; Zilberman, D. Adoption of Agricultural Innovations in Developing Countries: A Survey. Econ. Dev. Cult. Chang. 1985, 33, 255–298. [Google Scholar] [CrossRef] [Green Version]
  36. Kinnucan, H.; Hatch, U.; Molnar, J.J.; Venkateswaran, M. Scale neutrality of bovine somatotropin: Ex ante evidence from the Southeast. J. Agric. Appl. Econ. 1990, 22, 1–12. [Google Scholar] [CrossRef] [Green Version]
  37. Lesser, W.; Bernard, J.; Billah, K. Methodologies for ex ante projections of adoption rates for agbiotech products: Lessons learned from rBST. Agribusiness 1999, 15, 149–162. [Google Scholar] [CrossRef]
  38. Lesser, W.; Magrath, W.; Kalter, R. Projecting Adoption Rates: Application of an” Ex Ante” Procedure to Biotechnology Products. North Cent. J. Agric. Econ. 1986, 159–174. [Google Scholar] [CrossRef]
  39. Barham, B.L. Adoption of a politicized technology: bST and Wisconsin dairy farmers. Am. J. Agric. Econ. 1996, 78, 1056–1063. [Google Scholar] [CrossRef]
  40. Kolady, D.; Lesser, W. Adoption of genetically modified eggplant in India: An ex ante analysis. In Proceedings of the American Agricultural Economic Association Annual Meeting, Rhode Island, UK, 24–27 July 2005. [Google Scholar]
  41. Atanu, S.; Love, H.A.; Schwart, R. Adoption of emerging technologies under output uncertainty. Am. J. Agric. Econ. 1994, 76, 836–846. [Google Scholar]
  42. Nyangena, W. The role of social capital in sustainable development: An analysis of soil conservation in rural Kenya. In Agricultural Investment and Productivity: Building Sustainability in East Africa; RFF Press: Washington, DC, USA, 2011; pp. 31–50. [Google Scholar]
  43. McFadden, D. Econometric analysis of qualitative response models. Handb. Econom. 1984, 2, 1395–1457. [Google Scholar]
  44. Wooldridge, J.M. Econometric Analysis of Cross Section and Panel Data; MIT press: Cambridge, MA, USA, 2010; ISBN 0-262-29679-9. [Google Scholar]
  45. Greene, W.H. Econometric Analysis, 6th ed.; Pearson: New York, NY, USA, 2008; ISBN 978-0-13-513245-6. [Google Scholar]
  46. Kassie, M.; Jaleta, M.; Shiferaw, B.; Mmbando, F.; Mekuria, M. Adoption of interrelated sustainable agricultural practices in smallholder systems: Evidence from rural Tanzania. Technol. Forecast. Soc. Chang. 2013, 80, 525–540. [Google Scholar] [CrossRef]
  47. Pender, J.; Alemu, D. Determinants of Smallholder Commercialization of Food Crops: Theory and Evidence from Ethiopia; EPTD & MTID; IFPRI: Washington, DC, USA, 2007. [Google Scholar]
  48. Quisumbing, A.R.; Pandolfelli, L. Promising approaches to address the needs of poor female farmers: Resources, constraints, and interventions. World Dev. 2010, 38, 581–592. [Google Scholar] [CrossRef]
  49. Heltberg, R.; Tarp, F. Agricultural supply response and poverty in Mozambique. Food Policy 2002, 27, 103–124. [Google Scholar] [CrossRef] [Green Version]
  50. Von Braun, J.; Kennedy, E. Agricultural Commercialization, Economic Development, and Nutrition; IFPRI: Washington, DC, USA, 1994. [Google Scholar]
  51. Feder, G.; Lau, L.J.; Lin, J.Y.; Luo, X. The relationship between credit and productivity in Chinese agriculture: A microeconomic model of disequilibrium. Am. J. Agric. Econ. 1990, 72, 1151–1157. [Google Scholar] [CrossRef]
  52. Teklewold, H.; Kassie, M.; Shiferaw, B. Adoption of multiple sustainable agricultural practices in rural Ethiopia. J. Agric. Econ. 2013, 64, 597–623. [Google Scholar] [CrossRef]
  53. Kassie, M.; Teklewold, H.; Jaleta, M.; Marenya, P.; Erenstein, O. Understanding the adoption of a portfolio of sustainable intensification practices in eastern and southern Africa. Land Use Policy 2015, 42, 400–411. [Google Scholar] [CrossRef]
  54. Li, J.; Gómez, M.I.; Rickard, B.J.; Skinner, M. Factors Influencing Adoption of Integrated Pest Management in Northeast Greenhouse and Nursery Production. Agric. Resour. Econ. Rev. 2013, 42, 310. [Google Scholar] [CrossRef]
  55. Wollni, M.; Lee, D.R.; Thies, J.E. Conservation agriculture, organic marketing, and collective action in the Honduran hillsides. Agric. Econ. 2010, 41, 373–384. [Google Scholar] [CrossRef]
  56. Jayne, T.S.; Yamano, T.; Nyoro, J. Interlinked credit and farm intensification: Evidence from Kenya. Agric. Econ. 2004, 31, 209–218. [Google Scholar] [CrossRef]
  57. Barrett, C.B. Market Institutions in Sub-Saharan Africa: Theory and Evidence. Am. J. Agric. Econ. 2005, 87, 1089–1090. [Google Scholar] [CrossRef]
  58. Lee, D.R. Agricultural sustainability and technology adoption: Issues and policies for developing countries. Am. J. Agric. Econ. 2005, 87, 1325–1334. [Google Scholar] [CrossRef]
  59. Neill, S.P.; Lee, D.R. Explaining the adoption and disadoption of sustainable agriculture: The case of cover crops in northern Honduras. Econ. Dev. Cult. Chang. 2001, 49, 793–820. [Google Scholar] [CrossRef] [Green Version]
  60. Kassie, M.; Shiferaw, B.; Muricho, G. Adoption, and Impact of Improved Groundnut Varieties on Rural Poverty: Evidence from RURAL UGANDA; Environmental Development Discussion Paper; Resources for the Future RFF: Washington, DC, USA, 2010. [Google Scholar]
  61. Shiferaw, B.; Kassie, M.; Jaleta, M.; Yirga, C. Adoption of improved wheat varieties and impacts on household food security in Ethiopia. Food Policy 2014, 44, 272–284. [Google Scholar] [CrossRef]
  62. Muriithi, B.W.; Menale, K.; Diiro, G.; Muricho, G. Does gender matter in the adoption of push-pull pest management and other sustainable agricultural practices? Evidence from Western Kenya. Food Secur. 2018, 10, 253–272. [Google Scholar] [CrossRef]
  63. Schreinemachers, P.; Chen, H.; Nguyen, T.T.L.; Buntong, B.; Bouapao, L.; Gautam, S.; Le, N.T.; Pinn, T.; Vilaysone, P.; Srinivasan, R. Too much to handle? Pesticide dependence of smallholder vegetable farmers in Southeast Asia. Sci. Total Environ. 2017, 593, 470–477. [Google Scholar] [CrossRef]
  64. Flor, R.J.; Chhay, K.; Sorn, V.; Maat, H.; Hadi, B.A.R. The technological trajectory of Integrated Pest Management for rice in Cambodia. Sustainability 2018, 10, 1732. [Google Scholar] [CrossRef] [Green Version]
  65. Allahyari, M.S.; Damalas, C.A.; Ebadattalab, M. Farmers’ technical knowledge about integrated pest management (IPM) in olive production. Agriculture 2017, 7, 101. [Google Scholar] [CrossRef] [Green Version]
  66. Meijer, S.S.; Catacutan, D.; Ajayi, O.C.; Sileshi, G.W.; Nieuwenhuis, M. The role of knowledge, attitudes, and perceptions in the uptake of agricultural and agroforestry innovations among smallholder farmers in sub-Saharan Africa. Int. J. Agric. Sustain. 2015, 13, 40–54. [Google Scholar] [CrossRef]
  67. Di Falco, S.; Bulte, E. The Impact of Kinship Networks on the Adoption of Risk-Mitigating Strategies in Ethiopia. World Dev. 2013, 43, 100–110. [Google Scholar] [CrossRef]
  68. Van den Berg, H.; Jiggins, J. Investing in Farmers—The Impacts of Farmer Field Schools in Relation to Integrated Pest Management. World Dev. 2007, 35, 663–686. [Google Scholar] [CrossRef]
Figure 1. Study areas and sample households’ distribution in Kenya and Ethiopia.
Agriculture 10 00278 g001
Table 1. Potential adoption patterns of fruit fly Integrated Pest Management (IPM) by mango growers in Ethiopia and Kenya.
KenyaEthiopia
n%n%
Non-adopters 861710430
Early adopters 2615112736
Late adopters 1613211734
Total 508 348
Table 2. Comparison of farm household, social capital, and village level characteristics of sample households across different potential fruit fly IPM adoption status.
KenyaEthiopia
Non-Adopters (n = 86)Early Adopters (n = 261)Late Adopters (n = 161)F-TestNon-Adopters (n = 104)Early Adopters (n = 127)Late Adopters (n = 117)F-Test
Mean SDMean SDMean SD Mean SDMean SDMean SD
Household characteristics
Age of household head (years)61.80212.50456.95811.75857.05011.8935.81 ***56.56714.63657.59113.82654.24813.6041.800
Gender of head (0 = Female, 1 = Male)0.8600.3490.9200.2730.8940.3081.340.5960.4930.7800.4160.8030.3997.400 ***
Household size (adult equivalent)2.5210.9562.5320.7962.6830.8531.832.8180.9083.1790.9703.1150.9674.520 **
Highest education in the households (years)11.5353.22012.1462.84011.8073.0261.599.3853.32510.1103.3849.9913.1751.540
Household resources
Number of mango producing trees
Medium (dummy)0.5930.4940.5250.5000.5470.4990.610.5100.5020.4330.4970.5040.5020.880
High (dummy)0.2090.4090.2640.4420.2550.4370.520.1830.3880.3390.4750.2140.4124.400 **
Livestock owned in Tropical Livestock Units (TLU)2.1601.7712.7472.3742.5742.4522.091.9901.9602.6252.6112.2872.2272.190
Total farm size (hectare)
Medium (dummy)0.1980.4010.2840.4520.2480.4331.9700.4710.5020.5430.5000.4790.5020.750
High dummy)0.6400.4830.5170.5010.5400.5001.3000.1440.3530.2990.4600.2910.4564.510 **
Per capita expenditure (USD/year)
Medium (dummy)0.2910.4570.3100.4640.4160.4943.07 **0.3080.4640.5980.4920.5560.49911.490 ***
High (dummy)0.3140.4670.3680.4830.2610.4402.64 *0.4040.4930.1890.3930.1880.3929.350 ***
Credit constrained (1 = Yes, 0 = No)0.0930.2920.0380.1920.1680.37510.71 ***0.1250.3320.1890.3930.2140.4121.560
Have access to off-farm income (1 = Yes, 0 = No)0.4190.4960.4370.4970.5340.5002.350 *0.3850.4890.4090.4940.3420.4760.600
Access to market and institutional information
Distance to output market (walking minutes)51.86038.92258.01558.39363.65853.0871.40033.20228.43234.44137.79029.92336.6660.540
Distance to extension office (walking minutes)71.82654.98873.70153.78784.40460.8482.214.78810.51111.88210.06010.5649.7565.000
Attended mango training (1 = Yes, 0 = No)0.7330.4450.7470.4350.7020.4590.5200.2880.4550.3860.4890.2480.4342.900
Confidence in government extension (1 = Have confidence, 0 = Otherwise) 0.4520.5000.6300.4850.7090.4568.230
Perceptions
Know fruit fly infestation symptoms (1 = Know at least 2 symptoms, 0 = Otherwise) 0.8170.3880.7560.4310.9230.2686.300
Aware of negative effects of pesticides (1 = Aware, 0 = Otherwise) 0.5190.5020.8110.3930.4440.49921.270
Perceived pesticide effectiveness (1 = Effective, 0 = Otherwise)0.6860.4670.6550.4760.7270.4471.180.3850.4890.5120.5020.4530.5001.870
Aware about fruit fly IPM (1 = Aware, 0 = Otherwise)0.8840.3220.8770.3290.9190.2730.940.7020.4600.8820.3240.7860.4125.900
Fruit fly severity (1 = Severe, 0 = Otherwise)0.5580.5000.6050.4900.5280.5011.260.7690.4230.8270.3800.8460.3621.160
Social capital and networks
Mango group membership (1 = Yes, 0 = No)0.1740.3820.1610.3680.2170.4141.08
Number of people that can be relied on in critical needs (number) 4.2504.5535.2527.6574.0944.0091.460
Have relatives in government positions (1 = Yes, 0 = No) 0.5190.5020.4410.4980.3500.4793.250
Locations dummies
Miraba Abaya 0.1630.3720.0870.2820.1200.3301.59
Meru 0.2210.4170.2180.4140.2360.4260.09
Machakos 0.2560.4390.2800.4500.2170.4141.01
Makueni 0.2330.4250.2610.4400.2480.4330.14
Meru0.2210.4170.2180.4140.2360.4260.09
Source: Household survey 2016; * p < 0.1; ** p < 0.05; *** p < 0.01.
Table 3. Multinomial logit analysis of potential fruit fly IPM adoption in Kenya and Ethiopia.
KenyaEthiopia
Early Adopters vs. Non-Adopters
(1)
Late Adopters vs. Non-Adopters
(2)
Early Adopters vs. Late Adopters
(3)
Early Adopters vs. Non-Adopters
(4)
Late Adopters vs. Non-Adopters
(5)
Early Adopter vs. Late Adopter
(6)
Households characteristics
Age of household head−0.041−0.038−0.003−0.005−0.0270.022
(0.013) *** (0.014) *** (0.010)(0.012)(0.012) ** (0.011) **
Gender of head (1 = Female 0 = Male)0.7030.280.4240.5661.094−0.528
(0.409) * (0.443)(0.395)(0.395)(0.379) *** (0.367)
Household size (adult equivalent)−0.197−0.04−0.1580.191−0.0960.286
(0.190)(0.201)(0.151)(0.220)(0.214)(0.215)
Highest education in the households 0.0820.0210.0610.0140.036−0.023
(0.045) * (0.052)(0.044)(0.050)(0.052)(0.053)
Credit constrained (1 = Yes 0 = No)−0.7260.811−1.5370.660.3970.263
(0.509)(0.458) * (0.398) *** (0.491)(0.445)(0.374)
Household resources
Number of mango producing trees
Medium −0.276−0.055−0.221−0.167−0.2660.099
(0.346)(0.367)(0.278)(0.402)(0.392)(0.378)
High 0.0170.22−0.2030.646 **−0.1240.771
(0.443)(0.467)(0.336)(0.446)(0.460)(0.438) *
Livestock owned in TLU0.1380.142−0.0030.102 *0.0040.098
(0.075) * (0.079) * (0.050)(0.085)(0.094)(0.064)
Total farm size (hectare)
Medium −0.361−0.4330.0720.7670.340.427
(0.391)(0.426)(0.292)(0.415) * (0.393)(0.413)
High−0.0020.051−0.0531.3131.2390.074
(0.494)(0.540)(0.367)(0.550) ** (0.541) ** (0.492)
Per capita expenditure (USD/year)
Medium 0.0560.456−0.3990.9240.944−0.02
(0.328)(0.348)(0.260)(0.437) ** (0.410) ** (0.375)
High −0.157−0.4350.279−0.839−0.9090.07
(0.346)(0.390)(0.299)(0.465) * (0.449) ** (0.483)
Have access to off-farm income −0.2290.408−0.637−0.046−0.1670.121
(0.297)(0.318)(0.246) *** (0.327)(0.327)(0.314)
Access to market and institutional information
Distance to output market (walking minutes) 0.0030.004−0.0010.003−0.0050.008
(0.003)(0.003)(0.002)(0.004)(0.005)(0.005)
Distance to extension office (walking minutes) 0.0000.003−0.003−0.042−0.0450.003
(0.002)−0.003(0.002)(0.020) ** (0.020) ** (0.018)
Attended mango training 0.059−0.4630.5210.6470.0680.578
(0.301)(0.326)(0.272) * (0.378) * (0.400)(0.372)
Confidence in government extension 0.4870.837−0.351
Perceptions (0.355)(0.354) ** (0.366)
Know fruit fly infestation symptoms −0.6260.986−1.613
(0.457)(0.542) * (0.524) ***
Aware about negative effects of pesticides 1.7120.2521.46
(0.376) *** (0.352)(0.335) ***
Perceived pesticide effectiveness −0.0790.175−0.254−0.0660.13−0.196
(0.290)(0.320)(0.246)(0.372)(0.363)(0.344)
Aware about fruit fly IPM0.2270.914−0.687−0.139−0.310.171
(0.443)(0.540) * (0.421)(0.669)(0.616)(0.682)
Fruit fly severity 0.140.070.070.037−0.2180.255
(0.270)(0.298)(0.233)(0.434)(0.476)(0.471)
Social capital and networks
Mango group membership −0.0370.297−0.335
(0.374)(0.402)(0.299)
Number of people that can be relied on in critical needs 0.038−0.0280.066
(0.041)(0.031)(0.033) **
Have relatives in government positions −0.997−0.897−0.1
(0.377) *** (0.374) ** −0.316
Mirab Abaya −0.130.103−0.233
(0.588)(0.579)(0.593)
Meru 0.09−0.1010.191
(0.384)(0.408)(0.312)
Makueni 0.215−0.5350.75
(0.376)(0.406)(0.309) **
Machakos 0.067−0.3820.449
(0.433)(0.459)(0.345)
Constant 2.1091.1250.984−2.0960.489−2.586
(1.266) * (1.371)(0.976)(1.306)(1.283)(1.294) **
Number of observations 508 348
Wald chi2(46)/(50)73.99 *** 114.57 ***
Pseudo R20.080 0.2142
Log pseudolikelihood−470.82 −299.534
* p < 0.1; ** p < 0.05; *** p < 0.01.
Table 4. Average marginal effects on the probability of fruit fly IPM adoption in Kenya and Ethiopia.
KenyaEthiopia
Early Adopters Late Adopters Non-Adopters Early Adopters Late Adopters Non-Adopters
Households characteristics
Age of household head−0.004 *−0.0010.005 ***0.002−0.004 ***0.003 *
Gender of head (0 = Female, 1 = Male)0.119−0.047−0.072−0.0100.141 **−0.131 ***
Household size (adult equivalent)−0.0390.0210.0180.042-0.0420.000
Highest education in the households 0.016 *−0.008−0.008−0.0010.006−0.005
Household resources
Number of mango producing trees
Medium −0.0550.0290.0260.000−0.0280.029
High −0.0290.040−0.0110.129 **−0.083−0.047
Livestock owned in TLU0.0110.008−0.018 *0.017 *−0.010−0.007
Total farm size (hectare)
Medium −0.019−0.0320.0510.098−0.018−0.080
High−0.0080.010−0.0020.1020.086−0.188 ***
Per capita expenditure (USD/year)
Medium −0.0580.085 *−0.0270.0660.076−0.142
High 0.023−0.0590.036−0.056−0.0830.140 **
Credit constrained (1 = Yes 0 = No)−0.283 ***0.263 ***0.0190.073−0.005−0.069
Have access to off-farm income −0.111 **0.113 **−0.0010.009−0.0290.019
Access to market and institutional information
Distance to output market (walking minutes)0.0000.0000.0000.001−0.0010.000
Distance to extension office (walking minutes)0.0000.0010.000−0.003−0.0040.006 **
Attended mango training 0.080−0.099 **0.0180.102 *−0.061−0.041
Confidence in government extension 0.0030.103 *−0.105 **
Perceptions
Know fruit fly infestation symptoms −0.209 ***0.242 ***−0.033
Aware about negative effects of pesticides 0.272 ***−0.134 ***−0.138 ***
Perceived pesticide effectiveness −0.0430.046−0.002−0.0300.0160.014
Aware about fruit fly IPM−0.0810.145 *−0.0640.0250.029−0.054
Fruit fly severity 0.022-0.007−0.0150.027−0.0370.010
Social capital and networks
Mango group membership −0.0520.063−0.012
Number of people that can be relied on in critical needs 0.009−0.009 **0.000
Have relatives in government positions −0.085 *−0.0610.146 ***
Location fixed effects Yes Yes Yes −0.013
Note: dy/dx: The marginal effects are the percent change in probability for one percent change in independent variable * p < 0.1; ** p < 0.05; *** p < 0.01.
Table 5. Conditional probabilities of being in each fruit fly adoption category given changes in key variables that might affect adoption.
KenyaEthiopia
Early AdoptersLate AdoptersNon-Adopters Early AdoptersLate Adopters Non-Adopters
Mean values 0.5140.3170.1690.3650.3360.299
Mango training (100%)0.5070.3370.1560.3970.3430.260
Farmers with medium number of mango trees (75%)0.5300.3110.1590.3690.3580.273
Aware of fruit fly IPM (100%)0.5600.2600.1800.3590.3490.292
Fruit fly severity (20%)0.5260.3130.1600.3580.3740.268
Perceived pesticide effectiveness (20%)0.5370.3040.1600.3670.3610.273
Know fruit fly infestation symptoms (100%) 0.4560.2730.271
Aware of negative effects of pesticides (100%) 0.3440.3690.286

