1. Introduction
Soybean seed is the world’s primary source of plant protein. In temperate climate conditions soybean cultivation remains relatively inefficient [
1]. Therefore, yellow lupine seeds [
2,
3,
4] have become a promising alternative protein source. Cultivation can be carried out by pure sowing or by intercropping with other spring crop species.
Due to intercropping of lupine with other plants, the seed yield decreases; however, the protein yield is noticeably higher [
5]. For coexisting species, we distinguish different intercropping systems depending on the time of sowing and spatial placement [
6]. Cereals (wheat, barley, and oats) and legumes (yellow lupine, narrow leaf lupine, and peas) are grown mainly in mixed intercropping (MI), i.e., they are planted in the same rows.
As a consequence of MI, the optimization of fertilization techniques is considerably limited, and the implementation of herbicide control is not possible. Corn, along with other species, is grown by utilizing strip intercropping (SI), i.e., alternating strips of various species [
7,
8,
9,
10]. If strips of a single species are wide enough and adjusted to the technical capabilities of cultivating tools, it also becomes possible to optimize the cultivation practice for individual species.
In integrated conditions, particularly in organic production systems, the cultivation of cereals with legumes in mixtures is considered to be a suitable source of concentrated feed [
11,
12]. Intercropping also serves ecological functions: it increases biodiversity, positively affects the soil condition, and suppresses weed infestation [
13]. Therefore, the inability to optimize cultivation practice and difficulties regarding herbicide control should not constitute an obstacle or become a deterrent in MI implementation. Because of enhanced utilization of habitat capacity, MI crops are generally more stable in subsequent years as compared to pure crop yields of species used in MI [
14,
15,
16,
17,
18,
19]. Unfortunately, the co-occurrence of individual species may also contribute to unfavorable effects. The adverse effects vary considerably, and they are strictly dependent on weather conditions. As a consequence, varying qualities of yields are obtained in subsequent growing seasons regardless of the fact that the same agrotechnical assumptions are being implemented [
20], which, in turn, leads to difficulty in balancing feed resources [
21].
In the scientific literature, the subject of SI primarily relates to the cultivation of soybeans and corn [
22]. Available resources pertaining to SI of yellow lupine with other plant species are rather limited [
23]. It is known, however, that the yield of yellow lupine seeds in MI with oats is largely dependent on environmental factors. MI in low moisture soil conditions leads to competition between lupine and oats, and it shows to be asymmetric to the detriment of lupine. Consequently, MI results in a considerably smaller yield of yellow lupine [
24,
25]. Since the interaction between species occurs exclusively at the strips’ border, it has been ascertained that SI cultivation of yellow lupine with spring cereals can be justified. In SI, yellow lupine adversely responds to close proximity with oats and triticale [
23]. However, the response of yellow lupine in the proximity of other plant species (potential components for SI) remains undetermined. While taking into consideration the asymmetry of competition between various species, row separation with a technological path presents a viable option. Therein lies the advantage of SI over MI. Separating the species tends to diminish the competition effect and utilize the positive phenomenon of the border effect: namely, an increase in the yield of plants cultivated adjacent to an area devoid of vegetation [
26,
27].
The aim of our study was to determine the proximity effect of spring wheat, triticale, barley, and peas on yellow lupine cultivation and to estimate its yield in strip intercropping with the abovementioned plant species.
2. Materials and Methods
2.1. Experiment Site
The field trial was carried out between 2008 and 2010. The experiment was conducted at the Research Station of the Faculty of Agriculture and Biotechnology in Mochełek (53°13′ N; 17°51′ E) (
Figure 1). The results presented in this manuscript are part of previously published studies related to the proximity effect (PE) on other species [
28,
29,
30,
31]. Accordingly, the methodology presented in this experiment coincides with the cited studies.
The experiment was conducted on loam sand texture luvisol soil (LV) [
34]; the pre-crop was winter oil seed rape. Depending on the research year, the Corg content was 6.2–6.6 g·kg
−1 d.m. of soil, and the content of absorbable forms P and K was 63–69 and 94–172 mg·kg
−1 respectively, soil pH (1M KCl) was between 5.2–6.6.
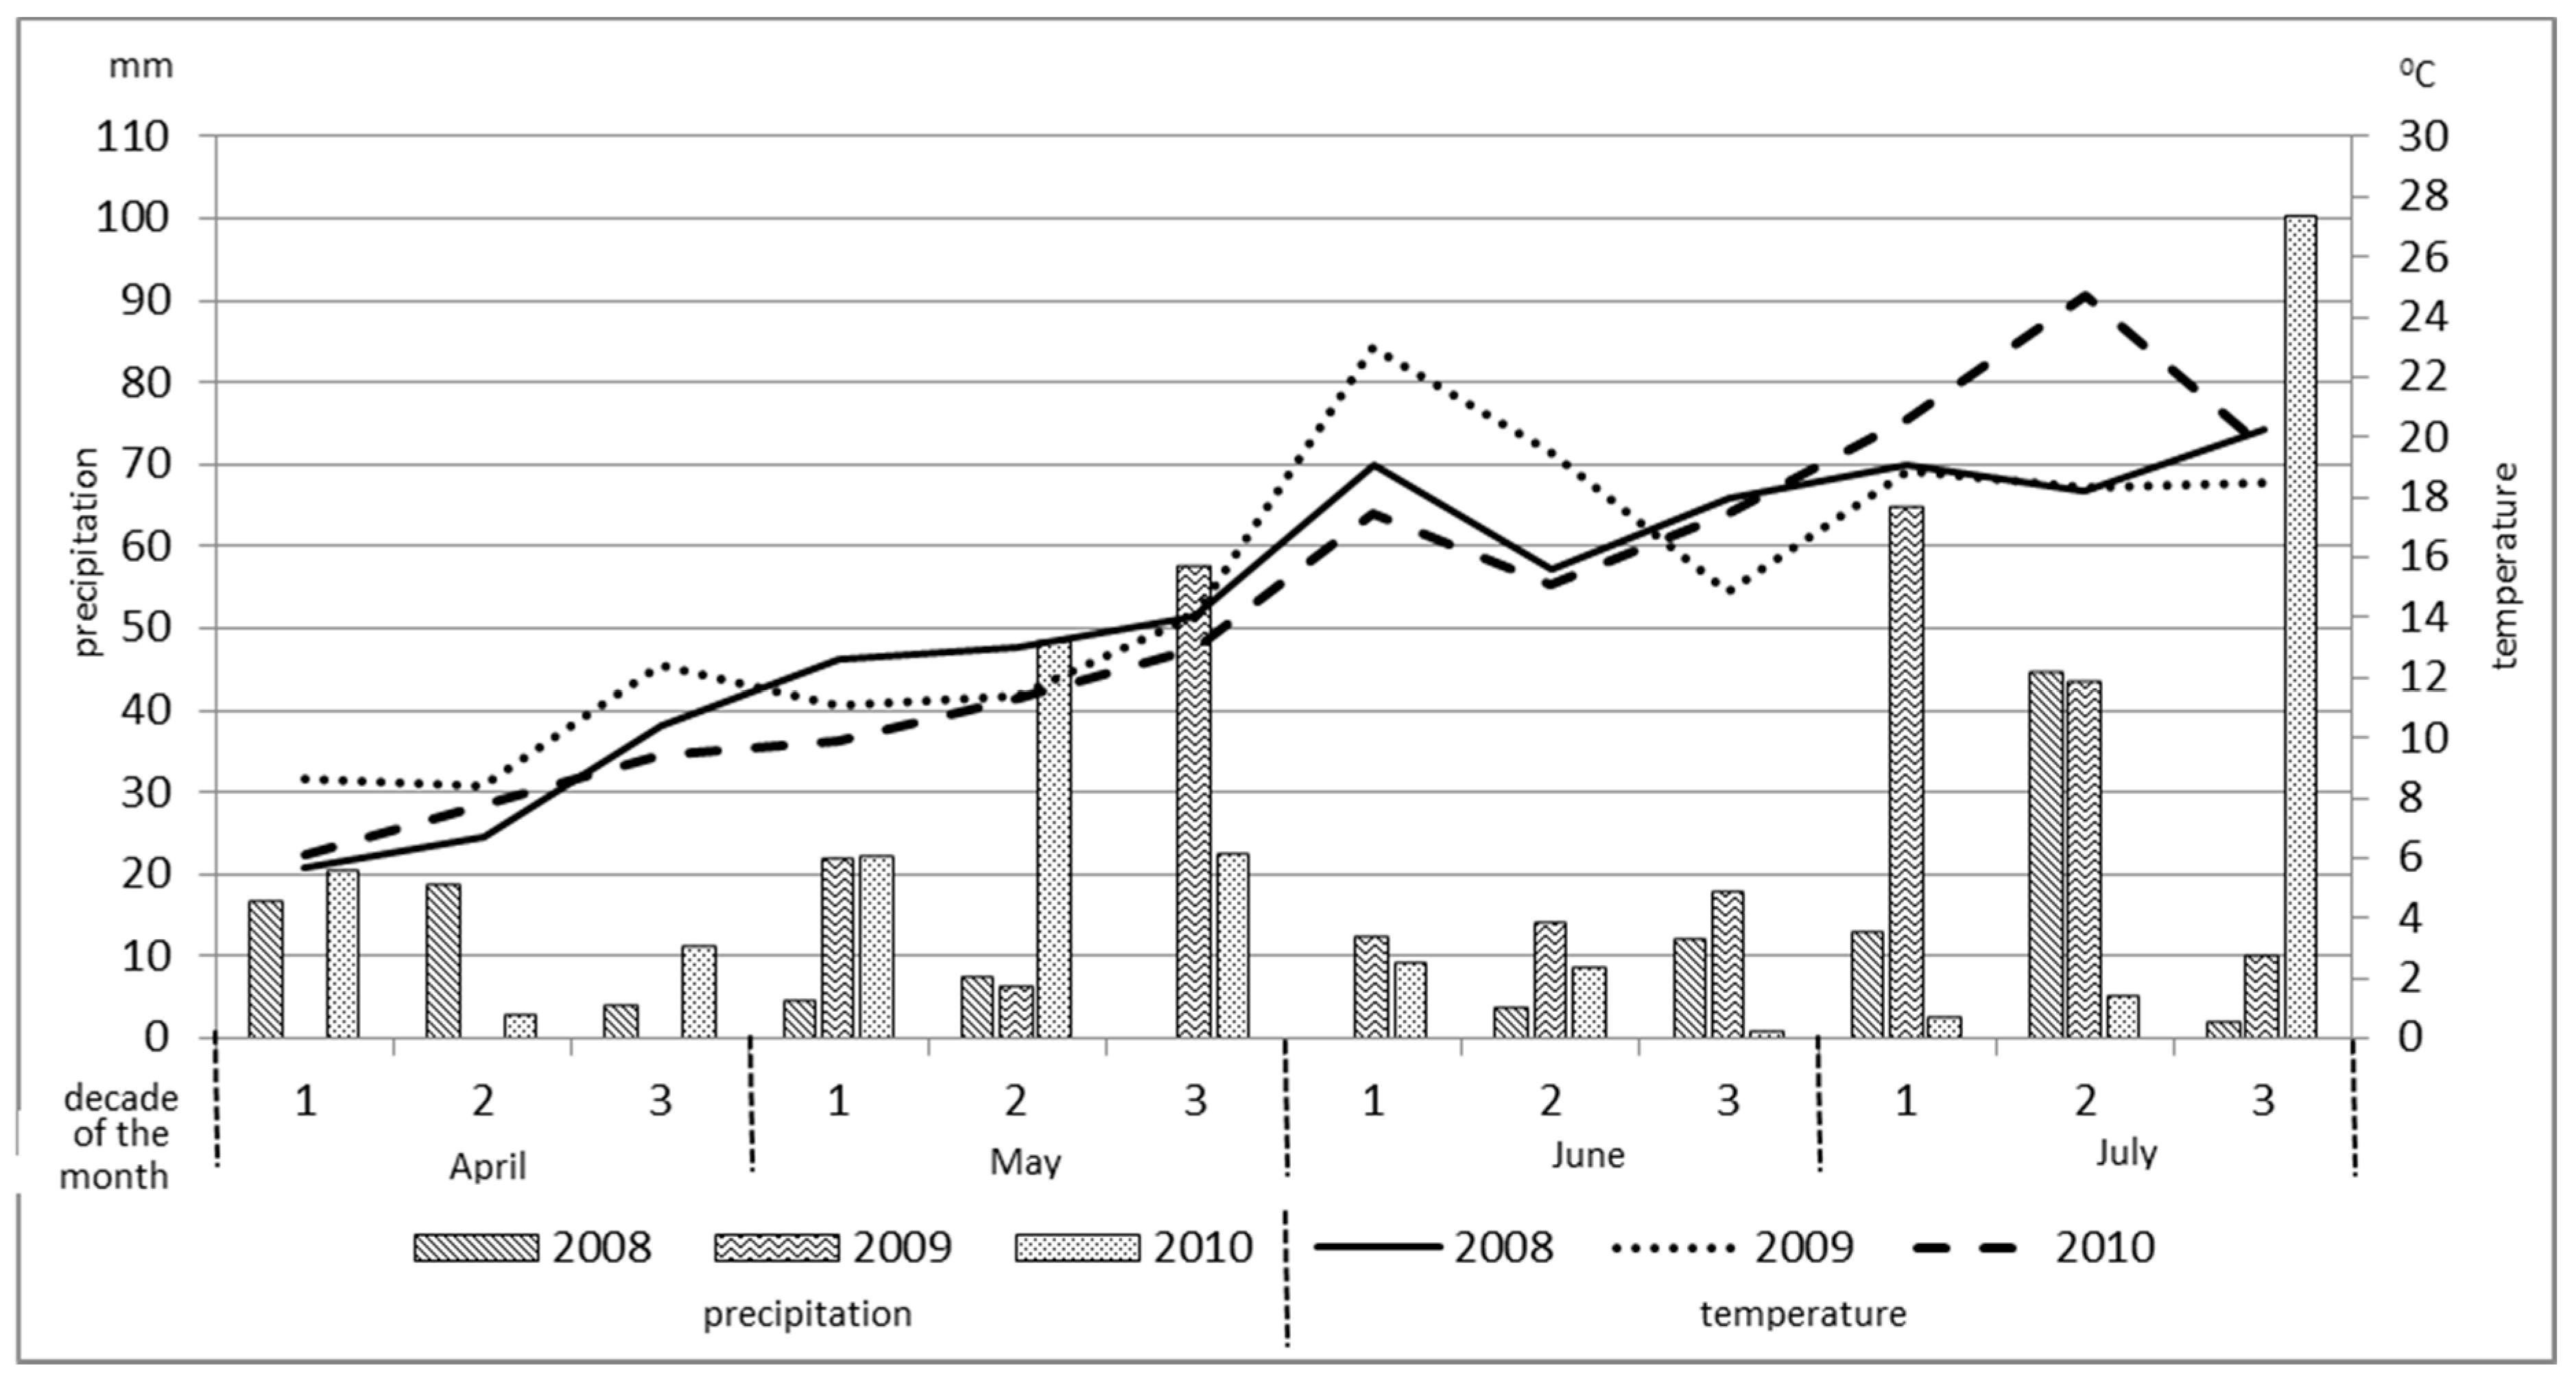
During the growing season, the temperature amplitude was similar for all three years of the conducted research (
Figure 2). In 2009, however, April and the first two decades of June were characterized by warmer temperatures as compared to the rest of the year. The year 2010 was marked by a much warmer July. Distribution of rainfall also varied significantly. Modest precipitation was observed from the third decade of April to the second decade of June of 2008. During this time period, in any of the decades, the rainfall did not exceed 10 mm. In 2010, rainfall not exceeding 10 mm per decade was reported between the first decade of June and the second decade of July.
2.2. Experiment Design
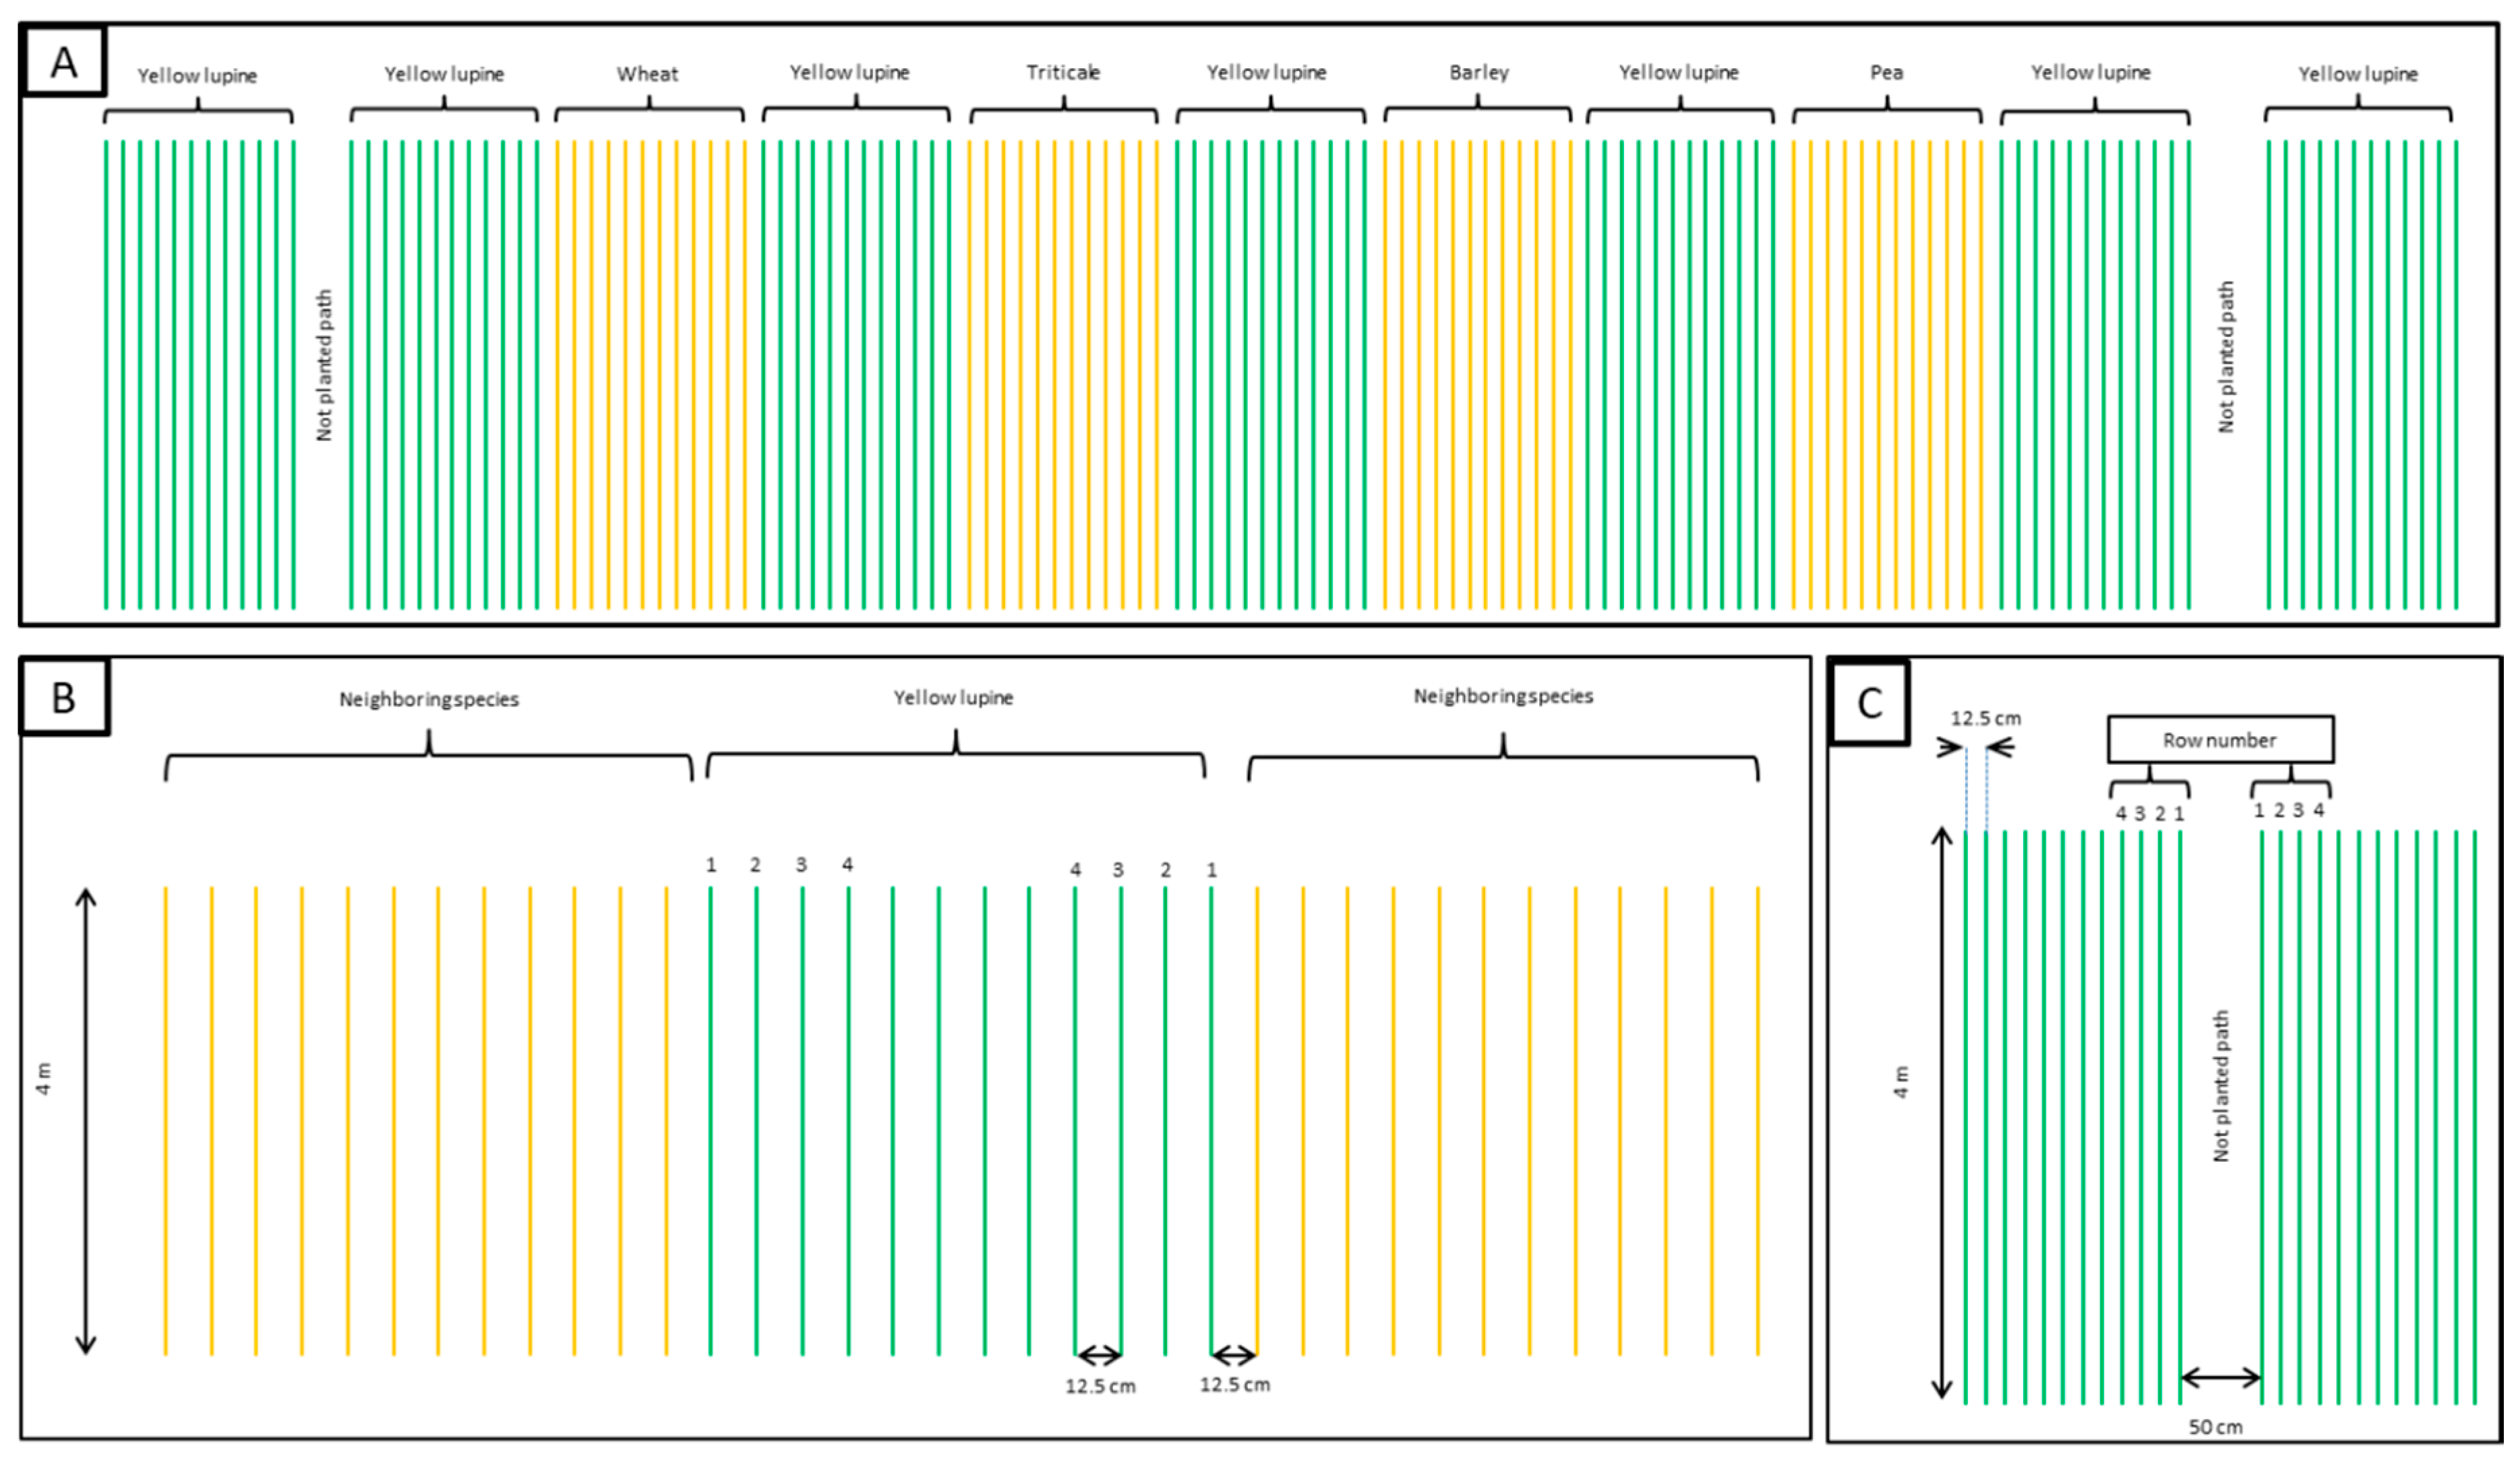
The source data come from a multiple 3-year field experiment. The layout of the experiment is demonstrated in
Figure 3. The plot was 150 cm wide and consisted of 12 rows of plants separated by 12.5 cm.
Figure 3A represents one of four replications (randomized complete blocks) with all the neighboring species of yellow lupine and their paths. The experimental treatment consisted of yellow lupine’s row layout (
Figure 3B), four rows of separation termed PE (proximity effect) in relation to the neighboring species (wheat, triticale, barley, and oat) or separated from an unplanted path referred to as BE (border effect) (
Figure 3C). The first adjacent row was located 12.5 cm from the first row of the neighboring species/path. The experimental plot consisted of successive plant rows each measuring four meters long. The mean result of each treatment of adjacent plants (from right and left sides of the plot) was considered as a single replication. Based on the results of previous studies [
23], the fourth plant row was no longer subjected to the influence of neighboring plants, representing the internal canopy (control). The orientation of the plots’ longer side was north-south.
2.3. Elements of Agrotechnical Practices
Each plant species was sown simultaneously between 25 March and 5 April. In order to ensure even spacing between each plant, the cereal seeds were precisely placed on a seeding belt made of blotting paper. Plant density was 45 pcs·m−1 (360 pcs·m−2). The seeding strips were placed in the soil at a depth of 4 cm. Seeds of lupine and peas were sown manually; planting density was 10 pcs·m−1 (80 pcs·m−2).
The following cultivars were planted: yellow lupine ‘Lidar’, spring wheat ‘Bombona’, spring triticale ‘Doublet’, spring barley ‘Antek’, and pea ‘Ramrod’.
Macro-nutrients were applied during the spring months: 30 kg P·ha−1, 66 kg K·ha−1 and 34 kg N·ha−1. In the phenological phase BBCH 22–25 (tillering stage), N fertilization (34 kg N·ha−1 dose) was used with cereals only. Herbicide active substance-linuron (Alfalon 450SC), at a dose of 1 dm3·ha−1 was applied to each crop.
2.4. Samples and Measurements
Harvest sampling from each row was conducted manually. The measurements of yellow lupine plants included:
Plant density (number of plants with no less than one pod with seeds in particular rows were considered)
Pod density (number of pods containing no less than one seed in particular rows were considered)
Pods per plant (from calculation: pod density/plant density)
Seed per pod (harvested pods were threshed and the number of seeds was determined)
Thousand-seed weight (TSW)
Straw weight (biomass without pods)
Biomass (straw weight + seed weight)
Seed weight (g per row)
Weight was recalculated for 1 m of the row.
2.5. Data Analysis
Single year data concerning all characteristics of yellow lupine in strip intercropping were calculated using one-way ANOVA in a four reps (block) model. The three-year synthesis of variance, based on statistic F (Fisher) in a mixed model, tested the null hypotheses regarding year as random effect and treatments (yellow lupine’s row neighboring to one of four species) as fixed effect (
Table 1). The post-hoc calculation according to HSD Tukey’s test (
p = 0.05) was used for the separation of means of yellow lupine traits. For data verification, the R core team software package was used.
Index of the proximity effect (IPE) was based on the results acquired from three rows closest to the neighboring species; IPE reflects the quotient of trait values for the given order and the fourth order.
where R
(1,2,3) is the seed weight of plants from 1st or 2nd or 3th row; and R
(4) is the seed weight of plants from the 4th row.
IPE = 1 implies neutrality of the tested species. IPE < 1 indicates a negative impact of the neighboring species on yellow lupine. IPE > 1 indicates positive influence of the neighboring species on yellow lupine. Index of the border effect (IBE) was calculated as well. In this instance, the yellow lupine plants were adjacent to a vegetation-free area and separated by a technological path or a path dividing the plots. The interpretations of the IBE and IPE values are the same.
The proposed predictive analysis is to adopt the results of the yield from this study to the practical utilization of yellow lupine in SI with various species. As the sowing is practiced by a 3-m-wide seed driller, we applied, in reference to yield estimation for each linear meter, 3-m-wide strips (24 rows), with a row spacing of 12.5 cm. Estimated yield (
Figure 4 and
Figure 5) was calculated based on the following formulas:
where
r1–4 represents the yield in the next row from the neighboring species.
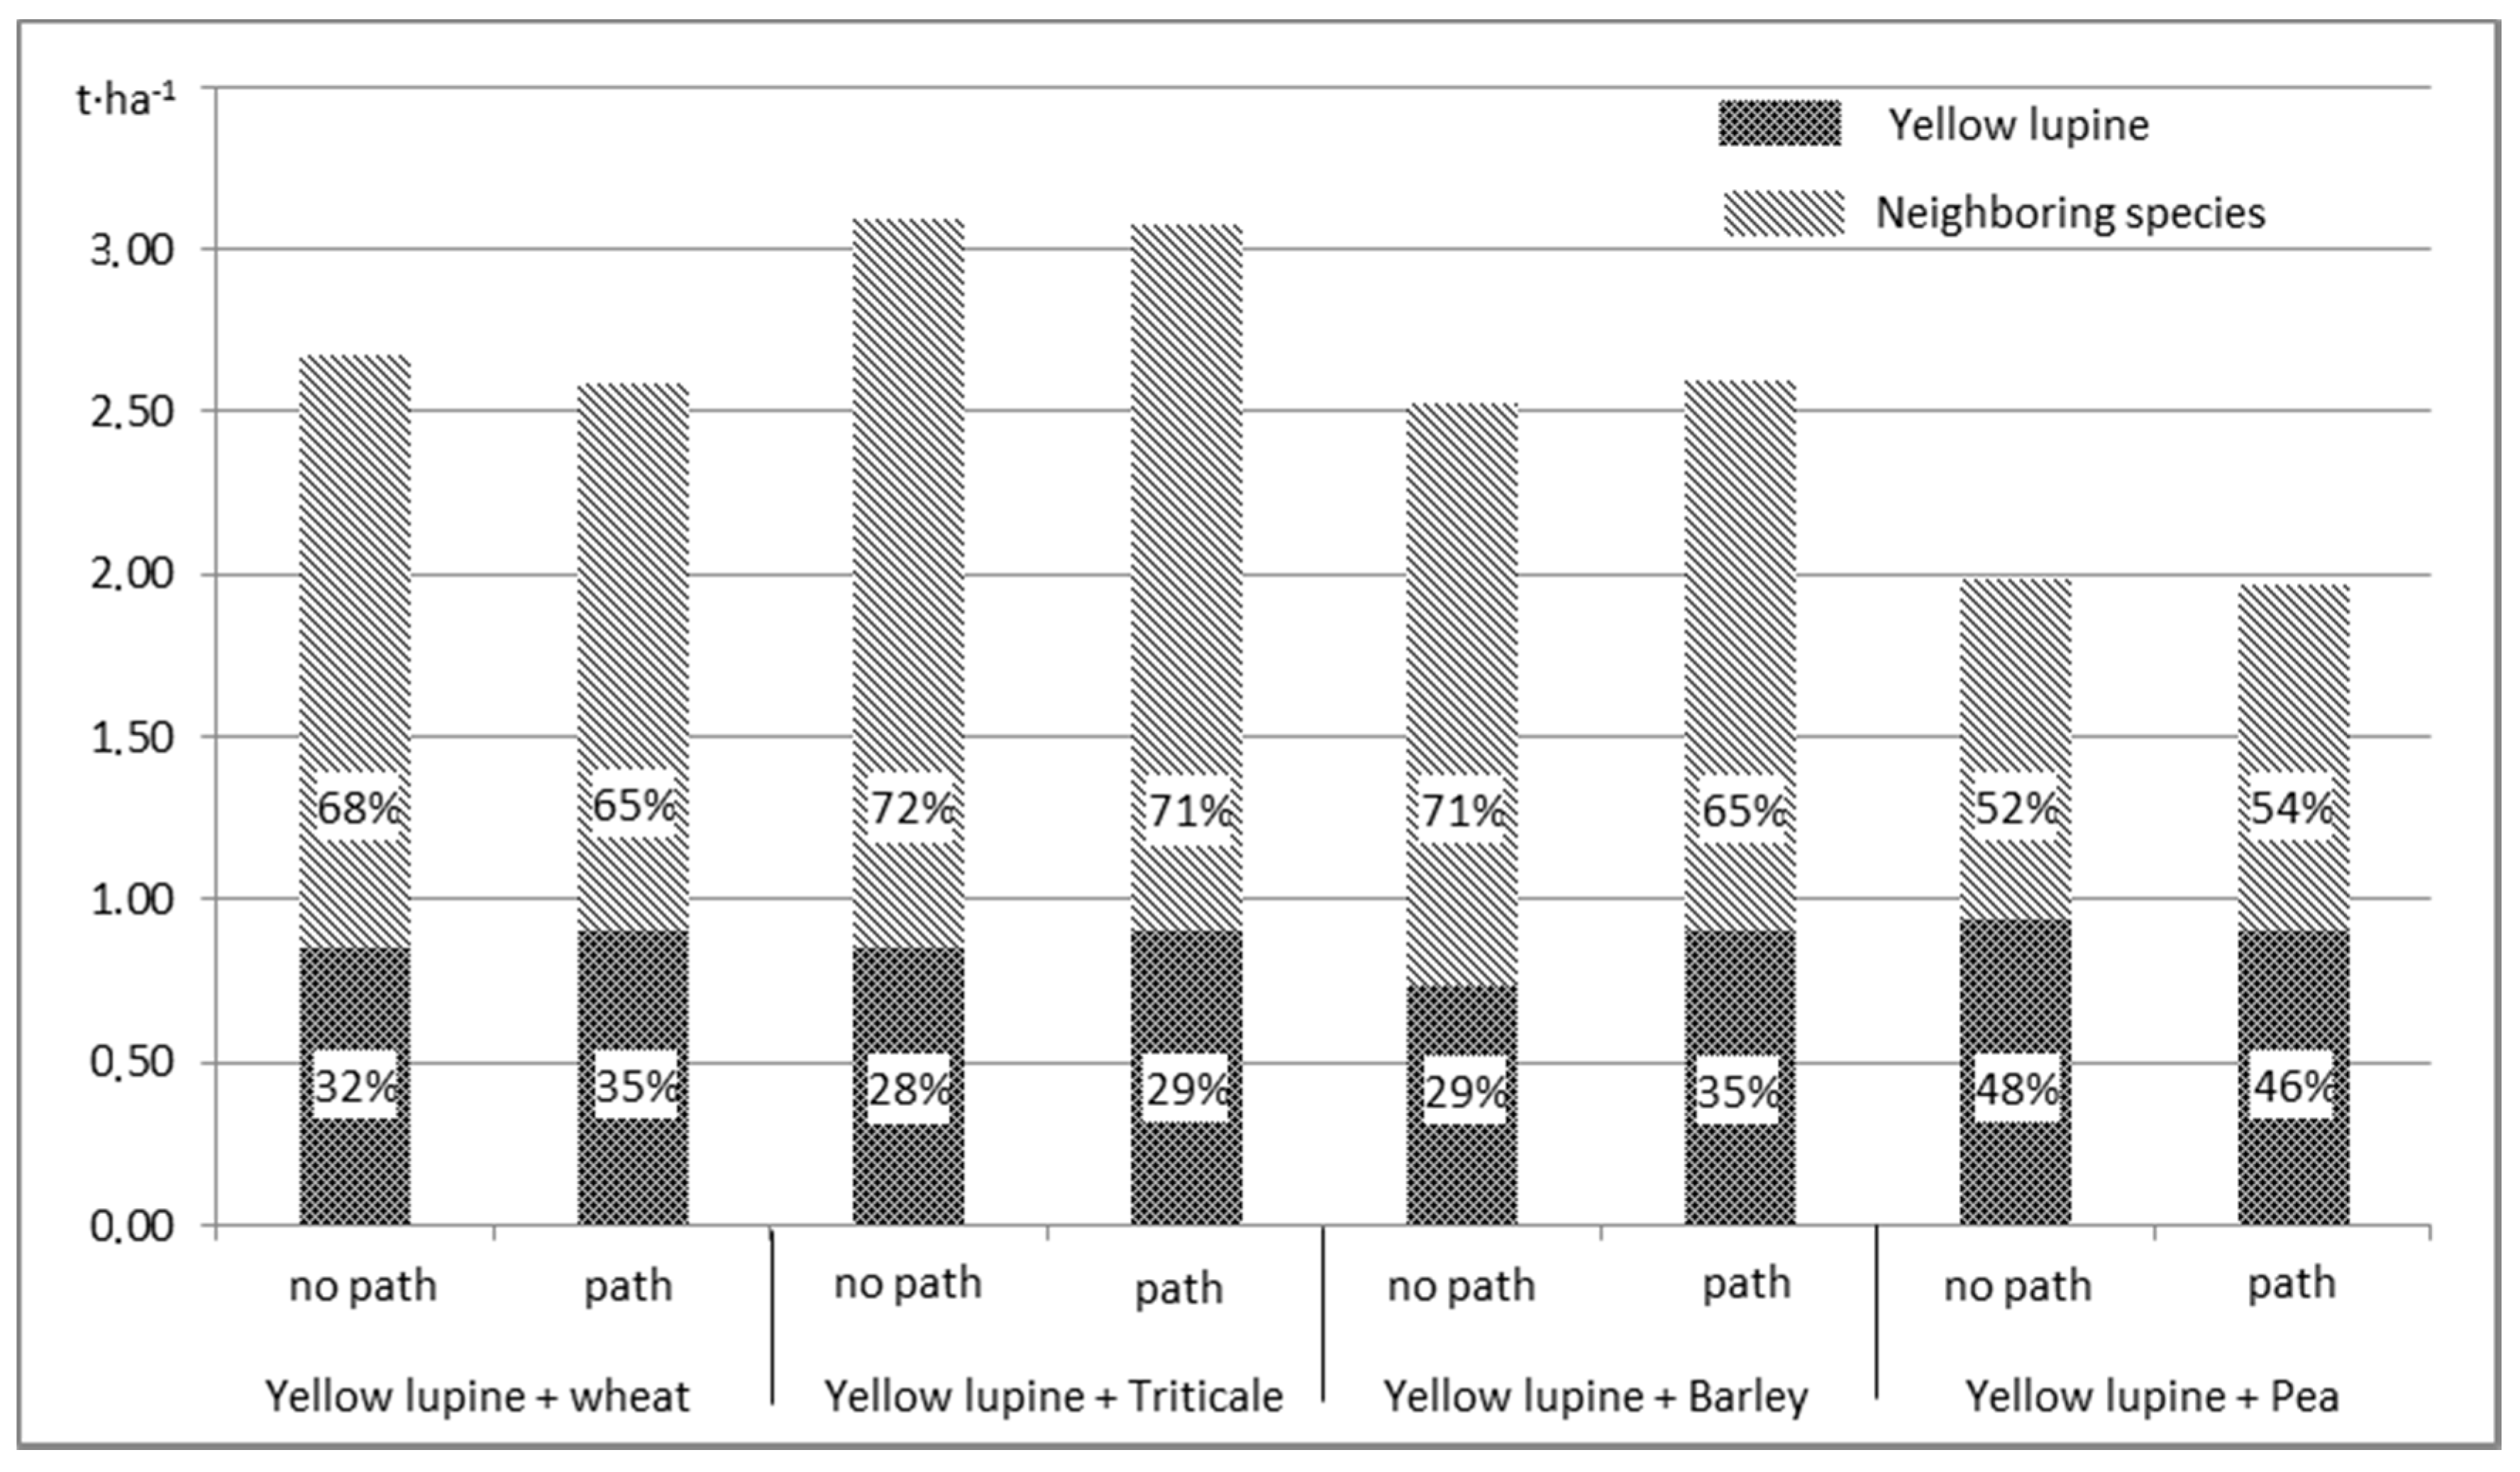
The total yield and yield structure of SI for two species in an area of one hectare were also estimated (
Figure 6). These crops were estimated considering the immediate vicinity of strips, and strips separated by a 50-cm-wide path. For estimates, 17 rows, each 3-m-wide were adopted for both species (34 rows in total). The above setup resulted in arable fields of 102 × 98 m for SI without paths and 114.75 × 87.1 m for SI with paths. Estimated cereal yields were based on the results from the same experiment that was already published in other articles [
28,
29,
30,
31].
3. Results
Straw, seed, and plant weight of yellow lupine was significantly affected by the PE of all tested species (
Table 1). Regarding the weight of plant and lupine seeds, the PE varied throughout the years, and its effect was manifested in all of the species. In the case of barley, the PE affected the density of plants and pods, as well as the lupine’s TSW. The PE of peas, in addition to having an effect on the previously mentioned weight of straw, seed, and the lupine plants’ weight, also affected the density of lupine’s plants and pods.
As evidenced by the IPE index values below one, wheat strip proximity proved to have an adverse effect on yellow lupine plants (
Table 2). The density of lupine plants increased significantly in rows furthest from wheat (up to the fourth row). In rows directly adjacent to the wheat strip, density of yellow lupine plants was 22.6% lower as compared to the fourth row. The density of pods also increased in rows that were located furthest from wheat, but the statistically confirmed effect was obtained for the first and second rows. In the immediate vicinity of wheat, i.e., in the first row, the pod density was 42.2% lower than in the fourth row. A negative PE was found in the first row only; it influenced the number of pods per plant, the amount of seeds in the pod, and TSW. The straw and lupine plants’ weight also increased proportionally to the distance from wheat; this effect was confirmed in the first and second rows. The IPE indicates that the negative effect of wheat on lupine was most evident in lupine’s weight (IPE = 0.55) and pod density (IPE = 0.58).
Similarly to wheat, the PE of triticale also proved to be unfavorable to yellow lupine. In rows 1, 2, and 3, for each of the characteristics, IPE values were less than one (
Table 3). For triticale, the IPE was comparable to the values obtained for wheat. In the successive rows, a tendency for values to increase manifested itself and was evident for all presented characteristics. With the exception of straw weight, statistically confirmed unfavorable PE was limited to the second row and its effect was present in all the characteristics. In the case of straw weight, an adverse effect of triticale’s neighboring presence was confirmed only in the first row. An unfavorable PE was least evident when taking into account the thousand-seed weight, which in the first row was 4.0% lower as compared to the fourth row. The proximity of the triticale strip resulted in the reduction of plant weight: the weight of the first row was 44.1% less than the weight of the fourth row.
The proximity of barley proved to have an adverse effect on yellow lupine (
Table 4). For each of the presented characteristics, the IPE values were less than one. Furthermore, they were considerably different from the values obtained from the previously described cereal species. With the exception of the number of pods, trends of increasing values in subsequent rows were noted for all presented characteristics. Regarding the number of pods, the PE of barley was not statistically confirmed, since it was only 1.1% less in the first row than in the fourth row. Considering the number of seeds in a pod, a negative PE of barley has not been confirmed, although the corresponding difference was much higher (18.4%).
The presence of a barley strip proved to have a negative influence on up to the third row of lupine plants. In comparison to other traits, plant density, pod density and biomass were affected the most. In the case of the thousand-seed weight and straw weight, the negative effects were evident up to the second row. As compared to other traits, plant biomass has been reduced the most. Between the first and fourth rows, the difference in plants’ weight reached 45.3%.
In instances where yellow lupine was grown in the proximity of peas, the IPE for particular traits generated significantly higher values as compared to previously described cereals. This signifies yellow lupine’s higher tolerance for neighboring peas as opposed to wheat, triticale or barley. However, IPE values for all considered traits did not exceed one (
Table 5). Consequently, it can be inferred that the PE of peas was unfavorable. The influence could not be confirmed in respect to the number of pods per plant, number of seeds in the pod, and TSW. For the remaining characteristics, the negative impact of PE was perceptible only in the first and second rows of lupine plants. As compared to the fourth row, the reduction in plants’ weight in the first row was most significant (32.1%).
Considering the productive characteristics of yellow lupine (
Table 2,
Table 3,
Table 4 and
Table 5), strip intercropping with other spring species turned out to be disadvantageous. In most cases, the values of the proximity effect were less than one. A different effect was obtained in the case of lupine plants adjacent to non-grown rows separated by paths (
Table 6). Generally, for each feature, an increase in its value was found in the first row (IBE = 1.06 for TSW; 1.59 for biomass) and this positive effect was noticeable up to the third row (IBE = 1.04 for TSW; 1.19 for straw weight). Only for the number of seeds in the pod did the commented tendency not receive statistical confirmation (IBE oscillated 1.05) (
Table 6).
A significant decrease in lupine seed yield in the first and second rows was confirmed in proximity to wheat, triticale, and peas (
Table 7). In the case of barley, a negative PE was also confirmed for the third row. The presence of neighboring cereals resulted in a lower yield of yellow lupine seeds in the first row in relation to the fourth row by 53.3% (for triticale) and 55.7% (for barley). A corresponding difference for peas was less significant and reached 36.1%. The border effect resulting from path proximity had a positive effect on seed yield. There was a 58.2% increase in yield in the first row, 23.2% in the second row, and 6.7% in the third row (IBE = 1.58, 1.23, and 1.07, respectively) (
Table 7).
4. Discussion
So far, the subject of strip intercropping of yellow lupine with other species has not been referenced in scientific literature. Consequently, it is not possible to compare the results presented in this manuscript with findings obtained by other researchers. However, the results regarding the PE of wheat, triticale, barley, and peas on yellow lupine were previously published [
28,
29,
30,
31]. They were based on an experiment conducted at the same location; similar methodology was also used to determine the effects of strip till on lupine, oats, and triticale [
23]. In the discussion, an analogy could be found in regard to the effect on yellow lupine plants grown in MI with other species. Since the cultivation pattern in SI is regular, and MI is characterized by random distribution of different species, the effects of cultivation in MI cannot be compared to those in SI. Hence, there are numerous formulas referencing interactions between different species in regard to the plants’ competitive patterns [
35], but their application in SI is rather limited.
It has been previously emphasized that yields obtained in MI are more stable in the following years as compared to pure sowing of the species that comprise them. This results from more efficient use of environmental conditions, since one of the most important factors leading to a negative impact on the practice of MI is caused by considerable variability in yield composition in various seasons and different parts of the field. In pure sowing, the yield of yellow lupine is lower than the yield of cereals. This is the effect of biological properties of the species. Consequently, in MI, it is the cereal weight that largely determines the overall size of the yield’s total. The dominance of cereals is not only consequence on the mathematical conversion of yield in the pure sowing and participation of components, but it results from mutual interactions that take place in MI during vegetation [
36,
37]. Generally, cereals are the stronger competitor, hence the lupine yield is only 41%–50% of the yield achieved in pure sowing [
5]. A shortage of water intensifies this effect [
25,
27]. However, it was determined that a single plant of yellow lupine proved to be a stronger competitor than a single plant of oats or triticale. In MI, the asymmetry effect of interspecies competition in favor of cereals results from the fact that cereals are sown at disproportionately higher densities than yellow lupine. Cereals begin to dominate the MI canopy because of their quantitative advantage. Studies have demonstrated the advantage of MI where comparable amounts of oats and lupine were sown, as opposed to MI, where oats comprised the majority of planted species [
36,
37,
38].
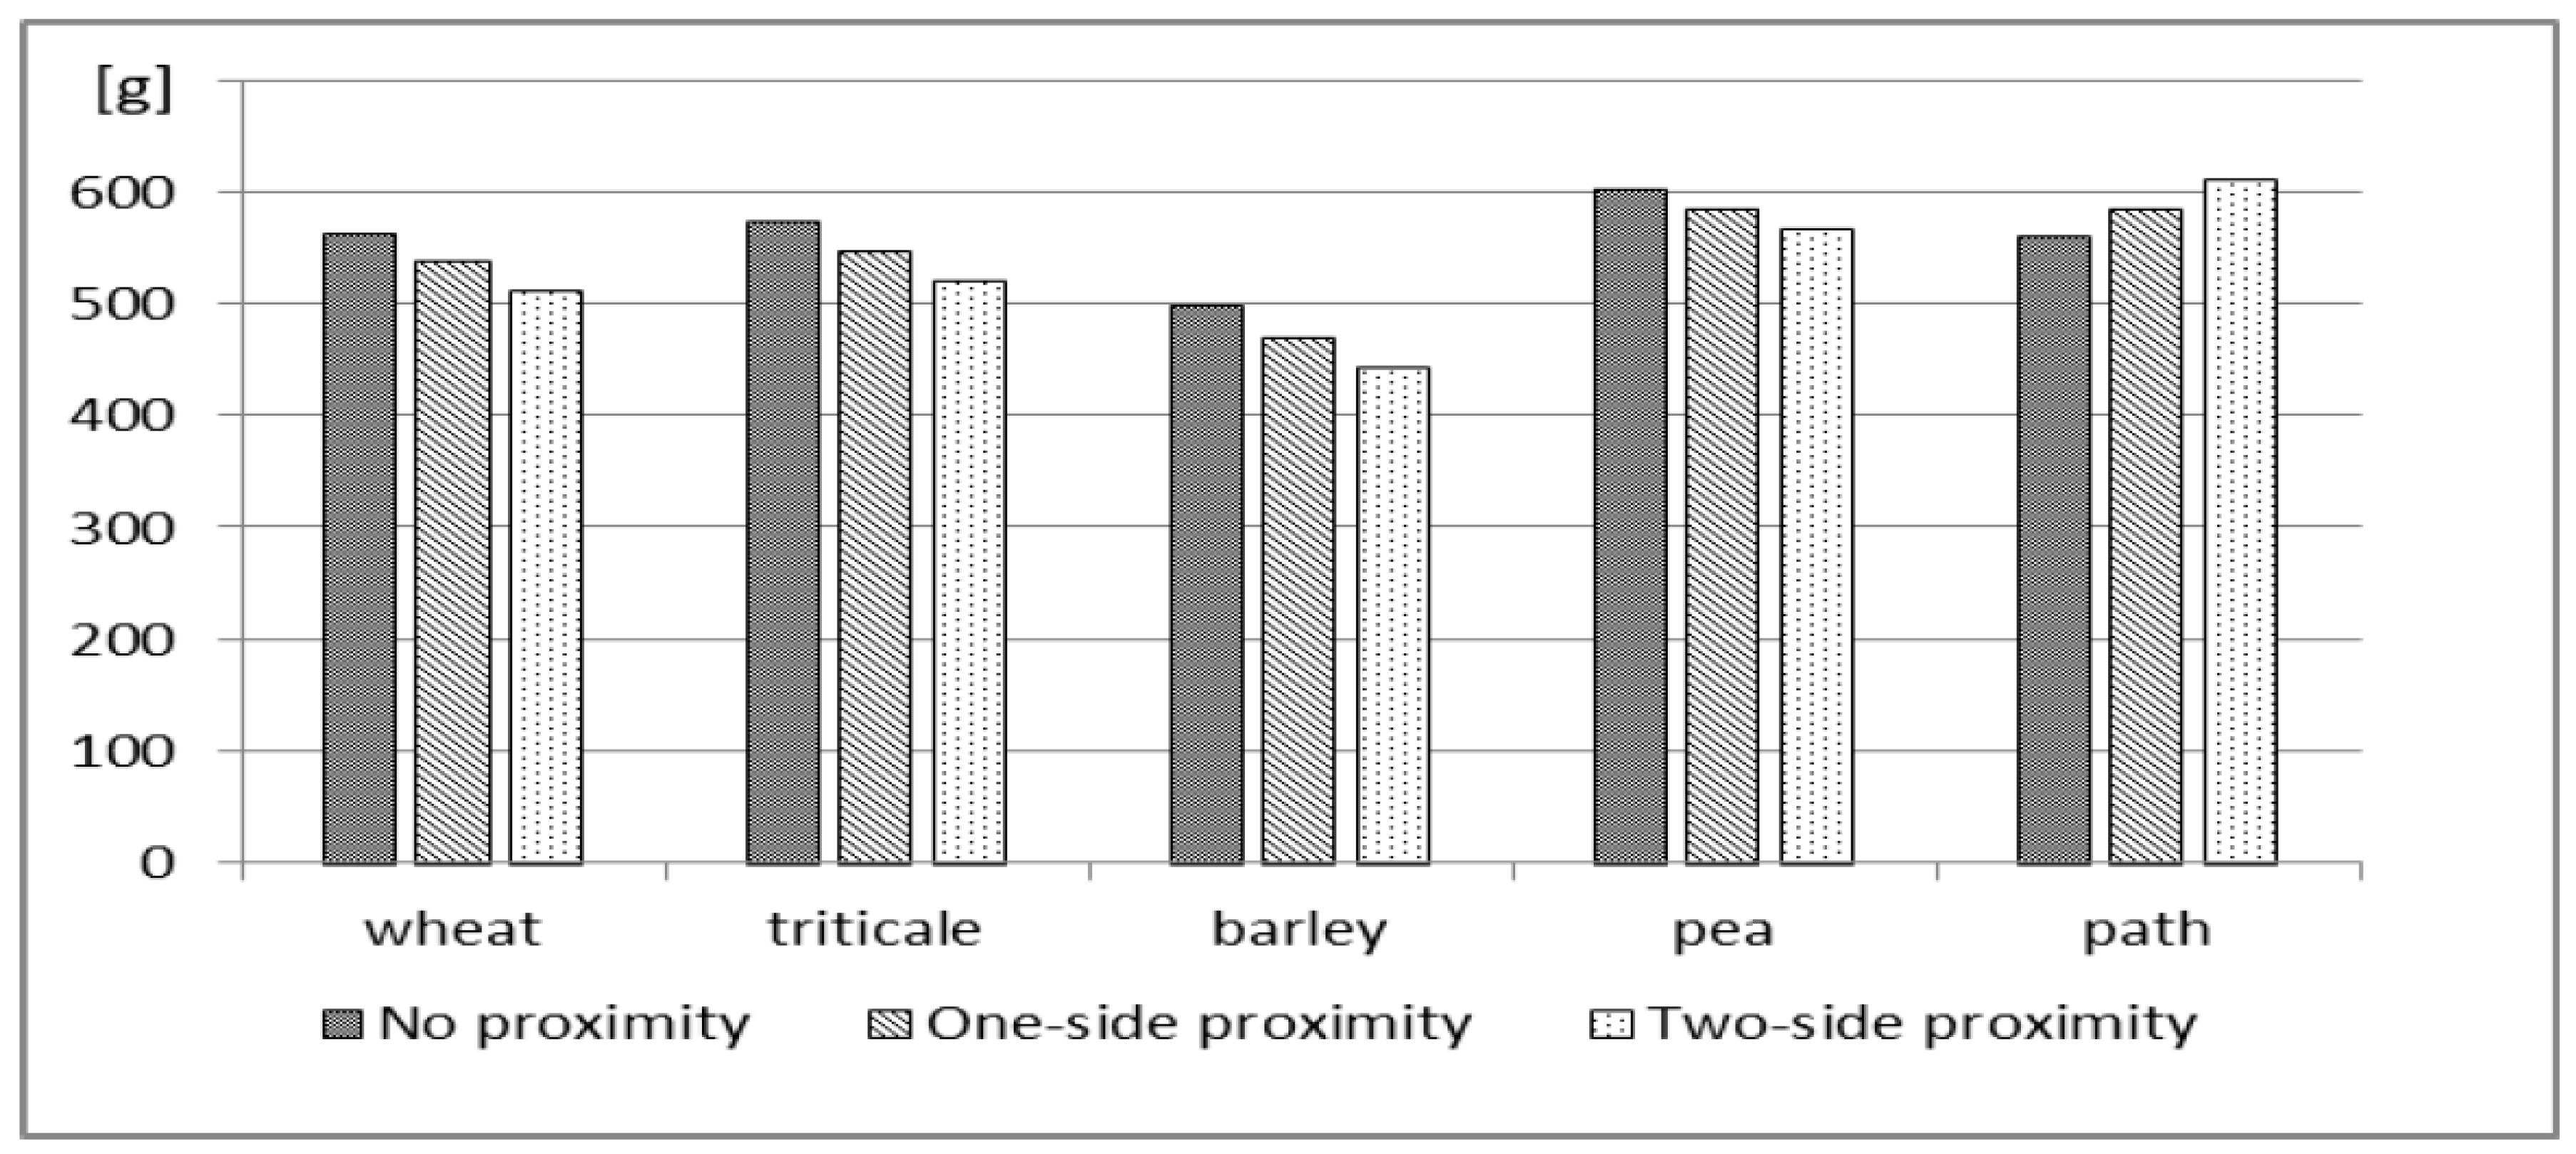
Under the existing experimental conditions, a negative effect of neighboring species in SI on yellow lupine yield was clearly demonstrated. This negative effect translates into SI production results (
Figure 4). In the case of two-sided proximity, one must take into account the loss in lupine seed yield ranging from 6.00% (in the neighborhood of peas) to 10.8% (in the neighborhood of barley). However, separating adjacent strips of different species by a non-grown path (in the case of two-side proximity) may lead to an increase in lupine seed yield by 7.8% (
Figure 5).
An estimation of the SI yield indicates that the separation of arable strips has an impact on the total yield and changes its structure (
Figure 6). It has been proven that the use of a path separating arable strips increases the share of lupine in the total yield. This is most important for SI of yellow lupine with barley. The highest SI yield was obtained for yellow lupine and triticale; but in such a mixture the share of lupine was lower than for SI with other species, which was caused by a relatively high yield of triticale.
Considering that in the total SI yield, the share of lupine exceeded 29%, the above described cultivation method proves to be considerably more advantageous as compared to MI, where yellow lupine’s yield share does not usually exceed a dozen percent [
5,
36,
37].
It can be concluded that SI significantly eliminates the problem of the instability of crop composition. It also allows for more efficient habitat exploitation and contributes to the biodiversity of cultivated fields. Appropriate row-width allows for agricultural techniques to be adapted for individual species and facilitates their separate harvesting; compound feed with a desired composition of components can also be obtained. Our results indicate a 10% decrease in lupine yield in SI as a consequence of a two-sided PE in relation to other cereals. In MI, the corresponding decrease in lupine yield reached several dozen percent [
5,
36,
37], indicating a considerable advantage of SI over MI.
The production value of lupine cultivation in combination with other species is evident when the rows of neighboring plants are separated by paths devoid of vegetation. According to our research, the BE contributes increase in the yield of yellow lupine, which, in turn, compensates for the exclusion of path space from production. It should be emphasized that cereals adjacent to the vegetation free path are also being subjected to BE, which results in a several-fold yield increase: up to 40 cm of seeding strip could be affected [
26,
39]. It should also be noted that the SI production effect depends on rows’ geographical orientation: the north-south setting proved to be most favorable [
27].
5. Conclusions
The proximity of spring wheat, spring triticale, spring barley, and peas proved to have an adverse effect on the growth, development and yielding of yellow lupine. The unfavorable influence pertained to all the biometric characteristics of yellow lupine. A reduction in value of studied characteristics was noted in the row adjacent to the strip of neighboring species and, for some traits, the negative impact of the PE reached up to the third row of the lupine strip. In the case of SI with 3-m-wide strips, the reduction in lupine yield varied from 6.0% to 10.8%, depending on the neighboring species.
Introduction of a path was demonstrated to have a considerable effect on yellow lupine and resulted in a 7.8% increase in its yield. Furthermore, while taking into account the total yield of SI, the share of yellow lupine was also noticeably higher. Depending on species tested, the share of lupine seeds in the total yield of SI fell in the range of 29%–46%. SI of yellow lupine and triticale proved to be the most beneficial.


