Article

Estimation of the Imperative of Rural Area Development on Panel Data in the Process of Managing Agricultural Holdings in Poland

1
Business Informatics and Ecosystems, Faculty of Management, Czestochowa University of Technology, ul. J.H. Dąbrowskiego 69, 42-201 Częstochowa, Poland
2
Main Library, Czestochowa University of Technology, ul. J.H. Dąbrowskiego 69, 42-201 Częstochowa, Poland
*
Author to whom correspondence should be addressed.
Submission received: 9 May 2020 / Revised: 6 July 2020 / Accepted: 10 July 2020 / Published: 14 July 2020

Abstract

:
In today’s Polish economy, management processes in agri-business should be considered and taken into account in a more comprehensive way. The accession to the European Union created an obligation for Poland to implement solutions arising from the Common Agricultural Policy. Due to factors related to management in agri-business, farmer-entrepreneurs started to pay more attention to issues connected with the management process. An agricultural holding, like every enterprise, in order to be competitive and achieve a constant market presence, needs to adapt its production to current needs, invest in its development (thus, contributing to the development of rural areas), improve the quality of its products, and modernise. Management of agricultural enterprises is specific in character because the decisions that are made often concern not only production or investment, but also creation of actions that rely on management solutions. The aim of the paper is to present an original imperative (the imperative in article is a synonym for the word model) that is estimated by the method of least squares and uses panel data related to the measure ‘Creation and development of micro-enterprises’, including the implementation of funds for modernisation and development of investments in micro-enterprises. The results of the study made it possible to assess the effects of managing agricultural micro-enterprises in 16 provinces in Poland in the context of the decisions they made regarding the use of the funds under the Rural Development Programme (RDP) 2007–2013. These results can be used in the assessment of RDP management in the current financial perspective 2014–2020, which attests to their universality.

1. Introduction

This paper focuses on an important and significant stage of project management [1], which corresponds to the analysis of the effects of the execution and implementation of the Rural Area Development Programme based on panel data. The complexity of the issues of project management requires taking into account multiple aspects. One of the most important is the essence of project management, in particular in terms of effectiveness and obtained effects. The scope of the concept of project management is very broad. On the one hand, it is defined by preparation and implementation works (i.e., organisation and planning of undertakings, effectiveness analysis, project implementation), while on the other hand, by research and design methodology. In the first case, project management can be expressed as managerial pragmatism, i.e., administering the design and implementation process, whereas in the second case, the essence of project management is supervision over the solution of project tasks. Project management can be seen as a process aiming to ensure effective completion of the components of a project life cycle—project initiation, planning, execution, and project closure. Project management can be defined in a narrow and broad sense. In the former case, a programme should be understood as an analytical and research work, the concept and functioning of a system, technical documentation, as well as a plan or action programme. In the broad sense, a programme is understood as a model constituting improvement of a certain object or system. It can also be a base solution, which constitutes a creation characterised by a novel form and construction. Such creation enables implementation of a planned undertaking as an investment, operational, public or other task. The issues addressed above indicate that proper execution of project management is based on proper planning, appropriate implementation and effects. It presents estimation of the imperative [2,3] of the Rural Area Development Programme measures on panel data. In the analyses, variables were selected to build models in the measure ‘Creation and development of micro-enterprises’.
Securing EU funds [4,5] and applying for agricultural aid programmes, especially for creation and development of micro-enterprises, is a huge challenge for owners of agricultural holdings. Projections of a future model of micro-enterprises and its service by 2030 show that it has to be integrated with the infrastructure level of agricultural holdings and rural areas and aligned with the infrastructure of the country. Fast technical and scientific development as well as the increasing needs of the population in rural areas necessitate significant infrastructural development to match the changing reality. Investment in micro-enterprises will be justified if it brings benefits in the areas of production, ecology and the energy sector, and fosters social development [6].
Despite the current economic recession, the creation and development of micro-enterprises should be continued, as rural areas, though dynamically changing and constantly evolving, are still facing a lot of problems that need to be solved in the coming years, in particular in the area of managing agricultural holdings. These problems, or barriers, have more to do with the organisational and mental sphere of rural inhabitants. It cannot be denied that actions aimed at development of infrastructure, i.e., construction of new and development of the existing roads, modernisation of sewage networks, etc., are visible signs of the development of micro-enterprises. However, it is still difficult to convince rural inhabitants and agricultural entrepreneurs that equally huge development possibilities in such areas are offered by appropriate management, which involves proper use of information and communications technology, which makes it possible to overcome barriers related to distance, knowledge transmission, proper relations between the citizen, office, state, etc.
Polish agriculture, which is lagging behind and economically poor, has for over 15 years been supported in restructuring processes [7,8,9,10] by EU funds, which are contributing to more effective management [11] and enable participation in global, highly competitive markets.
The possibility of obtaining and using aid from EU funds [12] changes the quality of the processes of agricultural holding management. Knowledge in this area is necessary and at least as important as knowledge on rearing and cultivation techniques [13,14,15], and includes not only management functions accepted in theory, but also those adapted to the specificity of agricultural holdings. It also highlights the systemic aspect of infrastructure [16] in the development of agricultural holdings and rural areas and emphasises the need for comprehensive farming and resolving of problems, whether in economic, social or environmental aspects.

2. Literature Review

The current dynamics of the development of Polish rural areas is caused by a range of integration processes and the assumption by rural areas of more and more functions, which results in a rapid infrastructural growth and facilitates the creation and development of micro-enterprises [17] in rural areas in Poland. In order to be successful in economic activity under the conditions of dynamic changes in the environment, a farmer-entrepreneur has to not only properly respond to these changes, but also take proactive actions to create new, favourable conditions of cooperation and competition. An example is the development of micro-enterprises, which forces agricultural holdings and rural areas to have effective infrastructure in order to be competitive against their partners from EU states [18,19,20,21,22].
The level of infrastructural development has a significant impact on the attractiveness of rural areas in terms of investment and manufacturing, with highly developed infrastructure facilitating animation of the life of rural inhabitants [23]. Thus, infrastructure can determine the attractiveness or unattractiveness of a given region, and consequently, the chances for or barriers to further development of micro-enterprises. Therefore, it is a kind of determinant stimulating socioeconomic progress, and at the same time, one of more important factors in life in rural areas and in the creation of micro-enterprises [24].
The dynamics of the development of micro-enterprises in rural areas [25] are strongly impacted by the process of managing agricultural holdings [26]. Appropriate land management through right decisions made by agricultural entrepreneurs to provide service infrastructure in the area, including electricity, water and sewage system, not only increase the value of a given land, but also lower the costs of subsequent investments, thus, driving the increase in attractiveness. Such activities require significant financial outlays, which often represents a hindrance to further infrastructural development of micro-enterprises [27,28,29]. However, communes can benefit from state aid and EU funds designed to ensure equal opportunities and close the significant gap between urban and rural areas [30]. An important role in the development of rural areas is played by micro-enterprises, as it is mainly them that can apply for EU [31,32] and national funds, especially to finance capital-intensive investments [33] that cannot be afforded by individual farmers.

3. Materials and Methods

This paper proposes development of an econometric imperative [34,35,36] illustrating institutional decisions made as part of the implementation of the Rural Area Development Programme with respect to submitted applications for assistance in terms of short-term elasticity, which will enable assessment of the effects of management using EU funds [37].
The imperative estimated using the method of least squares (LS) is as follows:
y i t = x i t β + v i t
where:
yit—response variable;
xit—explanatory variable (vector of explanatory variables);
ß—vector with N structural parameters of the imperative;
vit—total random error consisting of a purely random component εit and individual effect ui referring to a specific i-th unit of the panel, i.e., vit = εit + ui;
index i = 1, …, N denotes subsequent objects;
index t = 1, …, N denotes subsequent time units.
The panel data used in this paper allow for conducting analyses, taking into account both objects and time intervals. This approach enables a dynamic analysis of economic phenomena [38].
Estimation of a panel imperative [39] using the classical method of least squares (CMLS) requires a fulfilled condition of the CMLS estimator’s consistency for total error E (vit, xit) = 0, Cov (vit, xit) = 0 and for pure random error E (εit) = 0, Cov (εit, xit) = 0 for i = 1, …, N, t = 1, …, T, and lack of correlation between individual effect ui and explanatory variable xit. Thus, it can be said that the estimation is acceptable when an individual effect does not occur, and the panel is treated as a cross-sectional dataset.
In an imperative, we can distinguish imperatives with artificial variables (group effects are considered random), where ε is a vector of random components with the same independent distributions εit~ N ( 0 , σ ε 2 ) ; Xit are independent of εit for all i and t, whereas μi and θt are vectors of non-random parameters. The introduction of artificial variables is aimed at illustrating the individual effects characteristic of the objects (periods) [40].
The total significance of artificial variables can be tested using standard F tests (for zero-one variables reflecting the impact of a province and time) [41].
As the sample covers the whole or most of the population of interest, i.e., the focus was on a set of concrete specified objects, reliable results, both statistically and substantively, are yielded by an imperative with artificial variables.
The method of least squares is one of the basic methods for estimating parameters of econometric imperatives. Its idea is to find such values of parameter estimators (estimations of parameters) of an imperative that the sum of the squares of the residues is the least:
i n e i 2 = i n [ y i y ^ i ] 2 = i n [ y i ( b 1 x i 1 + + b k x i j ) ] 2 m i n i m u m
where:
ei—residues of the model;
yi—empirical values of the response variable in i-th period;
y i ^ —theoretical values of the response variable determined by the model in i-th period;
b1—estimations of the structural parameters of the econometric imperative for j-th explanatory variable in i-th period;
xij—i-th observation on j-th explanatory variable;
j—number of explanatory variables;
k—number of structural parameters i;
n—number of observations, i = 1, 2, …, n.
For verification of the hypothesis of the significance of structural parameters αj of the imperative, the Student’s t-test [42,43,44] was used. A null hypothesis in the form H0: βj = 0, against the alternative hypothesis H1: βj ≠ 0, was adopted, and the value of test statistic tj was determined based on the equation:
t ( b j ) = b j S ( b j )
where:
t(bj)—value of the test based on Student’s t-distribution;
bj—estimation of j-th parameter;
S(bj)—average error of the estimation of j-th parameter.
Analysing the significance of the impact of explanatory variables on the response variable, it can be stated that:
  • There is no basis for rejecting the null hypothesis, which means that the explanatory variable has no significant impact on the response variable—|t| < tβ.
  • The null hypothesis is rejected in favour of the alternative hypothesis, i.e., the explanatory variable has a significant impact on the response variable—|t| > tβ.
To examine the existence of autocorrelation [45,46,47], the autocorrelation coefficient test was used. The test can be used to verify hypothesis H0: ρ = 0 (autocorrelation does not occur) against hypothesis H1: ρ ≠ 0 (autocorrelation occurs).
The test of this hypothesis is the statistic:
I τ = | r τ | n τ 2 1 r τ 2
where:
rτ—autocorrelation coefficient for lag τ;
τ—lag;
n—number of observations.
Analysis of the occurrence of autocorrelation revealed that:
  • There is no basis for rejecting the null hypothesis; the coefficient of autocorrelation ρτ is insignificant if IτI.
  • H0 is rejected in favour of H1; the coefficient of autocorrelation ρτ is significant if Iτ > Iα.
The degree to which the response variable is explained by the part determined by the explanatory variable was found based on the coefficient of determination, whereas the share of random elements was based on the coefficient of convergence.
Moreover, based on the level of the coefficient of variation of standard deviation, the share of standard deviation in the mean value of the response variable was given.
All the statistical data used in the studies refer to sixteen provinces in Poland: Lower Silesia, Kuyavian-Pomeranian, Lubelskie, Lubusz, Łódź, Lesser Poland, Masovia, Opole, Podkarpackie, Podlaskie, Pomerania, Silesia, Świętokrzyskie, Warmia-Masuria, Greater Poland, and West Pomerania.
An estimation model of rural area development in Poland, with respect to the presented measure, covers 16 provinces within the period of the previous EU financial perspective. The results enable comparison of the efficacy of submitted applications by number of applications and amount applied for with respect to key areas of the Rural Development Programme in the individual provinces, indicating deviations from the mean, which can be used to create a ranking of the provinces. In the process of modelling, the authors use analysis of residuals, employing the method of least squares, as well as significance tests in the form of Student’s t-tests and autocorrelation tests. The development of the econometric model will enable assessment of the efficacy of submitted applications verified by the number of decisions made, the overall amount granted in relation to the amount requested by farmers as well as the amount obtained from the European Agricultural Fund for Rural Development in relation to the amount applied for.
The studies conducted showed that during the period considered, the Rural Development Programme had a positive impact on management of agricultural holdings and contributed to increase in agricultural production in Poland under measure ‘Creation and development of micro-enterprises’. The analysis of the management of agricultural holdings and the use of financial resources under the Rural Development Programme revealed increasing investment activity among farmers and agricultural micro-entrepreneurs inhabiting rural areas, and perfectly fits the formula of project management, which aims at the implementation of economic and managerial tasks related to the design and execution process, which is concentrated on functions, with a particular reference to the function of analysing the effectiveness [48,49,50] of the submitted applications.
The formalised model of the relation between the scale of farmers’ potential expectations and the extent to which they were realised will be a measure of the effectiveness of the management of projects in the area of the Rural Development Programme with respect to agricultural holdings operating as micro-enterprises [51,52,53,54].
The proposed imperative enables assessment of the effectiveness of the applications submitted under the selected RDP measure—Creation and development of micro-enterprises. This effectiveness can be equated with rationality of expectations in the area of management using EU funds. Its level reflects effects of the management process. The proposed imperative made it possible to compare the effectiveness of the applications submitted within the key RDP areas in the different provinces, and thus to indicate the deviations from the means to be used for creating a ranking of the provinces.
Moreover, the proposed imperative enables assessment of the effectiveness of farmers’ applications for financial aid for the abovementioned RDP measure from EU and Polish funds. This assessment depends on the effects of managing micro-enterprises. The proposed imperative also relates to the aspects of effective management by means of EU funds, which includes flexible decision-making to ensure benefits for micro-enterprises. From this perspective, no studies have yet been conducted on the abovementioned RDP measure in rural areas in Poland on the level of provinces, and in particular for the Silesian province.

4. Results

4.1. Development of Panel Imperatives of Concluded Contracts under the Measure ‘Creation and Development of Micro-Enterprises’

In the analyses, variables referring to the applications submitted under the measure ‘Creation and development of micro-enterprises’ were proposed as the explanatory variable in the development of an imperative [55] for contracts concluded under this measure.
Given the character of the dependent variable:
(1)
When examining the number of contracts concluded under the measure ‘Creation and development of micro-enterprises’, the number of applications submitted under this measure was adopted as an explanatory variable.
(2)
When examining the total amount of contracts concluded under the measure ‘Creation and development of micro-enterprises’, the amount applied for under this measure was adopted as an explanatory variable.
(3)
When examining the RDPEF amount of the contracts concluded under the measure ‘Creation and development of micro-enterprises’, the RDPEF amount applied for under this measure was adopted as an explanatory variable.
This paper presents three types of imperatives reflecting the above division:
  • DLT—which refers to the number of concluded contracts and the number of submitted applications.
  • DKT—which refers to the total amount of concluded contracts and the total amount applied for.
  • DET—which refers to the RDPEF amount of contracts concluded and the RDPEF amount applied for.
All the statistical data used in the studies refer to sixteen provinces and come from the reports on the activities of the Agency for Restructuring and Modernisation of Agriculture and from reports on the implementation of the measures under the Rural Area Development Programme, as issued by the Ministry of Agriculture and Rural Areas Development. These are annual data. In the case of the number of concluded contracts and the number of submitted applications, the data were calculated per 1,000,000 people for each province respectively, whereas in the case of the amounts, all the data were presented in real terms and converted into fixed 2009 prices. As this paper relies on time series from one source, the problem of differences in definitions and information gathering methods was avoided. Due to short time series, neither stationarity tests nor analysis of variance were performed in the paper. Further studies were conducted based on panel data.
The application of panel data used in econometric analyses allows for increasing the number of observations and capturing unique factors characteristic of a specific object.

4.1.1. Theoretical Background—the Analytical form of the Imperative

This paper proposes panel data analysis of the contracts concluded (number, total amount, RDPEF amount) under the Rural Development Programme (RDP), depending on submitted applications (number, total amount, RDPEF) under the measure ‘Creation and development of micro-enterprises’.
Initially, the contracts concluded and applications submitted in the previous period were also considered as potential explanatory variables. However, observation of their values, talks held at the Agency for Restructuring and Modernising Agriculture and study of specialised literature resulted in the eventual use of only two types of variables from the current period. This choice was also determined by analysis of the matrix of correlation coefficients. Based on them, it was found that the main determinant of the types of contracts concluded in the current period is the relevant figures related to the applications submitted in the current period.
After analysing a range of different function forms, mechanical specification (trial and error method) was eventually chosen.
After conducting the studies, imperatives in the form of a power function were eventually proposed. Their analytical form is as follows:
D L T i t = η 0 · W L T i t η 1 · e 10 ε 10 i t
where:
DLTit—the number of contracts concluded under the measure ‘Creation and development of micro-enterprises’ for i-th province in period t;
WLTit—the number of applications submitted under the measure ‘Creation and development of micro-enterprises’ in i-th province in period t;
η0, η1—structural parameters of the imperative;
ε—random element.
D K T i t = ψ 0 · W K R i t ψ 1 · e 11 ε 11 i t
where:
DKTit—the total amount of contracts concluded under the measure ‘Creation and development of micro-enterprises’ for i-th province in period t;
WKTit—the total amount applied for under the measure ‘Creation and development of micro-enterprises’ in i-th province in period t;
ψ0, ψ1—structural parameters of the imperative;
ε—random element.
D E T i t = ϑ 0 · W E T i t ϑ 1 · e 12 ε 12 i t
where:
DETit—the RDPEF amount of the contracts concluded under the measure ‘Creation and development of micro-enterprises’ for i-th province in period t;
WETit—the RDPEF amount applied for under the measure ‘Creation and development of micro-enterprises’ in i-th province in period t;
ϑ0, ϑ1—structural parameters of the imperative;
ε—random element.
After transformation to logarithmic form, Equation (5) takes the following form:
ln D L T i t = ln η 0 + η 1 ln W L T i t + ε 10 i t
After transformation to logarithmic form, Equation (6) takes the following form:
ln D K T i t = ln ψ 0 + ψ 1 ln W K R i t + ε 11 i t
After transformation to logarithmic form, Equation (7) takes the following form:
ln D E T i t = ln ϑ 0 + ϑ 1 ln W E T i t + ε 12 i t
This transformation of the equations made it possible to use the classical method of least squares for estimation.

4.1.2. Results of the Estimation

For estimating the imperative based on panel data, the method of least squares [56,57,58,59] was used. Estimations of the imperative’s structural parameters and its degree of fit are as follows (values of t-statistic have been provided in brackets):
ln D L ^ T i t = 0.866 ( 1.627 ) + 0.960 ( 10.082 ) ln W L T i t
R2 = 0.763 r = 0.315 F(1.30) = 101.07 n = 32
ln D K ^ T i t = 0.866 ( 2.673 ) + 0.960 ( 10.323 ) ln W K T i t
R2 = 0.820 r = 0.381 F(1.30) = 106.06 n = 32
ln D E ^ T i t = 0.878 ( 2.946 ) + 0.960 ( 10.323 ) ln W E T i t
R2 = 0.772 r = 0.212 F(1.30) = 106.06 n = 32.
The results reveal that there is an impact of the number of submitted applications (WLTR, WKT, WET) on the number of concluded contracts (respectively, DLT, DKT, DET). Based on every imperative, it can be noted that over a short period of time, a 1% increase in the value of the explanatory variable leads to an increase in the response variable by 0.96–0.98% on average. The imperatives explain the phenomenon in around 76.3, 82, and 77.2%, respectively. In each case, multiple correlation coefficients are statistically significant, so it can be stated that the explanation level of the imperative is sufficiently high. There is no autocorrelation (p < 0.02) in the models, so the estimators are consistent, unbiased and most efficient. Random elements have impact in around 23.7% (Equation (11)), 18% (Equation (12)), and 22.8% (Equation (13)), whereas the coefficients of variation for the equations are 6.62, 26.61 and 14.88%.

4.1.3. Estimation of the Elasticity of the Contracts Concluded under the Measure ‘Creation and development of micro-enterprises’ in Individual Provinces of Poland

The attempt to compare short-term trends with respect to contracts concluded under the measure ‘Creation and development of micro-enterprises’ in the different provinces of Poland, as undertaken in this paper, aims to create a tool to support the implementation of changes in agriculture modernisation and development.
This article seeks to build and estimate imperatives based on panel data. Estimation of an imperative based on such data requires the use of a procedure that takes into account individual characteristics of the different provinces.
The panel data analyses proposed in this paper allow for answering the following questions:
  • What are the short-term elasticities of the number of decisions taken under the measure ‘Creation and development of micro-enterprises’ in relation to the number of submitted applications overall for the provinces under study.
  • What are the short-term elasticities of the total amount under the measure ‘Creation and development of micro-enterprises’ in relation to the total amount applied for, when considering all of the provinces under study.
  • What are the short-term elasticities of the total RDPEF amount under the measure ‘Creation and development of micro-enterprises’ in relation to the total RDPEF amount applied for, when considering all of the provinces under study.
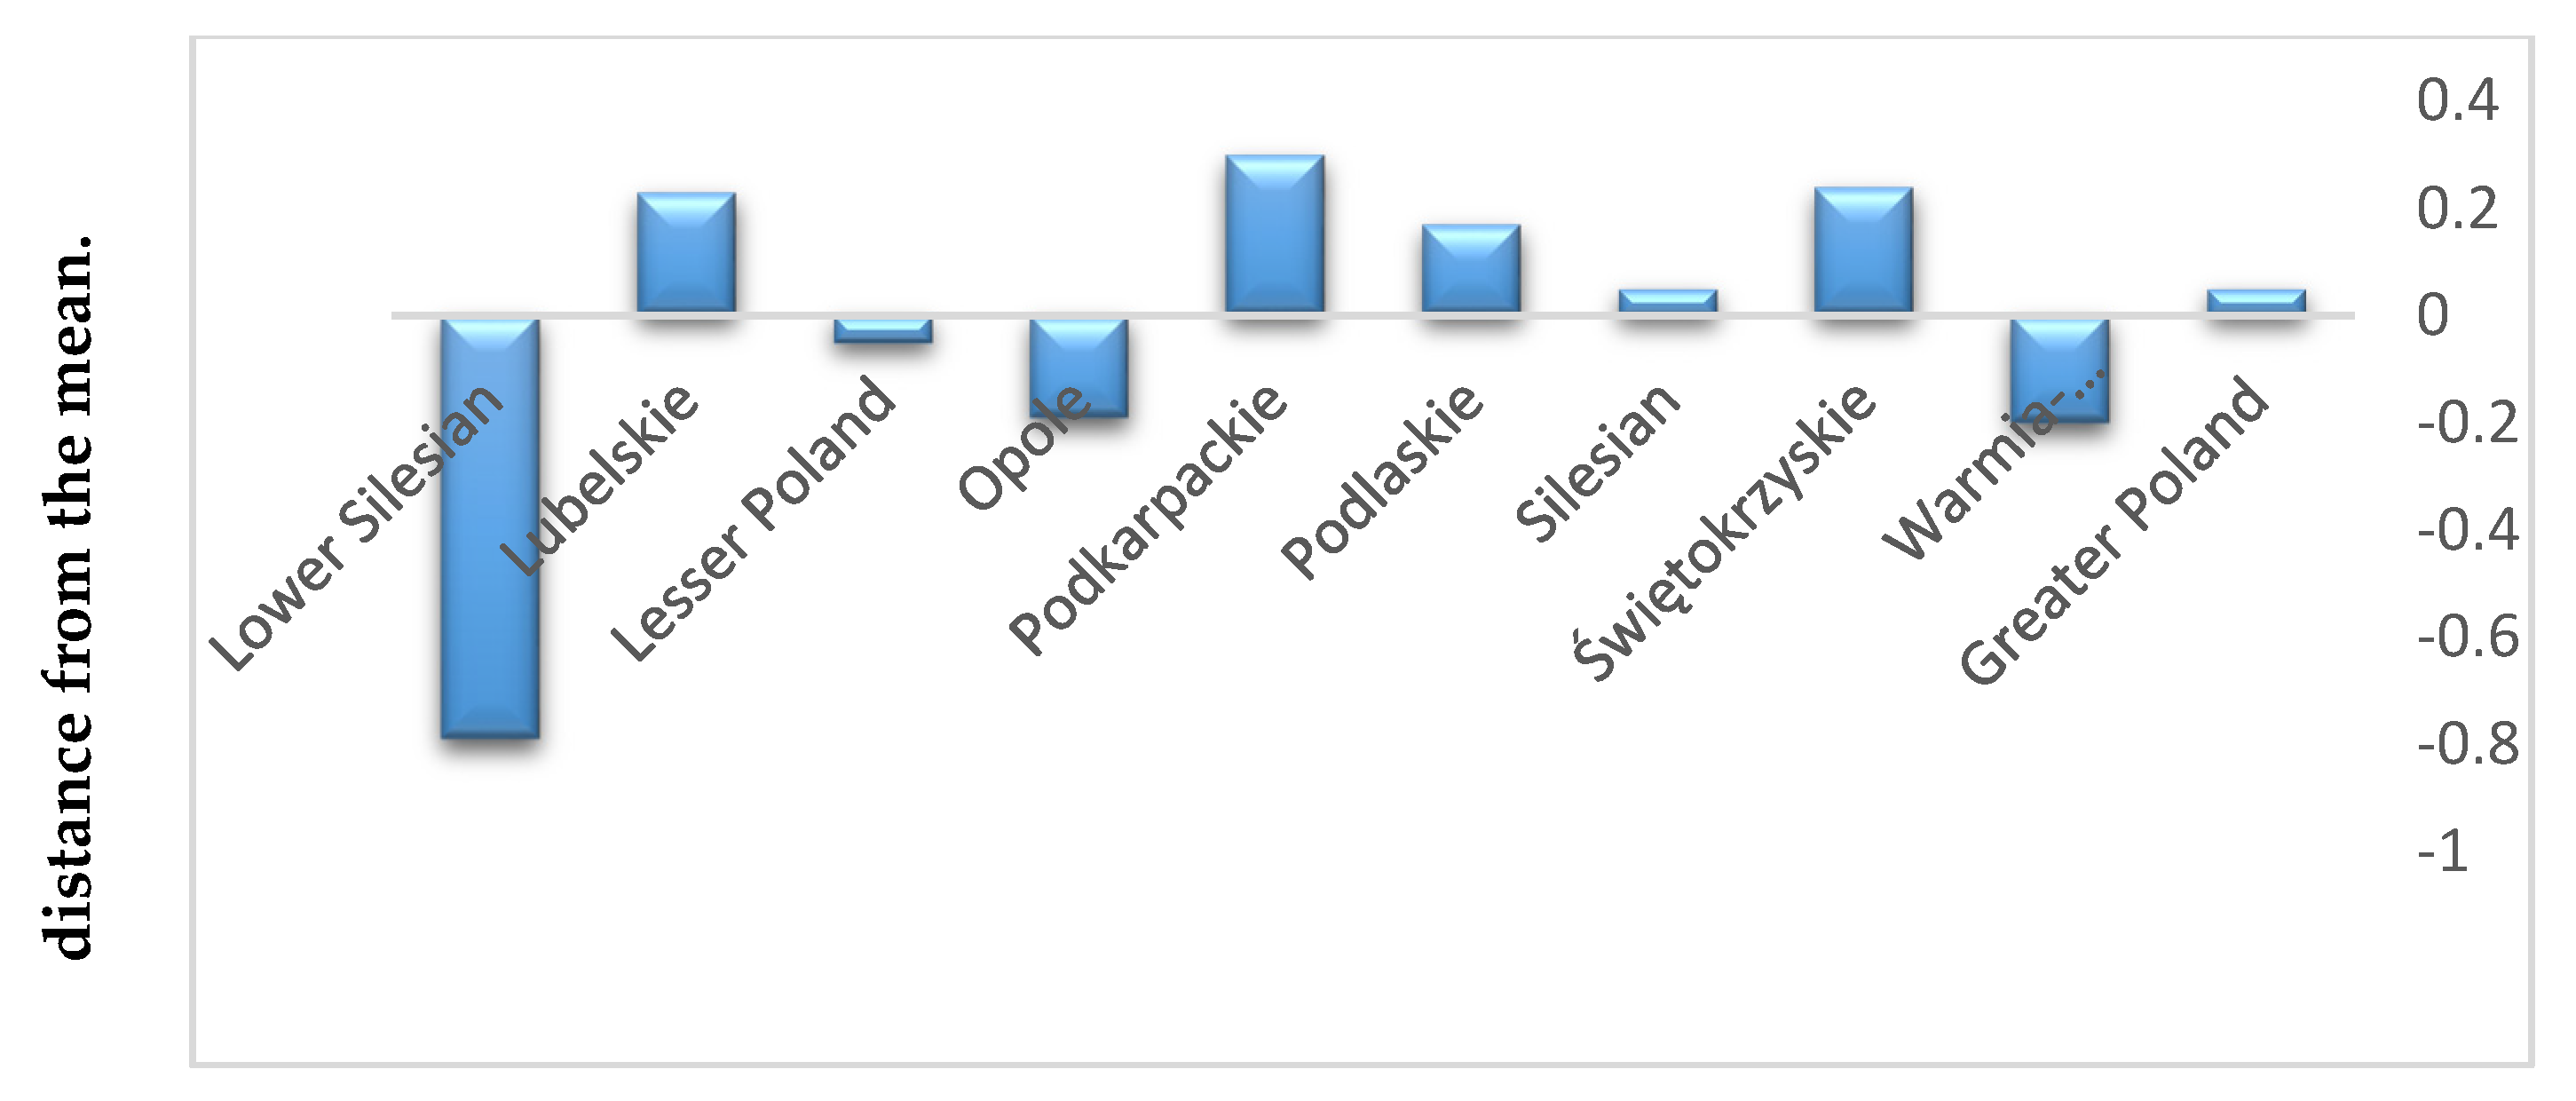
DLT, DKT and DET imperatives are imperatives with artificial variables. They were estimated using the method of least squares and used information on the variable factors under study (e.g., the number of decisions made with respect to the measure under study relative to the number of submitted applications, the number of submitted contracts, the number of concluded contracts) in 16 Polish provinces.

4.2. DLT Imperative

The aim of the imperative is to examine the dependence of the number of contracts concluded under the measure ‘Creation and development of micro-enterprises’ (DLT) on the number of applications submitted under the measure ‘Creation and development of micro-enterprises’ (WLT). For estimation, an imperative in the form of a power function was used, which was converted to a linear function by transforming both sides to algorithms.
When estimating imperative (14) by least squares, the intercept was decomposed into provinces denoted by the following abbreviations: Lower Silesian—ηD, Lubelskie—ηL, Lesser Poland—ηM, Opole—ηO, Podkarpackie—ηP, Podlaskie—ηPD, Silesian—ηS, Świętokrzyskie—ηSW, Warmia-Masurian—ηWM, Greater Poland—ηW (the variables for Kuyavian-Pomeranian, Lubusz, Łódź, Masovian, Pomeranian and West-Pomeranian provinces proved to be of no statistical significance, and consequently, they were eliminated in the estimation process).
Based on the calculations, estimations of structural parameters can be written down in the imperative as follows (during the estimation, the intercept proved to be of no statistical significance, and as such, it was not included in the imperative):
lnDLTit = −0.460 + 0.518 + 0.309 + 0.232 + 0.561 + 0.470 + 1.666 + 0.526 + 0.238 + 0.388 + 0.781 lnWLTit
where:
  • −0.460 is estimation of the individual effect for Lower Silesianit;
  • 0.518 is estimation of the individual effect for Lubelskieit;
  • 0.309 is estimation of the individual effect for Lesser Polandit;
  • 0.232 is estimation of the individual effect for Opoleit;
  • 0.561 is estimation of the individual effect for Podkarpackieit;
  • 0.470 is estimation of the individual effect for Podlaskieit;
  • 1.666 is estimation of the individual effect for Silesianit;
  • 0.526 is estimation of the individual effect for Świętokrzyskieit;
  • 0.238 is estimation of the individual effect for Warmia-Masurianit;
  • 0.388 is estimation of the individual effect for Greater Polandit.
Standard deviations of the estimations of structural parameters and values of t-statistic in the imperative DLT are included in Table 1.
The equation clearly shows a link between the number of concluded contracts and the number of applications submitted under the measure. A change in WLT always impacts DLT. Within a short time, DLT increased by 0.78% on average in relation to WLT. Therefore, the effect of the impact of WLT is less than proportional. The value of the elasticity coefficient is statistically significant. Statistically significant (but at a lower level) are also the other parameters, with statistical significance of 0.044. No autocorrelation of the random component occurs in the imperative (p < 0.3). The response variable is explained by the imperative in 94.1%, whereas the coefficient of random variation is 3.33%. Random elements have an impact in around 5.9%.
Based on the information contained in Table 2, it can be noted that the biggest impact on the number of concluded contracts was recorded in Podkarpackie province (1.752), whereas the smallest one was in Lower Silesia (0.631).
Decomposition of the intercept into 10 parts corresponding to the individual provinces allowed for capturing effects characteristic of given regions. By decomposing the intercept, it is possible to look at the specificity of a given imperative’s operation in individual provinces, as the initial value of the variable under study may vary from province to province, and with one intercept interpreted at the national level, regional differences may become blurred.
Table 2 presents the values of decomposed intercepts after undoing the algorithm, thus, revealing the differences between the provinces (in multiplicative terms). In the remaining six cases, the variables turned out to be statistically insignificant.
Analysis of the number of contracts concluded under the measure ‘Creation and development of micro-enterprises’ shows that in five provinces, the number of such contracts is above average for all of the Polish provinces under study (Figure 1).
Analysis of the number of concluded contracts shows that in the Lower Silesia province, the number of such contracts was much below the average level for Polish provinces (−0.789). In Podkarpackie province, this number was the highest compared to the average (0.332).

4.3. Imperatives DKT and DET

The aim of imperative DKT is to examine the dependence of the total amount of contracts concluded under the measure ‘Creation and development of micro-enterprises’ (DKT) on the total amount applied for under the measure ‘Creation and development of micro-enterprises’ (WKT). For estimation, an imperative in the form of a power function was used, which was converted to a linear function by transforming both sides to algorithms
When estimating the model by least squares, the intercept was decomposed into provinces denoted by the following abbreviations: Lower Silesian—ψD, Lubelskie—ψL, Lesser Poland—ψM, Opole—ψO, Podkarpackie—ψP, Podlaskie—ψPD, Pomerania—ψPM, Silesian—ψS, Świętokrzyskie—ψSW, Warmia-Masurian—ψWM, Greater Poland—ψW.
The aim of imperative DET is to examine the dependence of the RDPEF amount of the contracts concluded under the measure ‘Creation and development of micro-enterprises’ (DET) on the RDPEF amount applied for under the measure ‘Creation and development of micro-enterprises’ (WET). For estimation, an imperative in the form of a power function was used, which was converted to a linear function by transforming both sides to algorithms.
When estimating the model by least squares, the intercept was decomposed into provinces denoted by the following abbreviations: Lower Silesian—ϑD, lubelskie—ϑL, Lesser Poland—ϑM, Opole—ϑO, Podkarpackie—ϑP, Podlaskie—ϑPD, Pomerania—ϑPM, Silesian—ϑS, Świętokrzyskie—ϑSW, Warmia-Masurian—ϑWM, Greater Poland—ϑW.
Based on the calculations, estimations of structural parameters can be written in the imperative as follows:
lnDKTit = −0.564 − 0.525 + 0.566 + 0.361 + 0.213 + 0.617 + 0.504 + 0.190 + 1.513 + 0.521 + 0.290 + 0.475 + 0.803 lnWKTit
where:
  • −0.525 is estimation of the individual effect for Lower Silesianit;
  • 0.566 is estimation of the individual effect for Lubelskieit;
  • 0.361 is estimation of the individual effect for Lesser Polandit;
  • 0.213 is estimation of the individual effect for Opoleit;
  • 0.617 is estimation of the individual effect for Podkarpackieit;
  • 0.504 is estimation of the individual effect for Podlaskieit;
  • 0.190 is estimation of the individual effect for Pomorskieit;
  • 1.513 is estimation of the individual effect for Silesianit;
  • 0.521 is estimation of the individual effect for Świętokrzyskieit;
  • 0.290 is estimation of the individual effect for Warmia-Masurianit;
  • 0.475 is estimation of the individual effect for Greater Polandit.
lnDETit = −0.620 − 0.525 + 0.566 + 0.213 + 0.617 + 0.504 + 0.190 + 1.513 + 0.521 + 0.290 + 0.475 + 0.803 lnWETit
  • −0.525 is estimation of the individual effect for Lower Silesianit;
  • 0.566 is estimation of the individual effect for Lubelskieit;
  • 0.361 is estimation of the individual effect for Lesser Polandit;
  • 0.213 is estimation of the individual effect for Opoleit;
  • 0.617 is estimation of the individual effect for Podkarpackieit;
  • 0.504 is estimation of the individual effect for Podlaskieit;
  • 0.190 is estimation of the individual effect for Pomorskieit;
  • 1.513 is estimation of the individual effect for Silesianit;
  • 0.521 is estimation of the individual effect for Świętokrzyskieit;
  • 0.290 is estimation of the individual effect for Warmia-Masurianit;
  • 0.475 is estimation of the individual effect for Greater Polandit.
The results of the estimations were included in Table 3.
The equation clearly shows a link between the total amount of concluded contracts and the amount applied for under the measure. A change in WKT impacts DKT. Within a short time, DKT increased by 0.8% on average in relation to WKT. Therefore, the effect of the impact of WKT is less than proportional. The value of the elasticity coefficient proved to be statistically significant. In the imperative, nine parameters proved to be statistically significant, whereas in the case of two parameters, the significance was lower and amounted to 0.09 (Opole) and 0.13 (Pomerania). No autocorrelation of the random component occurs. The response variable is explained by the imperative in 94.3%, whereas random elements have an impact in around 5.7%.
The equation clearly shows that in the case of the RDPEF amount of concluded contracts and the amount applied for under this measure, there are the same relationships as in the case of the total amount of concluded contracts and the total amount applied for under this measure. Differences are only observed in the value of the intercept and the value of the coefficient of variation, which increased by 0.88 percentage points.
A similar situation can be seen in the case of intercept decomposition. Decomposition of the intercept into 11 parts corresponding to the individual provinces allowed for capturing of the effects characteristic of given regions. By decomposing the intercept, it is possible to look at the specificity of a given imperative’s operation in individual provinces, as the initial value of the variable under study may vary from province to province, and with one intercept interpreted at the national level, regional differences may become blurred.
Table 4 presents the values of decomposed intercepts after undoing the logarithms, thus, revealing the differences between the provinces (in multiplicative terms). In the remaining five cases, the variables proved to be of no statistical significance. Based on the information contained in Table 4, it can be seen that the biggest impact on the total amount of concluded contracts was recorded in Podkarpackie province (1.853), whereas the smallest one was in the Lower Silesia province (0.592).
Analysis of the levels of the total amount and the RDPEF amount of contracts concluded under the measure ‘Creation and development of micro-enterprises’ shows that in most of the provinces, the number of these contracts was below the average level in relation to the Polish provinces under study (Figure 2).
Analysis of the levels of the total amount and the RDPEF amount of contracts concluded shows that the contracts concluded in the Lower Silesia province were much below the average amount for Polish provinces (−0.866), whereas the highest amount compared to the average was recorded in Podkarpackie province (0.395).
The developed econometric imperatives allowed for analysing of the decisions concerning both the number of applications and amounts connected with the individual measures. Based on elasticity analysis, conclusions were formulated as to a relative change in response variables caused by a unit increase in the factors affecting them, with other things held constant.
In particular, for each measure, relationships were examined between:
  • The number of decisions under a given measure for i-th province in period t and the number of applications submitted under a given measure in i-th province in period t;
  • The total amount in respect of the decisions taken under a given measure for i-th province in period t;
  • The total amount applied for under a given measure in i-th province in period t;
  • RDPEF amount in respect of the decisions taken under a given measure for i-th province in period t;
  • RDPEF amount applied for under a given measure in i-th province in period t.
The presented results and generalisations relating to the effects of the analysis in the process of managing agricultural holdings confirm the validity of the programme assumptions and rational absorption of the funds obtained by Poland.
Implementation of certain innovation programmes, e.g., in rural areas, requires incurring significant expenditures. Although there is a wide range of possibilities of financing innovations available on the market today, obtaining funding is not as easy in practice. The wide range of innovation financing options forces programme managers to choose the direction of actions aimed at obtaining co-financing, which means setting the direction of allocating an entity’s financial resources for that purpose.
The presented studies indicate the relationship between the decisions taken/contracts concluded (number, total amount, RDPEF amount) under the RDP and the applications submitted (number, total amount, RDPEF amount) under the measure ‘Creation and development of micro-enterprises’, which, in order to be effective and successful, should depend on the level of infrastructure in rural areas.
The final effect of the presented model will enable assessment of the efficacy of the applications submitted by farmers with respect to presented measures under the Rural Development Programme in Poland. This efficacy was assessed by verifying the potentially submitted number of applications and the amount of financial aid, including from EU funds [60,61,62] requested in the applications. The authors equated this efficacy with rationality [63,64,65,66] of expectations of those managing agricultural holdings. Thus, the level of this efficacy shows the effectiveness of the process of managing micro-enterprises [67,68,69].
The effect stimulating transformations under the measure ‘Creation and development of micro-enterprises’ is investments in modernisation of fixed assets in agricultural holdings and in their environment. A significant role is played by rational management of European funds, in particular the Rural Development Programme 2007–2013 addressed at Polish rural areas. Effective management of these funds is reflected in the growth rate of investment expenditure.
During the RDP 2007–2013 period, investment expenditure in agriculture saw a significant increase in funds connected with the purchase of machinery and technical equipment from 32% in 2007 to 38% in 2010. In 2010, investment expenditure per 1 ha of agricultural area was at PLN 240.
For instance, in the Silesian province a total of PLN 536.1 thousand was paid out during that period, including PLN 429.2 thousand from the EAFRD. Around PLN 34,421 thousand (11%) was earmarked for activities connected with the creation of new jobs and diversification of rural areas. A measurable effect of this measure is also the fact that numerous new jobs were created outside agriculture.
In the Silesian province, 251 applicants received a total of over PLN 21 million, which is over PLN 83 thousand per investment on average (the country’s average is PLN 84,956).
The measure ‘Creation and development of micro-enterprises’ ensured increased employment in rural areas. Under this measure, the Agency for Restructuring and Modernisation of Agriculture concluded 6091 contracts, of which services to the public accounted for 33%, construction and installation works and services accounted for 21%, retail—9%, and tourist services—9%. The amount of the aid granted was PLN 1046 million.
Under this measure, applicants from the Silesian province received between 2009 and 2011 over 10% of all the payments in the country.
The financial aid of PLN 374 million paid under the measure ‘Creation and development of micro-enterprises’ to 2662 applicants contributed to the improvement of economic activity rates among residents of rural areas. In 2009, the employment rate grew by 4.9 pp compared to 2003 and stood at 50.8%. In the same period, the unemployment rate decreased by almost 10 pp and stood at 8% in 2009.
Thus, the Rural Development Programme 2007–2013 had many positive effects that contributed to the development of rural areas in the aspect of managing micro-enterprises.
The infrastructure of micro-enterprises as well as the quality of a variety of services provided by them to the public improved significantly, and a lot of new jobs were created, which is another effect of the implementation of the abovementioned measure.
As the analysis shows, accession to the European Union, inclusion of Polish agriculture within the Common Agricultural Policy, and above all, the highly positive effects of supporting micro-enterprises with aid from European Union funds result from the implementation of sets of key instruments for managing micro-enterprises, which significantly accelerated investment and modernisation changes in the management of micro-enterprises in Poland in rural areas.
The presented studies directly positively determine management of agricultural micro-enterprises and contributes to an increase in agricultural production, emphasising the role of European funds, which constitute a continuously active, relatively sustainable and multi-annual instrument used in the development of rural areas. Properly incorporated in the management process, they contribute to the development of the factors of production, which show strong diversity both in economic and social terms. However, the management of agricultural micro-enterprises and agricultural production growth, which depend on EU support, requires developing appropriate solutions that would provide the basis for activity and contribute to the securing of funds. The presented study has a positive impact on the possibility of successfully managing agricultural holdings using not only financial expenditure but also using the available resources in an optimal way. It is micro-enterprises that play a key role in the development of rural areas in Poland. The positive impact on the management of agricultural holdings and increase in agricultural production, resulting from the study, is reflected in improved profitability thanks to technological modernisation of agricultural micro-enterprises and development of their potential. The results of the presented study can definitely contribute to agricultural holdings’ full or partial adaptation to EU standards. Among the most important investment activities using EU funds are the following examples of projects completed in the Silesian province:
  • Introduction of agri-environmental packages.
  • Rational use of agricultural land while reducing the negative impact of agriculture on the natural environment.
  • Implementation of sustainable agriculture—reduction in fertilisation.
  • Intercropping.
  • Development of a machinery park.
  • Ecological food production.
  • Modernisation of technological production infrastructure.
  • Reduction in production costs.
  • Improvement of work organisation by purchasing new and specialist machinery and equipment.
  • Improvement of economic effects of agricultural micro-enterprises.
  • Establishment of new agricultural holdings by people under the age of 40—generational turnover in agriculture.
  • Increase in income from micro-enterprises through the provision of services, which enables creation of new jobs and self-employment, and in the long-run, reduces the effects of increasing unemployment in Polish rural areas.
  • Improvement of micro-enterprises’ competitiveness and economic effects.
The implementation of the above activities forced micro-entrepreneurs to make their way of thinking, acting, organising and decision-making more flexible, and above all, to manage effectively, and in particular, to learn this process, adapt it, understand its consequences and challenges in order to achieve the abovementioned benefits of the implementation of projects under RDP 2007–2013.

5. Conclusions

The existence of relative deviations from the mean for the individual provinces should be attributed to differences in project management due to flexibility in thinking, acting, decision-making and organising, i.e., determinants of management [70,71] effectiveness in the pursuit of potential benefits by applicants striving to create and develop micro-enterprises. A successful application for aid under the Rural Development Programme also means a success in defining agricultural holdings’ objectives and ways of their implementation, taking into account the factors of production possessed by agricultural holdings, results of the observation of current activities, introduction of necessary adjustments to them and realisation of farmers’ motivation. The proposed models are universal and original, as in each case, they enable relative assessments of the positions of the individual provinces in a given respect as well as appropriate comparisons. The identification of differences across provinces in the realisation of farmers’ expectations, as expressed in the number of submitted applications, can be used to determine the comparative advantage and diversification of employment in the areas under study. They can be used, for instance, for assessing the management [72] of the Rural Development Programme in the current financial perspective.
Effective management [73,74,75] should be viewed as a way of flexible decision-making and organisation that ensures benefits for agricultural holdings. This constitutes the research motive of project management within the Rural Development Programme in Poland.
This original proposal of the integration of the infrastructural development of agricultural holdings in rural areas in Poland uses panel data, based on which it can be shown that when taking future actions under the measure ‘Creation and development of micro-enterprises’, one should take into account integration and management of financial resources, thus, enabling further modernisation and development of investment in the area of the development of micro-enterprises.
The original panel data imperative proposed in the paper enabled evaluation of the effects of the management of agricultural holdings (micro-enterprises) using RDP funds, as recorded in 16 provinces in Poland. The authors, by focusing on the function and role of projects in the management structure in terms of the effects of the programme, wished to point to the significance of an additional factor, i.e., management, which, combined with the other factors, will help complete the development of rural areas. Management in agricultural holdings (micro-enterprises) involves a set of information and abilities to logically piece it together, which bring positive effects for the development of rural areas in the long run. The process of management will be effective if the right factor, i.e., knowledge, is used in practical actions as part of EU programmes. In order to successfully run an agricultural holding, basic management functions need to be used to ensure that rational decisions are taken. Therefore, in the studies presented in this paper, the authors focused on imperatives relating to the decisions taken in respect of submitted applications using an econometric imperative for the measure ‘Creation and development of micro-enterprises’.
The theoretical considerations and analyses presented herein cannot be considered as exhaustive or complete. The number and variety of the problems connected with managing projects related to agricultural holdings in the agri-business system, as well as a lack of clear solutions in that area, require comprehensive and in-depth studies and research. The analyses conducted by the authors provide a basis for further discussions concerning effectiveness of the management of agricultural holdings. Thus, the problem of managing projects and agricultural holdings should be treated as a key dimension of the global environment and challenges faced by agricultural holdings and rural areas in Poland.
The studies and analyses conducted in this paper allow for formulating a paradigm, indicating that co-financing by securing and effectively using EU support leads to a more effective process of managing agricultural holdings in rural areas in Poland.
Due to the expected benefits from EU assistance, agricultural holdings and rural areas are becoming an attractive element of the economy, characterised by integration and coordination of the economic entities operating within that area.

Author Contributions

Conceptualization, A.B. and D.B.; methodology, A.B.; software, D.B.; validation, A.B. and D.B.; formal analysis, A.B.; investigation, A.B.; resources, D.B.; data curation, A.B.; writing—original draft preparation, D.B.; writing—review and editing, A.B.; visualization, A.B.; project administration, A.B.; funding acquisition, A.B. All authors have read and agreed to the published version of the manuscript.

Funding

This research received no external funding.

Conflicts of Interest

The authors declare no conflict of interest.

References

  1. Papke-Shields, K.E.; Boyer-Wright, K.M. Strategic planning characteristics applied to project management. Int. J. Proj. Manag. 2017, 35, 169–179. [Google Scholar] [CrossRef]
  2. Patnaik, S.; Ip, A.W.H.; Tavana, M.; Jain, V. (Eds.) New Paradigm in Decision Science and Management. In Proceedings of ICDSM 2018; Advances in Intelligent Systems and Computing; Springer: Singapore, 2020. [Google Scholar]
  3. Coppin, A. The Human Capital Imperative. Valuing Your Talent; Palgrave Macmillan: Cham, Switzerland, 2017. [Google Scholar]
  4. Kersan-Škabić, I.; Tijanić, L. Regional absorption capacity of EU funds. Econ. Res. Ekon. Istraživanja 2017, 30, 1191–1208. [Google Scholar] [CrossRef]
  5. Hagemann, C. EU Funds in the New Member States: Party Politicization, Administrative Capacities, and Absorption Problems after Accession; Palgrave Macmillan: Cham, Switzerland, 2019. [Google Scholar] [CrossRef]
  6. Wilkin, J. Obszary Wiejskie w Warunkach Dynamizacji Zmian Strukturalnych. In Ekspertyzy do Strategii Rozwoju Społeczno-Gospodarczego Polski Wschodniej do Roku; Ministerstwo Rozwoju Regionalnego: Warszawa, Poland, 2020; Volume 1, pp. 593–616. [Google Scholar]
  7. Guijarro, F.; Martínez-Gómez, M.; Visbal-Cadavid, D. A model for sector restructuring through genetic algorithm and inverse DEA. Expert Syst. Appl. 2020, 154, 13. [Google Scholar] [CrossRef]
  8. Rodríguez-Sánchez, J.L.; Ortiz-de-Urbina-Criado, M.; Mora-Valentín, E.M. Thinking about people in mergers and acquisitions processes. Int. J. Manpow. 2019, 40, 643–657. [Google Scholar] [CrossRef]
  9. Milovanović, D.; Vučenović, S.; Mišić, I. Sources of Financing in the Process of Enterprise Restructuring Focusing on Transitional Countries. In Entrepreneurship in Post-Communist Countries; Ateljević, J., Budak, J., Eds.; Springer: Cham, Switzerland, 2018; pp. 61–75. [Google Scholar] [CrossRef]
  10. Mba, S.U. New Financing for Distressed Businesses in the Context of Business Restructuring Law; Springer: Cham, Switzerland, 2019. [Google Scholar] [CrossRef]
  11. Prdić, N.; Kuzman, B.; Damjanović, J. Marketing Research in the Function of Business Efficiency. Econ. Agric. 2019, 66, 1039–1054. [Google Scholar] [CrossRef] [Green Version]
  12. Lapinskaite, I.; Skvarciany, V.; Janulevicius, P. Impact of Investment Sources for Sustainability on a Country’s Sustainable Development: Evidence from the EU. Sustainability 2020, 12, 2412. [Google Scholar] [CrossRef] [Green Version]
  13. Pereira, V.J.; Martinho, D. The Agricultural Economics of the 21st Century; Springer: Cham, Switzerland, 2015. [Google Scholar] [CrossRef]
  14. Field, H.L.; Long, J.M. Introduction to Agricultural Engineering Technology. In A Problem Solving Approach; Springer: Cham, Switzerland, 2018. [Google Scholar]
  15. Nadykto, V. Modern Development Paths of Agricultural Production. In Trends and Innovations; Springer: Cham, Switzerland, 2019. [Google Scholar]
  16. Moljevic, S. Influence of quality infrastructure on regional development. Int. J. Qual. Res. 2016, 10, 433–452. [Google Scholar] [CrossRef]
  17. Räisänen, J.; Tuovinen, T. Digital innovations in rural micro-enterprises. J. Rural Stud. 2020, 73, 56–67. [Google Scholar] [CrossRef]
  18. Lahner, J. Entwicklung der Wirtschaftsförderung. In Handbuch Innovative Wirtschaftsförderung; Springer: Gabler, Wiesbaden, 2020; pp. 3–24. [Google Scholar] [CrossRef]
  19. Schwab, K. (Ed.) The Global Competitiveness Report 2019. In World Economic Forum; Cologny: Geneva, Switzerland, 2019. [Google Scholar]
  20. Baula, O.; Galaziuk, N.; Zelinska, O. Conceptual Framework for Organizational and Economic Mechanism Formation to Increase the Region Competitiveness with the Globalization of the World Economic Relations. Mapкeтинг Мeнeджмeнт Iннoвaцiй 2017, 2, 76–84. [Google Scholar] [CrossRef] [Green Version]
  21. Staníčková, M.; Fojtíková, L. The Chinese Position as a Global Player in International Comparison with the WTO Members: Efficiency Analysis and 4IR. China WTO Rev. 2020, 1, 7–48. [Google Scholar] [CrossRef]
  22. Kowalska, A.; Tarnowska, A. Innovation of the economies of European Union countries against selected countries in the world in the years 2007–2016. Top. Econ. Bus. Manag. 2017, 1, 334–338. [Google Scholar]
  23. Łyżwa, E. Innowacyjność w sektorze rolno-spożywczym na przykładzie gospodarki Polski i Ukrainy. Probl. World Agric. Probl. Rol. Światowego 2019, 19, 119–128. [Google Scholar] [CrossRef] [Green Version]
  24. Fidlschuster, L.; Dax, T.; Oedl-Wieser, T. Demografischer Wandel, Diversität und Entwicklungsfähigkeit Ländlicher Regionen. In Lebensentwürfe im Ländlichen Raum; Springer: Wiesbaden, Germany, 2016; pp. 7–28. [Google Scholar] [CrossRef]
  25. Neumeier, S. Social innovation in rural development: Identifying the key factors of success. Geogr. J. 2017, 183, 34–46. [Google Scholar] [CrossRef]
  26. Żmija, K. Przedsiębiorczość Pozarolnicza w Procesach Dywersyfikacji Gospodarstw Rolnych w Polsce. Przedsiębiorczość i Zarządzanie Zarządzanie Restrukturyzacją Rozwój i Efektywność w Obliczu Zmian 2019, 20, 55–67. [Google Scholar]
  27. Spoz, A. Innowacyjność Mikro i Małych Przedsiębiorstw a Sharing Economy. Przedsiębiorczość i Zarządzanie Zdolności Innowacyjne Innowacje w MSP i Zarządzaniu Naukowym 2019, 20, 73–90. [Google Scholar]
  28. Serkova, A.E.; Ignatyeva, E.D.; Mariev, O.S.; Lee, V.A. Do Infrastructure Factors Influence Social and Economic Development of Russian Regions? In Rptss 2018—International Conference on Research Paradigms Transformation in Social Sciences; FUTURE ACAD.: Cairo, Egypt, 2018; Volume 50, pp. 1047–1054. [Google Scholar] [CrossRef]
  29. Purwanto, A.J.; Heyndrickx, C.; Kiel, J.; Betancor, O.; Socorro, M.P.; Hernandez, A.; Eugenio-Martin, J.L.; Pawlowska, B.; Borkowski, P.; Fiedler, R. Impact of Transport Infrastructure on International Competitiveness of Europe. Transp. Res. Procedia 2017, 25, 2877–2888. [Google Scholar] [CrossRef]
  30. Adamowicz, M. Zmiany w Systemach Polityki Rolnej i Formach Wsparcia Rolnictwa. Roczniki Naukowe Stowarzyszenia Ekonomistów Rolnictwa i Agrobiznesu. Roczniki 2017. [Google Scholar] [CrossRef]
  31. Drygas, M. Wsparcie rozwoju obszarów wiejskich w Polsce w ramach wspólnej polityki rolnej UE. Studia. Bas. 2016, 4, 101–122. [Google Scholar]
  32. MIŚ, T. Rola funduszy i programów UE w wielofunkcyjnym rozwoju obszarów wiejskich. Pr. Nauk. Uniw. Ekon. We Wrocławiu 2016, 439, 241–252. [Google Scholar]
  33. Sawicki, P. Rozwój MSP w kontekście unijnego wsparcia w perspektywie 2014–2020-dylematy i wyzwania. Zesz. Nauk. ZPSB Firma I Rynek 2019, 1, 49–64. [Google Scholar]
  34. Kozień, E. Ocena sprawności realizacji projektów. In Zeszyty Naukowe/Uniwersytet Ekonomiczny w Krakowie; Seria Specjalna, Monografie, Uniwersytet Ekonomiczny: Kraków, Poland, 2019; Volume 261. [Google Scholar]
  35. Idowu, S.O. (Ed.) Encyclopedia of Corporate Social Responsibility; Springer: Berlin/Heidelberg, Germany, 2013. [Google Scholar]
  36. Maassen, M.A. Sustainable Business Models: An Imperative in the Strategic Management of Companies and Organizations. Manag. Dyn. Knowl. Econ. 2018, 6, 323–335. [Google Scholar]
  37. Bachtler, J.; Begg, I. Cohesion policy after Brexit: The economic, social and institutional challenges. J. Soc. Pol. 2017, 46, 745–763. [Google Scholar] [CrossRef] [Green Version]
  38. Dańska-Borsiak, B. Dynamiczne Modele Panelowe w Badanich Ekonomicznych, Wydawnictwo; Uniwersytetu Łódzkiego: Łódz, Poland, 2011; pp. 14–16. [Google Scholar]
  39. Jurek, W. Estymacja Parametrów Liniowych moDeli Ekonometrycznych Uogólnioną Metodą Najmiejszych Kwadratów. In Estymacja Parametrów Modelu Ekonometrycznego; Guzik, B., Jurek, W., Eds.; Ekonometria z zadaniami, Wydawnictwo Akademii Ekonomicznej: Poznań, Poland, 1993; pp. 83–90. [Google Scholar]
  40. Szajt, M. Działalność Badawczo—Rozwojowa w Kształtowaniu Aktywności Innowacyjnej w Unii Europejskiej; Wydawnictwo Politechniki Częstochowskiej: Częstochowa, Poland, 2010; p. 148. [Google Scholar]
  41. Dacko, A.; Dacko, M. Studia nad rozwojem obszarów wiejskich—od paradygmatu wzrostu do rezyliencji. Wieś Rol. 2018, 2, 49–64. [Google Scholar]
  42. Sakai, T. Laboratory Experiments in Information Retrieval; The Information Retrieval Series 40; Springer: Singapore, 2018. [Google Scholar] [CrossRef]
  43. Schumacker, R.; Tome, S. Understanding Statistics Using R; Springer: New York, NY, USA, 2013. [Google Scholar]
  44. Lovric, M. (Ed.) International Encyclopedia of Statistical Science; Springer: Berlin/Heidelberg, Germany, 2011. [Google Scholar]
  45. Michalos, A.C. (Ed.) Encyclopedia of Quality of Life and Well-Being Research; Springer: Dordrecht, The Netherlands, 2014. [Google Scholar]
  46. Shekhar, S. Encyclopedia of GIS; Springer: Cham, Switzerland, 2017. [Google Scholar]
  47. Neusser, K. Time Series Econometrics; Springer Texts in Business and Economics; Springer: Cham, Switzerland, 2016. [Google Scholar]
  48. Bokovets, V.V.; Zamkova, N.L.; Makhnachova, N.M. Assessment of the Effectiveness of Enterprise Management Components in Modern Conditions. Sci. Bull. Polissia 2017, 4, 27–32. [Google Scholar] [CrossRef] [Green Version]
  49. Nenadal, J. Adequacy, Suitability, Effectiveness and Efficiency of Quality Management Systems: How to Perceive and Assess them? Qual. Innov. Prosper. 2016, 20, 39–52. [Google Scholar] [CrossRef] [Green Version]
  50. Hart, M. The Design of Integrated Logistics Management System of an Industrial Company, LOGI 2017. MATEC Web Conf. 2017, 134, 7. [Google Scholar] [CrossRef] [Green Version]
  51. Mamun, A.A.; Fazal, S.A. Effect of entrepreneurial orientation on competency and micro-enterprise performance. Asia Pac. J. Innov. Entrep. 2018, 12, 379–398. [Google Scholar] [CrossRef] [Green Version]
  52. Chin, O.; Nor, M.M. Does the Micro Financing Term Dictate the Performance of Micro Enterprises? Procedia Econ. Financ. 2016, 35, 281–286. [Google Scholar] [CrossRef] [Green Version]
  53. Gherhes, C.; Williams, N.; Vorley, T.; Vasconcelos, A.C. Distinguishing micro-businesses from SMEs: A systematic review of growth constraints. J. Small Bus. Enterp. Dev. 2016, 23, 939–963. [Google Scholar] [CrossRef]
  54. Lussier, R.N.; Sonfield, M.C. “Micro” versus “small” family businesses: A multinational analysis. J. Small Bus. Enterp. Dev. 2015, 22, 380–396. [Google Scholar] [CrossRef] [Green Version]
  55. Pietrzykowski, R. Klasyfikacja Obiektów w Ujęciu Czasowo-Przestrzennym z Zastosowaniem Analizy Funkcjonalnej. Prace Naukowe Uniwersytetu Ekonomicznego we Wrocławiu Taksonomia Klasyfikacja i Analiza Danych—Teoria i Zastosowania 2018, 508, 170–179. [Google Scholar]
  56. Strojny, J.; Musiał, W. Obszary wiejskie w systemie ekonomiczno-społecznym państw Unii Europejskiej. Zesz. Nauk. SGGW Polityki Eur. Finans. Mark. 2019, 22. [Google Scholar] [CrossRef]
  57. Kozak, S.; Nagel, S.; Santosh, S. Shrinking the cross-section. J. Financ. Econ. 2020, 135, 271–292. [Google Scholar] [CrossRef]
  58. Górna, J.; Górna, K. Modelowanie Wzrostu Gospodarczego z Wykorzystaniem Narzędzi Ekonometrii Przestrzennej. Prace Naukowe Uniwersytetu Ekonomicznego we Wroclawiu 2016, 427. [Google Scholar]
  59. Geise, A. Przestrzenno-czasowe modelowanie zmienności produkcji w sektorach mikro-, małych, średnich i dużych przedsiębiorstw w Polsce. Przegląd Stat. 2013, 60, 269–282. [Google Scholar]
  60. López-Bazo, E.; Royuela, V. Citizens’ perception of the Cohesion Policy and support for the European Union. Reg. Sci. Policy Pr. 2019, 11, 733–749. [Google Scholar] [CrossRef] [Green Version]
  61. Rodríguez-Pose, A.; Courty, J. Regional lobbying and Structural funds: Do regional representation offices in Brussels deliver? Reg. Fed. Stud. 2018, 28, 199–229. [Google Scholar] [CrossRef]
  62. Novosák, J.; Hájek, O.; Horváth, P.; Nekolová, J. Structural Funding and Intrastate Regional Disparities in Post-Communist Countries. Transylv. Rev. Adm. Sci. 2017, 51, 53–69. [Google Scholar] [CrossRef] [Green Version]
  63. Calabretta, G.; Gemser, G.; Wijnberg, N.M. The Interplay between Intuition and Rationality in Strategic Decision Making: A Paradox Perspective. Organ. Stud. 2017, 38, 365–401. [Google Scholar] [CrossRef] [Green Version]
  64. Cristofaro, M. Herbert Simon’s bounded rationality its historical evolution in management and cross-fertilizing contribution. J. Manag. Hist. 2017, 23, 170–190. [Google Scholar] [CrossRef]
  65. Bogt, H.; Scapens, R.W. Institutions, situated rationality and agency in management accounting: A research note extending the Burns and Scapens framework. Account. Audit. Account. J. 2019, 32, 1801–1825. [Google Scholar] [CrossRef] [Green Version]
  66. Molthan-Hill, P. Making the business case? Intercultural differences in framing economic rationality related to environmental issues. Crit. Perspect. Int. Bus. 2015, 11, 72–91. [Google Scholar] [CrossRef] [Green Version]
  67. Leibus, I. Tax Incentives for Micro Enterprises—Latvia’s Experience. In Proceedings of the 2019 International Conference “ECONOMIC SCIENCE FOR RURAL DEVELOPMENT”, Jelgava, Latvia, 9–10 May 2019; Volume 52, pp. 287–295. [Google Scholar]
  68. Al, M.A.; Ibrahim, M.D. Development Initiatives, Micro-Enterprise Performance and Sustainability. Int. J. Financ. Stud. 2018, 6, 15. [Google Scholar]
  69. Faherty, U.; Stephens, S. Innovation in micro enterprises: Reality or fiction? J. Small Bus. Enterp. Dev. 2016, 23, 349–362. [Google Scholar] [CrossRef]
  70. Weske, M. Business Process Management: Concepts, Languages, Architectures; Springer: Berlin/Heidelberg, Germany, 2019. [Google Scholar]
  71. Hyötyläinen, T. Steps to Improved Firm Performance with Business Process Management: Adding Business Value with Business Process Management and its Systems; Springer: Wiesbaden, Germany, 2015. [Google Scholar]
  72. Dumas, M.; La Rosa, M.; Mendling, J.; Reijers, H.A. Fundamentals of Business Process Management; Springer: Berlin/Heidelberg, Germany, 2018. [Google Scholar] [CrossRef]
  73. Ma, J.; Wang, J.; Szmedra, P. Economic Efficiency and Its Influencing Factors on Urban Agglomeration—An Analysis Based on China’s Top 10 Urban Agglomerations. Sustainability 2019, 11, 5380. [Google Scholar] [CrossRef] [Green Version]
  74. He, M.-L.; Jiang, O.; Hong, Z. Mathematical analysis of financial decentralization and economic efficiency in both state-owned and private enterprises. Concurr. Comput. Pr. Exp. 2019, 31, e4750. [Google Scholar] [CrossRef]
  75. Čaušević, F. Global Financial Centers, Economic Power, and (in) Efficiency, Palgrave Pivot; Springer: Cham, Switzerland, 2020. [Google Scholar]
Figure 1. Differences in the levels of decomposed intercepts in imperative DLT. Source: own study.
Agriculture 10 00294 g001
Figure 2. Differences in the levels of decomposed intercepts in imperatives DKT and DET. “0” means the value of the average level of parameter estimations with artificial variables for the provinces under study. Source: own study.
Agriculture 10 00294 g002
Table 1. Standard deviations of the estimations of structural parameters, values of t-statistic in the imperative DLT.
VariableParameter Errort-Statistic
lnWLT0.00897.625
Lower Silesian0.107−4.299
Lubelskie0.1094.752
Lesser Poland0.1092.835
Opole0.1092.128
Podkarpackie0.1105.100
Podlaskie 0.1094.312
Silesian0.1073.636
Świętokrzyskie 0.1104.782
Warmia-Masurian0.1102.164
Greater Poland0.1113.495
R20.941
F(10.21)50.280
−0.150
Ve (in per cent)3.33
p-value was less than 0.044 for all of the presented variables, number of observations was 32. Source: own calculations using the package Limdep.
Table 2. Values of the decomposed intercepts after undoing the logarithm in imperative DLT.
VariableParameter Errort-Statistic
Lower SilesianηD0.631
LubelskieηL1.679
Lesser PolandηM1.362
OpoleηO1.261
PodkarpackieηP1.752
Podlaskie ηPD1.600
SilesianηS1.476
Świętokrzyskie ηSW1.692
Warmia-MasurianηWM1.269
Greater PolandηW1.474
Detailed statistics relating to decomposed intercepts
xmax1.752
xmin0.631
Range1.121
Source: own calculations.
Table 3. Values of the decomposed intercepts after undoing the logarithm in imperative DLT.
VariableImperative DKTImperative DET
Parameter Errort-StatisticParameter Errort-Statistic
constant0.189−2.9840.174−3.563
lnWKT0.05514.600
lnWET 0.05514.600
Lower Silesian0.125−4.2000.125−4.200
Lubelskie0.1234.6020.1234.602
Lesser Poland0.1232.9350.1232.935
Opole0.1231.7320.1231.732
Podkarpackie0.1264.8970.1264.897
Podlaskie 0.1234.0980.1234.098
Pomorskie0.1231.5450.1231.545
Silesian0.1244.1370.1244.137
Świętokrzyskie 0.1244.2020.1244.202
Warmia-Masurian0.1242.3390.1242.339
Greater Poland0.1343.5450.1343.545
R20.943
F(12.19)44.140
−0.161
Ve (in per cent)6.537.41
Source: own calculations.
Table 4. Values of the decomposed intercepts after undoing the logarithm in imperative DLT.
VariableImperative DKTImperative DET
ParameterEstimation of the Parameter (Elasticity)ParameterEstimation of the Parameter (Elasticity)
Lower SilesianψD0.592ϑD0.592
LubelskieψL1.761ϑL1.761
Lesser PolandψM1.435ϑM1.435
OpoleψO1.237ϑO1.237
PodkarpackieψP1.853ϑP1.853
Podlaskie ψPD1.655ϑPD1.655
PomeraniaψPM1.209ϑPM1.209
SilesianψS1.670ϑS1.670
Świętokrzyskie ψSW1.684ϑSW1.684
Warmia-MasurianψWM1.336ϑWM1.336
Greater PolandψW1.608ϑW1.608
xmax1.853
xmin0.592
Range1.261
Source: own calculations.

