Article

Application of Plant Growth Regulators on Soft White Winter Wheat under Different Nitrogen Fertilizer Scenarios in Irrigated Fields

1
Hermiston Agricultural Research and Extension Center, Oregon State University, Hermiston, OR 97838, USA
2
Institute of Industrial and Forage Crops, Hellenic Agricultural Organization-“Demeter”, 41335 Larissa, Greece
3
Columbia Basin Agricultural Research Center, Oregon State University, Adams, OR 97810, USA
4
Aberdeen Research and Extension Center, University of Idaho, Aberdeen, ID 83210, USA
5
Eastern Oregon Agriculture and Natural Resources Program, La Grande, OR 97850, USA
*
Author to whom correspondence should be addressed.
Submission received: 13 June 2020 / Revised: 13 July 2020 / Accepted: 14 July 2020 / Published: 20 July 2020
(This article belongs to the Special Issue Innovative Agronomic Practices for Maximizing Crop Growth and Yield)

Abstract

:
Lodging in cereal crops can result in yield loss and harvesting difficulties for growers. Application of plant growth regulator (PGR) has been an indispensable management practice to reduce lodging problems that are often exacerbated during high wind growing conditions and/or high nitrogen (N)/water environments, but the data is limited in the Columbia Basin of Oregon. The objective of this research was to evaluate the effect of two PGR products (chlormequat chloride-CC, trinexapac-ethyl-TE) at different rates and application timings on two soft white winter wheat varieties (ORCH-102 and SY Ovation). Crop growth (stem height and thickness), yield-related (spike density as ears m−2, seeds per spike, grain weight) and quality parameters (test weight, protein) were measured for two cropping seasons from October 2017 to July 2019 following the application of the two PGR products at tillering (GS21-26), stem elongation (GS30-32), and/or flag leaf (GS37-39) stages under a high-N fertilizer scenario. In both growing seasons, no lodging problems were recorded for any treatments. The plant height was reduced after PGR application, but the impact on stem thickness was limited. PGR application slightly affected wheat yield, yield components, testing weight, and protein level in both growing seasons. Our results suggested that the effect of PGR application is relatively limited if no lodging problem occurred.

1. Introduction

Soft white winter wheat (SWWW) (Triticum aestivum L.) is among the most important grain crops in the Columbia Basin of Oregon, and its production viability depends greatly on the adoption of newly released high-yielding varieties. Therefore, there is a need for updated information on how to best integrate these varieties into intensive production systems [1]. Wheat cultivated in the irrigated fields of the Columbia Basin is grown under various rotational schemes with potatoes, onions, corn, seed grasses, grain legumes, etc. Sustainable wheat production depends on high-yielding varieties responsive to inputs and cost-effective management practices, including efficient use of irrigation water, fertilizers, and pesticides.
The most yield-limiting nutrient for wheat is usually nitrogen (N) even though its optimum level of application is difficult to assess and depends on previous crop and soil type. The consideration of N mineralization plus accurate ammonium-N (NH4+-N) and nitrate-N (NO3-N) in soil tests is important in order to predict the amounts of fertilizer applications in both non-tilled (NT) and conventionally tilled (CT) wheat cropping systems. Horneck et al. [2] reported that the irrigated SWWW requires 308 to 336 kg N ha−1 to achieve optimum yield provided that the plant rooting depth is adequate, and irrigation water is sufficient. Under optimum conditions, wheat yields of 12.6 t ha−1 can be achieved [2]. Most commonly, N applications may be split as two times, i.e., in fall at planting and the next spring. It has been found that when wheat is sowed from October to early November under CT systems, it usually does not benefit from “starter” fertilizers when phosphorus (P) and potassium (K) in soil tests are adequate because the previous crop (e.g., grass seed, legumes, peppermint, or vegetable crops) most likely has provided a small amount of N [2,3]. In case that the winter wheat is planted after a crop with limited residual N in the soil (e.g., cereal crops) or it is planted later than the schedule, a small amount of N as 22–34 kg N ha−1 is needed [2,4]. Spring N application plays a very important role in wheat yield. Generally, the residual NO3-N at 60 cm (even 90 cm) and the residual NH4+-N at 30 cm will be factored as soil available N when calculating supplemental N application rates [2]. Other factors include the previous crops and yield target in order to decide fertilizer N application rate.
A chronic worldwide constraint to sustainable wheat production is lodging that often decreases photosynthetic ability and biomass production, deteriorates seed quality, and creates difficulties to harvest operations [5,6,7]. Wheat and rice are highly prone to lodging during late vegetative growth and at reproductive stages [8,9], exaggerating the need for additional research efforts. Lodging in cereals can be defined as the permanent displacement of stems from the vertical position, which could result from either plastic failure of the stem base (stem lodging) or failure of the belowground anchorage system (root lodging) [7]. Both stem and root lodging can be classified as plant lodging [10,11]. Wheat grain yield reduction due to lodging varies between genotypes and can reach 8–61% [7,12,13]. However, genetics are not the only reason for resistance to lodging [14]; several agronomic management practices can also affect the production of thicker stems and stronger root systems [15,16]. Nitrogen levels, plant density, sowing date, seed type, soil strength, light intensity, soil moisture, diseases (i.e., eyespot infection), as well as weather extremes, such as wind speed and heavy rainfall, are all factors contributing to lodging [8]. Under high plant densities and/or luxuriant N applications, cereal crops substantially elongate stems, which can increase the risk of lodging and a significant reduction in yield [7,8,16].
In field practices, three plant growth stage scales, such as BBCH scales [17], Zadoks scale [18] and Feekes scale [19], are often referred in deciding the PGR application timing. In order to prevent lodging in winter wheat, many of the available plant growth regulators (PGRs) are applied prior to and/or during stem elongation (BBCH GS30-32) with the aim to produce lower internodes with shorter lengths (between 7 and 20 cm depending on variety and PGR applications), thicker stems and stem cell walls. PGRs are synthetic compounds that either mimic plant hormones or interrupt biosynthesis of plant hormones, which may alter the growth and development of the plant [20]. By reducing the overall plant height or increasing stem thickness, applications of PGRs may lessen the lodging potential of plants. Currently, there are five classes of plant hormones (i.e., auxin, gibberellin, cytokinin, ethylene, and abscisic acid) which can affect plant growth individually or interactively [20].
PGRs are effective if applied at the proper crop growth stage. Splitting applications may increase the likelihood of matching application timing with appropriate growing conditions and phonological stage. Selective breeding has produced wheat varieties, which are semi-dwarf, due to the presence of Rht genes, which were selected for good stem strength and lodging resistance [3]. When semi-dwarf genes are absent, applications of PGRs could reduce lodging occurrence. Applications of PGRs are also found to increase the number of the seeds produced per unit area, thus becoming a well-adopted practice for cereal productions in Europe (e.g., France, Germany, and the UK), New Zealand, United States, and South America (i.e., Chile). Harvest index may also be increased by producing a greater grain yield and by reducing biomass produced [9,21].
The role of several main PGRs was found as inhibiting gibberellin biosynthesis at an early stage (e.g., chlormequat chloride (CC) and mepiquat chloride) or at a late stage (e.g., trinexapac-ethyl (TE) and prohexadione-Ca) or releasing ethylene (i.e., Ethephon) [22]. Cereal growers have used Chlormequat chloride for over 60 years [9], as an important group of PGRs for growth retardants. The use of CC to control lodging in wheat is considered the largest application for PGRs [23,24]. Trinexapac-ethyl (4-(cyclopropyl-a-hydroxymethylene)-3, 5-dioxo-cyclohexanecarboxylic acid ethylester) was introduced a few decades ago as an acylcyclohexanedione inhibitor of the 3b-hydroxylation of gibberellic acid [22,25]. It offers more flexibility in the timing of application and is commercially labeled as Palisade EC™ and registered in the United States by Syngenta Crop Protection Inc. According to its label, common application rates for cereal crops range from 841 to 1009 g ha−1. The optimum time for TE application is at the onset of stem elongation (GS30-32) and before the emergence of the flag leaf (GS37-39). TE may interfere with the biosynthesis of gibberellic acid to reduce cell elongation, and as a result, it shortens the internodes and strengthens the stem. A shorter and thicker stem may help cereal crops reduce lodging and improve yields. Applications of TE in combination with N applications as early as pseudo-stem erection (GS30) has gained more interest in the Columbia Basin of Oregon as a means to reduce lodging and potentially improve winter wheat yields, but in-depth research is still limited.
In order to better understand the interaction of N fertilization and PGR applications (CC, TE) on wheat growth and productivity, in-depth research on effects of PGRs on grain yield and quality across different classes of wheat cultivars is needed. It is indispensable to guarantee that farmers in the region have the tools and management options necessary to maximize profitability; therefore, it is very important for them to better understand their agronomic management options when growing irrigated SWWW on fields with high soil N, such as those of Columbia Basin of Oregon. Precise application and kind of PGRs at the optimum growth stage to individual SWWW cultivars may achieve more consistent grain yield gains. From 2017 to 2019, we conducted two field trials with two predominantly grown SWWW cultivars. Through evaluating lodging potential, plant growth, yield, and yield components, the objectives of the study were: (i) To examine how applications of PGRs affect growth and production of SWWW under high N rates as early as stem elongation and/or flag leaf emergence; and (ii) to determine the interactions of N fertilization and PGR application and identify the best combination of N rate and PGR application to reduce lodging and improve grain yield and quality.

2. Materials and Methods

2.1. Experimental Location

Field trials were conducted at the Oregon State University-Hermiston Agricultural Research and Extension Center, Hermiston, OR (Latitude: 45°50′25″ N, Longitude: 119°17′22″ W, and Elevation above sea level: 140 m) from 2017 to of 2019 on an Adkins fine sandy loam (mesic Fluvaquentic Endoaquepts) soil. Soil properties can be referred to in Table 1. The location of the study belongs to a semi-arid climate with an annual precipitation of 264 mm, an averaged low temperature of 5 °C, and an averaged high temperature of 18.9 °C [26].

2.2. Plant Material

Two widely grown SWWW varieties that are regionally well adapted were selected for the present study: ORCF-102 and SY Ovation. The choice of these SWWW varieties was based on reasons related to resistance on disease pressure, on grain yield target and grain quality specifications and seed availability. These varieties are popular among farmers in Columbia Basin of Oregon. ORCF-102 is a variety developed by Oregon State University and the BASF Corporation in cooperation with USDA-ARS. It is an awned, short-statured, semi-dwarf variety with high yields across a wide range of environments in Oregon and Washington and disease resistance (e.g., straw breaker (eyespot) footrot, and current races of stripe rust) [27]. Straw strength of ORCF-102 is good, and lodging has not been observed in any production environment. SY Ovation is a short-statured SWWW variety with medium maturity and released in 2012 by AgriPro (Syngenta Cereals). It has been listed with a consistently high yield potential across the Pacific Northwest, with good straw strength and disease resistance [28]. It is well adapted in moderate to high rainfall regions of western Idaho, eastern Washington, north-central and northeastern Oregon and in irrigated production in Washington and the southern Snake River region of Idaho.

2.3. Planting and Management

Both varieties were sowed on 30 October 2017, and 26 October 2018, under a central pivot irrigation system. The irrigation was scheduled from April to June in each growing season with a water amount of 54.6, 144.8, and 139.7 mm in the 2017–2018 trial and of 50.8, 148.1, 197.1 mm in the 2018–2019 trial, respectively. The precipitation in March, April, May, and June was 11.7, 36.3, 15.5, and 7.4 mm in the 2017–2018 trial and 18.8, 26.2, 29.7, and 3.6 mm in the 2018–1029 trial.
In both growing seasons, sowing density was 300 seeds m−2 and sowing depth 1.3 cm. Each variety was sowed with a 9-row cone planter in a pass of 2 m wide. Plot dimensions were 2 by 10 m. For each variety, there were 36 plots in the first trial and 40 plots in the second trial, respectively, arranged in a randomized complete block design with four replicates. In both seasons, a starter fertilizer (a combination of urea (CH₄N₂O) and ammonium sulfate ((NH4)2SO4)), including 67 kg N ha−1 and 11 kg S ha−1 was incorporated into the soil prior to planting to a depth of 20 cm.
In spring, N and S fertilizers were top-dressed to satisfy the requirements of plant growth and grain production according to Oregon State University production guide. Seasonal fertilizers were applied on 30 March 2018, for the first trial. Within the trial, one treatment did not receive any fertilizer (N0), one treatment received 168 kg N ha−1, 22 kg S ha−1, and 0.6 kg Zn ha−1 (normal N regime, N1) that was consistent with growers’ practices in the region, and seven treatments received 280 kg N ha−1, 22 kg S ha−1, and 0.6 kg Zn ha−1 (high N regime, N2), (Table 2). Throughout the trial, the total N rates were 67, 235, and 347 kg ha−1 for N0, N1, and N2, respectively.
In the second trial, one treatment did not receive any fertilizer (N0), while nine treatments received a total amount of 168 kg N ha−1, 22 kg S ha−1, and 0.6 kg Zn ha−1 on 3 April 2019, which represented the growers’ standard practices (N1). Among these treatments, on 19 April 2019, eight treatments received an additional 168 kg N ha−1 to create high N regimes (N2). Based on the observations of the first trial in 2018 where no lodging occurred when a high amount of N fertilizer was applied in one dose, it was decided to split the N fertilization into two doses. The split N fertilizer application strategy was used in order to minimize N losses through leaching (due to the coarse-textured soil types) and improve N use efficiency. Throughout the trial, the total N rates were 67, 235, and 403 kg ha−1, for N0, N1, and N2, respectively. For both trials, the high N regimes were applied in order to promote the occurrence of lodging and to thoroughly test the efficacy of the PGR products.

2.4. Application of PGRs

The PGR treatments were applied in April and May in 2018 and 2019, respectively, including all combinations of PGR products, application rates, and timing (Table 2). The PGR products include Palisade (a.i. 12% TE) and Adjust (Pending Registration; a.i. 55% CC). The PGR application timing was at three BBCH plant growth stage, i.e., tillering (GS21-26), stem elongation (GS30-32), and flag leaf (GS37-39).
In the first trial, PGRs were applied to plots of high N regimes, including 1.004 L ha−1 of Adjust (a.i.) applied at GS30-32 (CC-A), GS37-39 (CC-B), and at both stages (i.e., 10.562 L ha−1 at GS30-32 and 0.442 L ha−1 at GS37-39) (CC-AB). Additionally, 0.126 L ha−1 of Palisade (a.i.) applied at GS30-32, a combination of 0.126 L ha−1 of Palisade (a.i.) applied at GS30-32 and 0.442 or 1.004 L ha−1 of Adjust (a.i.) applied at GS37-39, representing as TE, TE/CC1, and TE/CC2, respectively, as well as a non-PGR application control (N2). In the second trial, additional treatment with 1.004 L ha−1 of Adjust (a.i.) was applied during the tillering stage (GS21-26), representing as CC-C. Meanwhile, a normal N treatment (N1) and non-fertilizer treatment (N0) were included in the trial. The PGR applications were sprayed on crop foliage using a backpack sprayer. For the first trial, the PGR applications were carried out on 21–22 April at GS31-32 stage and/or on 4 May 2018, at GS37-39. For the second trial, PGRs were applied on 3 April, during GS21-26, 20 April during GS30-32, and/or 22 May 2019, during GS39. It should be noted that herbicide or fungicides were not co-applied as a tank mix with PGR treatments.

2.5. Plant Growth, Yield Measurement, and Data Analysis

The lodging resistance score was assessed with visual field observations with a numeric scale from 1–9, representing as the most serious-lodging to no-lodging status. Plant height (cm) and stem thickness (mm) were measured twice: At water ripe when first grains have reached half of their final size (GS 71) on 25 May 2018 and on 3 June 2019, and at physiological maturity (GS92) on 25–26 June 2018 and on 15–17 July 2019, respectively.
Plots were harvested using a small-plot combine on 31 July 2018 and 1 August 2019. Grain yield (t ha−1), grain moisture (%), protein content (%), test weight (kg L−1), and thousand kernel weight (g) were measured. One week before harvesting, plants were cut at soil surface from one middle row in each plot in a length of 0.5 m. Plant samples were dried in an air-forced oven at 65 °C to a constant weight and separated into vegetative tissues (including leaf and stem) and spikes. The number of spikes were counted from each plant sample and converted to spike density (ear m−2). The number of grains per spike was counted from 10 randomly selected spikes that were manually threshed. Grain weight (g) was measured from two random samples of 50 grains from each plant sample and converted to 1000 seed weight (g).
Data were analyzed using the GLIMMIX procedure (SAS 9.4, SAS institute 2008) by separating trials and varieties. In each trial and variety, treatments of N rate and PGR application were treated as fix effects and block as a random effect. Since the statistical analysis indicated that there were no significant treatment × year interactions, data are presented over the years. Means were separated using the LSD test at the 5% level when the F-test was significant. Pearson’s correlation coefficients between wheat parameters were determined using PROC CORR.

3. Results and Discussion
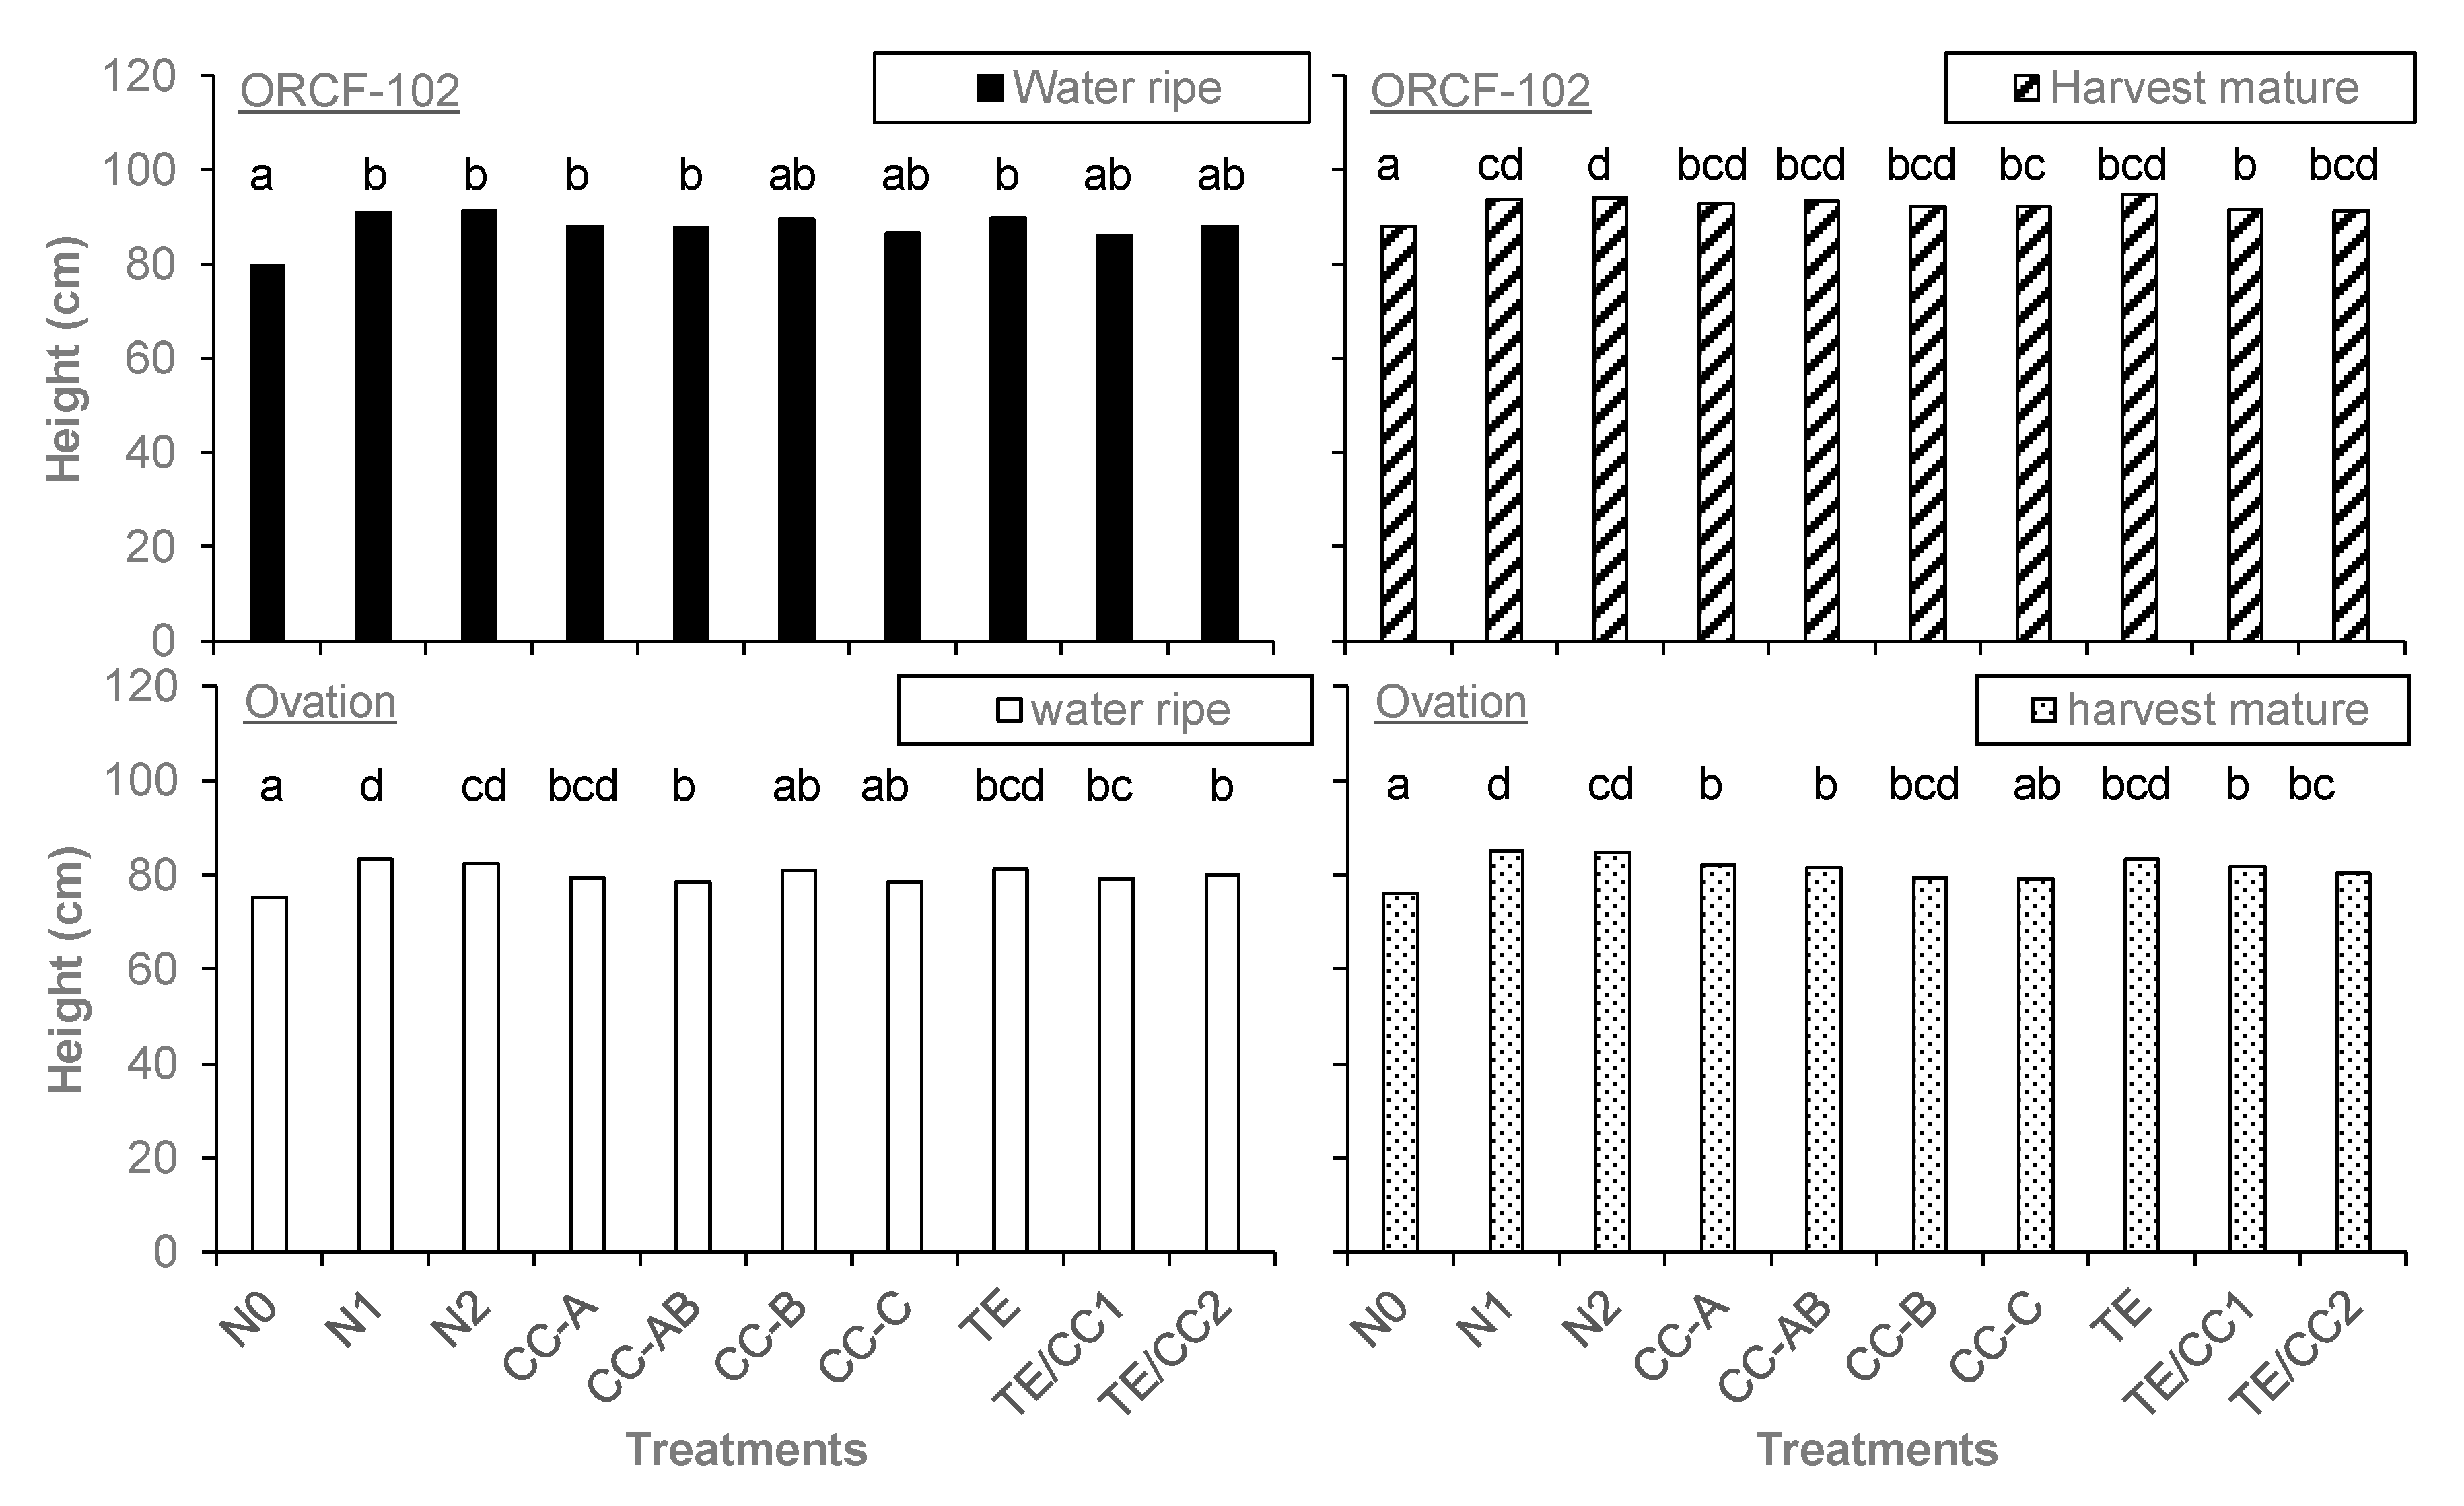
3.1. Plant Growth

In both trials, the two SWWW varieties exhibited markedly shorter plant height at the two monitoring stages, GS71 or GS92 under the N0 treatment as compared to the rest treatments that included a combination of N fertilizer and PGRs (p < 0.05) (Figure 1). These observations were rather expectable since insufficient N supply may significantly affect crop growth.
At GS71, no significant differences were found for the height of ORCF-102 regardless of PGRs application. When the growth stage reached GS92, the height under N2 was the tallest (94.0 cm) among the treatments. The plant height of TE/CC11 and CC-C was shorter than N2 significantly (p < 0.05) (Figure 1).
For SY Ovation at GS71, plants under the CC-AB, CC-B, CC-C, TE/CC1, and TE/CC2 treatments were shorter than the N1 treatment (p < 0.05). At GS92, wheat plants under CC-A, CC-AB, CC-C, TE/CC1, and TE/CC2 treatments were shorter than the N1 treatments. No significant differences were found for the plant height under the N1 and N2 treatments at either growth stage, suggesting that the seasonal N application rate of 168 kg ha−1 is sufficient for wheat growth in the studied field conditions.
Our data indicated that PGRs reduce the plant height of SWWW, especially during the early growing stage (tillering; GS21-26). Among the PGR treatments, the application of CC at tillering (CC-C) produced a shorter plant height compared to the treatments without PGR applications (e.g., N1 and N2), suggesting that an early application of PGR (at tiller stage) might be an effective solution on controlling plant height, which was an earlier application date than the common practices with PGR applied at GS30-32 or GS37-39. Under the conditions of the present experiments when comparing the effect of CC and TE, no conclusive remark can be made, suggesting that CC may play a similar role as TE in winter wheat. Similarly, the application of PGRs on reducing wheat height was reported in other studies (e.g., [29,30,31]). In a Canadian study, Zhang et al. [32] reported that both TE and CC reduced plant height of six spring wheat cultivars. They also found the synergistic effect on reducing plant height when co-application of TE and CC were administered [32], which was not identified in our studies.
In contrast to stem height, no significant differences were found in stem thickness (or diameter of the stem) among the treatments in this study (data not shown). The stem thickness ranged from 3.5 to 3.8 mm for ORCF-102 and 3.6–3.9 mm for SY Ovation. Different from our findings, the application of PGRs was generally reported to thicken and strengthen stem thickness of cereal crops (e.g., References [32,33]). In general, the treatment without fertilization (N0) produced the smallest stem thickness although no difference was found statistically, because the N supply is not sufficient for promoting the wheat growth in the treatment without N fertilization.
As one of the most important traits, lodging control is commonly reported in studies. For example, the significant effect of TE and CC application on lodging control was reported in a Canadian study [32]. Wiersma et al. [31] reported that a PGR named Ethephon reduced the lodging problem of winter wheat. Webster and Jackson [30] found that PGRs delayed the severity of the lodging problem. However, it should be noted that throughout the field trials, no lodging occurred in our field trials, most possibly because the selected varieties have excellent straw strength. Therefore, the effectiveness of PGRs application on lodging should be evaluated with other varieties that are popular, but have relatively weak straw strength.

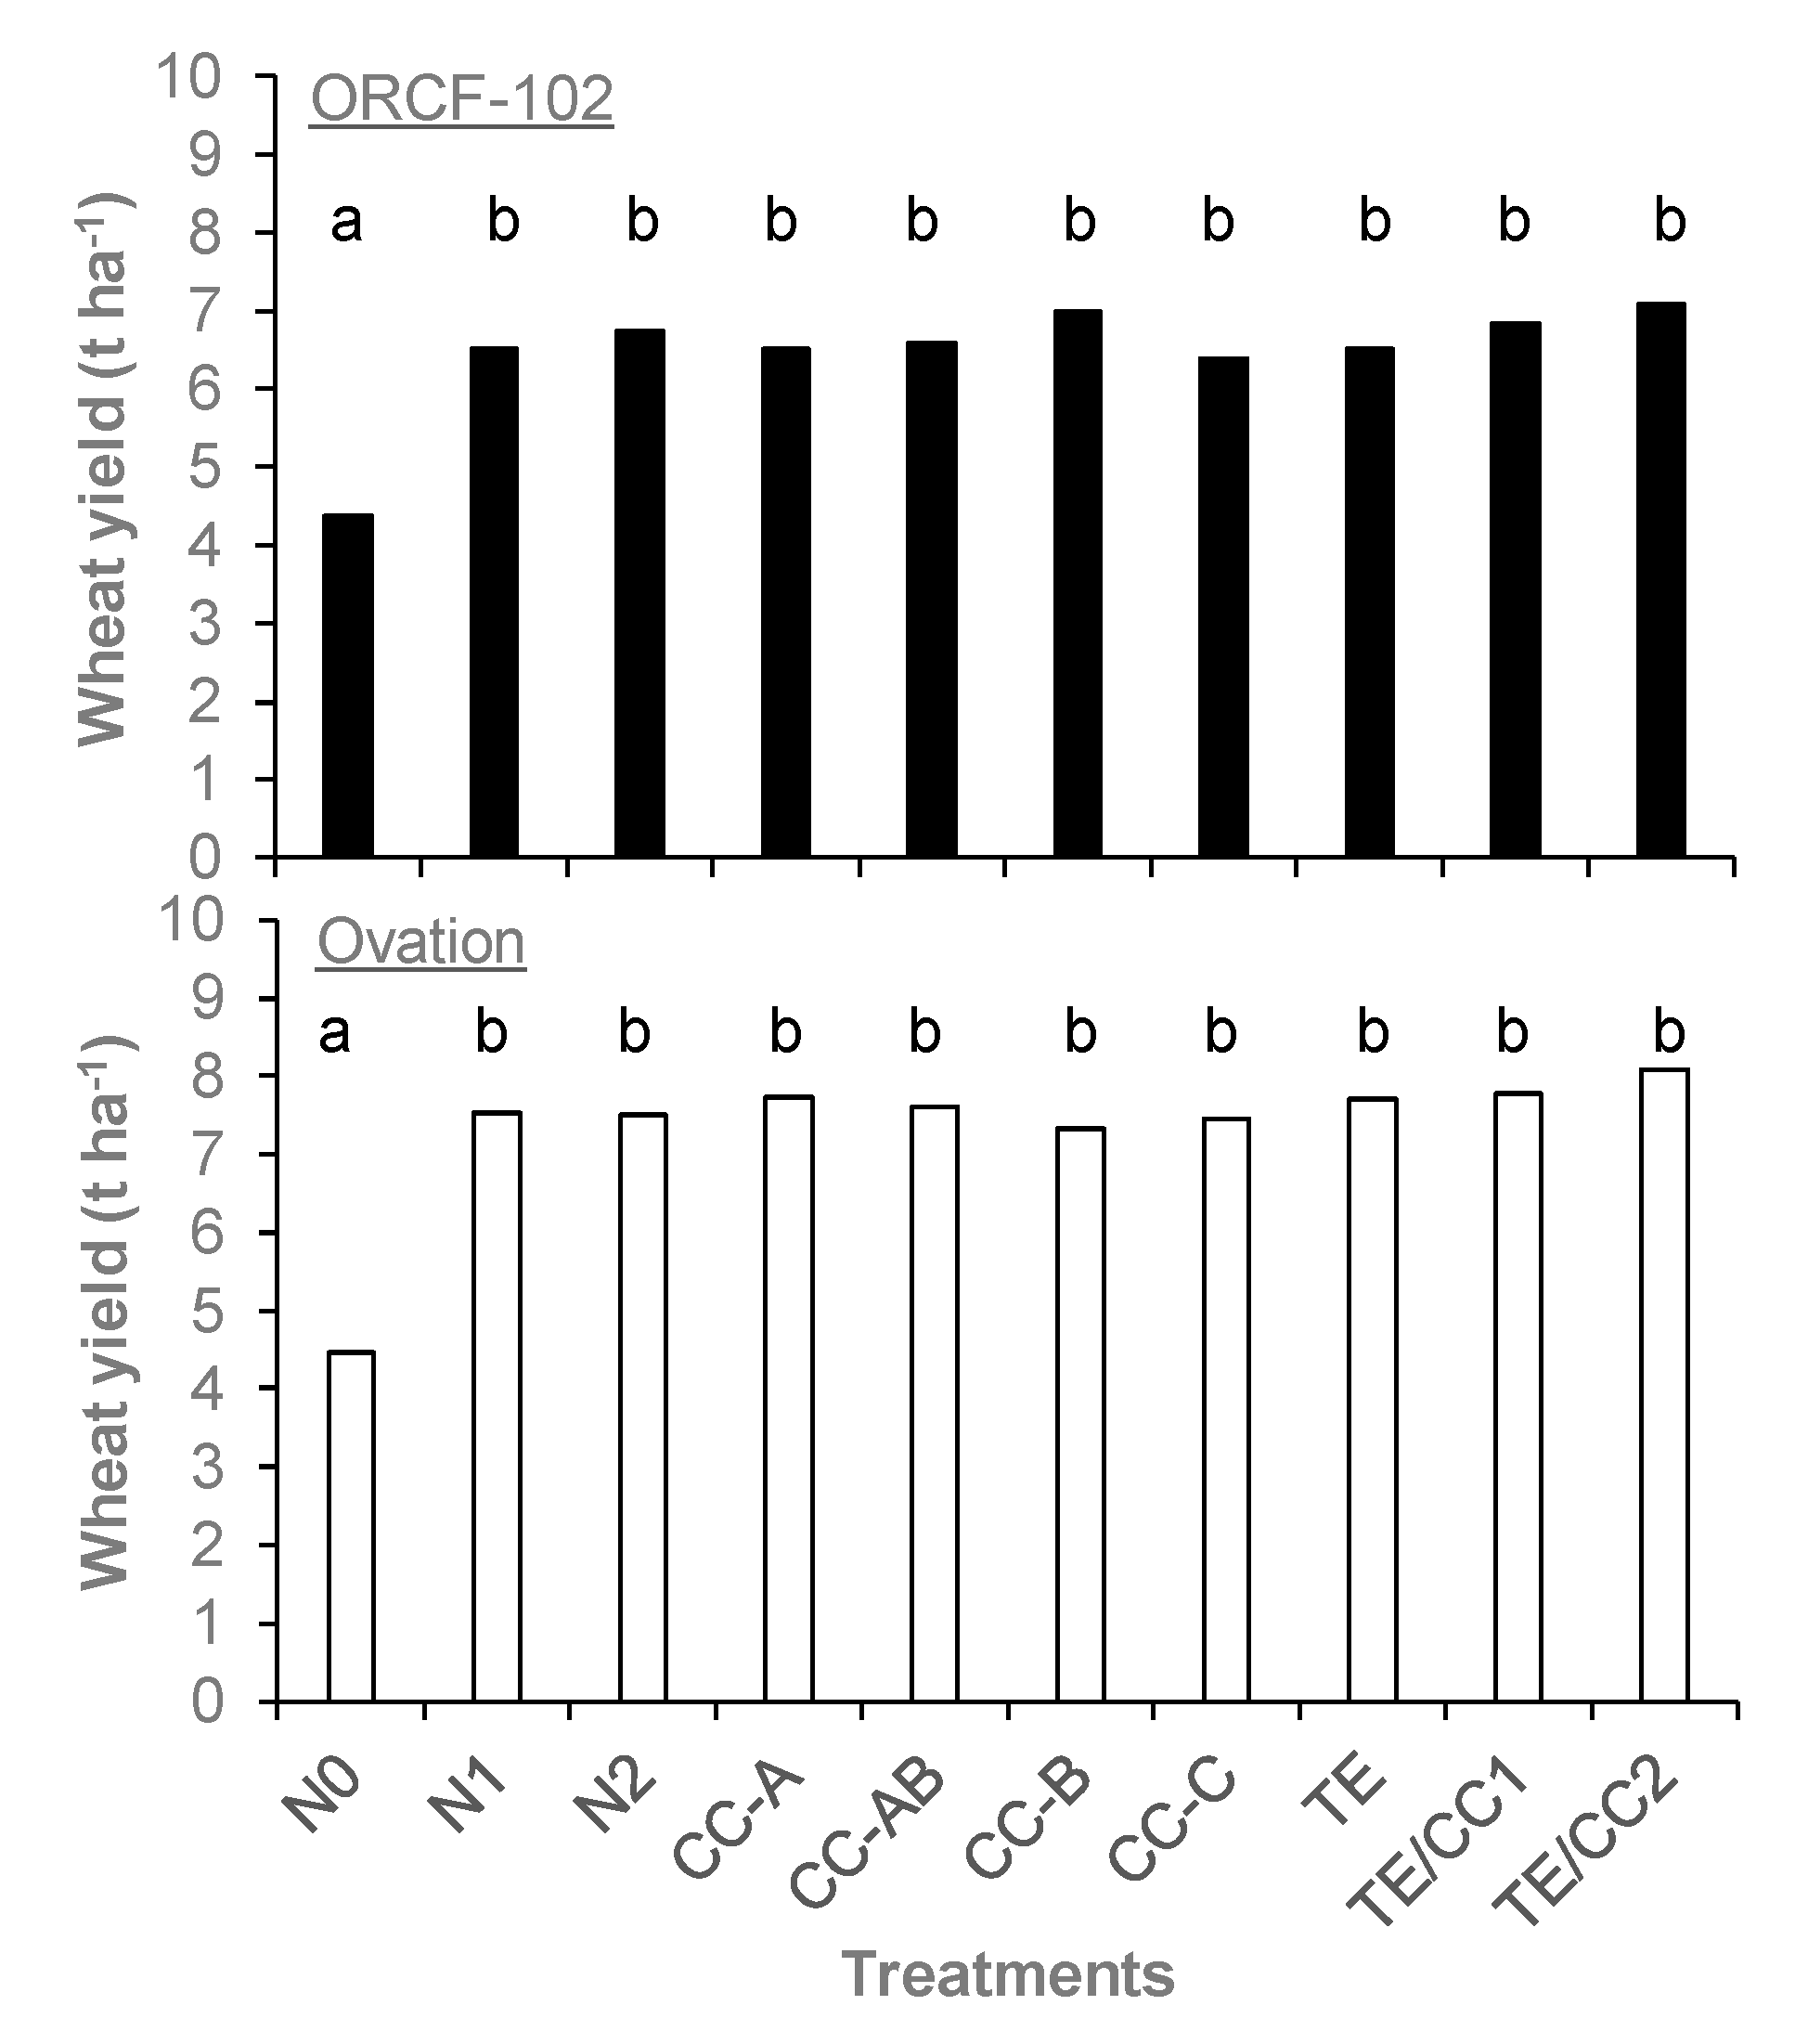
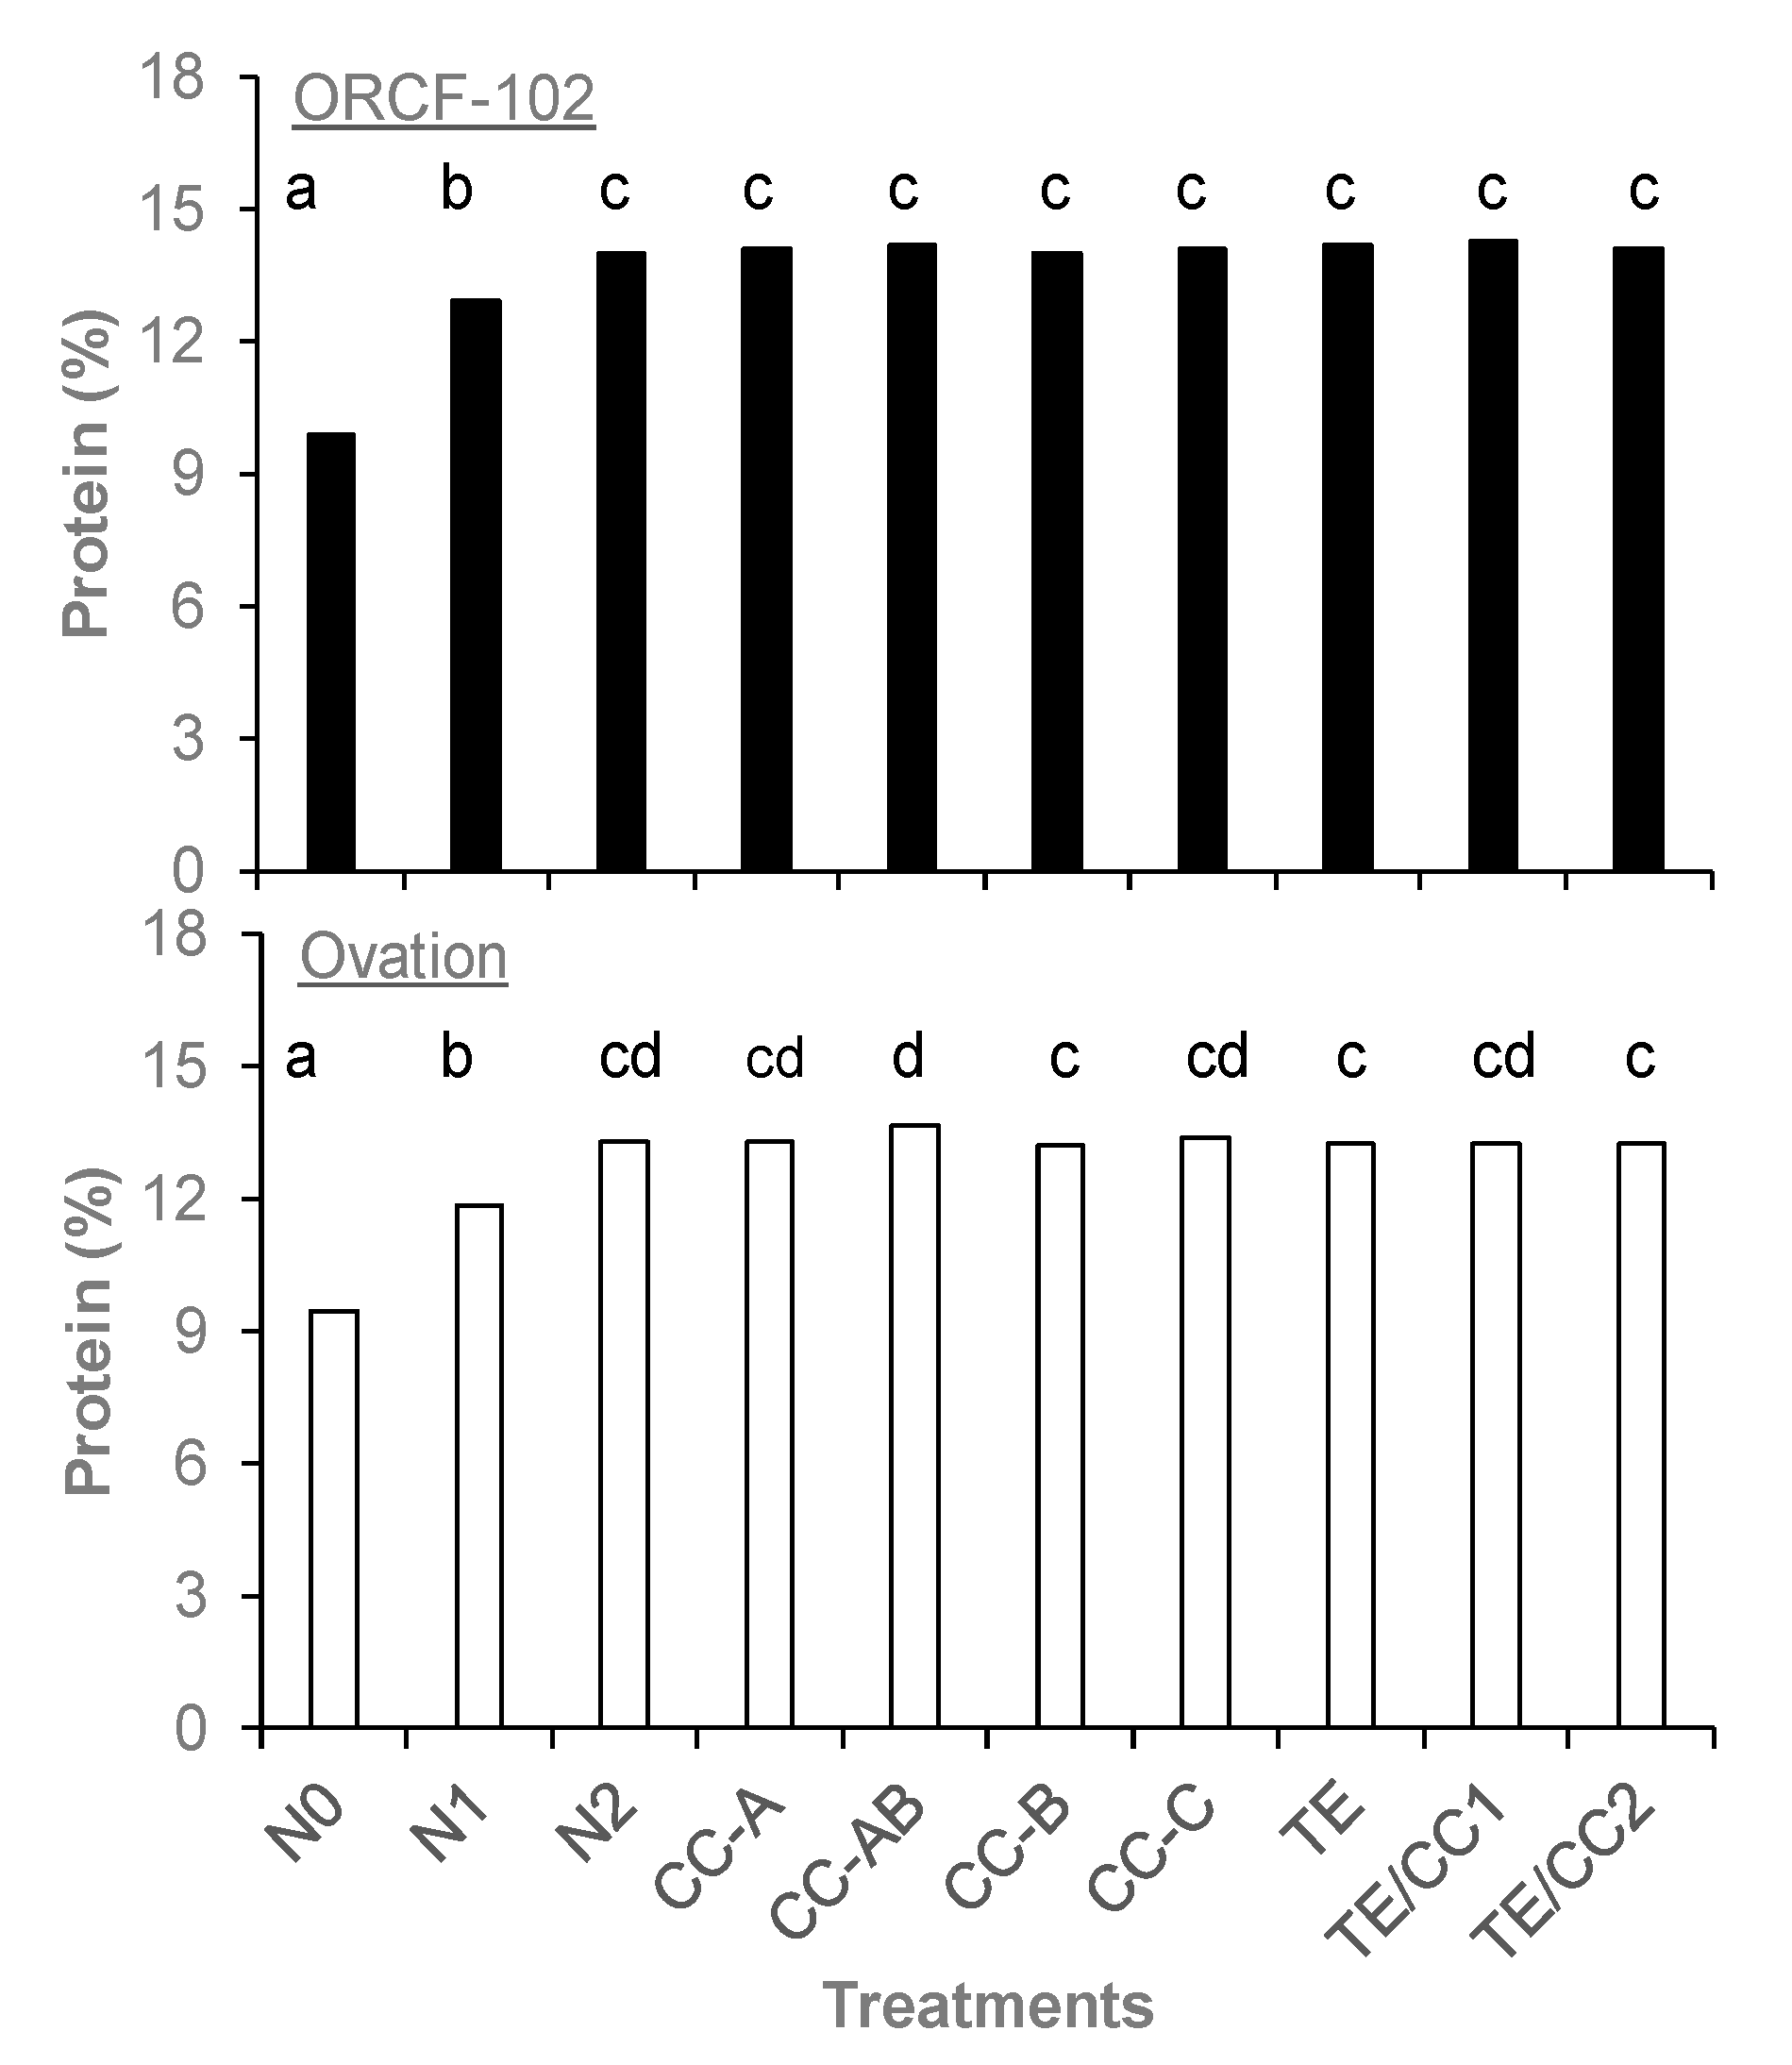
3.2. Yield and Protein Content

As expected, no addition of N (N0) resulted in significantly lower grain yields for both SWWW varieties when data were averaged across experimental years (Figure 2), because of the insufficient N supply. No yield benefit was found in the high-N regime (N2) when comparing to the standard N regime (N1), suggesting that 168 Kg N ha−1 is sufficient for acceptable wheat production. Grain protein of ORCF-102 and SY Ovation was the lowest in the N0 treatment, followed by N1, while the treatments under the high-N regime (i.e., N2) had greater protein levels (p < 0.05, Figure 3).
Our results in grain yield and protein in response to N supplies were consistent with the findings of Yang et al. [34] and Klikocka et al. [35]. Webster and Jackson [30] found that N top-dressing at anthesis increased grain protein content by 1.6 to 7.4% depending on N rate and soil residual N before anthesis.
Generally, it is believed that the application of PGRs increase grain yield (e.g., Reference [31]). Peake et al. [36] reported that PGR application improved grain of most wheat varieties in well-irrigated fields, which has sufficient N supply. However, differently from the above findings, some studies reported that the PGRs application reduced the grain yield [32,37]. The yield data in our field trials showed that no significant differences among any PGR and N2 treatments (Figure 2), suggesting that applications of CC and TE would not decrease grain yield in these studies.
No significant differences were found for protein content among the treatments with the high-N regime for ORCF-102. However, for SY Ovation, among the treatments under the high-N regime, CC-AB has the highest protein level, followed by CC-A, CC-C, N2, TE-CC1, then TE, TE-CC2, and CC-B (p < 0.05). The data suggests that the PGR applications would not reduce grain protein. Meanwhile, the effect of PGR on protein level is highly related to wheat cultivars. Corroborating with our result on ORCF-102, McMillan et al. [33] also did not find any effect of PGR on protein levels. No significant differences were found on test weight among treatments (data not shown). For both varieties, the test weight was in a range of 0.76–0.78 kg L−1.

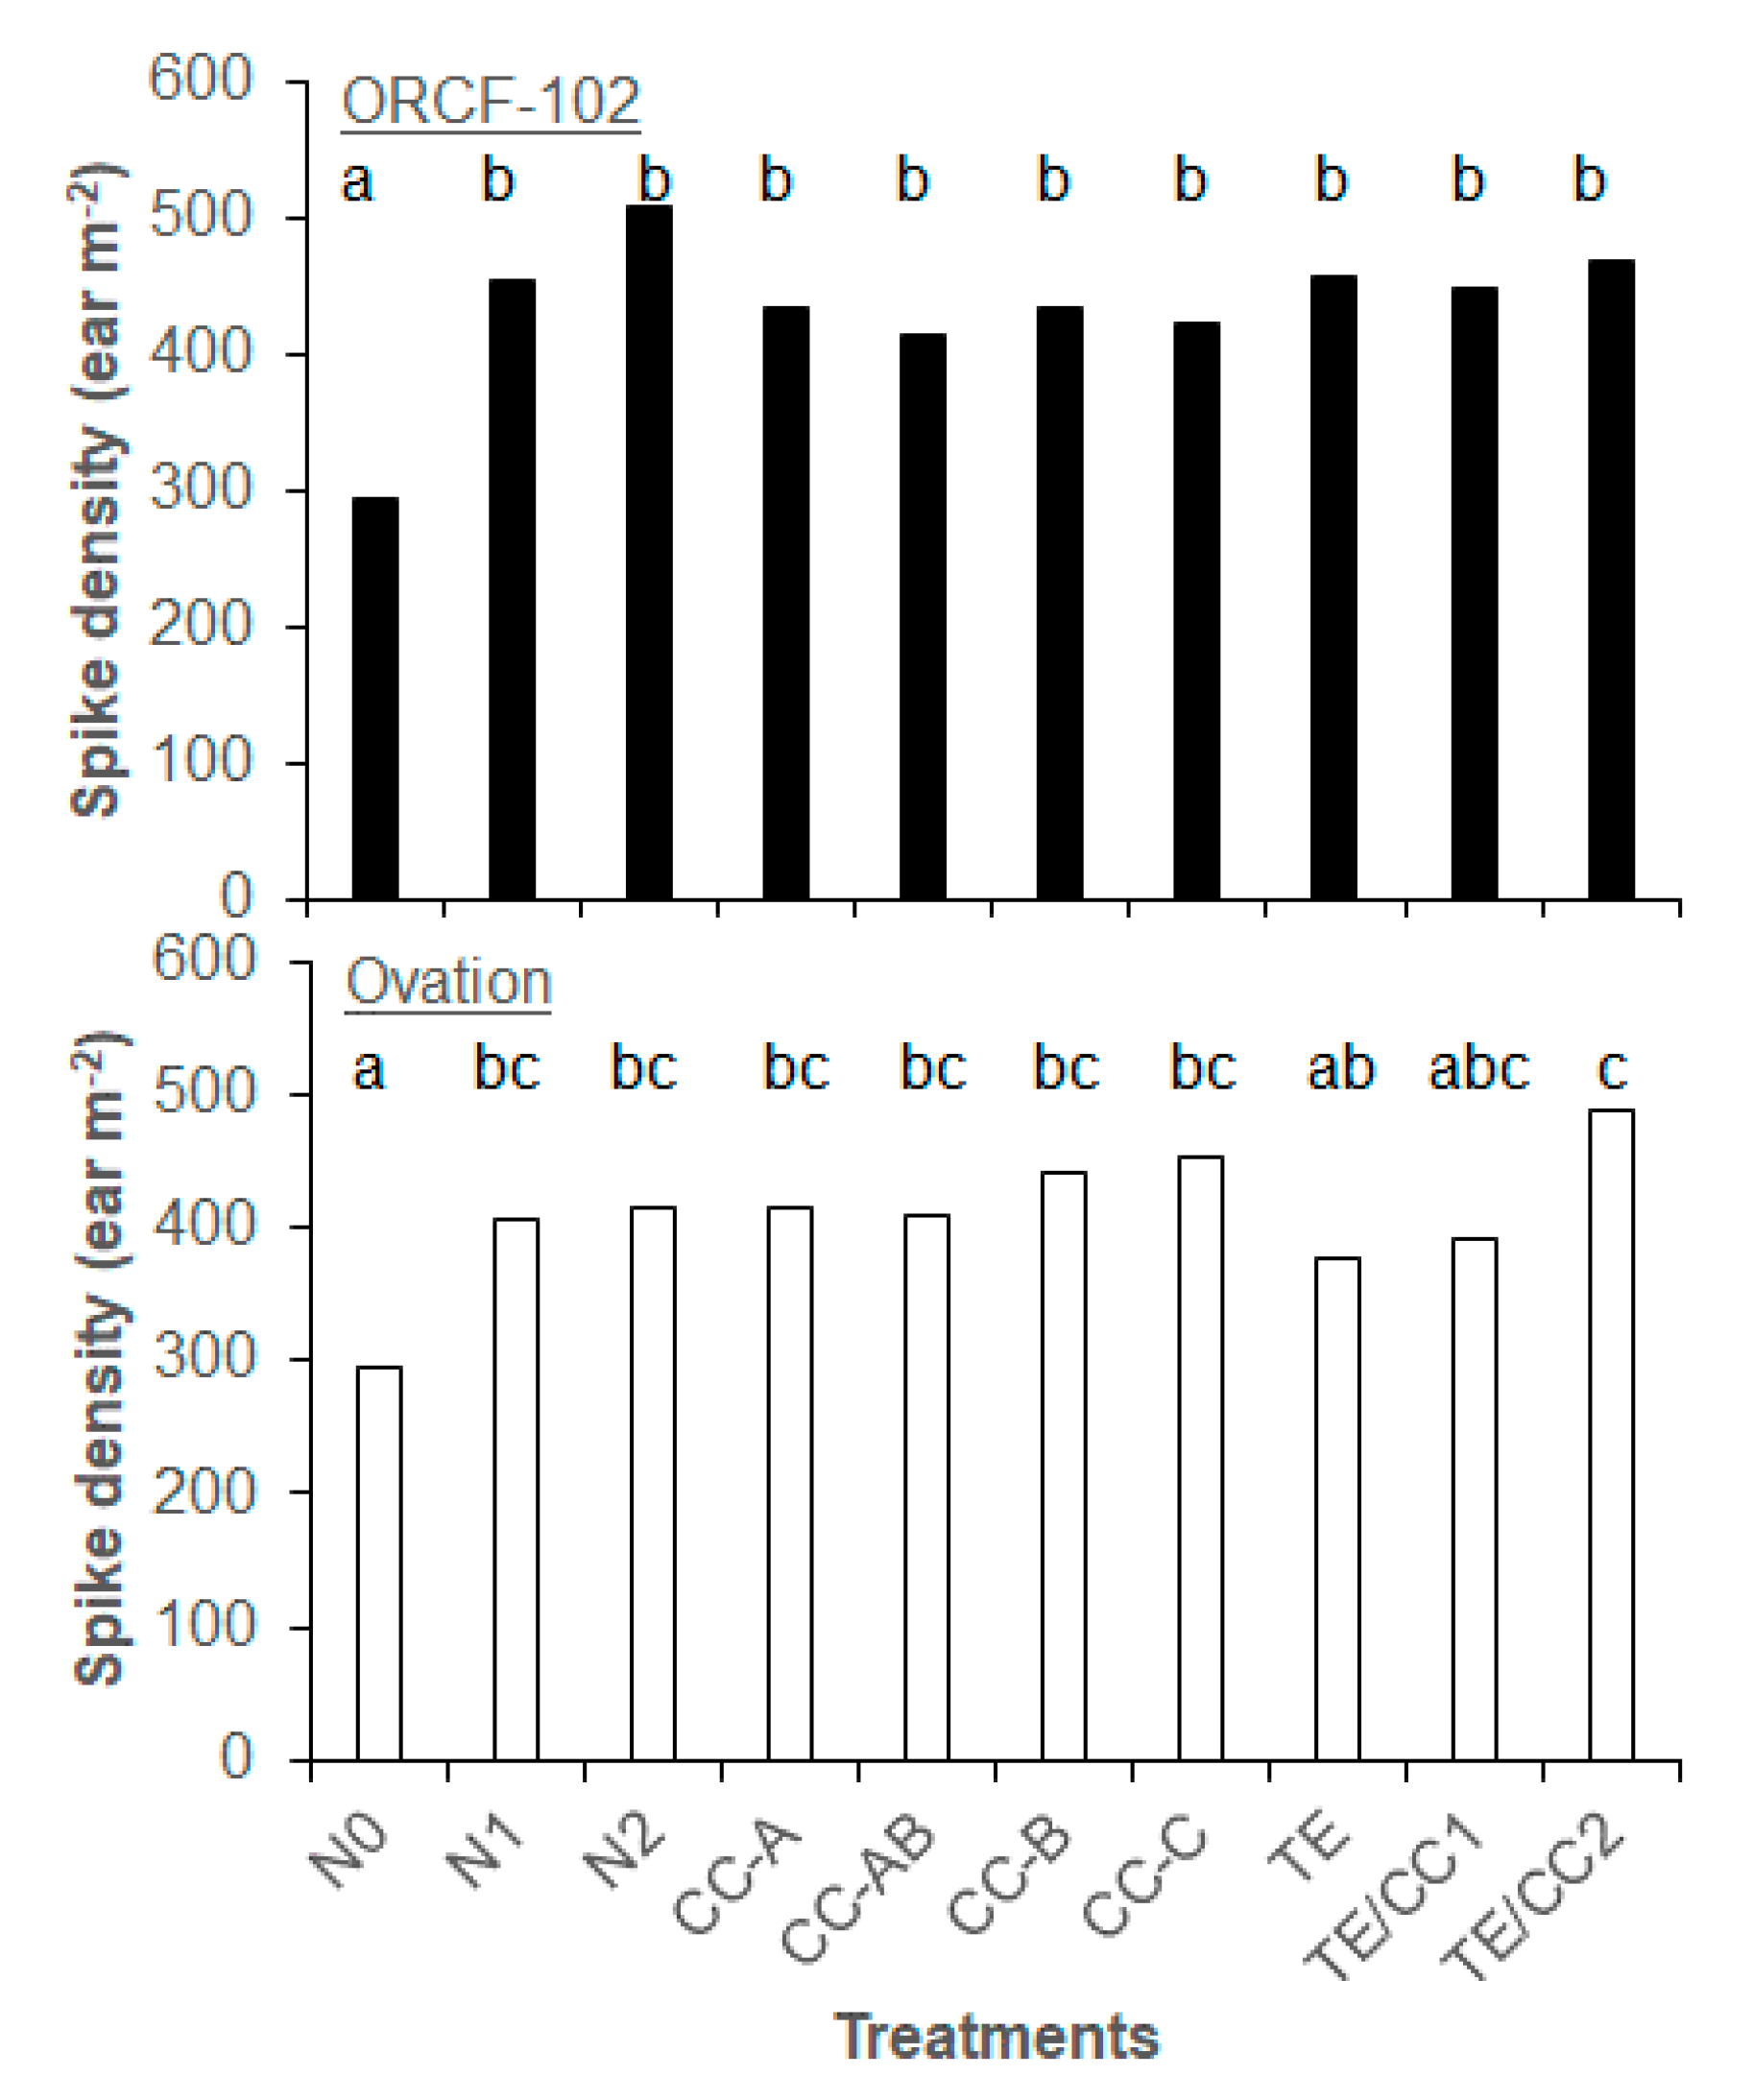
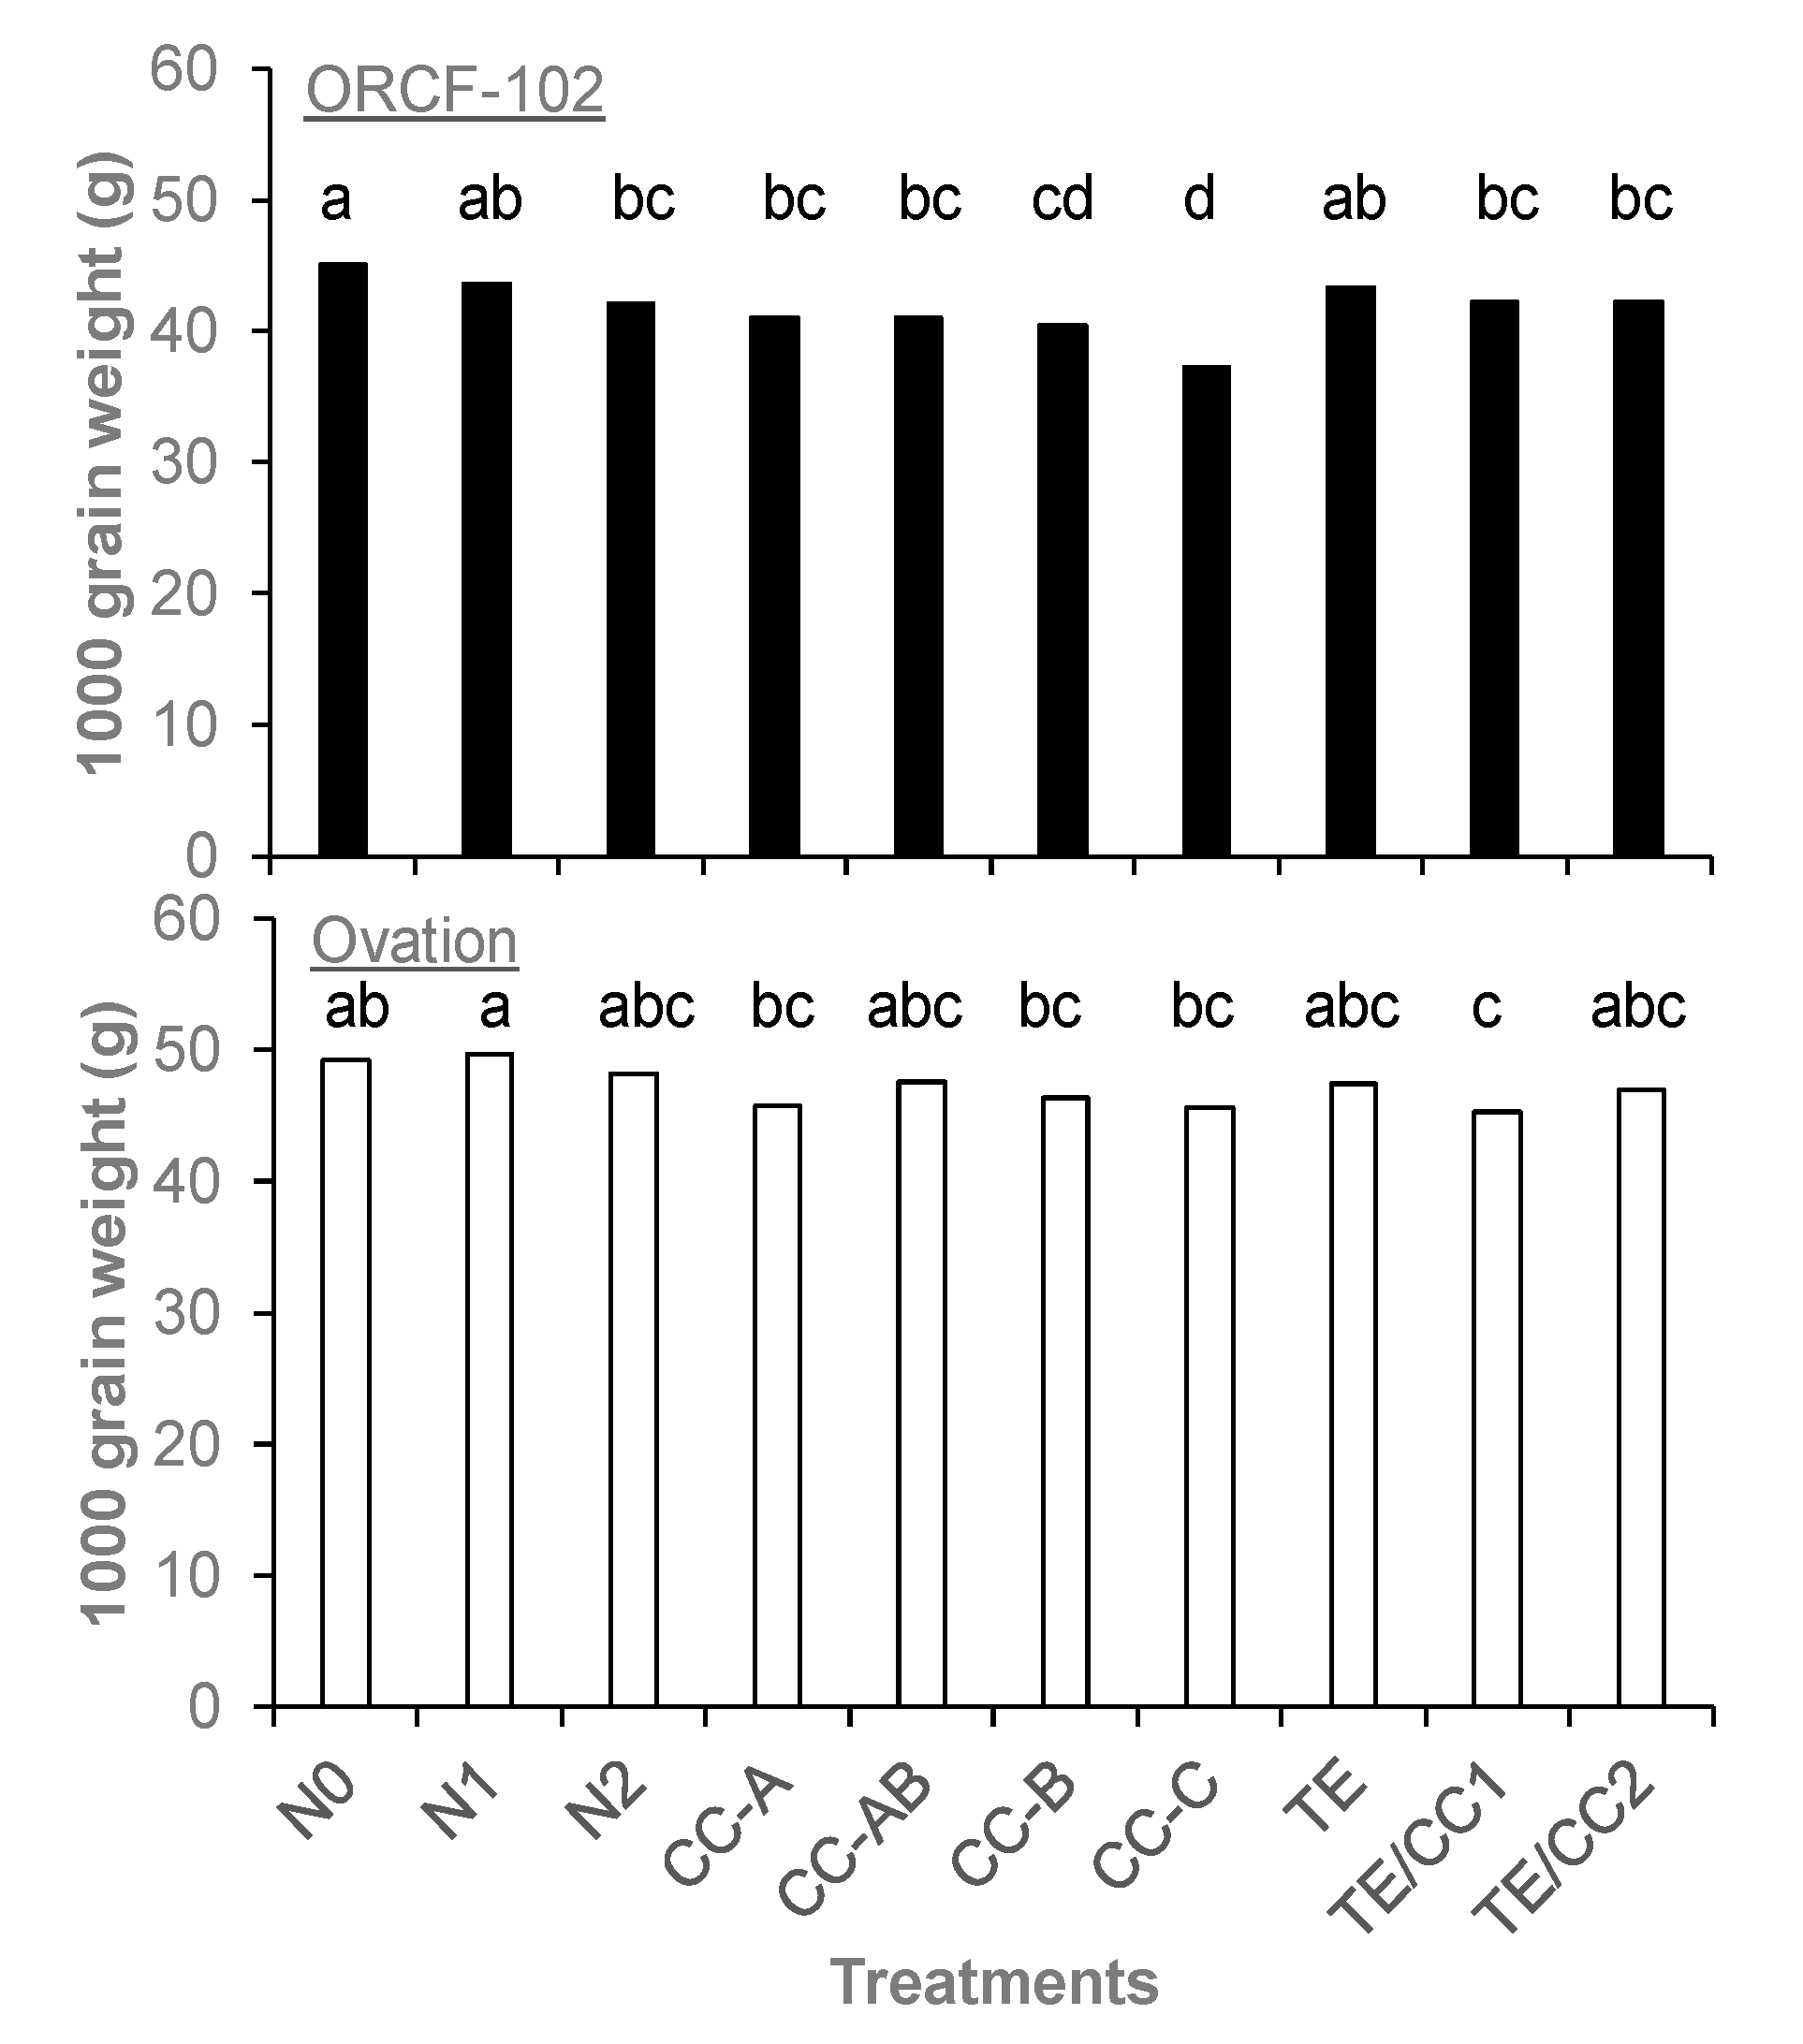
3.3. Yield Components

For both SWWW varieties, spike density (ear m−2) was found the lowest in the N0 treatment (Figure 4). The combination of high N regime and PGR application, resulted in no significant difference in spike density (ear m−2) for ORCF-102, while for SY Ovation, significantly lower spike density was found in the TE treatment compared with the TE/CC2 treatment.
No significant differences were observed on seeds per spike in either variety. For ORCF-102, seeds per spike were in the range of 41–47, and varied from 43 to 49 seeds per spike for SY Ovation (data not shown).
Among the treatments, the largest grain weight for both wheat varieties was found under the N0 and N1 treatments across both experimental years (p < 0.05; Figure 5). Among the treatments of the high-N regime in ORCF-102, the treatment CC-C had the lowest grain weight, followed by CC-B that was not different from other treatments of PGR applications. For SY Ovation, the TE/CC1 treatment had the lowest grain weight, followed by CC-C, CC-A, and CC-B, although no significant difference was found among PGR treatments. Similarly, McMillan et al. [33] also found that the PGR application reduced grain weight or kernel size of barley.

3.4. Correlations Among Plant Growth, Yield, and Yield Components

Pearson correlation coefficients data showed that the yield was most positively correlated to grain protein and plant height (p < 0.01), as well as to test weight and spike density (ear m−2) (p < 0.05) for both SWWW varieties (Table 3 and Table 4).
A negative correlation was found between yield and grain weight for ORCF-102 (p < 0.01), but an insignificant correlation in Ovation. Grain yield primarily consists of grain weight and the number of grains per unit area, but variation in grain weight is usually smaller [38]. Grain yield is, thus, not primarily determined by grain weight, but more dominantly by the number of grains per unit area [39].
In both varieties, grain protein was negatively correlated to grain weight (p < 0.01), while it was positively correlated to plant height only for the ORCF-102. Stem thickness was found to positively correlated with spike density (ear m−2) for both varieties (p < 0.01), while it was only correlated to spike density (ear m−2) and grain weight for Ovation (p < 0.01). Plant height was correlated to stem thickness, spike density (ear m−2), and grain number per spike for ORCH-102.

4. Conclusions

The application of PGRs was found to reduce the stem height of winter wheat, but their effects were minimal on stem thickness, grain yield, and protein in the absence of lodging conditions. The effect of PGR on spike density (ear m−2) and grain weight varied with the different combinations of applications (e.g., rate, timing, and products) and wheat varieties. However, the application of CC tended to have a lower grain weight. There was no significant difference between the two tested PGRs on crop growth and production—indicating more PGR options for growers to use. Throughout our field trials, no lodging occurred at any treatment. Therefore, the effectiveness of the PGR application on lodging control was not feasible to be evaluated in this study. Nitrogen application is the essential factor limiting crop yield. In the studied region with the fine sandy loam soil, a base N fertilizer rate of 67 kg ha−1 and a seasonal N rate of 168 kg ha−1 should be sufficient to secure wheat grain yield. Spike density (ear m−2) was the lowest without N application, contrary to grain weight, which was higher. The data implies that spike density (reproductive tillers) is a critical yield component in wheat production. Future research over multiple years and varieties will shed light on the effect of PGRs and N application to sustainable winter wheat production.

Author Contributions

All authors contributed substantially to the work reported in this paper. Conceptualization, R.Q.; methodology, R.Q.; investigation, R.Q.; data curation, R.Q., C.N., and X.L.; writing—original draft preparation, R.Q.; writing—review and editing, C.N., X.L., D.W., G.W., and S.L.; All authors have read and agreed to the published version of the manuscript.

Funding

This research received no external funding.

Acknowledgments

Cory Zita, Dan Childs, and Tim Weinke of OSU-HAREC provided technical support for field management; summer interns (Andrew C. Rothe, Yan Yan, Greg Anderson, Avery Treadwell, Schae Borrego, and Nikkole Duitsman) contributed to the field measurement, sampling, and harvesting.

Conflicts of Interest

The authors declare no conflict of interest.

References

  1. Schillinger, F.W.; Papendick, I.R. Then and now: 125 years of dryland wheat farming in the Inland Pacific Northwest. Agron. J. 2008, 100, S-166–S-182. [Google Scholar] [CrossRef] [Green Version]
  2. Horneck, D.A.; Hart, J.M.; Flowers, M.D.; Lutcher, L.K.; Wysocki, D.J.; Corp, M.K.; Bohle, M. Irrigated Soft White Wheat (Eastern Oregon); EM 9015-E; Oregon State University Extension Service: Corvallis, OR, USA, 2010. [Google Scholar]
  3. Hart, J.M.; Flowers, M.D.; Roseburg, R.J.; Christensen, N.W.; Mellbye, M.E. Nutrient Management Guide for Soft White Winter Wheat (Western Oregon); EM 8963-E; Oregon State University Extension Service: Corvallis, OR, USA, 2009. [Google Scholar]
  4. Hart, J.M.; Christensen, N.W.; Jackson, T.L.; Karow, R.; Kronstad, W.E. Fertilizer Guide. Winter Wheat (Western Oregon—West of Cascades); FG 9. OR; Oregon State University Extension Service: Corvallis, OR, USA, 2000. [Google Scholar]
  5. Pinthus, M.J. Lodging in wheat, barley and oats: The phenomenon, its causes and preventative measures. Adv. Agron. 1973, 25, 210–263. [Google Scholar]
  6. Ma, B.L.; Biswas, D.K.; Zhou, Q.P.; Ren, C.Z. Comparisons between cultivars of wheat, covered and hulless oats: Effects of N fertilization on growth and yield. Can. J. Plant Sci. 2012, 92, 1213–1222. [Google Scholar] [CrossRef]
  7. Berry, P.M.; Sterling, M.; Spink, J.H.; Baker, C.J.; Sylvester-Bradley, R.; Mooney, S.J.; Tams, A.R.; Ennos, A.R. Understanding and reducing lodging in cereals. Adv. Agron. 2004, 84, 217–271. [Google Scholar]
  8. Shah, L.; Yahya, M.; Shah, S.; Nadeem, M.; Ali, A.; Wang, J.; Riaz, M.W.; Rehman, S.; Wu, W.; Khan, R.M.; et al. Improving lodging resistance: Using wheat and rice as classical examples. Int. J. Mol. Sci. 2019, 20, 4211. [Google Scholar] [CrossRef] [Green Version]
  9. Foulkes, M.; John, G.A.; Slafer, W.J.; Davies, P.; Berry, M.; Sylvester-Bradley, R.; Martre, P.; Calderini, D.F.; Griffiths, S.; Reynolds, M.P. Raising yield potential of wheat. III. Optimizing partitioning to grain while maintaining lodging resistance. J. Exp. Botany 2011, 62, 469–486. [Google Scholar] [CrossRef] [Green Version]
  10. Berry, P.M.; Spink, J.H.; Gay, A.P.; Craigon, J. A comparison of root and stem lodging risks among winter wheat cultivars. J. Agric. Sci. Camb. 2003, 141, 191–202. [Google Scholar] [CrossRef]
  11. Berry, P.M.; Sylvester-Bradley, R.; Berry, S. Ideotype for lodging resistant wheat. Euphytica 2007, 154, 165–179. [Google Scholar] [CrossRef]
  12. Berry, P.; Spink, J. Predicting yield losses caused by lodging in wheat. Field Crop. Res. 2012, 137, 19–26. [Google Scholar] [CrossRef]
  13. Acreche, M.; Slafer, G. Lodging yield penalties as affected by breeding in Mediterranean wheats. Field Crop. Res. 2011, 122, 40. [Google Scholar] [CrossRef]
  14. Kashiwagi, T.; Ishimaru, K. Identification and functional analysis of a locus for improvement of lodging resistance in rice. Plant Physiol. 2004, 134, 676–683. [Google Scholar] [CrossRef] [Green Version]
  15. Pham, Q.D.; Akira, A.; Hirano, M.; Sagawa, S.; Kuroda, E. Analysis of lodging resistant characteristic of different rice genotypes grown under the standard and nitrogen–free basal dressing accompanied with sparse planting density practices. Plant Prod. Sci. 2004, 7, 243–251. [Google Scholar]
  16. Zhang, W.-J.; Wu, L.-M.; Ding, Y.-F.; Weng, F.; Wu, X.-R.; Li, G.-H.; Liu, Z.-H.; Tang, S.; Ding, C.-Q.; Wang, S.-H. Top–dressing nitrogen fertilizer rate contributes to reduce culm physical strength through decreasing in structural carbohydrates contents in japonica rice. J. Integr. Agr. 2016, 15, 992–1004. [Google Scholar] [CrossRef] [Green Version]
  17. Meier, U. Growth Stages of Mono- and Dicotyledonous Plants. BBCH Monogr. 2001. [Google Scholar] [CrossRef]
  18. Zadoks, J.C.; Chang, T.T.; Konzak, C.F. A decimal code for the growth stages of cereals. Weed Res. 1974, 14, 415–421. [Google Scholar] [CrossRef]
  19. Feekes, W. De tarwe en haar milieu; Hoitsema: Groningen, The Newtherlands, 1941; Volume 17, pp. 523–888. [Google Scholar]
  20. Van Der Zanden, A.M. How Hormones and Growth Regulators Affect Your Plants. OSU Extension Service. 2012. Available online: https://extension.oregonstate.edu/gardening/techniques/how-hormones-growth-regulators-affect-your-plants (accessed on 7 May 2020).
  21. Anderson, N.P.; Monks, D.P.; Chastain, T.G.; Rolston, M.P.; Garbacik, C.J.; Ma, C.-H.; Bell, C.W. Trinexapac-ethyl effects on red clover seed crops in diverse production environments. Agron. J. 2015, 107, 951–956. [Google Scholar] [CrossRef]
  22. Rademacher, W. Growth retardants: Effects of gibberellin biosynthesis and other metabolic pathways. Annu. Rev. Plant Physiol. Plant Mol. Biol. 2000, 51, 501–531. [Google Scholar] [CrossRef] [Green Version]
  23. Tolbert, N.E. (2-Chloroethyl) trimethylammonium chloride and related compounds as plant growth substances.1. Chemical structure and bioassay. J. Biol. Chem. 1960, 235, 475–479. [Google Scholar]
  24. Hedden, P.; Sponsel, V. A century of gibberellin research. J. Plant Growth Regul. 2015, 34, 740–760. [Google Scholar] [CrossRef] [Green Version]
  25. King, R.W.; Junttila, O.; Mander, L.N.; Beck, E.J. Gibberellin structure and function: Biological activity and competitive inhibition of gibberellin 2- and 3-oxidases. Physiol. Plant. 2004, 120, 287–297. [Google Scholar] [CrossRef]
  26. Climate Hermiston—OR. U.S. Climate Data. 2020. Available online: https://www.usclimatedata.com/climate/hermiston/oregon/united-states/usor0159 (accessed on 7 May 2020).
  27. Flowers, M.; Peterson, J.; Hulting, A.; Burns, J.; Kuehner, J. ORCF-I02 CLEARFIELD * Soft White Winter Wheat. 2008. Available online: http://washingtoncrop.com/documents/Wheat/Winter/Soft%20White/ORCF-102.pdf (accessed on 18 May 2020).
  28. Washington State Crop Improvement Association. SY Ovation (03PN108-21). 2015. Available online: http://washingtoncrop.com/wp-content/uploads/2015/10/SY-Ovation-SWW.pdf (accessed on 7 May 2020).
  29. Spolidorio, F.; Lollato, R. Plant growth regulators to decrease wheat height in high fertility scenarios. Kans. Agric. Exp. Stn. Res. Rep. 2019, 5. [Google Scholar] [CrossRef] [Green Version]
  30. Webster, J.R.; Jackson, L.F. Management practices to reduce lodging and maximize grain yield and protein content of fall-sown irrigated hard red spring wheat. Field Crop. Res. 1993, 33, 249–259. [Google Scholar] [CrossRef]
  31. Wiersma, D.W.; Oplinger, E.S.; Guy, S.O. Environment and cultivar effects on winter wheat response to Ethephon plant growth regulator. Agron. J. 1986, 78, 761–764. [Google Scholar] [CrossRef]
  32. Zhang, Y.; Su, S.; Tabori, M.; Yu, J.; Chabot, D.; Baninasab, B.; Wang, X.; Ma, B.; Li, C.; Khanizadeh, S. Effect of selected plant growth regulators on yield and stem height of spring wheat in Ontario. J. Agric. Sci. 2017, 9. [Google Scholar] [CrossRef] [Green Version]
  33. McMillan, T.; Tidemann, B.D.; O’Donovan, J.T.; Izydorczyk, M.S. Effects of plant growth regulator application on the malting quality of barley. J. Sci. Food Agric. 2019. [Google Scholar] [CrossRef] [PubMed]
  34. Yang, R.; Liang, X.; Torrion, J.A.; Walsh, O.S.; Brien, K.O.; Liu, Q. The Influence of water and nitrogen availability on the expression of end-use quality parameters of spring wheat. Agronomy 2018, 8, 257. [Google Scholar] [CrossRef] [Green Version]
  35. Klikocka, H.; Cybulska, M.; Barczak, B.; Narolski, B.; Szostak, B.; Kobiałka, A.; Nowak, A.; Wójcik, E. The effect of sulphur and nitrogen on grain yield and technological quality of spring wheat. Plant Soil Environ. 2016, 62, 230–236. [Google Scholar] [CrossRef] [Green Version]
  36. Peake, A.S.; Bell, K.L.; Fischer, R.A.; Gardner, M.; Das, B.T.; Poole, N.; Mumford, M. Cultivar × management interaction to reduce lodging and improve grain yield of irrigated spring wheat: Optimising plant growth regulator use, N application timing, row spacing and sowing date. Front. Plant Sci. 2020. [Google Scholar] [CrossRef] [PubMed]
  37. Zhang, G.; Chen, J.; Bull, D.A. The effects of timing of N application and plant growth regulators on morphogenesis and yield formation in wheat. Plant Growth Regul. 2001, 35, 239–245. [Google Scholar]
  38. Sadras, V.O.; Slafer, G.A. Environmental modulation of yield components in cereals: Heritabilities reveal a hierarchy of phenotypic plasticities. Field Crop. Res. 2012, 127, 215–224. [Google Scholar] [CrossRef]
  39. Liang, X.; Liu, Y.; Chen, J.; Adams, C. Late-season photosynthetic rate and senescence were associated with grain yield in winter wheat of diverse origins. J. Agron. Crop Sci. 2017, 204, 1–12. [Google Scholar] [CrossRef]
Figure 1. Plant height (cm) at water ripe (GS71) and harvest mature (GS95) for the two soft white winter wheat (SWWW) varieties among PGR-N treatment combinations across two years in Adkins fine sandy loam soil in Oregon. N0 = no fertilization; N1 = normal N rate; N2 = high-N rate without PGR application; CC-A = applying CC at GS30-32; CC-AB = applying CC at GS30-32 and GS37-39; CC-B = applying CC at GS37-39; CC-C = applying CC at GS21-26; TE = applying TE at GS30-32; TE/CC1 = applying TE at GS30-32 and applying CC (0.442 L ha−1 a.i.) at GS37-39; TE/CC2 = applying TE at GS30-32 and applying CC (1.004 L ha−1 a.i.) at GS37-39. Different letters on the top of each column indicate significant differences among treatments at 5% level according to LSD test.
Agriculture 10 00305 g001
Figure 2. SWWW yield (t ha−1) among PGR—fertilization treatments across two years in Adkins fine sandy loam soil in Oregon. N0 = no fertilization; N1 = normal N rate; N2 = high-N rate without PGR application; CC-A = applying CC at GS30-32; CC-AB = applying CC at GS30-32 and GS37-39; CC-B = applying CC at GS37-39; CC-C = applying CC at GS21-26; TE = applying TE at GS30-32; TE/CC1 = applying TE at GS30-32 and applying CC (0.442 L ha−1a.i.) at GS37-39; TE/CC2 = applying TE at GS30-32 and applying CC (1.004 L ha−1 a.i.) at GS37-39. Different letters on the top of each column indicate significant differences among treatments at 5% level according to LSD test.
Agriculture 10 00305 g002
Figure 3. The protein content (%) of two winter wheat varieties among the treatments across the data of two years in Adkins fine sandy loam soil. N0 = no fertilization; N1 = normal N rate; N2 = high-N rate without PGR application; CC-A = applying CC at GS30-32; CC-AB = applying CC at GS30-32 and GS37-39; CC-B = applying CC at GS37-39; CC-C = applying CC at GS21-26; TE = applying TE at GS30-32; TE/CC1 = applying TE at GS30-32 and applying CC (0.442 L ha−1 a.i.) at GS37-39; TE/CC2 = applying TE at GS30-32 and applying CC (1.004 L ha−1 a.i.) at GS37-39. Different letters on the top of each column indicate significant differences among treatments at 5% level according to LSD test.
Agriculture 10 00305 g003
Figure 4. Spike density (ear m−2) of two winter wheat varieties among the treatments across the data of two years in Adkins fine sandy loam soil. N0 = no fertilization; N1 = normal N rate; N2 = high-N rate without PGR application; CC-A = applying CC at GS30-32; CC-AB = applying CC at GS30-32 and GS37-39; CC-B = applying CC at GS37-39; CC-C = applying CC at GS21-26; TE = applying TE at GS30-32; TE/CC1 = applying TE at GS30-32 and applying CC (0.442 L ha−1a.i.) at GS37-39; TE/CC2 = applying TE at GS30-32 and applying CC (1.004 L ha−1 a.i.) at GS37-39. Different letters on the top of each column indicate significant differences among treatments at 5% level according to LSD test.
Agriculture 10 00305 g004
Figure 5. 1000-grain weight (g) of two SWWW varieties among the treatments across the data of two years in Adkins fine sandy loam soil. N0 = no fertilization; N1 = normal N rate; N2 = high-N rate without PGR application; CC-A = applying CC at GS30-32; CC-AB = applying CC at GS30-32 and GS37-39; CC-B = applying CC at GS37-39; CC-C = applying CC at GS21-26; TE = applying TE at GS30-32; TE/CC1 = applying TE at GS30-32 and applying CC (0.442 L ha−1 a.i.) at GS37-39; TE/CC2 = applying TE at GS30-32 and applying CC (1.004 L ha−1 a.i.) at GS37-39. Different letters on the top of each column indicate significant differences among treatments at 5% level according to LSD test.
Agriculture 10 00305 g005
Table 1. Soil chemical properties in the two-year field trials at Hermiston, OR.
Growth SeasonNO3-N (ppm)NH4-N (ppm)P (ppm)K (ppm)SO4-S (ppm)Zn (ppm)pH1:1Organic Matter (%)
2017–201819.61.728.119613.23.66.10.9
2018–20197.53.230.02978.53.66.31.2
Table 2. Treatment details for the two-year field trials at Hermiston, OR.
Treatment Number *Treatment CodingSeasonal N ApplicationPGR Application (L ha−1 a.i.) at Different Growing Stages
GS21-26
(Tillering)
GS30-32
(Onset of Stem Elongation)
GS37-39
(Emergence of Flag Leaf)
1N0No N applied000
2N1Normal N rate000
3N2High N rate000
4CC-AHigh N rate01.004 (Adjust)0
5CC-BHigh N rate001.004 (Adjust)
6CC-ABHigh N rate00.562 (Adjust)0.442 (Adjust)
7CC-CHigh N rate1.004 (Adjust)00
8TEHigh N rate00.126 (Palisade)0
9TE/CC1High N rate00.126 (Palisade)0.442 (Adjust)
10TE/CC2High N rate00.126 (Palisade)1.004 (Adjust)
* Treatment 1 to 3 did not receive plant growth regulator (PGR) treatments, while treatment 4 to 9 received PGR treatments and high N rate; Treatment 7 was only used in the trial of 2018–2019.
Table 3. Pearson correlation coefficients among yield, protein content, test weight, plant height, stem thickness, spike density (ear m−2), seeds per spike, and grain weight for ORCF-102 across two growing seasons in Columbia Basin of Oregon (n = 76).
ParametersProteinTest WeightPlant HeightStem ThicknessSpike DensitySeeds Per SpikeGrain Weight
Yield0.59 **0.39 **0.53 **0.000.30 *0.00−0.45 **
Protein 0.060.27 *−0.05−0.02−0.02−0.50 **
Test weight 0.050.160.04−0.06−0.12
Plant height 0.31 **0.51 **0.24 *−0.04
Stem thickness 0.45 **0.230.06
Spike density 0.240.16
Seeds per spike 0.11
* and ** indicate significant correlations at p < 0.05 and p < 0.01.
Table 4. Pearson correlation coefficients among yield, protein content, test weight, plant height, stem thickness, spike density (ear m−2), seeds per spike, and grain weight for SY-Ovation across two growing seasons in Columbia Basin of Oregon (n = 76).
ParametersProteinTest WeightPlant HeightStem ThicknessSpike DensitySeeds Per SpikeGrain Weight
Yield0.54 **0.29 *0.48 **0.0310.42 **0.11−0.22
Protein content 0.040.28−0.160.11−0.15−0.57 **
Test weight −0.00−0.020.060.04−0.04
Plant height −0.100.18−0.050.03
Stem thickness 0.47 **0.32 **0.40 **
Spike density 0.180.23
Seeds per spike 0.21
* and ** indicate significant correlations at p < 0.05 and p < 0.01.

