1. Introduction
Soil erosion is geographically determined as a result of the interaction between natural processes and anthropogenic influences. It is a complex process controlled by numerous factors, such as topography, climate, soil characteristics, forest cover and human activities [
1,
2,
3,
4,
5,
6,
7,
8,
9].
Soil erosion is a natural process, but the natural erosion rate has significantly increased in the last few decades as a consequence of human activity and become a serious environmental problem [
10,
11,
12,
13]. This process is one of the most significant forms of land degradation that is particularly affected by human activity [
14,
15,
16]. On the other hand, in recent decades, especially at higher altitudes, there has been a trend of decreasing erosion intensity as a result of the process of deagrarization, depopulation and change of land use [
17,
18,
19,
20].
The agricultural aspect of soil erosion is well known since the problems of yield production and transport are present in almost all branches of water management. The inappropriate use of soil affects the development of erosion processes, resulting in degradation and the reduction of the infiltration–retention capacity of the soil. This creates conditions for the frequent occurrence of torrential floods and the deposition of bed load in downstream sectors [
21]. Much research at the regional [
11,
22,
23,
24] and global scale [
14,
17,
25,
26,
27] have reported that soil erosion is significantly related to land use changes.
Since the creation of the Erosion Map of the Republic of Serbia (1966–1971), demographic and socio-economic changes have caused changes in the intensity of mechanical water erosion as well. The state of erosion during the development of the Erosion Map represented its maximum intensity, which today serves to clearly define the erosion potential. The change in land use also caused a change in the intensity of erosive processes, and in this way, man unconsciously and indirectly caused the reduction of land loss and changes in its spatial distribution.
Different categories of soil erosion are present in about 65% of the territory of Serbia [
28]. Environmental degradation creates economic and social problems within local communities, often accompanied by depopulation [
21].
The Jablanica River is the tributary of the Južna Morava River, which stands out as a basin with the most intensive erosion processes in the Republic of Serbia [
29]. A large number of studies on soil erosion in many parts of the Republic of Serbia were conducted in the past [
30,
31,
32] but just a few of them attempted to correlate soil erosion with demographic and land use changes [
24,
33,
34]. The studies used most common empirical method of Gavrilović [
11,
12,
18,
19,
24,
34,
35,
36]. Considering the erosion rate as one of the major consequences of land degradation in the Jablanica River Basin, this study aims to assess the changes in soil erosion and the spatial distribution of soil erosion categories for the period 1971–2016.
2. Materials and Methods
2.1. Study Area
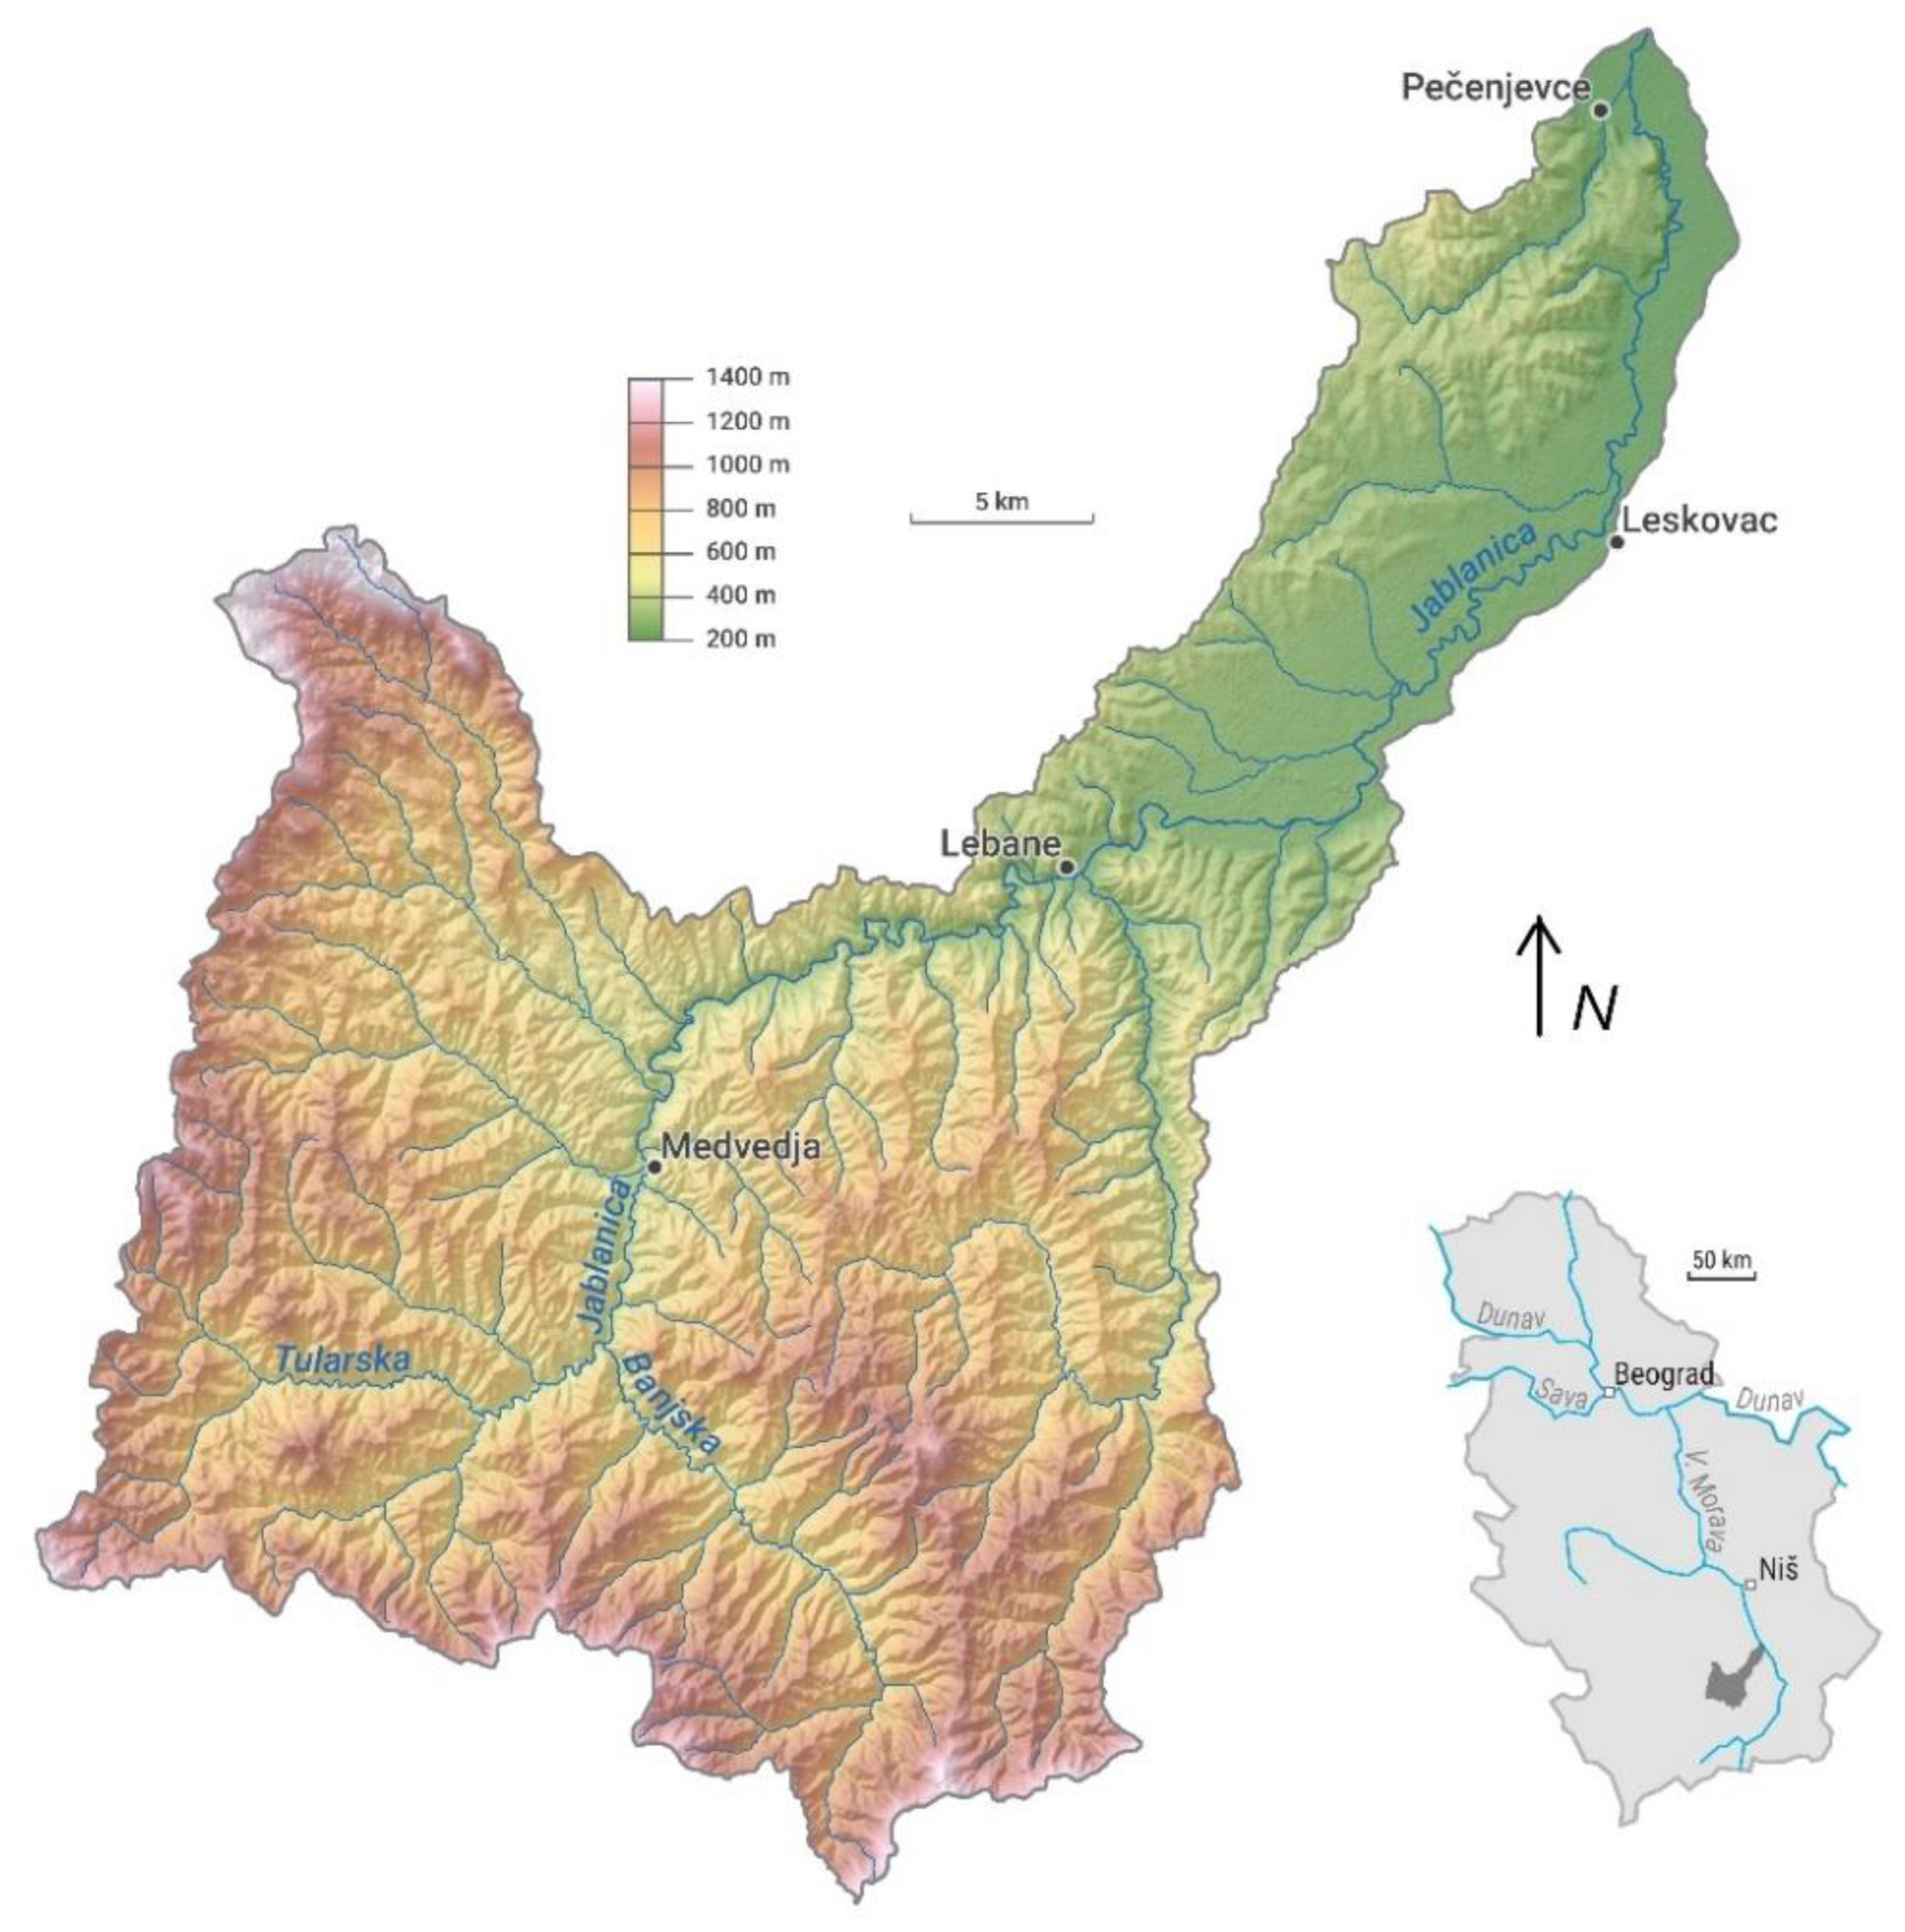
The Jablanica River Basin covers the territory of Southern Serbia, with an area of 909.74 km
2 and a total stream length of 102.6 km (
Figure 1). The elevation ranges from 202 m to 1408 m above sea level. The average altitude of the basin is 590 m. Up to an altitude of 500 m, 35.63% of the basin area is located, 61.6% between 500–1000 m and 2.77% of the basin area is above 1000 m.
The largest part of the basin, 59.9%, is made of crystalline shales and granitoids from Proterozoic. The Tertiary formations in the basin belong to the Upper Oligocene sediments, andesites and their pyroclastites and Neogene deposits—27.2%. Neogene sediments are widespread in the Leskovac Structural Basin and are represented in about 12.9% of the basin area. The basin is located in an area under the influence of a moderate continental climate. The average annual air temperature in the basin is 9.2 °C. The average annual precipitation in the basin is 778 mm.
There are 94 rural settlements in the basin area. In the period 1961–2011, the population decreased from 58,461 to 30,983 inhabitants. An intense population decline has been occurred in settlements located in mountainous peripheral areas away from major roads and city centers. The settlements that registered an increase in population are concentrated along the Jablanica River and its confluence into the Južna Morava, where a large area of arable land is located. The demographic fragmentation and emptying of rural settlements has resulted in an aging population, the emergence of elderly households and a decrease in the working age agricultural population, which in time has led to a decrease in the intensity of erosive processes in the basin area.
2.2. The Erosion Potential Method (EPM)
In this research, we used the Erosion Potential Method of Gavrilović [
37]. It is the most widely accepted and applied empirical method in Serbia, the countries of former Yugoslavia and some European and other countries [
18,
32,
35,
38,
39,
40]. By showing an acceptable accuracy, the EPM method allows for the identification of the areas which are the most susceptible to erosion and degradation processes, with the analysis of the effects of natural factors and anthropogenic activities. Numerous studies across Europe and the world have confirmed the scientific verification of the EPM method and its modifications [
36,
37,
38,
39,
40,
41].
The analytic equation for the calculation of the average gross erosion:
where W
year is the total annual erosion (m
3/year/km
2), T is the temperature coefficient, H
year is the average yearly precipitation (mm), F is the basin area (km
2) and Z is the erosion coefficient.
The temperature coefficient (
T) is calculated from the following equation:
The soil erosion coefficient (Z) can be estimated using the corresponding tables, or can be calculated from the equation:
where
X is the soil protection coefficient, Y is the coefficient of soil resistance,
φ is the erosion and stream network development coefficient and I is the average slope of the watershed (%). The values of the coefficients X, Y and
φ are presented in
Table 1. Erosion intensities are categorized as excessive, strong, medium, weak, very weak or accumulation. The 1971 Erosion Map was used to quantify the change in erosion intensity in the Jablanica River Basin [
42].
In order to use the presented methodology in a GIS environment, the geological, pedological, terrain slope, temperature and land use maps were digitized. Geographic Information System (GIS) was applied to generate the Soil Erosion Intensity Map. Data and model implementation, digitalisation and mapping were done in QG is 3.6. To quantify the change in erosion intensity, the 1971 Erosion Map for the Jablanica River Basin was digitized and compared with the 2016 Erosion Map. Based on the changes in erosion categories on the maps from these two periods, changes in the basin area were determined.
2.3. The Analysis of Proportional Changes
Determining the different types of change in the population dynamics/arable land surface can be made based on the following equations [
32,
43]:
where AC
j represent spatial changes; E
j1 population/arable land surface in rural settlements in 2011; E
j0 population/arable land in rural settlements in 1961; N
j regional development component; T
1 total rural population/arable land surfaces in 2011; T
0 total rural population/arable land surfaces in 1961; R
j net of relative component. The typological classification was made based on a net relative change, the difference between the number of inhabitants/arable land areas in each settlement in 2011 and the hypothetical number of inhabitants/areas under arable land that the settlement would have if the population/arable land in 1961 was proportionally changed in the total population/total area under arable land in the rural settlements.
Based on the results of this analysis, three types of population dynamics and land use changes are distinguished: a progressive type with favorable demographic potentials, huge land use transformation and intensive processes of soil erosion; a stagnant type characterized by moderate population changes with a slight tendency toward population decline, as well as large areas under arable land that have been declining in the recent period; a regressive type with depopulation and deagrarization, which have had a significant decreasing effect on soil erosion. Settlements are the basic territorial level in this research. The impact of the demographic factor on the basin area was determined using the corresponding Statistical Yearbooks of the Statistical Office of the Republic of Serbia for the census years 1961, 1971, 1981, 1991, 2002 and 2011. Changes in the manner of land use in rural settlements in the basin area were determined by comparative analysis using the book
Census of Agriculture for 1960 and 2011 [
44]. The statistics are related to the number of inhabitants, the number of households, the population age and the share of the agricultural population in the total population.
3. Results
Changes in Erosion Intensity in the Period 1971–2016
The spatial and temporal distribution of the erosion coefficient Z indicates that erosion intensity decreased in the investigated period (
Table 2).
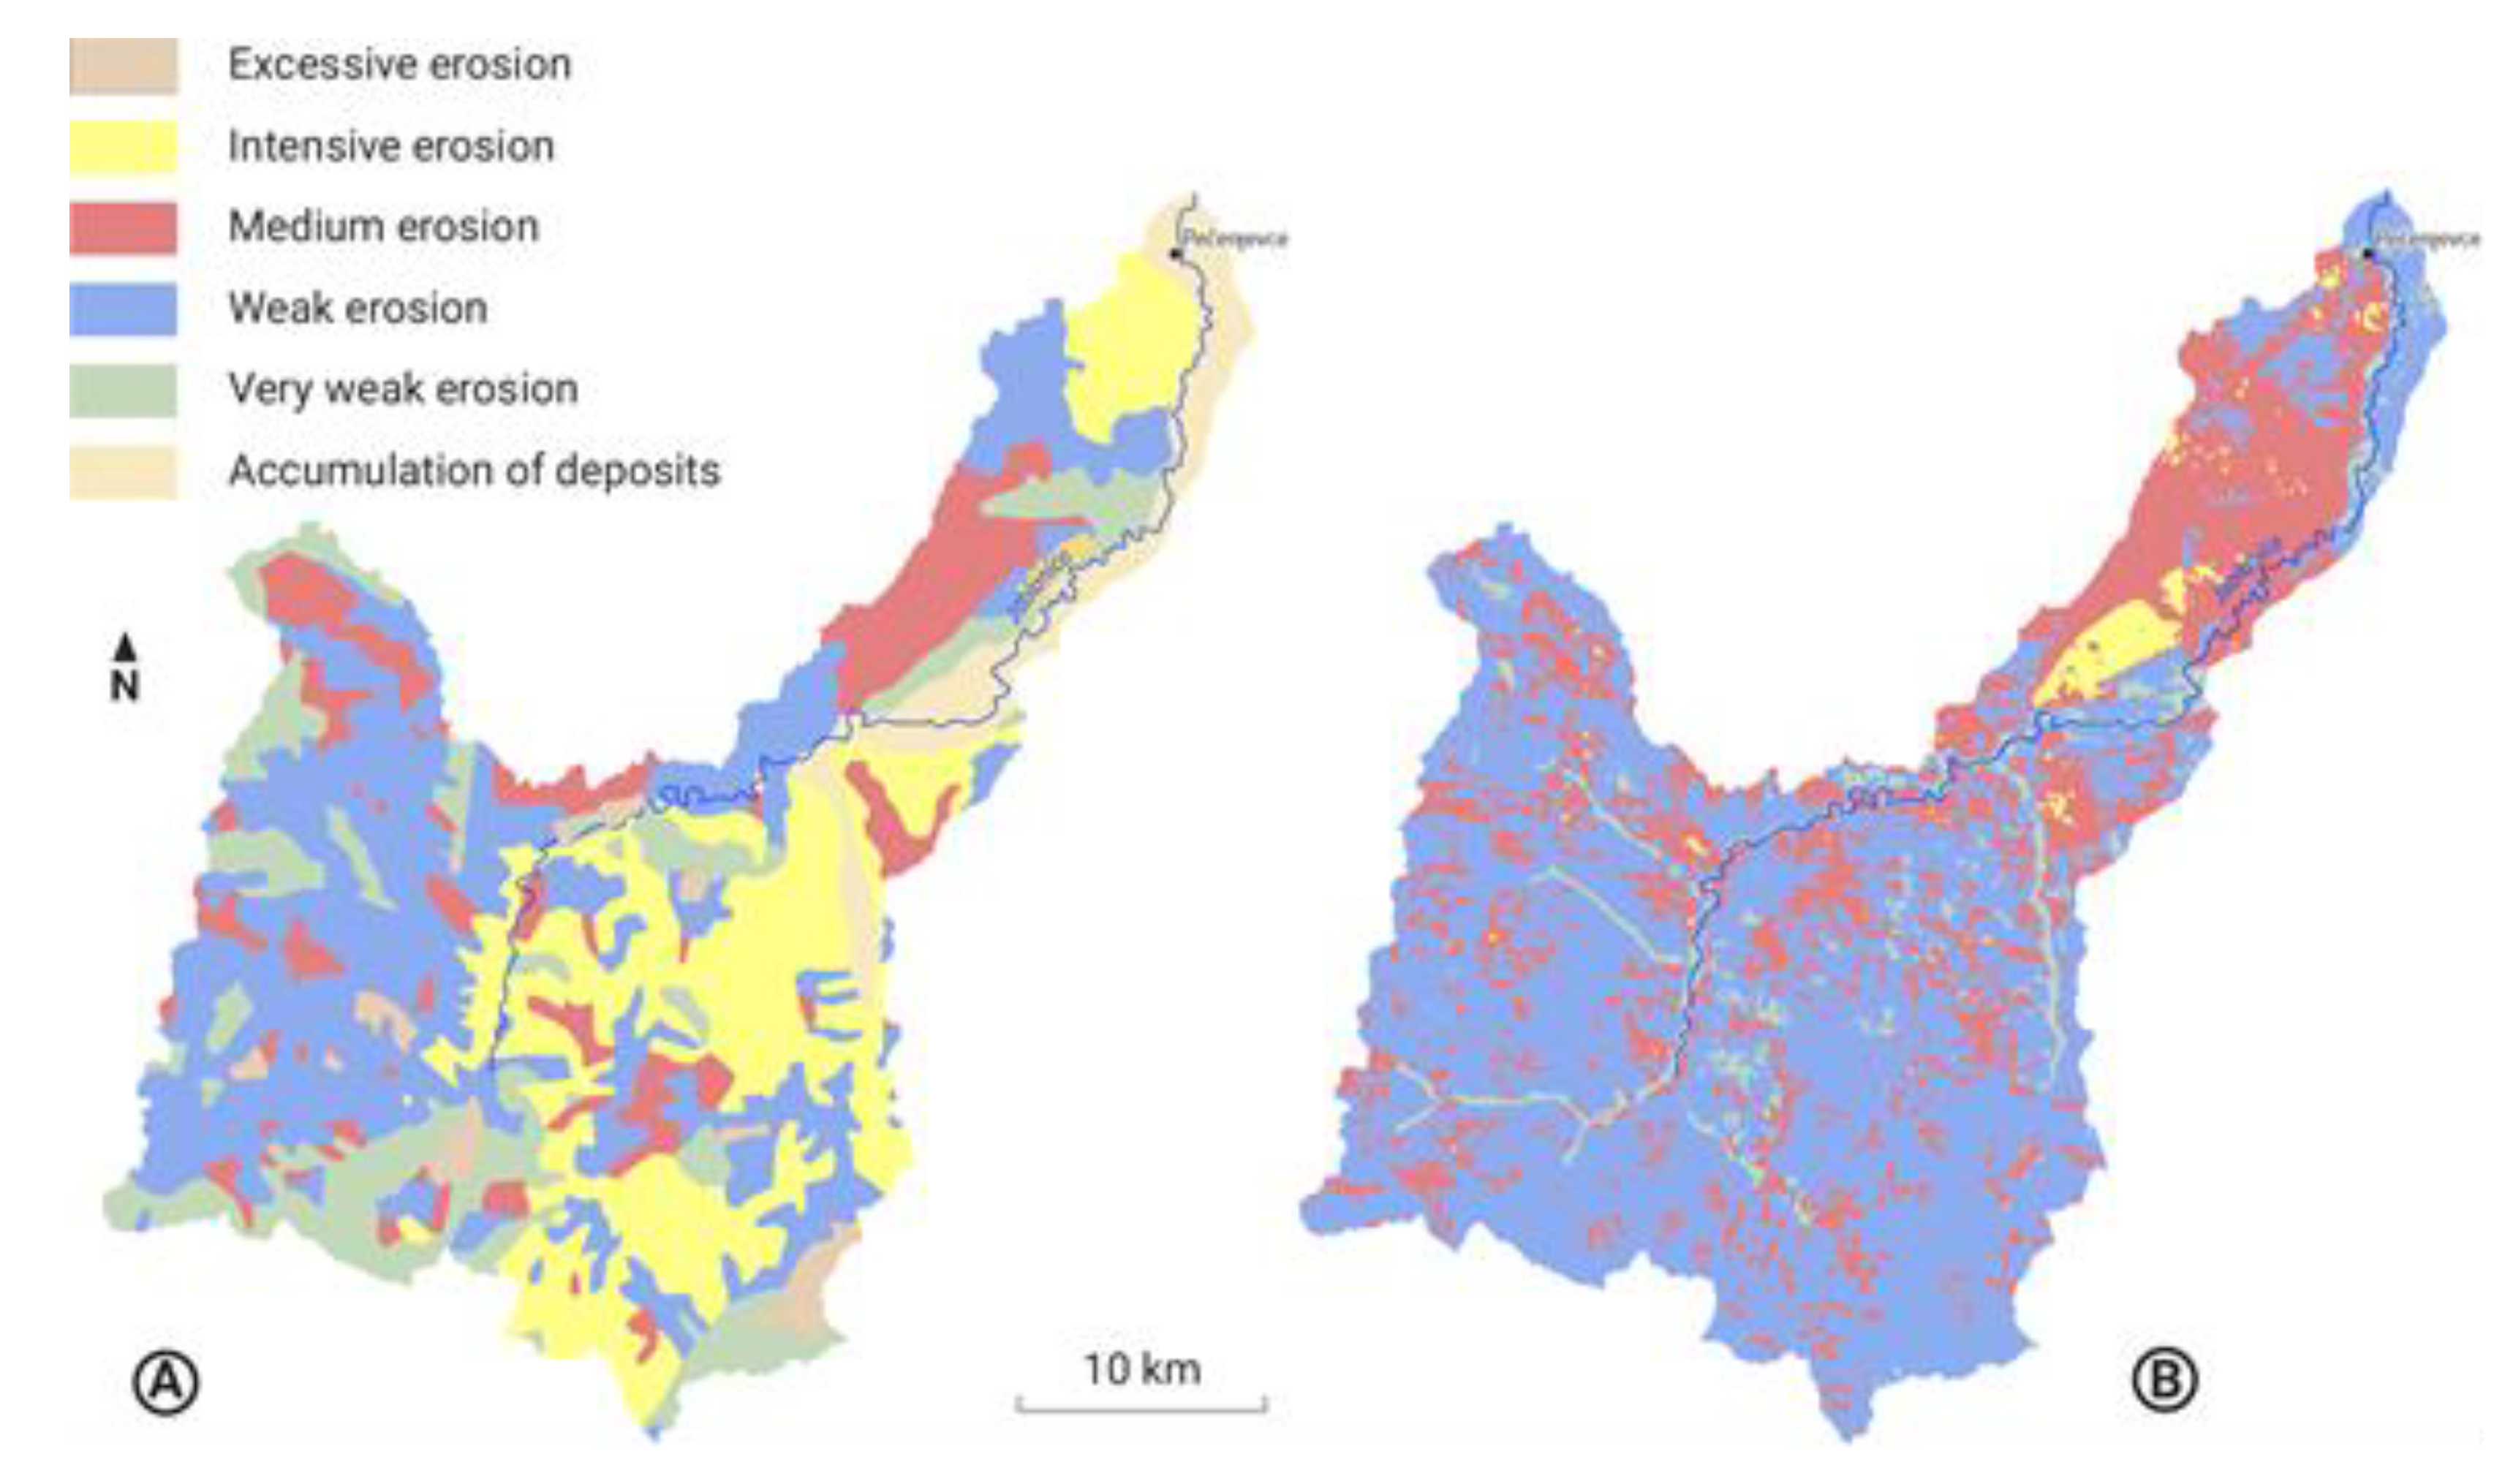
The erosion coefficient of 1971 was 0.432, with a specific sediment load production of 654.41 m
3/km
2/year. In the basin, 28.3% of the territory was affected by severe and excessive erosion. Areas under medium erosion covered 12.7% of the territory, weak 34.3% and very weak 17.6% (
Figure 2A). The most obvious changes in the period 1971–2016 are related to the I and II categories of erosion, which covered only 1.76% of the basin area in 2016. As areas under severe erosion decreased, areas under medium erosion increased, where, according to the 2016 map, 28.8% of the basin area was threatened. In the 2016 erosion map, the greatest share was covered by areas under weak erosion, 65.4%, followed by medium erosion, 28.8%. The erosion coefficient was determined as 0.360, with a specific sediment load production of 472.03 m
3/km
2/year, which indicated a decrease in sediment load production in the period 1971–2016 of 28% (
Figure 2B). A slight increase in the erosion intensity was observed in the lower parts of the basin, along with the river flow, which was characterized by an increase in arable land, an increase in the population (primarily the agricultural population) and the degradation of forest cover in the part of the basin that was heavily influenced by human activity. Mountainous and sub-mountainous parts of the basin, although possessing topographic potential for intensive erosion in the period 1971–2016, recorded a decrease in the intensity of erosive processes (
Figure 2).
The main characteristic of the population trends in the Jablanica Basin is the continuous decrease in the total population. In the period 1961–2011, the total population in the basin decreased from 58,461 to 30,983 inhabitants, which indicates a decrease of 47%. The largest decrease in the total population was recorded in the period 2002–2011 (6511 inhabitants), and in the period 1981–1991 (6337 inhabitants). Comparing the data of the agricultural population from the census of 1961 and 2011, it was noticed that the the total agricultural population decreased from 82.3% to 26.5%. From this percentage, the active agricultural population, in this period, shows a decrease from 78.3% to 54.3%. Additionally, the area under ploughed land and gardens in the basin decreased (21,051 ha in 1961 to 12,215 ha in 2011) as did the areas under forest (from 10,991 ha in 1961 to 9995 ha in 2011).
4. Discussion
Unlike some previous studies that have shown that there is an increase in the intensity of erosion caused by agricultural activity [
18,
45,
46], in the Jablanica Basin, conversely, there has been a decrease in the intensity of the process. Demographic and land use changes, a decrease in arable areas and human and agricultural activities had a significant impact on changes in the intensity of soil erosion, gross erosion and sediment yield. So, the reasons for the soil intensity reduction need to be analyzed in terms of indirect anthropogenic influences. Direct influences are a result of land management, the construction of erosion control works and changes in land use [
25,
26,
27], whereas indirect influences result from abandoning or ceasing to cultivate the land due to the migration of the population from rural into urban areas for economic reasons [
19]. This proved to be significant in the Jablanica Basin as well, but it is very important to consider the levels of changes and the possible impacts on the intensity of soil erosion. In this sense, the changes that led to it were analyzed.
4.1. Analysis of Proportional Changes in Population and Arable Land in Settlements (1961–2011)
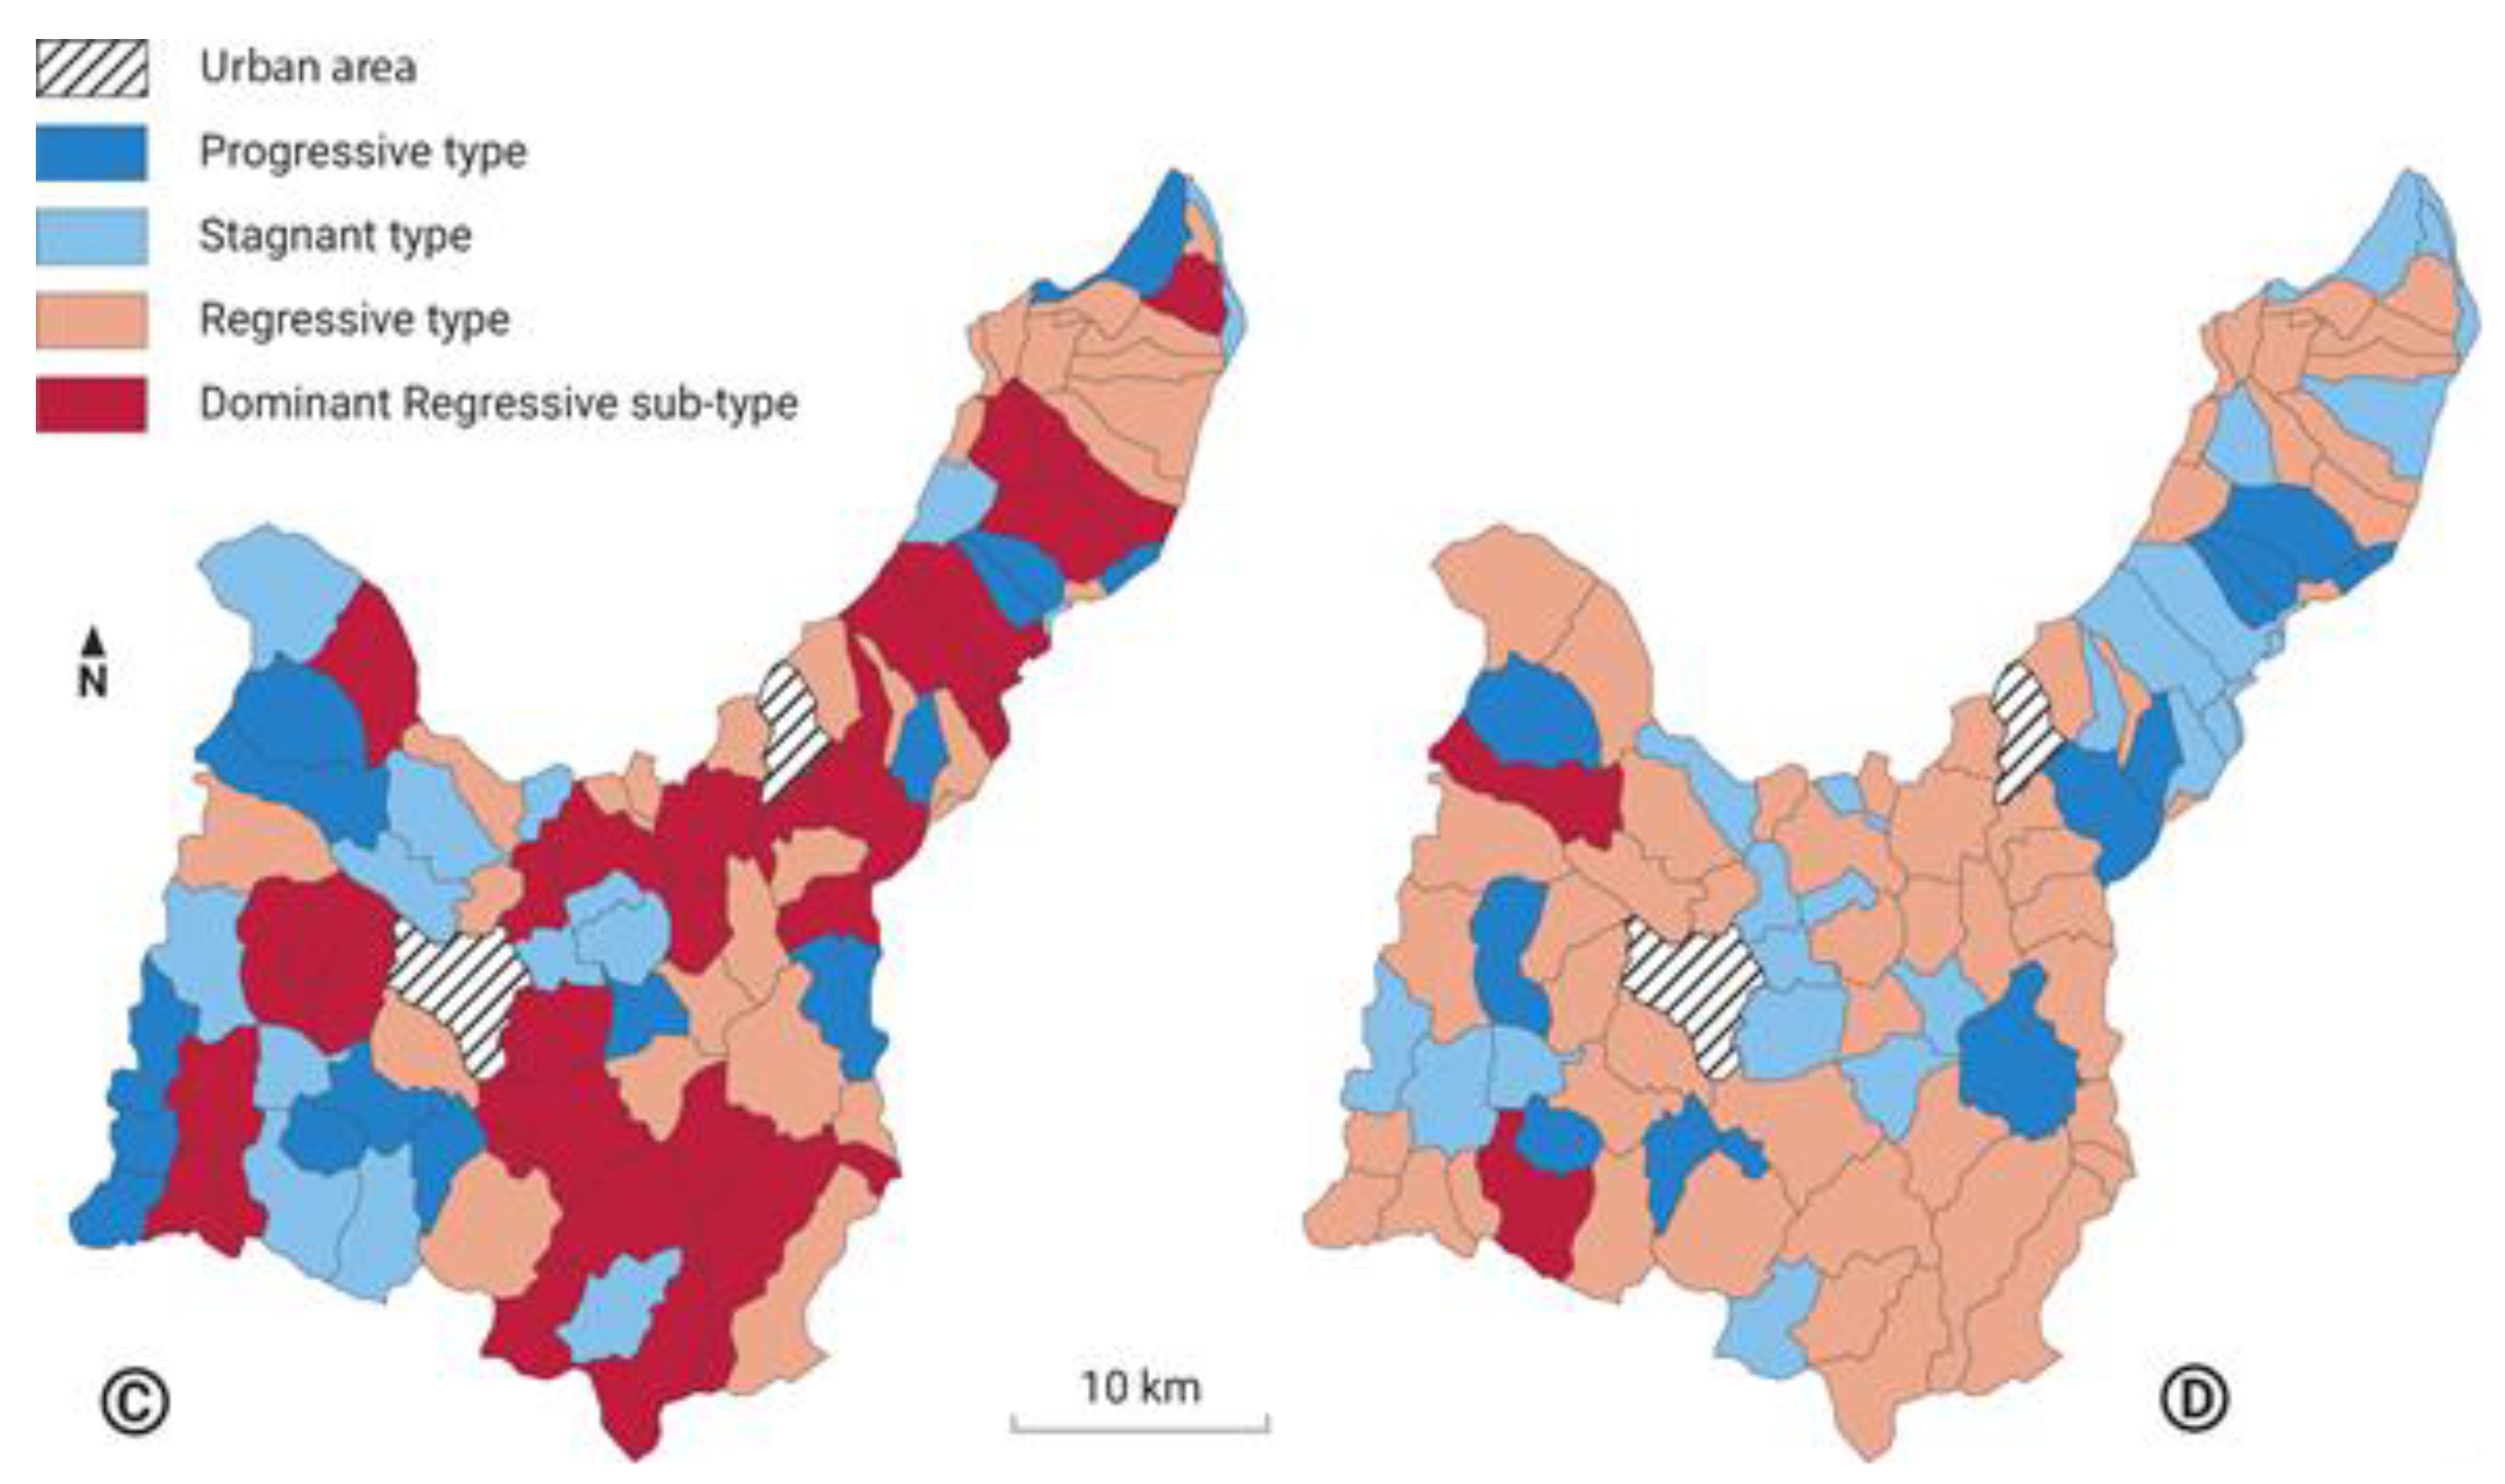
Three components had a major effect on changing rural areas: demographic, economic and land components. According to the values of net relative change (Rj) in the population dynamics/arable land surface, it is possible to distinguish three basic types and one sub-type: progressive type, stagnant type, regressive type and dominant regressive sub-type.
The progressive type of settlement has a positive value of net relative change in the total population (Rj% > 47%) and arable land (Rj% > 47.5%). This type is characterized by a favorable demographic situation and a positive trend of population change. It is characteristic of settlements located near major roads and major city centers and those belonging to suburban areas. This type includes 10 settlements in the basin area. For this reason, this type of settlement constantly records an increase in population. However, most residents of the progressive type of settlement work in cities, have given up agriculture and engage in non-agricultural activities, resulting in a decline in arable land in these settlements. This type of settlement corresponds to a stagnant or regressive type of change in areas under arable land.
The stagnant type is characterized by a positive net relative change in the total population, with a slight declining tendency (0 < Rj% < 47%) and a positive net relative change in arable land (0 < Rj% < 47.5%) that is characteristic of settlements with a predominantly agricultural function and which have large areas under arable land that were reduced in the period 1961–2011. In this type, there are no significant changes in the use of arable land and mainly these settlements are characterized by a stagnant or regressive type of change in the area under arable land.
The regressive type of settlement includes settlements with negative values of net relative change in the total population (0 > Rj% < −47) and arable land (0 > Rj% < −47.5%). This type is characterized by decades of continuous decline in the total population and a decrease in the area under arable land. The largest number of settlements in the basin belongs to this type, as much as 60%. In this type of settlement, due to the decrease in the total population, extreme deagrarization occurs, so that settlements of this type are characterized by significant changes in the purpose of land use. As a result of the declining total population, the land that is no longer used or cultivated is abandoned and, over time, the land is covered in grass and overgrown with natural vegetation. This type of settlement records the largest changes in the arable land use belonging to the dominant regressive type.
A regressive type of settlement with values of net relative change less than (R
j% > −47%) and (R
j% > −47.5) belongs to the dominant regressive sub-type. This type of settlement is characterized by an advanced phase of depopulation, where there was a rapid decline in the total population during the survey period. This type of settlement remains without an agricultural population so that the areas under arable land do not decrease but record stagnation and belong to the stagnant type. The types of settlements according to the change in the number of inhabitants (C) and arable land areas (D) for 1961–2011 are given in
Figure 3. The typology of population dynamics and changes in the arable land surface was analyzed for the period 1961–2011, and an analysis was done of the change in erosion intensity for the period 1971–2016. The reason for this discrepancy in the periods is that the most intense changes in demographic and agrarian geographical transformation began in the 1960s and their results became visible in the early 1970s, as identified by earlier studies [
47,
48].
4.2. Change in Land Use (1961–2011)
The change in land use was determined by a comparative analysis of the 1961 and 2011 agricultural census data (
Table 3). Areas under certain crops are considered to be the areas most influenced by man, which, through inadequate management, create areas where the strongest intensities of erosive processes are represented [
48].
The decrease in erosion intensity is a direct consequence of the reduction of arable land. During the survey period, a 31% reduction of arable land was established (1961—27,807.75 ha; 2011—19,095.28 ha) (
Table 3). In the structure of arable land, the category of ploughed land and gardens was dominant, with a share of 75.7% in 1961 and 64% in 2011.
The share of forests has been reduced from 10,991.7 ha (1961) to 9995.87 ha (2011). The reduction of areas under forests in the basin and the conversion of these areas into arable land or alteration by human activities (the construction of roads, settlements or other infrastructure works) increases the possibility of land degradation and the intensification of erosive processes. The reduction of the share of forests in the basin did not lead to an increase in the intensity of erosion due to large areas of arable land that were abandoned and an intensive depopulation process in all settlements in the basin.
The basic agricultural characteristic in the Jablanica River Basin is the intensive and unplanned reduction of the arable land areas and their redistribution along the river, from the upstream parts at higher altitudes to the downstream parts at lower altitudes. These changes are due to the decrease in the areas under arable land at higher altitudes and the retention or enlargement of the areas at lower altitudes, which indicates that the erosion coefficient remained unchanged or decreased slightly in those areas.
The processes of extreme depopulation and deagrarization in mountainous parts of the basin led to a higher concentration of the population in the lower hypsometric zones, which in 2011 resulted in a higher share of arable land in the area up to 500 m (68.2%). On the other hand, the average share of arable land in the structure of land use in the rural areas of these settlements is the largest and ranges from 45.7–98%. Most settlements at lower altitudes (below 500 m) belong to a stagnant or regressive type of arable land area and a regressive and dominantly regressive sub-type by population (
Figure 3).
Changes in the land use in different parts of Europe over the last 50 years have shown that a decrease in arable land leads to a large decrease in sediment load production [
18,
30,
31]. In the basin, lowland areas are characterized as significant areas of agricultural production, where most of the population is also located, which is why the areas with intensive erosive processes are singled out here. On the other hand, altitudinal parts of the basin (most of the basin) record a drastic decline in population, leading to the destruction of once arable land and, over time, the transition to meadows, pastures or even forest.
4.3. Demographic Change
In the period 1961–2011, the population of settlements in the basin area decreased by 47%. A decrease in population was observed in settlements located in mountainous peripheral areas away from major roads and city centers. As a consequence, there was a process of fragmentation of rural settlements, which was reflected in the increase in the number of settlements with less than 100 inhabitants (no settlements in 1961, and 42 settlements in 2011).
The highest concentration of the population was represented in the altitudinal zone up to 500 m. In 1961, 58.8% of the population lived in settlements up to the altitude of 500 m, and in 2011, it was as much as 87.7% of the population. The largest proportion of settlements, 50% of the total number, was also in these altitudinal zones (up to 500 m). The average population per settlement was 629 inhabitants in 1961 and 336 in 2011 (
Table 4).
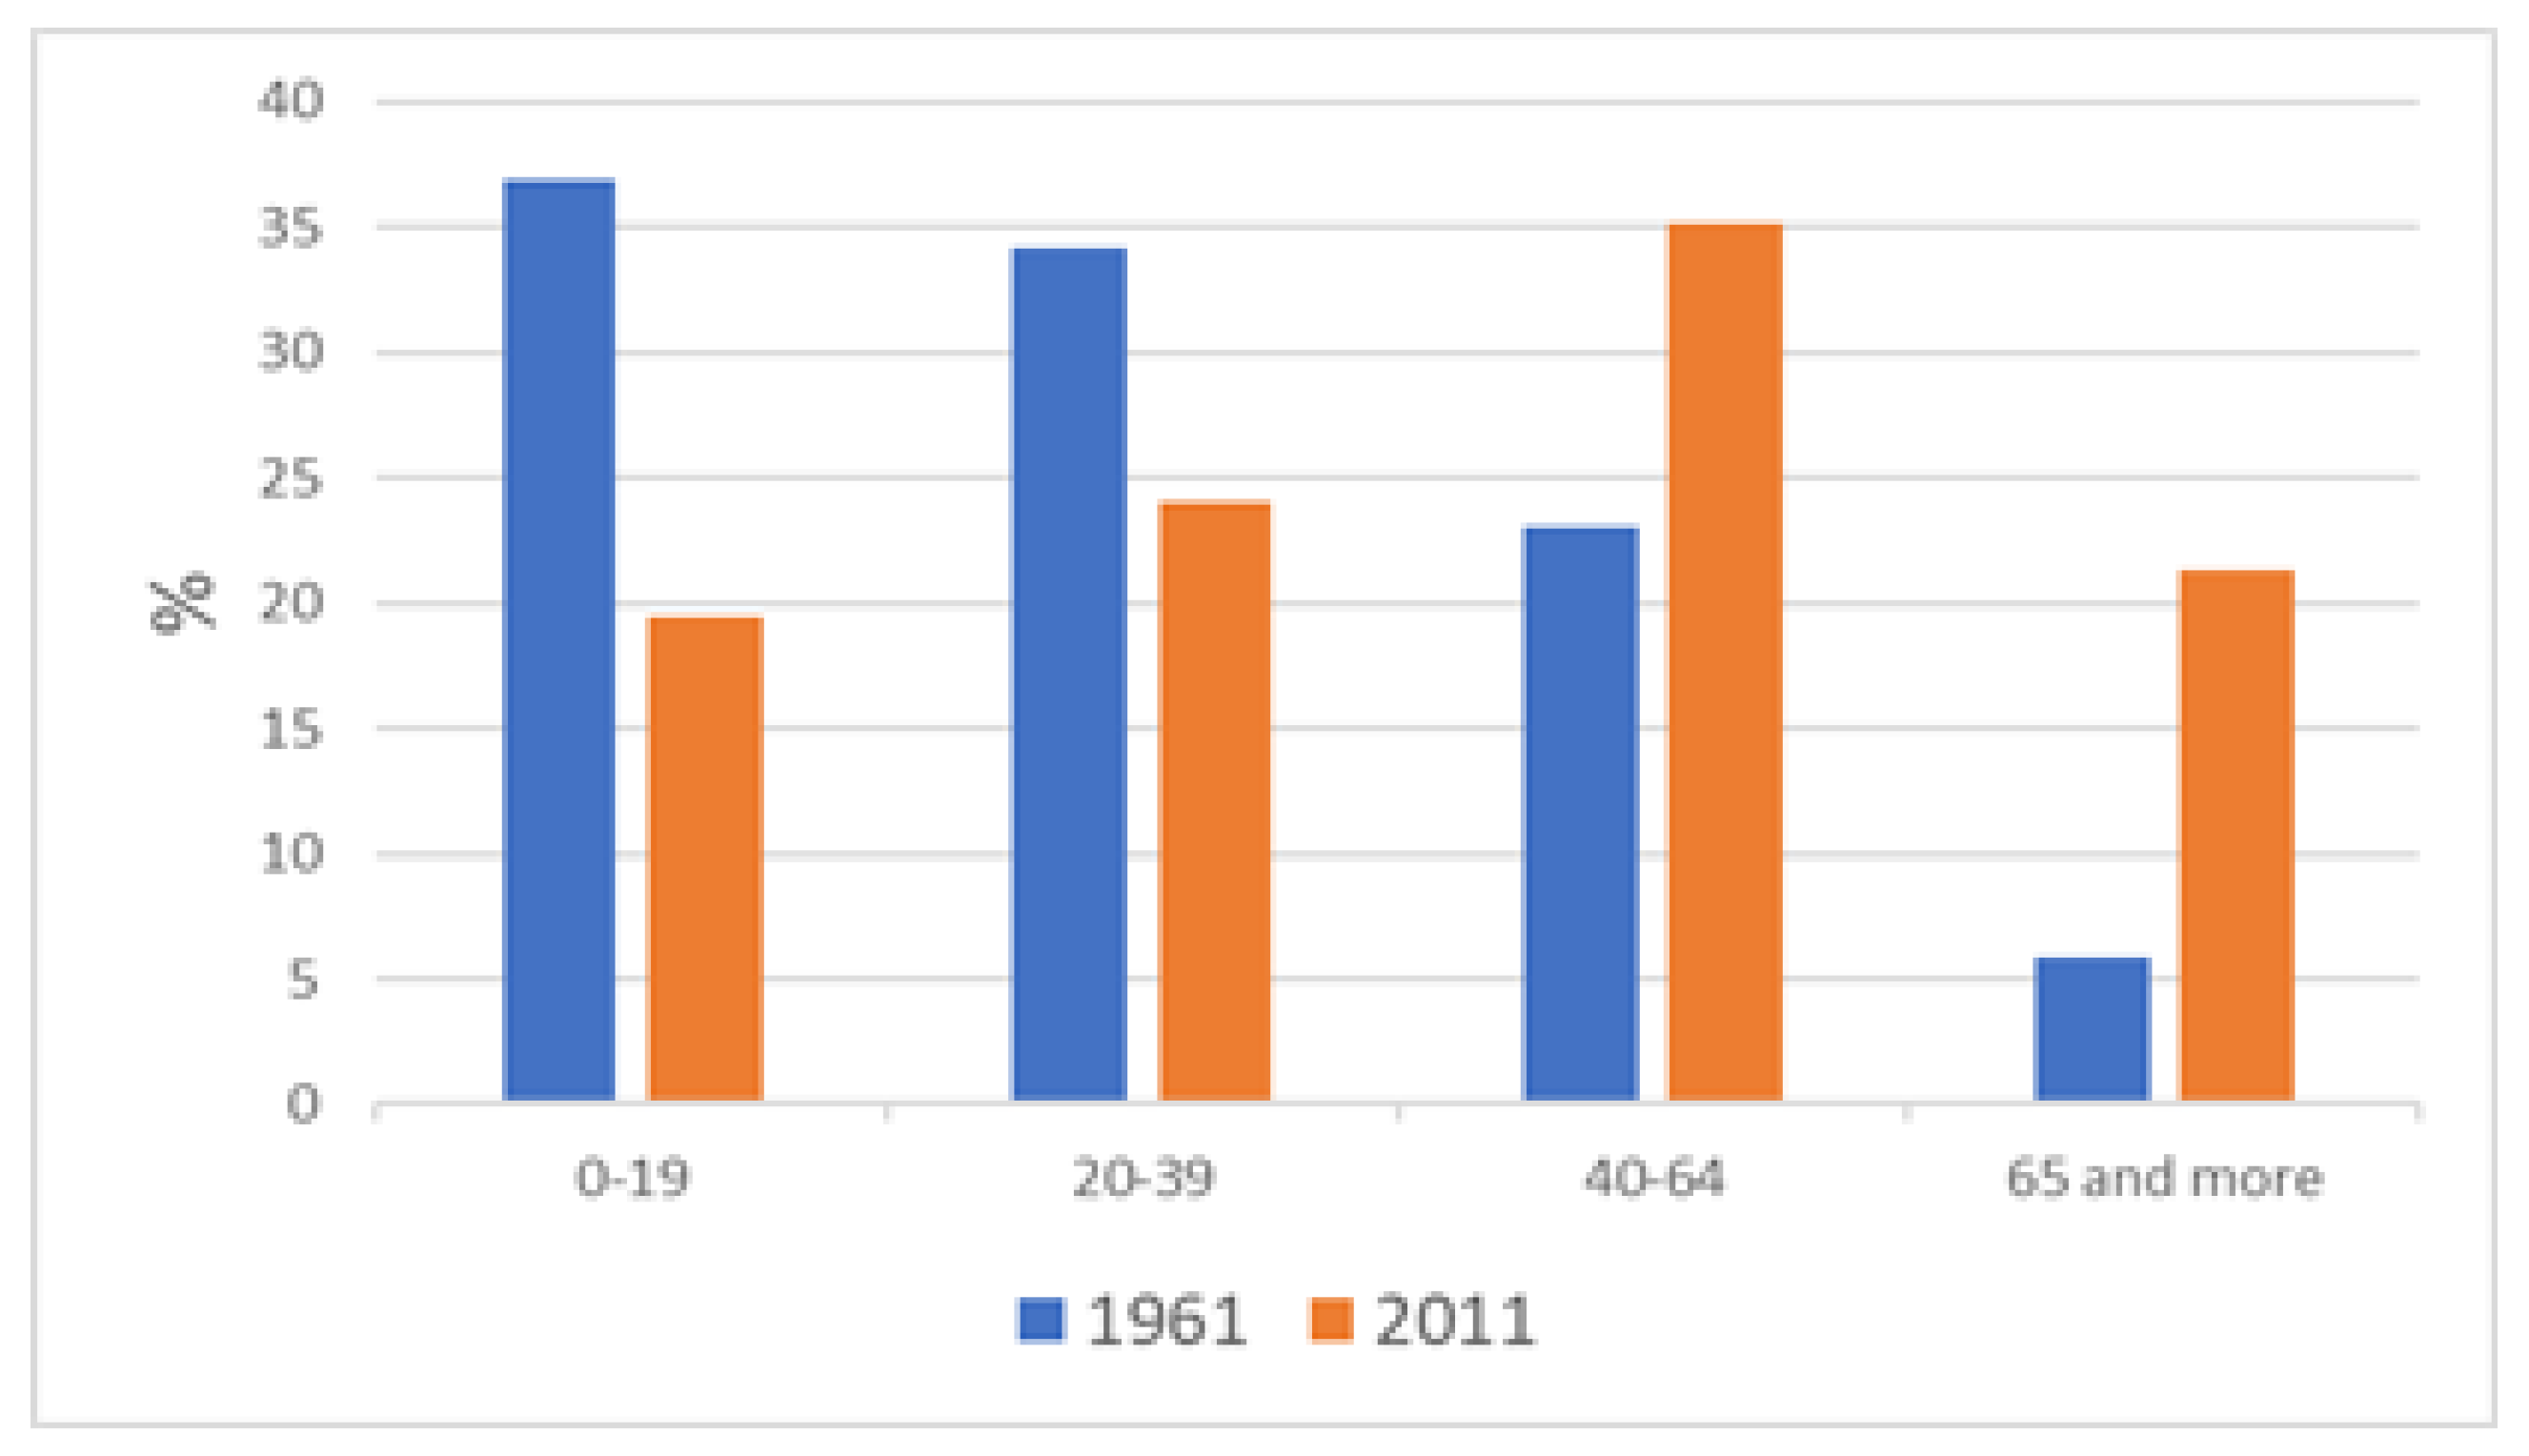
The drastic decrease in the total population is the result of natural and mechanical movements (migration) of the population. A direct consequence of these movements is a disruption of the age structure. Age structure is a unifying factor between the condition and quality of the population, which is reflected in how the land is used, especially in rural areas [
33]. The analysis of the age structure of the population is based on the observation of the share of large age groups: young population (up to 19 years); younger middle-aged (20–39 years); older middle-aged (40–64 years old) and old population (over 65 years old). In 1961, the young population made up 36.9% of the total population, and in 2011 only 19.5% of the total population. The proportion of the younger middle-aged population was reduced from 34.2% in 1961 to 23.9% in 2011. The aging process of the population has been identified, as the older middle-aged and elderly population increase. In the same period, the middle-aged population increased its share of the total population from 23% to 35%, while the elderly population increased from 5.7% to 21.3% (
Figure 4). This indicates the demographic aging of the population, which was also reflected in the manner of land use, and in this connection there was a reduction of erosive processes in the areas affected by the processes of depopulation and the aging of the population.
The process of deagrarization is the abandonment of agriculture by the agrarian population, to whom agriculture was the sole activity and source of income. This process influences the change in the appearance of settlements, landmarks, transformation, migration movements of the population, the disturbance of gender and age structure and changes in the purpose of land use. The agricultural and non-agricultural populations show a degree of deagrarization in relation to each other [
43]. Comparing the data on the movements of the agricultural population, from the census of 1961 and 2011, we can conclude that the total agricultural population decreased from 82.3% to 26.5%. Most of the inhabitants of the settlements located near city centers abandoned agriculture and changed the type of activity they do, and agriculture remains an additional activity they engage in. The agricultural population is getting older, it is decreasing and, as a consequence, the area under arable land in the rural settlements in the basin area is decreasing.
Changes in population structure in the Jablanica River Basin are in line with demographic trends in rural settlements in the Republic of Serbia [
49].
5. Conclusions
The results of the research show that a decrease in erosion was recorded in the Jablanica River Basin in the period 1971–2016.
The depopulation of rural areas is the basic demographic characteristic of the basin, followed by the process of deagrarization. The abandonment of agriculture, which was the most important economic activity and source of income of the population, and their restructuring into non-agrarian activities, significantly affected the way the land was used.
This research has shown that the change in land use occurs due to the abandonment of arable land by the population due to economic and social changes and this has a great impact on soil erosion. Observed land abandonment has positive impacts because the erosion intensity is reduced.
The results of this research can be helpful in the investigation of the soil erosion rate under the land use and demographic changes at a watershed level.
As land loss caused by erosion is a major country-wide problem in the Republic of Serbia, the calculation of erosion coefficients for the entire country is a necessity for the general development of the economy and society.
Author Contributions
Conceptualization and methodology M.G. and S.D.; investigation, M.G., S.D. and A.R.; writing—review and editing, N.M.B., L.S. and M.Đ.; visualization, M.Đ. All authors have read and agreed to the published version of the manuscript.
Funding
This research received no external funding.
Conflicts of Interest
The authors declare no conflict of interest.
References
- Mitasova, H.; Hofierka, J.; Zlocha, M.; Iverson, L. Modeling topographic potential for erosion and deposition using GIS. Int. J. Geogr. Inf. Sci. 1997, 10, 629–641. [Google Scholar] [CrossRef]
- Bakker, M.; Govers, G.; Kosmas, C.; Vanacker, V.; Van Oost, K.; Rounsevell, M. A soil erosion as a driver of land use change. Agric. Ecosyst. Environ. 2005, 105, 467–481. [Google Scholar] [CrossRef]
- Cerdan, O.; Govers, G.; Le Bissonnais, Y.; Van Oost, K.; Poesen, J.; Saby, N.; Gobin, A.; Vacca, A.; Quinton, J.; Auerswald, K.; et al. Rates and spatial variations of soil erosion in Europe: A study based on erosion plot data. Geomorphology 2010, 122, 167–177. [Google Scholar] [CrossRef]
- Životić, L.; Perović, V.; Jaramaz, D.; Đorđević, A.; Petrović, R.; Todorović, M. Application of USLE, GIS and Remote Sensing in the Assessment of soil erosion rates in Southeastern Serbia. Pol. J. Environ. Stud. 2012, 21, 1929–1935. [Google Scholar]
- Leh, M.; Bajwa, S.; Chaubey, I. Impact of land use change on erosion risk: An integrated remote sensing, geopraphic information system and modeling methodology. Land Degrad. Dev. 2013, 24, 409–421. [Google Scholar] [CrossRef]
- Serpa, D.; Nunes, J.P.; Santos, J.; Sampaio, E.; Jacinto, R.; Veiga, S.; Lima, J.C.; Moreira, M.; Corte-Real, J.; Keizer, J.J.; et al. Impacts of climate and land use changes on the hydrological and erosion processes of two contrasting Mediterranean catchments. Sci. Total Environ. 2015, 538, 64–77. [Google Scholar] [CrossRef] [Green Version]
- Zhang, B.; He, C.; Burnham, M.; Zhang, L. Evaluating the coupling effects of climate aridity and vegetation restoration on soil erosion over the Loess Plateau in China. Sci. Total Environ. 2016, 539, 439–449. [Google Scholar] [CrossRef]
- Khaledian, Y.; Kiani, F.; Ebrahimi, S.; Brevik, E.; Aitkenhead-Peterson, J. Assessment and monitoring of soil degradation during land use change using multivariate analysis. Land Degrad. Dev. 2017, 28, 128–141. [Google Scholar] [CrossRef]
- Stefanidis, S.; Chatzichristaki, C. Response of soil erosion in a mountainous watershed to temperature and precipitation trends. Carpathian J. Earth Environ. Sci. 2017, 12, 35–39. [Google Scholar]
- Sharma, A.; Tiwari, K.N.; Bhadoria, P.B. Effect of land use land cover change on soil erosion potential in an agricultural watershed. Environ. Monit. Assess. 2011, 173, 789–801. [Google Scholar] [CrossRef]
- Tošić, R.; Dragićević, S.; Lovrić, N. Assessment of soil erosion and sediment yield changes using erosion potential model–case study: Republic of Srpska (BiH). Carpathian J. Earth Environ. Sci. 2012, 7, 147–154. [Google Scholar]
- Tošić, R.; Kapović, M.; Lovrić, N.; Dragićević, S. Assessment of soil erosion potential using Rusle and Gis: A case study of Bosnia and Herzegovina. Fresenius Environ. Bull. 2013, 22, 3415–3423. [Google Scholar]
- Kostadinov, S.; Braunović, S.; Dragićević, S.; Zlatić, M.; Dragović, N.; Rakonjac, N. Effects of erosion control works: Case study-Grdelica Gorge, the South Morava River (Serbia). Water 2018, 10, 1094. [Google Scholar] [CrossRef] [Green Version]
- Uddin, K.; Matin, M.A.; Maharjan, S. Assessment of Land Cover Change and Its Impact on Changes in Soil Erosion Risk in Nepal. Sustainability 2018, 10, 4715. [Google Scholar] [CrossRef] [Green Version]
- Perović, V.; Kadović, R.; Đurđević, V.; Braunović, S.; Čakmak, D.; Mitrović, M.; Pavlović, P. Effects of changes in climate and land use on soil erosion: Case study of the Vranjska Valley, Serbia. Reg. Environ. Chang. 2019, 19, 1035–1046. [Google Scholar] [CrossRef]
- Ozsahin, E.; Duru, U.; Eroglu, I. Land Use and Land Cover Changes (LULCC), a Key to Understand Soil Erosion Intensities in the Maritsa Basin. Water 2018, 10, 335. [Google Scholar] [CrossRef] [Green Version]
- Van Rompaey, A.; Govers, G.; Puttemans, C. Modelling land use changes and their impact on soil erosion and sediment supply to rivers. Earth Surf. Process. Landf. 2002, 27, 481–494. [Google Scholar] [CrossRef]
- Zorn, M.; Komac, B. Response of soil erosion to land use change with particular reference to the last 200 years (Julian Alps, Western Slovenia). In Proceedings of the IAG Regional Conference on Geomorphology: Landslides, Floods and Global Environmental Change in Mountian Regions, Brasov, Romania, 15–25 September 2008; pp. 39–47. [Google Scholar]
- Tošić, R.; Lovrić, N.; Dragićević, S. Assessment of the impact of depopulation on soil erosion: Case study-Republika Srpska (Bosnia & Herzegovina). Carpathian J. Earth Environ. Sci. 2019, 14, 505–518. [Google Scholar]
- Perović, V.; Životić, L.; Kadović, R.; Đorđević, A.; Jaramaz, D.; Mrvić, V.; Todorović, M. Spatial modelling of soil erosion potential in a mountainous watershed of South-eastern Serbia. Environ. Earth Sci. 2013, 68, 115–128. [Google Scholar] [CrossRef]
- Ristić, R.; Košanin-Grubin, M.; Radić, B.; Nikić, Z.; Vasiljević, N. Land Degradation at the Stara Planina Ski Resort. Environ. Manag. 2012, 49, 580–592. [Google Scholar] [CrossRef]
- Zlatić, M.; Vukelić, G. Economic and Social Revival of a Degraded Region in Serbia. Mt. Res. Dev. 2002, 22, 26–28. [Google Scholar] [CrossRef]
- Dragićević, S.; Stepić, M. Changes of the erosion intensity in the Ljig river basin–the influence of the antropogenic factor. Bull. Serb. Geogr. Soc. 2006, 86, 37–44, (In Serbian with English abstract). [Google Scholar]
- Kostadinov, S.; Zlatić, M.; Dragićević, S.; Novković, I.; Košanin, O.; Borisavljević, A.; Lakićević, M.; Mlađan, D. Antropogenic Influence on Erosion Intensity Changes in Rasina River Watershed Area upstream from “Ćelije” Water Reservoir, Central Serbia. Fresenius Environ. Bull. 2014, 23, 254–263. [Google Scholar]
- Ahmad, Z.; Ashraf, A.; Zaheer, M. Hydrological response to environment change in Himalayan watersheds: Assessment from inregrated modeling approach. J. Mt. Sci. 2015, 12, 972–982. [Google Scholar] [CrossRef]
- Feng, X.M.; Wang, Y.F.; Chen, L.D.; Fu, B.J.; Bai, G.S. Modeling soil erosion and its response to land-use change in hilly catchments of the Chinese Loess Plateau. Geomorphology 2010, 118, 239–248. [Google Scholar] [CrossRef]
- Lopez-Vicente, M.; Poesen, J.; Navas, A.; Gaspar, L. Predicting runoff and sediment connectivity and soil erosion by water for different land use scenarious in the Spanish Pre-Pyrenees. Catena 2013, 102, 62–73. [Google Scholar] [CrossRef]
- Miljković, P.; Belanović Simić, S. Soil loss data comparation using USLE and WaTEM/SEDEM model in the Polomska River Catchment, Serbia. Fresenius Environ. Bull. 2020, 29, 5012–5020. [Google Scholar]
- Braunović, S. Effects of Erosion Control Works on the State of Erosion in Grdelicka Klisura and Vranjska Kotlina. Ph.D. Thesis, University of Belgrade, Belgrade, Serbia, 2013. (In Serbian). [Google Scholar]
- Perović, V.; Životić, L.; Čakmak, D.; Mrvić, V.; Milanović, M.; Saljinikov, E. Design and implementation of WebGIS technologies in evaluation of erosion intensity in the municipality of Nis (Serbia). Environ. Earth Sci. 2016, 75, 211. [Google Scholar] [CrossRef]
- Perović, V.; Jakšić, D.; Perović, V.; Koković, N.; Čakmak, D.; Mitrović, M.; Pavlović, P. Spatio-temporal analysis of land use/land cover change and its effects on soil erosion (Case study in the Oplenac wine-producting area, Serbia). Environ. Monit. Assess. 2018, 190, 675. [Google Scholar] [CrossRef]
- Manojlović, S.; Antić, M.; Šantić, D.; Sibinović, M.; Carević, I.; Srejić, T. Anthropogenic Impact on Erosion Intensity: Case Study of Rural Areas of Pirot and Dimitrovgrad Municipalities, Serbia. Sustainability 2018, 10, 826. [Google Scholar] [CrossRef] [Green Version]
- Zlatić, M. Socio-Economic Aspects of Degradation and Soil Management for Sustainability in Mountainous Regions. In Proceedings of the International Year of Mountains Conference: “Natural and Socio-Economic Effects of Erosion Control in Mountainous Regions, key note paper, Vrujci Spa, Serbia, 10–13 December 2002; pp. 497–516. [Google Scholar]
- Manojlović, S.; Antić, M.; Sibinović, M.; Dragicević, S.; Novković, I. Soil erosion response to demographic and land use changes in the Nišava river basin, Serbia. Fresenius Environ. Bull. 2017, 26, 7547–7560. [Google Scholar]
- Haghizadeh, A.; Teang Shui, L.; Godarzi, E. Forecasting Sediment with Erosion Potential Method with Emphasis on land use changes at basin. Electron. J. Geotech. Eng. 2009, 14, 1–12. [Google Scholar]
- Dragičević, N.; Karleuša, B.; Ožanić, N. A review of the Gavrilović method (erosion potential method) application. Građevinar 2016, 68, 715–725. [Google Scholar]
- Gavrilović, S. Torrential flow Engineering and Erosion Processes; Izgradnja Publisher: Beograd, Serbia, 1972; p. 192. (In Serbian) [Google Scholar]
- Kastridis, A.; Kamperidou, V. Influence of land use changes on alluviation of Volvi Lake wetland (North Greece). Soil Water Res. 2015, 10, 121–129. [Google Scholar] [CrossRef] [Green Version]
- Salahalddin, S.A.; Al-Umary, F.A.; Salar, G.S.; Al-Ansari, N.; Knutsson, S. GIS based soil erosion estimation using EPM method, Garmiyan Area, Kurdistan Region, Iraq. J. Civil Eng. Archit. 2016, 10, 291–308. [Google Scholar] [CrossRef] [Green Version]
- Solaimani, K.; Modallaladoust, S.; Lotfi, S. Investigation of land use changes on soil erosion process using geographical information system. Int. J. Environ. Sci. Technol. 2009, 6, 415–424. [Google Scholar] [CrossRef] [Green Version]
- Da Silva, R.M.; Santos, C.A.G.; Silva, A.M. Predicting soil erosion and sediment yield in the Tapacura Catchement, Brazil. J. Urban Environ. Eng. 2014, 8, 75–82. [Google Scholar] [CrossRef] [Green Version]
- Lazarević, R. Erosion Map of SR Serbia. Scale 1:500000; Institute of Forestry: Belgrade, Serbia, 1983. [Google Scholar]
- Antić, M.; Šantić, D.; Kašanin-Grubin, M.; Malić, A. Sustainable rural development in Serbia–Relationship between population dynamicss and environment. J. Environ. Prot. Ecol. 2017, 18, 323–331. [Google Scholar]
- Statistical Office of the Republic of Serbia 1961–2011. Available online: http://www.stat.gov.rs (accessed on 5 February 2019).
- Zarei, A.R.; Mokarram, M. Assessment of soil erosion and sediment yield changes using erosion potential method: Case study of Sangcharak catchement in Fars, Iran. Int. J. Agric. Resour. Gov. Ecol. 2016, 12, 344–356. [Google Scholar]
- Spalević, V.; Barović, G.; Fikfak, A.; Kosanović, S.; Đurović, M.; Popović, S. Sediment yield and land use changes in the Northern Montenegrin watersheds: Case study of Seocki potok of the Polimlje region. J. Environ. Prot. Ecol. 2016, 17, 990–1002. [Google Scholar]
- Mustafić, S. Geographic Factors as Determinants of Erosion Intensity in the Nišava River Basin. Ph.D. Thesis, Faculty of Geography, University of Belgrade, Belgrade, Serbia, 2013. (In Serbian). [Google Scholar]
- Manojlović, S. Influence of Geographical Factors on Changes in the Intensity of Water Erosion in the Nišava River Basin; Faculty of Geography: Belgrade, Serbia, 2018. (In Serbian) [Google Scholar]
- Vuksanović, G. The formation of old age agricultural households. Matica Srp. Proc. Soc. Sci. 1991, 90, 149–155. [Google Scholar]
© 2020 by the authors. Licensee MDPI, Basel, Switzerland. This article is an open access article distributed under the terms and conditions of the Creative Commons Attribution (CC BY) license (http://creativecommons.org/licenses/by/4.0/).

 ,
, 


