Article

Using Multispectral Imaging for Detecting Seed-Borne Fungi in Cowpea

by
Carlos Henrique Queiroz Rego
1,*,
Fabiano França-Silva
1,
Francisco Guilhien Gomes-Junior
1,
Maria Heloisa Duarte de Moraes
2,
André Dantas de Medeiros
3 and
Clíssia Barboza da Silva
4
1
Department of Crop Science, College of Agriculture “Luiz de Queiroz”, University of São Paulo, Piracicaba 13418-900, SP, Brazil
2
Department of Plant Pathology and Nematology, College of Agriculture “Luiz de Queiroz”, University of São Paulo, Piracicaba 13418-900, SP, Brazil
3
Department of Agronomy, Federal University of Viçosa, Viçosa 36570-900, MG, Brazil
4
Laboratory of Radiobiology and Environment, Center for Nuclear Energy in Agriculture, University of São Paulo, Piracicaba 13416-060, SP, Brazil
*
Author to whom correspondence should be addressed.
Submission received: 13 July 2020 / Revised: 5 August 2020 / Accepted: 8 August 2020 / Published: 17 August 2020
(This article belongs to the Special Issue Modern Seed Technology)

Abstract

:
Recent advances in multispectral imaging-based technology have provided useful information on seed health in order to optimize the quality control process. In this study, we verified the efficiency of multispectral imaging (MSI) combined with statistical models to assess the cowpea seed health and differentiate seeds carrying different fungal species. Seeds were artificially inoculated with Fusarium pallidoroseum, Rhizoctonia solani and Aspergillus sp. Multispectral images were acquired at 19 wavelengths (365 to 970 nm) from inoculated seeds and freeze-killed ‘incubated’ seeds. Statistical models based on linear discriminant analysis (LDA) were developed using reflectance, color and texture features of the seed images. Results demonstrated that the LDA-based models were efficient in detecting and identifying different species of fungi in cowpea seeds. The model showed above 92% accuracy before incubation and 99% after incubation, indicating that the MSI technique in combination with statistical models can be a useful tool for evaluating the health status of cowpea seeds. Our findings can be a guide for the development of in-depth studies with more cultivars and fungal species, isolated and in association, for the successful application of MSI in the routine health inspection of cowpea seeds and other important legumes.

1. Introduction

Cowpea (Vigna unguiculata L. Walp) is a leguminous species which is of nutritional and social importance in underdeveloped regions due to the high protein content in its grains [1,2]. For example, most of the production in Brazil comes from family farming, especially in the North and Northeast regions, but it has currently aroused the interest of farmers in the Midwest region who practice commercial agriculture [3].
Despite its adaptability and rusticity, cowpea seeds are susceptible to several fungal diseases. According to Biemond et al. [4], the contamination of cowpea seeds by Aspergillus flavus, Macrophomina phaseolina, Fusarium oxysporum and Penicillium sp. contribute to a marked reduction in germination and seed weight, in addition to acting on accelerating deterioration by producing aflatoxins, thus limiting commercialization of its seeds and consumption of grains.
In agricultural industry, the seed health is mainly monitored by detecting fungi species and their percentages present in the sample, which contributes to make decision regarding the suitability of a lot destined for sowing or marketing [5]. The blotter test is the most well-known and used method for detecting seed-borne fungi. However, it is a time-consuming and subjective test since it depends on visual inspections and requires highly trained specialists [6].
Innovative, accurate and rapid light-based methods have been developed to meet the growing demands of the food and agricultural industries, which can produce a consistent assessment of seed health, overcoming the intrinsic subjectivity of conventional techniques [6]. Unaltered samples can be analyzed with non-destructive and real time visualization of the pathological attributes of seeds, with optimization in the quality control process [7,8]. In addition, these tools produce complementary information related to the energy-matter interaction in the context of seed quality.
The multispectral imaging (MSI) technology is based on the use of spectral bandwidths in the ultraviolet, visible and infrared regions in order to obtain spatial and spectral information from the objects under evaluation [9,10], therefore, it can be a useful tool to distinguish healthy seeds from seeds that are carrying important pathogens [11,12,13]. For instance, there are reports that the use of MSI showed over 80% separation of healthy spinach seeds from those with different fungi species [14].
Considering that each material has intrinsic spectral characteristics that vary according to chemical or physical attributes, this study had two main objectives. Firstly, to evaluate the efficiency of the MSI technique in the evaluation of cowpea seed health. The second objective was to evaluate whether different fungal species can be discriminated using MSI associated with statistical models, before and after seed incubation.

2. Materials and Methods

2.1. Seed Samples and Fungi Inoculation

Cowpea seeds from BRS Tucumanque cultivar were used in this study. Seeds were inoculated with three fungi species isolates (Fusarium pallidoroseum, Rhizoctonia solani and Aspergillus sp.). Each species of fungus was grown in three 9-cm Petri dishes containing potato dextrose agar (PDA) medium and kept in a growth chamber with a temperature adjusted to 20 ± 2 °C with a 12-h photoperiod of white fluorescent light for a period of 15 days.
The seeds were disinfected for inoculation in sodium hypochlorite solution (1% concentration for 3 min), washed in distilled water and then dried on paper towels at room temperature for 24 h. After drying, 100 seeds per plate were added in order to be in contact with the fungus colony, kept in a growth chamber under the conditions described above for 24 h. After the contact period, the seeds were removed from the plates and placed in a single layer on paper towels at room temperature for 24 h to dry. Afterwards, seeds were divided into two groups for the image acquisition; the first group was called ‘Inoculated seeds’ (dry seeds), for which 30 seeds were distributed into three Petri dishes (10 seeds per plate), fixed with double tape facing the bottom, positioned one by one in a single layer and equidistant from each other. The second group was called ‘Incubated seeds’, and a deep-freezing blotter method was used to kill the seeds. Three subsamples of ten seeds were placed in three Petri dishes containing three filter paper sheets moistened with 3.5 mL of distilled water, kept at 20 ± 2 °C for 24 h. After this period, the plates were transferred to a freezer at −20 °C for 24 h and, subsequently, incubated at 20 ± 2 °C with a photoperiod of 12 h with fluorescent lamps, for 4 days; seeds were positioned equidistantly from each other in a single layer.

2.2. Multispectral Imaging Application

The Petri dishes were positioned under the sphere of integration of the VideometerLab4® instrument (Videometer A/S, Herlev, Denmark) and, after successive illumination of the samples at 19 contiguous light emitting diodes (LEDs), a monochrome charge-coupled chip (CCD) recorded the reflectance of the seeds and generated 19 images (2192 × 2192 pixels) corresponding to the 19 wavelengths (365, 405, 430, 450, 470, 490, 515, 540, 570, 590, 630, 645, 660, 690, 780, 850, 880, 940, 970 nm) of the electromagnetic spectrum.
Data analysis were performed with VideometerLab4 software version 3.14.9 (Videometer A/S, Herlev, Denmark). The multispectral images were transformed using normalized canonical discriminant analysis (nCDA) to minimize the distance within classes and to maximize the distance among classes. Each seed was identified as a region of interest (ROI), and it was built a mask to segment the seeds from the background, which was based on an nCDA transformation of seeds and Petri dish and a simple threshold. The seeds were collected in a blob database, and 36 variables were extracted from the individual seeds, including tristimulus components of color as hue (angular specification for color perceived as red, yellow, blue or green) and saturation (degree of difference between the color and neutral gray).
MultiColorMean feature extracts the reflectance mean of each seed for the 19 spectral bands (from 365 to 970 nm). To eliminate the influence of outliers at both the high and low ends, a trimmed mean excludes 10% of the lowest and highest values before calculating the mean. RegionMSI_Mean calculates a trimmed mean of transformed pixel values within the blob (each single seed), and RegionMSIthresh measures the percentage of blob region with transformation value higher than threshold, based on the nCDA model (derived from all the classes).
A gray level run length matrix (GLRLM), was generated to identify and distinguish texture patterns. GraylevelRunStatistics feature captures the coarseness of a texture in specified directions according to algorithm described by Galloway [15] and Albregtsen and Nielsen [16]: (0) = Short Run Emphasis (SRE) measures the distribution of short runs, and higher values indicate fine textures; (1) = Long Run Emphasis (LRE) measures the distribution of long runs, and higher values indicate coarse textures; (2) = Gray Level Non-Uniformity (GLN) measures the similarity of gray level values in the image, and GLN values are lower if gray level values are similar throughout the image; (3)= Run Length Non-Uniformity (RLN) expresses the similarity of run lengths throughout the image, with lower values if the run lengths are the same throughout the image; (4) = Run Percentage (RP) determines the distribution and homogeneity of runs in an image in a particular direction. The texture features described by Chu, et al. [17] were also measured: (5) = Low Grey Level Run Emphasis (LGRE) and (6) = High Grey Level Run Emphasis (HGRE). Short run emphasis measures the short run distribution and it is large for fine textures. Long run emphasis calculates the long run distribution and it is large for coarse structural textures.
The CIE color spaces were measured for the axes of lightness (L*) and chromaticities (a* and b*), where CIELab L* represents lightness from black to white, CIELab a* the color appearance from green to red and CIELab b* the color appearance from blue to yellow. The CIELab system is a simplified mathematical approximation to a uniform color space composed of perceived color differences [18]. It was defined by the International Commission on Illumination (CIE), and comprises all perceivable colors of the spectrum, even outside the human vision gamut [19]. An intensity-hue-saturation transformation was applied to map the standardized RGB (sRGB) image into intensity, which is independent of color hue that is the dominant wavelength, and saturation which is the colorfulness or the prominence of the dominant color.

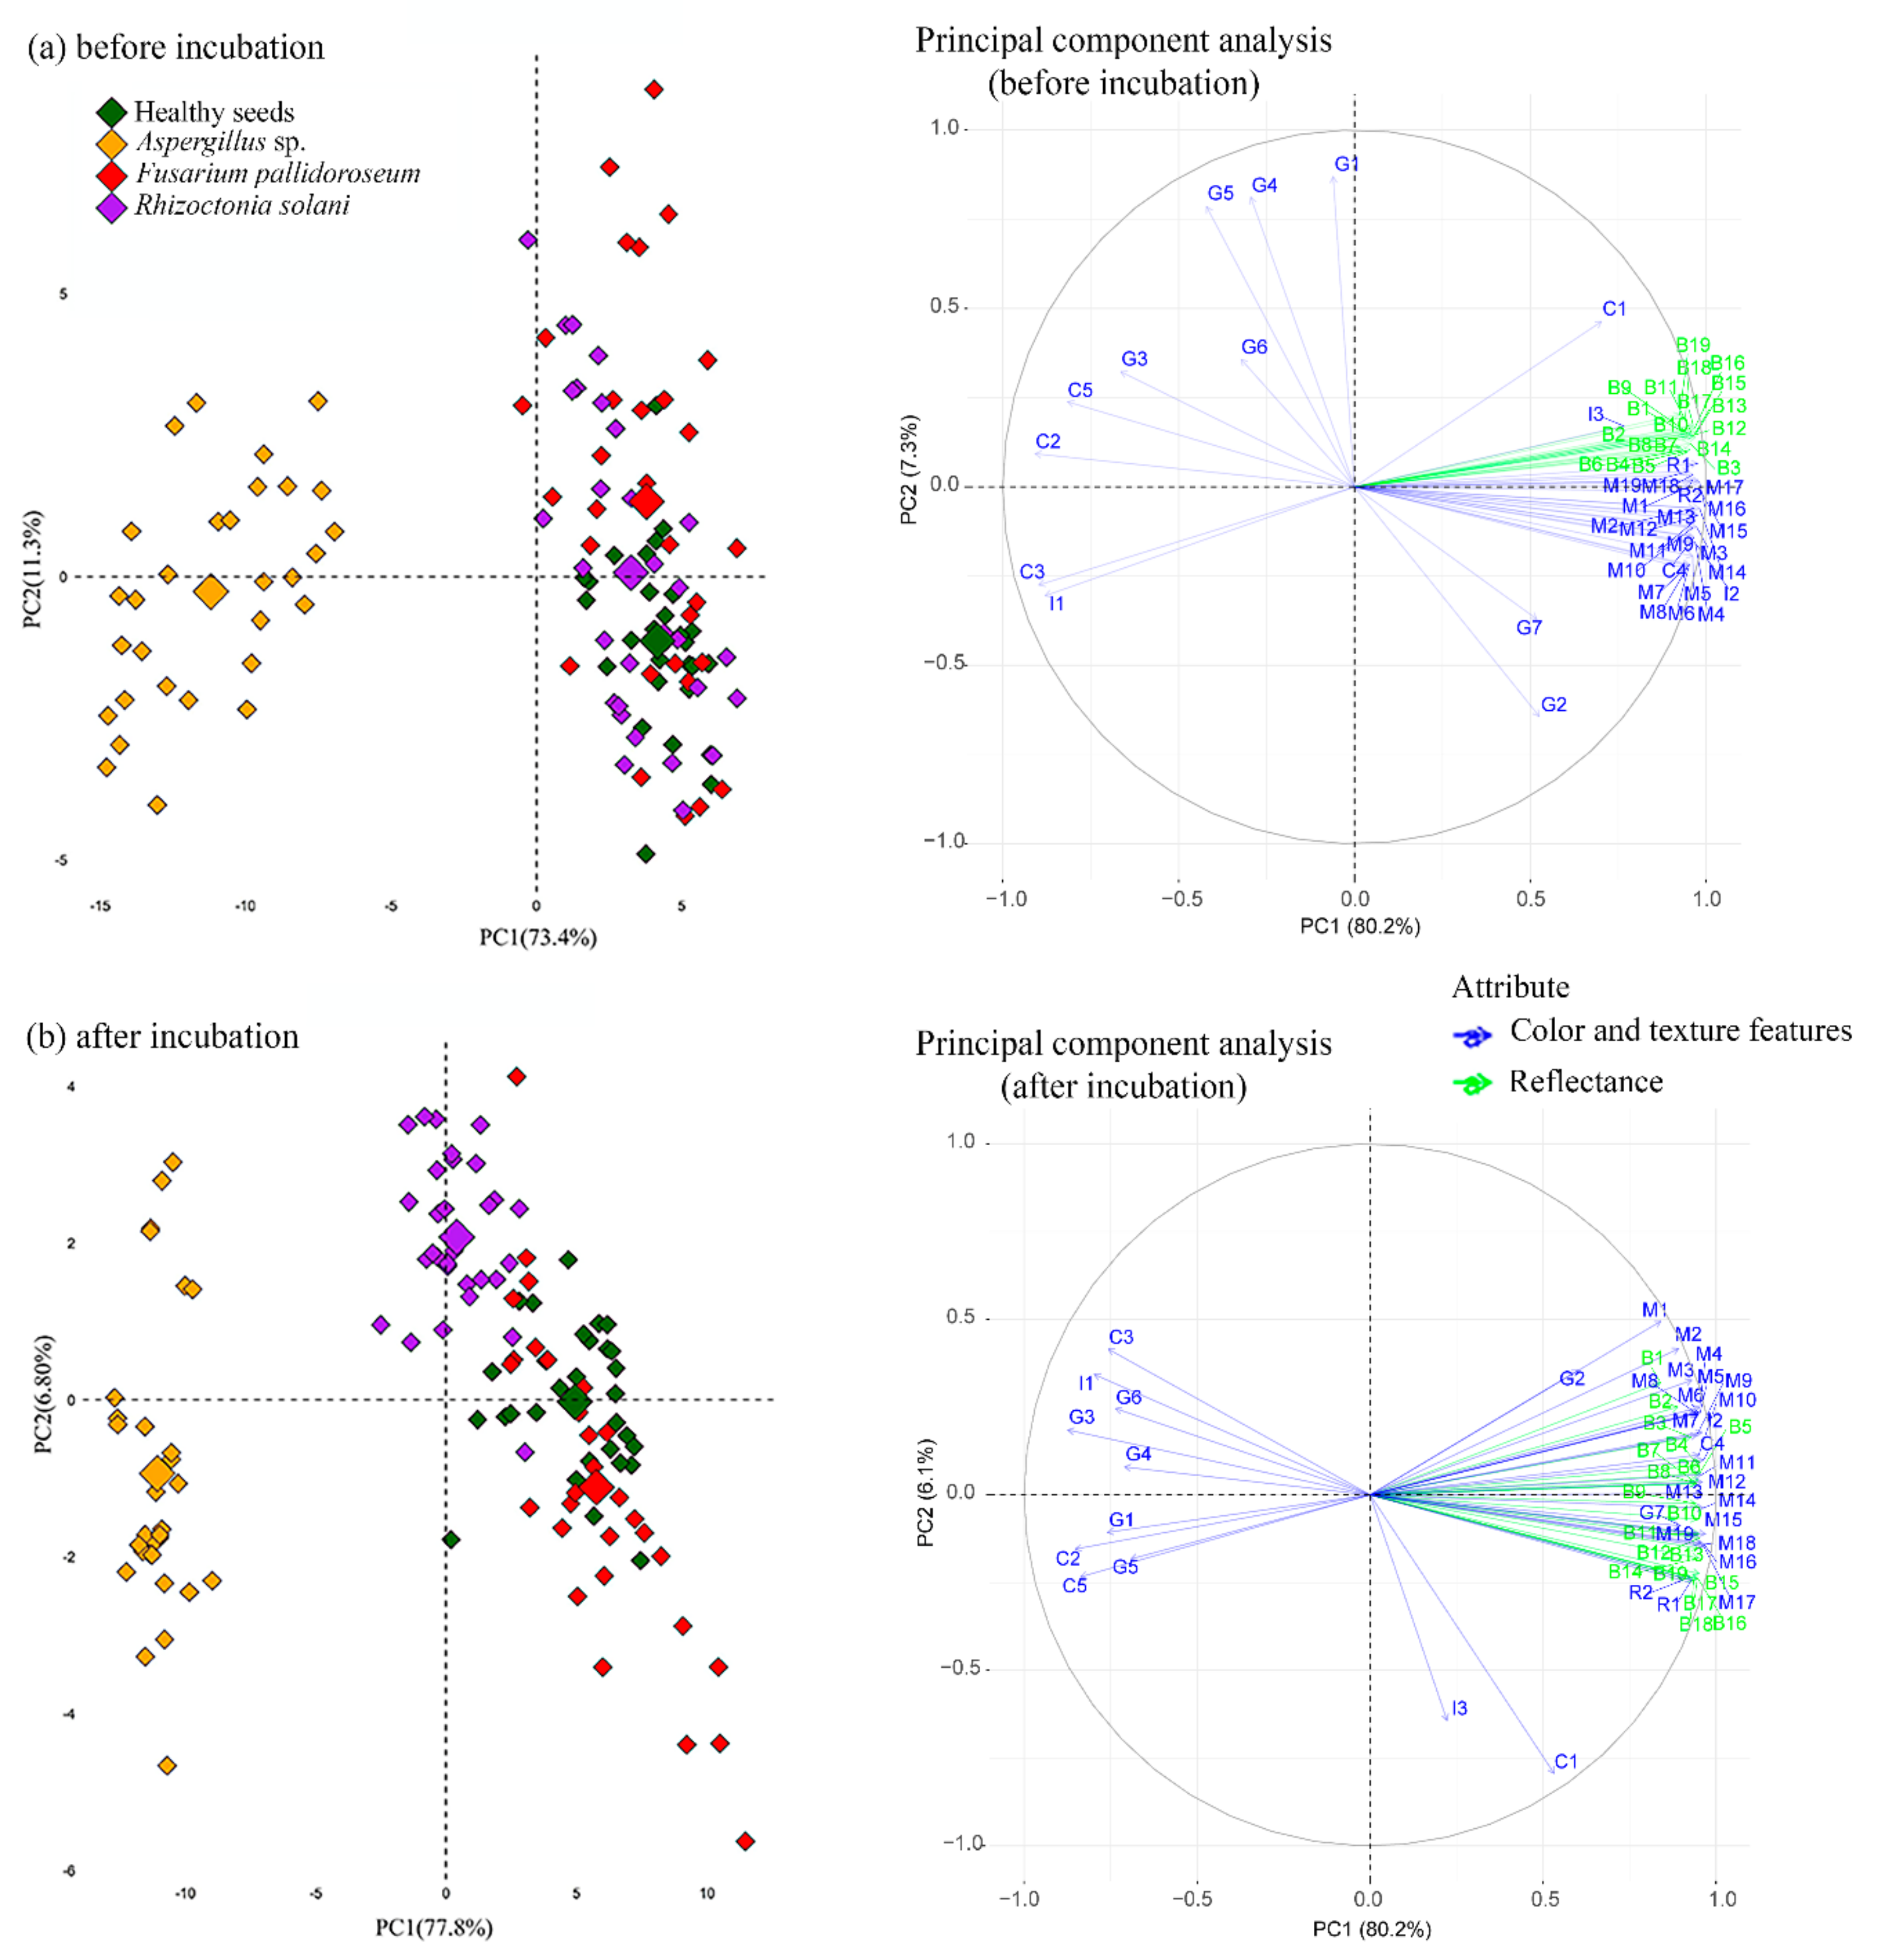
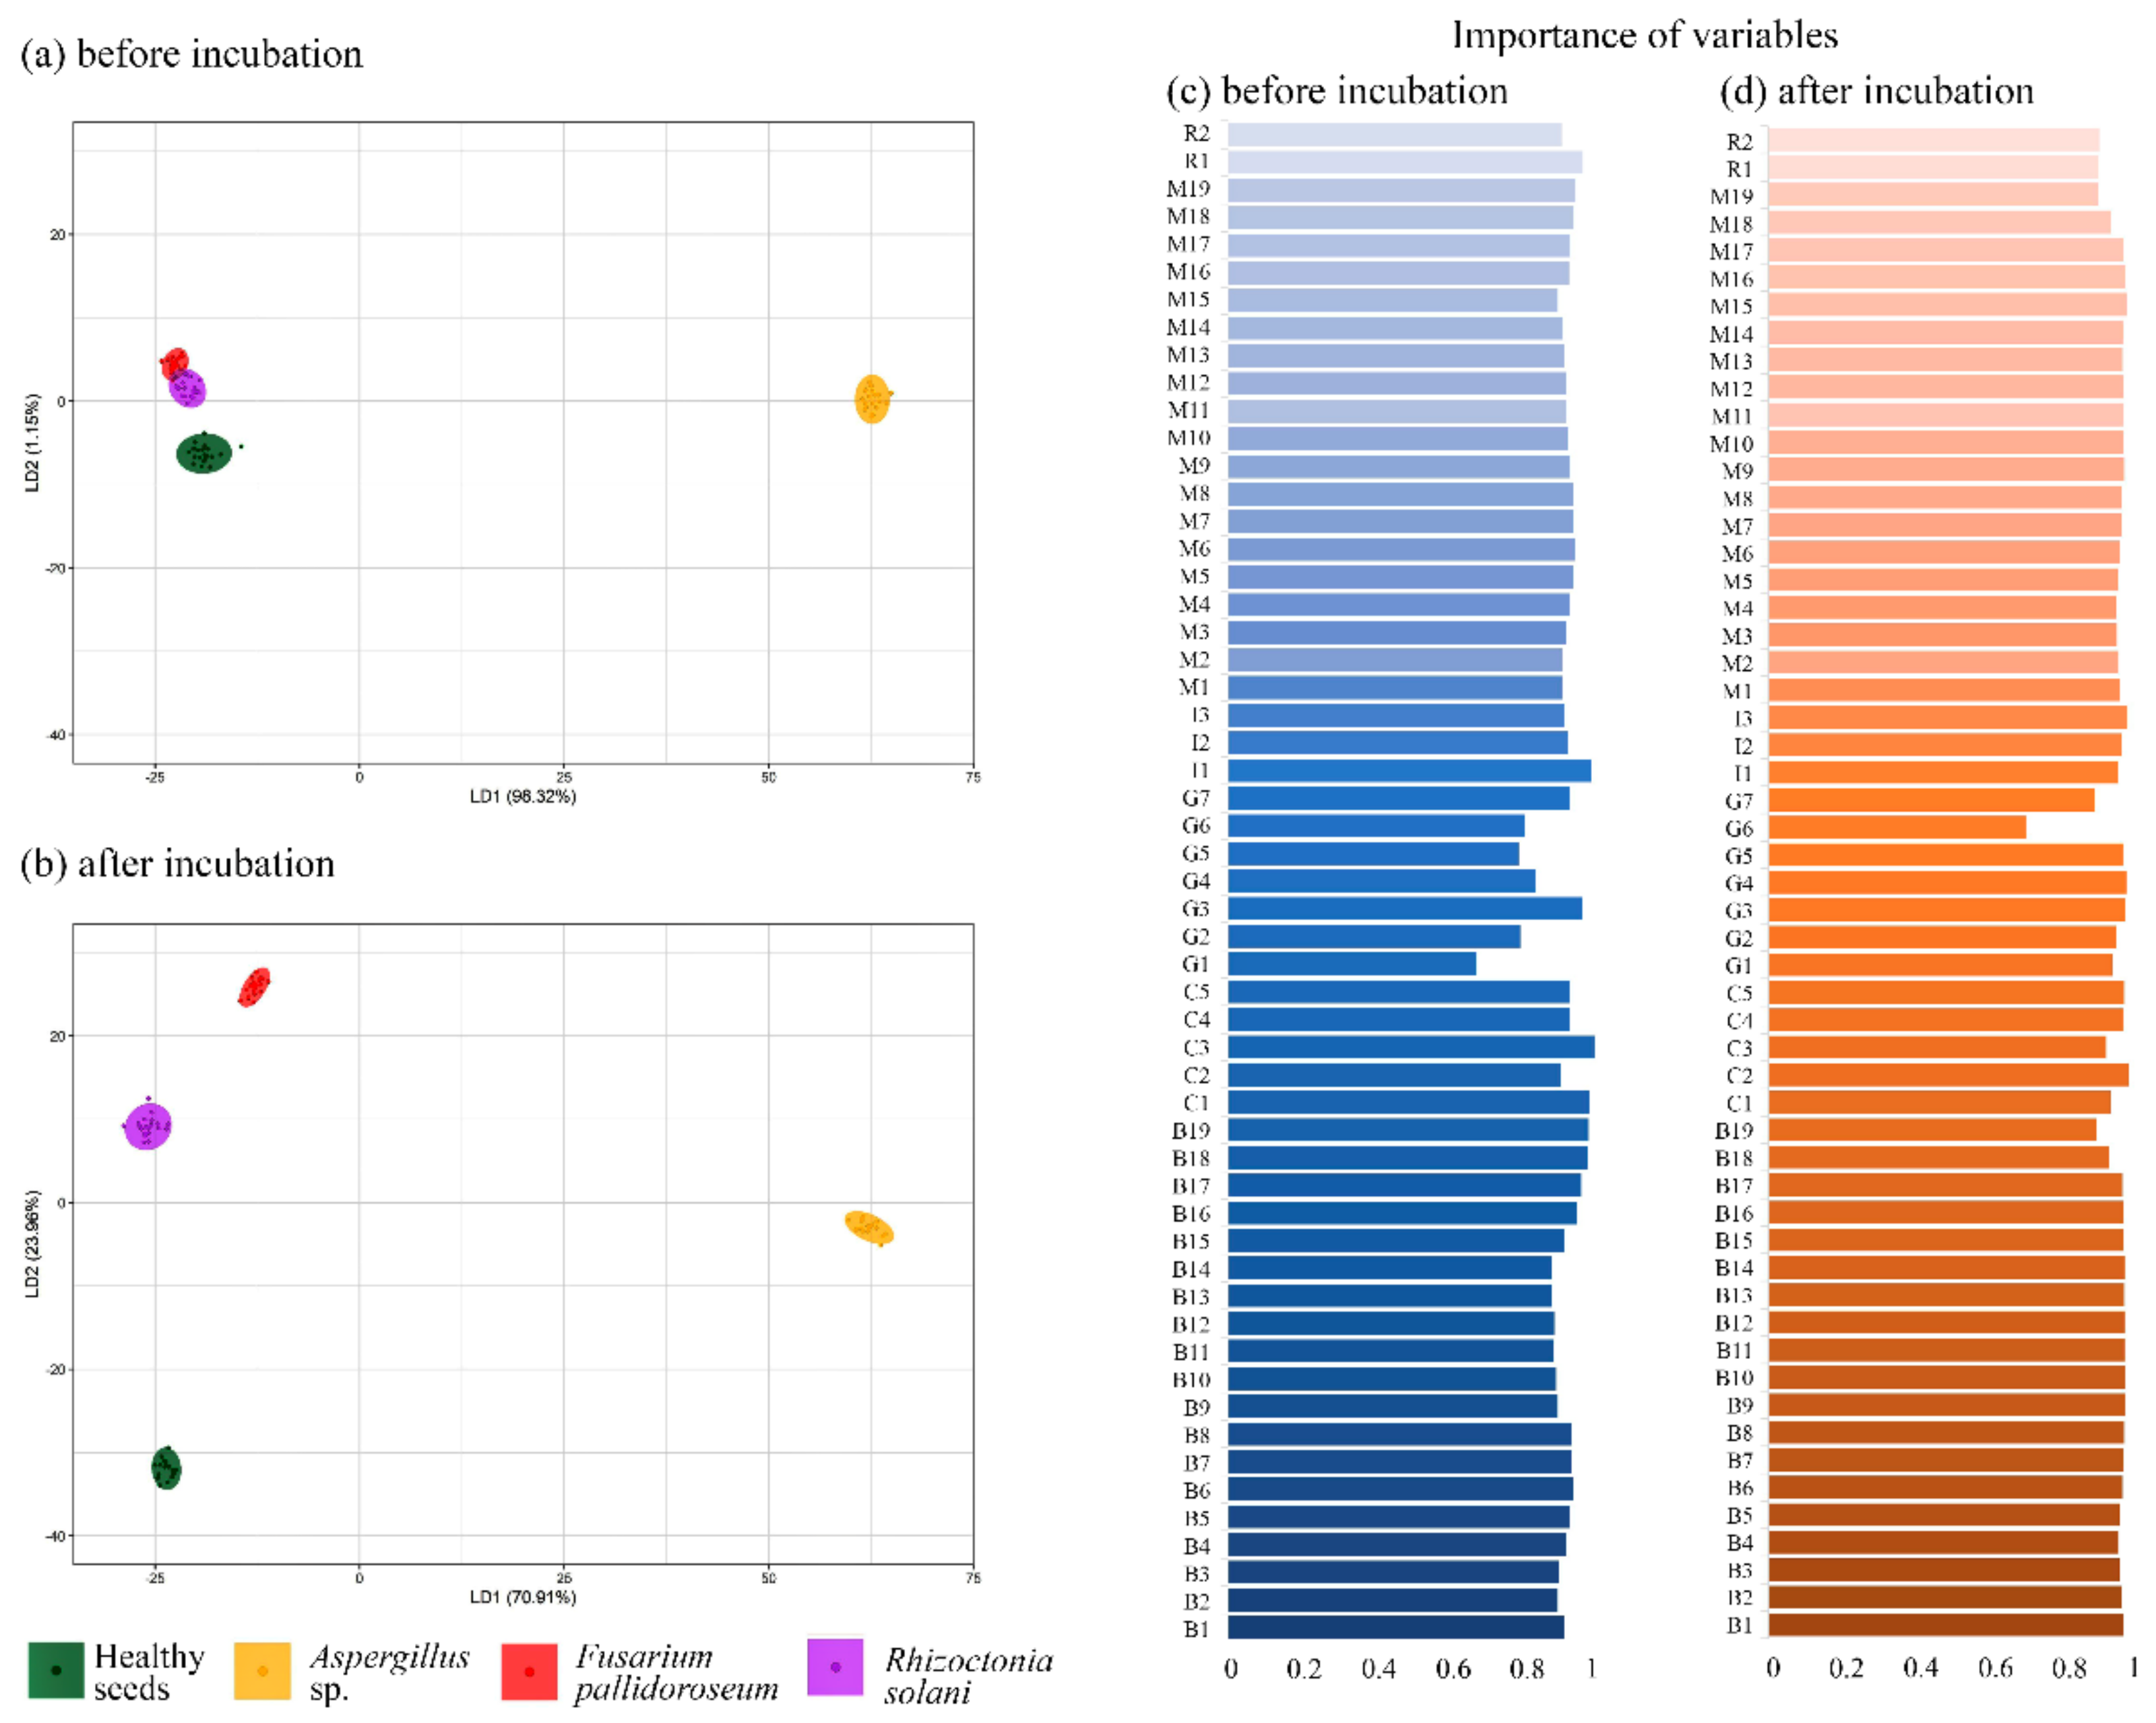
2.3. Unsupervised Analysis

The data obtained from multispectral images were exported to Excel and subsequently subjected to unsupervised multivariate analysis. Multivariate principal component analysis (PCA) was used in this study as an exploratory technique to identify hidden patterns in the data obtained from the MSI analysis. The data obtained for each seed were normalized, and the eigenvalues and eigenvectors were calculated from the covariance matrices. The results were plotted on two-dimensional graphs using the R 4.0.0 software program [20].

2.4. Supervised Discriminant Analysis
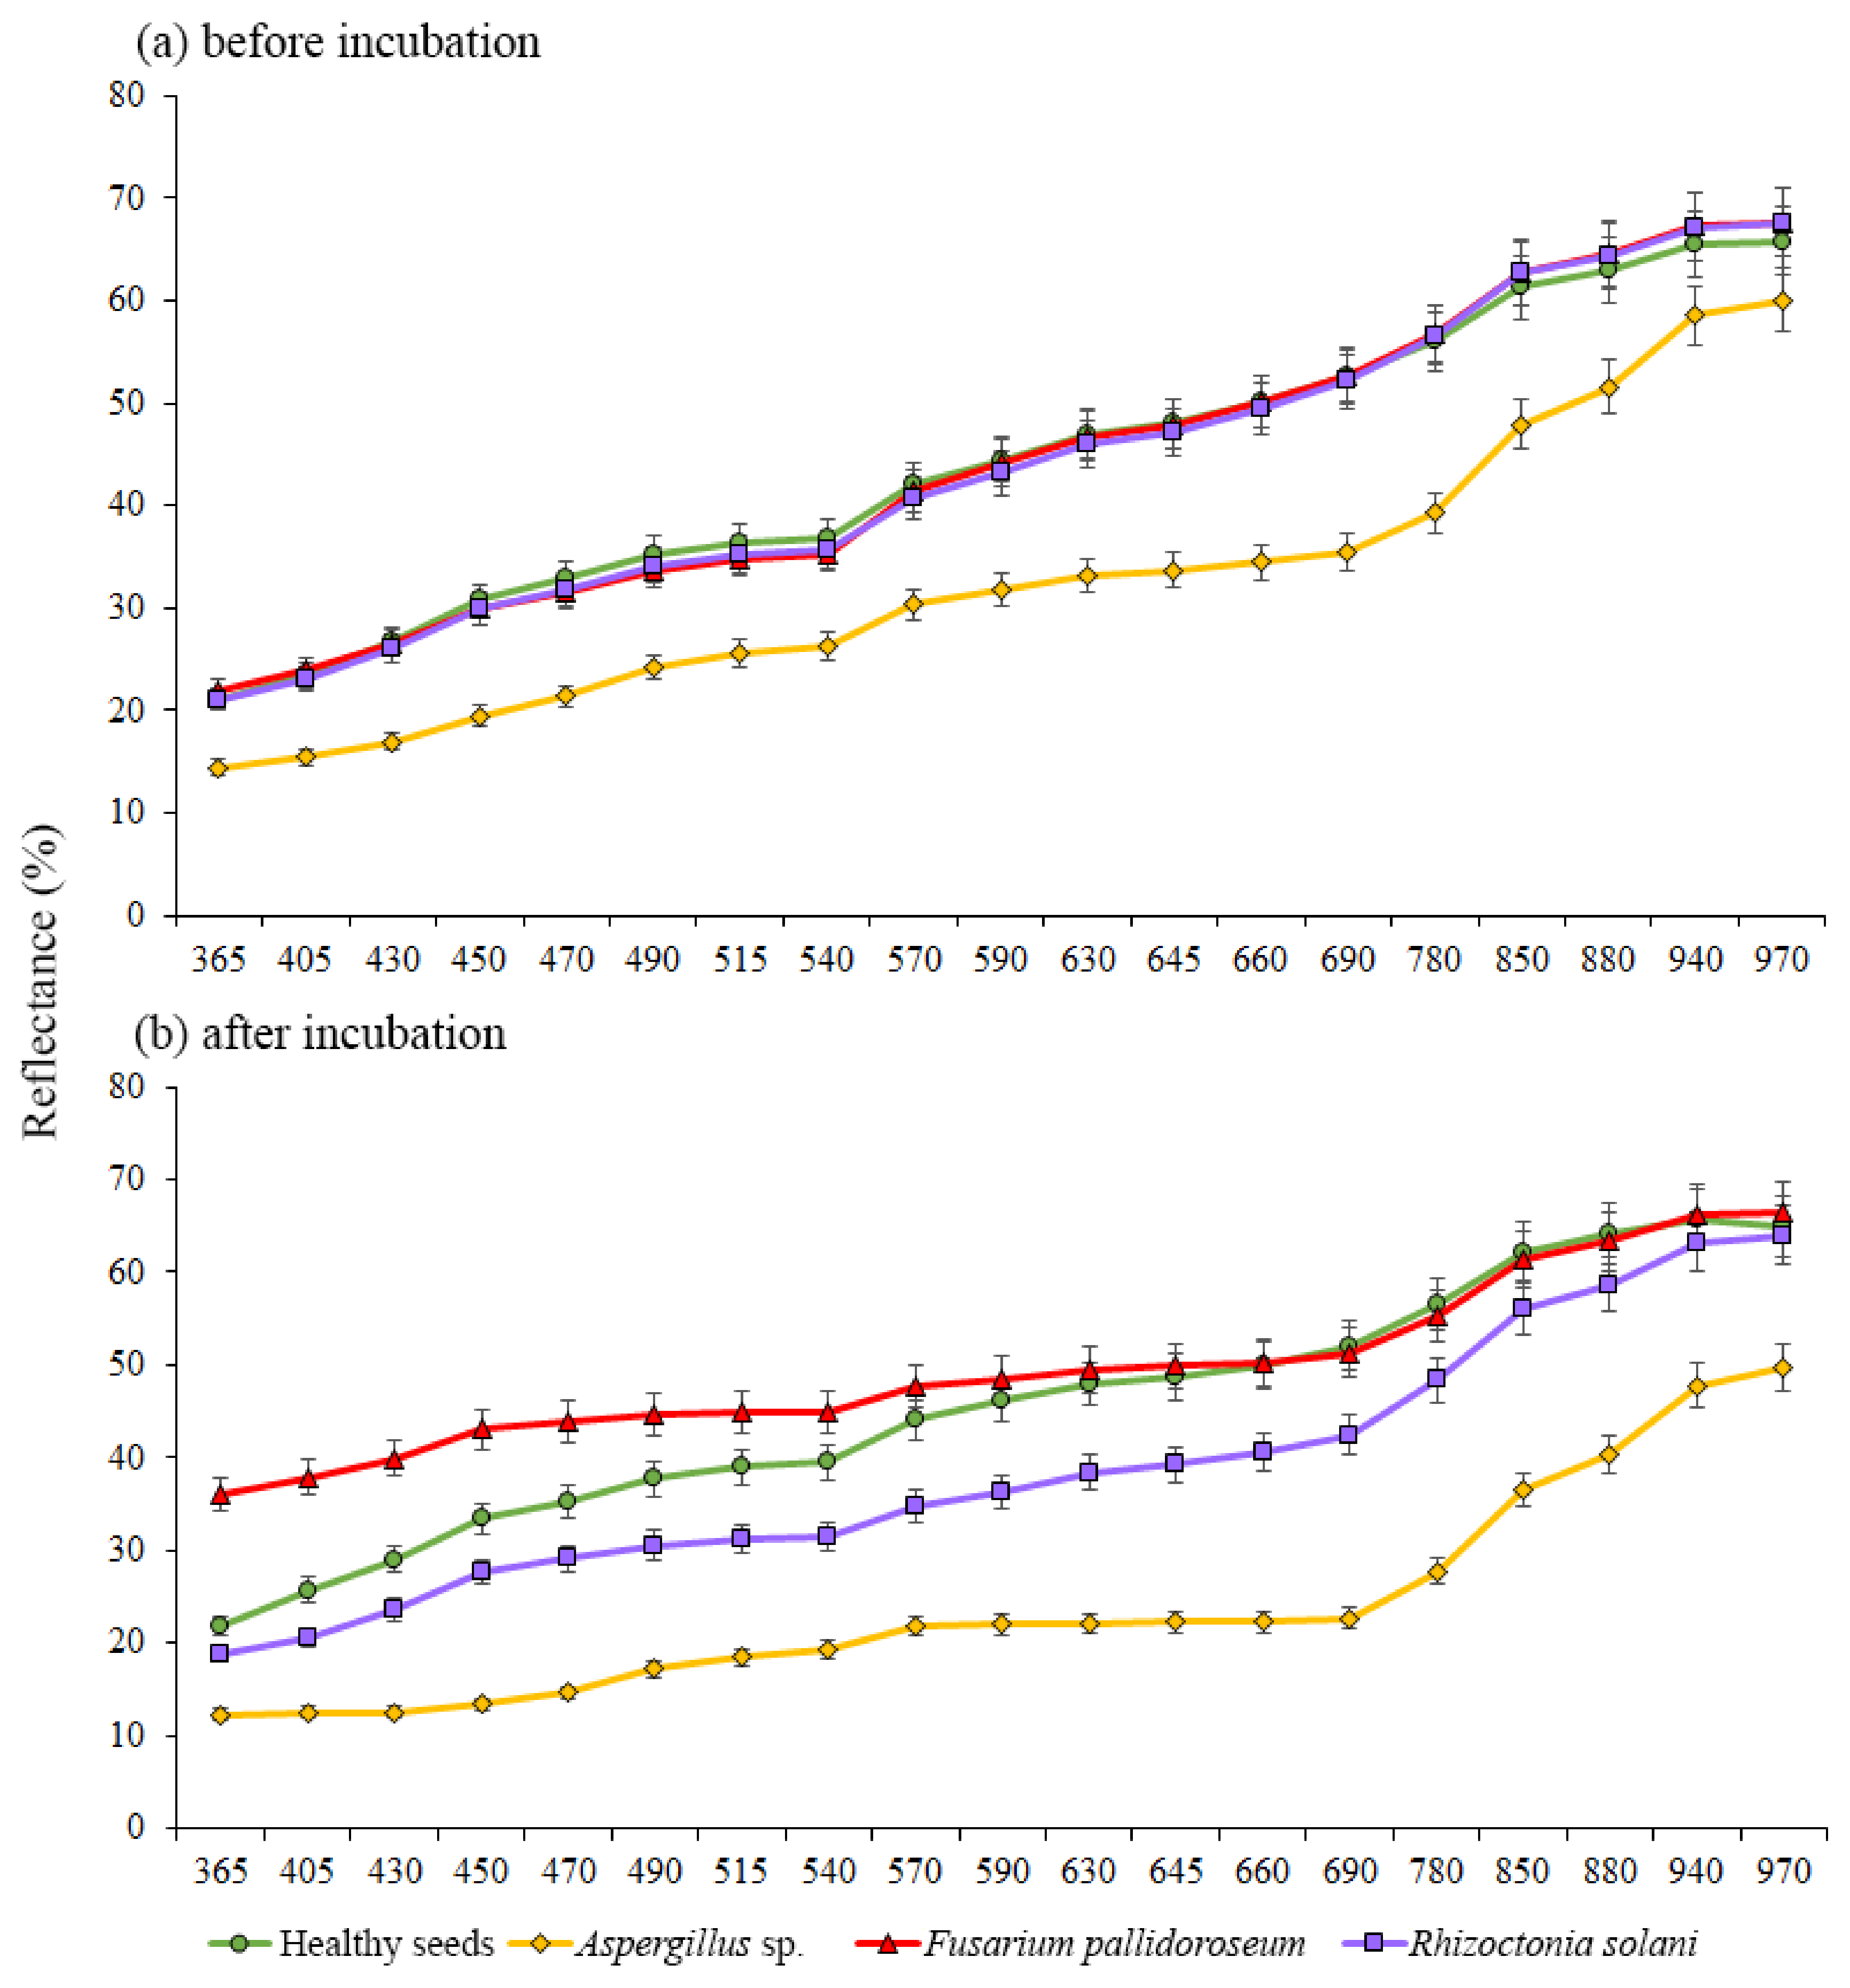
Two models were developed based on the Linear Discriminant Analysis (LDA) algorithm to classify different fungal species associated with cowpea seeds. The first model was developed based on the MSI information obtained from the inoculated seeds, while the second model used data from the incubated seeds. The classes used in both models were: Class (1) Control—seeds without fungal infestation; Class (2) Aspergillus—Seeds infested with Aspergillus sp. fungus; Class (3) F. pallidoroseum—Seeds infested with Fusarium pallidoroseum fungus; Class (4) R. solani—Seeds infested with Rhizoctonia solani fungus. The data was partitioned so that 70% was used to train the models and 30% was used for independent validation. In addition, a 10-fold cross-validation was applied. The metrics of general accuracy, Cohen’s Kappa coefficient, sensitivity and specificity were used to evaluate the performance of the models. The R 4.0.0 software program (R core Team, 2020) was used to develop the models with the LDA algorithm.

3. Results

The reflectance patterns in classes of healthy seeds, before incubation, and after incubation with Fusarium pallidoroseum, Rhizoctonia solani and Aspergillus sp. were different in images captured at 780 nm (Figure 1). The nCDA method revealed a slight distinction among classes before incubation (Figure 1a) compared to seeds after incubation (Figure 1b): the intense colonization of the fungi after incubation showed greater separation between healthy and unhealthy seeds and also among the different fungal species.
Figure 2 shows the mean reflectance spectra at 19 wavelengths in a range from 365 to 970 nm. Before incubation (Figure 2a) all classes showed similar spectral signature with the exception of the ‘Aspergillus’ class. However, there was an expressive discrimination among classes after incubation (Figure 2b), especially at wavelengths from 365 to 645 nm, and the ‘Aspergillus’ class showed a higher distinction from the other classes across the spectrum. At longer wavelengths, there was a difficulty in distinguishing ‘F. pallidoroseum’ from healthy seeds, particular in the NIR region.
The reflectance data of the 19 spectrum bands and the color and texture resources were submitted to PCA analysis (Figure 3). Before incubation, components 1 (PC1) and 2 (PC2) were responsible for 73.4% and 11.3% of the total variation, respectively (Figure 3a). The contribution of components after incubation was 77.8% in PC1 and 6.8% in PC2 (Figure 3b). In this context, there was similar behavior of the vectors originating from the spectra reflectance (represented in green), indicating that the ‘healthy seeds’, ‘F. pallidoroseum ‘and ‘R. solani’ classes had higher reflectance values compared to ‘Aspergillus’. Meanwhile, the ‘Aspergillus’ class showed higher values mainly for CIELab, before and after incubation. The classes of ‘healthy seeds’, ‘F. pallidoroseum ‘and ‘R. solani’ showed strong interaction before incubation (Figure 3a), but there was less interaction among them after seed incubation (Figure 3b).
Next, models were developed based on the LDA algorithm using reflectance, color and texture features of the seeds. An overall accuracy of 100% and 92% was observed for the training and test set, respectively, in the first model developed before incubation (Table 1). In testing set for class membership of ‘healthy seeds’ and ‘Aspergillus’, the hit rate was achieved with 100% sensitivity, while other classes showed less individual precision. There was confusion between ‘F. pallidoroseum’ and ‘R. solani’ (Table 1), since the spectral patters of these classes were very similar (Figure 2).
The second model was created using multispectral data after seed incubation, with an overall accuracy of 100% for both training and testing set (Table 2). The metrics also showed high accuracy of the classification model, with values equal to or greater than 97% in cross-validation, pointing out that the multispectral data can be used to distinguish healthy seeds from seeds carrying different fungal species.
The two models developed based on LDA algorithm are shown in Figure 4. The first two discriminatory factors (LD1 and LD2) explained 99.47% of the total variation in the first model, and 94.87% in the second model (Figure 4a,b). Again, the ‘Aspergillus’class was clearly distinguished from the other classes in both statistical models, and there was high interaction between classes of ‘F. pallidoroseum’ and R. solani’, before incubation (Figure 4a). Figure 4c,d show the importance of each variable obtained from reflectance, color and texture features for discrimination of the different seed classes. Before incubation, ‘CIELabHue’ (0.99), ‘IHSHueMean’ (0.98), CIELab A (0.98), Band 19 (0.98) and Band 18 (0.98) were more effective in discriminating seed classes, and after incubation the ‘CIELab B’, IHSSaturationMean, MultiColorMean1 [14], GraylevelRunStatistics (2)(3)(4), and Bands 8–17 (Figure 4d), with contribution greater than 0.99. These results emphasize the potential of simple features in discriminating different fungi associated with cowpea seeds.

4. Discussion

The diagnosis of pathogens transmitted by seeds is an important measure in the quality control program, as it avoids the spread of pathogens to exempt areas, economic losses and the unnecessary use of chemicals, thus reducing costs and environmental contamination. Traditional techniques have the characteristic of requiring considerable time for analysis, in addition to subjectivity for interpreting the test. Thus, the use of techniques which minimize this problem is very desirable; in this sense, technological and computational advances enable new methodologies to be used for this purpose.
This study sought to verify the efficiency of MSI in recognizing different fungal species associated with cowpea seeds; it was possible to observe distinctions in the spectral signature between the different seed classes. Variations in the reflectance spectra can be attributed to changes in color, texture and chemical composition of the surface, thereby enabling separation between the classes of infested and non-infested seeds as evidenced by exploratory data analysis. The differentiation between classes before incubation can be attributed due to the change in color caused by the fungi which were adhered to the seed coat; the ‘F. pallidoroseum’ and ‘R. solani’ have a simple mycelia formation in their colonies, which could have resulted in less seed covering by the fungi, whereas there is intense spore production by ‘Aspergillus’, covering the seeds completely. Therefore, it seems reasonable to assume that the conditions before incubation were not favorable for complete fungus development, only resulting in changes in the seed color.
In addition to the coloration, there are the changes caused by the enzymatic and oxidative activity of the fungi on the seeds from the incubation (‘Incubated seeds’), which enabled distinguishing the classes more sharply. According to Williams et al. [21], the main source of variation in chemical alteration is an alteration to the starch and protein content which constitute the seed reserves; after incubating the seeds, the fungus starts to consume these compounds, directing them for their growth. The ability of the MSI technique to distinguish fungi-bearing seeds based on physical-chemical changes has already been proven in studies with other species [12,13,14,21].
Spectral data made it possible to separate the seed classes in the ‘Incubated seeds’, however this distinction did not always occur in the same region, making the selection of a spectral band common to the class complex. This can be attributed to the overlap and complexity of continuous data, making it difficult to clearly identify the positions of the characteristic bands that represent the different components to be evaluated [22]. In this context, the color and texture parameters were quite expressive in distinguishing the classes, as seen in the determination coefficients (Figure 4). In this context, Boelt et al. [6] point out that the CIELab resource is efficient in distinguishing between fungi species present in barley seeds; this feature is an interesting alternative, as it enables distinguishing color variations which are not perceptible to the human eye [23], eliminating subjectivity from visual inspections. Another color and texture resource, the ‘RegionMSImean’, has also proved to be efficient in classifying seeds and has already been applied efficiently in several studies. Olesen et al. [10] used this parameter to distinguish Ricinus cummunis L. seeds based on their viability with 92% precision. Likewise, Shrestha et al. [24] concluded that the ‘RegionMSImean’ parameter was efficient in predicting tomato varieties, with a hit rate above 95% and in some cases reaching 100%.
The contribution of color and texture features in distinguishing the seed classes was evidenced by applying the supervised model. The application of supervised methods such as LDA combined with imaging techniques has already shown promise in several studies [9,23,24,25]; this is because LDA aims to minimize the distance within classes and maximize the distance between classes, thereby enabling good discrimination between classes.
Despite the satisfactory results, it is important to highlight that this is a preliminary study, which can be a guide for future research, covering a greater number of cultivars and species of fungi, isolated or together with the seeds, bringing results that allow a greater application practical and viable in the evaluation of cowpea seeds and other leguminous species of agricultural importance.

5. Conclusions

The multispectral imaging of cowpea seeds provides the necessary information for quickly distinguishing between different seed classes tested and present accuracy above 92% before incubation and 99% after incubation if associated with a discriminant model; these are promising results, since the amount of data obtained through multispectral imaging is large, and therefore a model capable of selecting the variables which most correlate with a given characteristic, in this case the health status, greatly increases the system’s effectiveness, confirming the potential of using technology to assess the seed health.

Author Contributions

Conceptualization, C.H.Q.R. and F.G.G.-J.; Funding acquisition, C.B.d.S.; Investigation, C.H.Q.R., F.G.G.-J. and M.H.D.d.M.; Methodology, C.H.Q.R. and M.H.D.d.M.; Resources, C.H.Q.R.; Software, C.H.Q.R., F.F.-S. and A.D.d.M.; Supervision, F.G.G.-J. and M.H.D.d.M.; Validation, A.D.d.M.; Visualization, C.H.Q.R. and C.B.d.S.; Writing—Original draft, C.H.Q.R.; Writing—Review & editing, C.H.Q.R., F.F.-S., F.G.G.-J., M.H.D.d.M., A.D.d.M. and C.B.d.S. All authors have read and agreed to the published version of the manuscript.

Funding

This research was funded by Fundação de Amparo à Pesquisa do Estado de São Paulo - FAPESP: Grants 2017/15220-7 and 2018/03802-4.

Conflicts of Interest

The authors declare no conflict of interest.

References

  1. Akande, S.R. Genotype by environment interaction for cowpea seed yield and disease reactions in the forest and derived savanna agro-ecologies of south-west Nigeria. Am. Eurasian J. Agric. Environ. Sci. 2007, 2, 163–168. Available online: https://www.idosi.org/aejaes/jaes2(2)/11.pdf (accessed on 3 April 2020).
  2. Matos-Filho, C.H.A.; Gomes, R.L.F.; Rocha, M.M.; Freire-Filho, F.R.; Lopes, Â.C.A. Potencial produtivo de progênies de feijão-caupi com arquitetura ereta de planta. Ciênc. Rural 2009, 39, 348–354. [Google Scholar] [CrossRef] [Green Version]
  3. Freire-Filho, F.R. Feijão-Caupi no Brasil: Produção, Melhoramento Genético, Avanços e Desafios; Embrapa Meio-Norte: Teresina, PI, Brazil, 2011; Available online: https://ainfo.cnptia.embrapa.br/digital/bitstream/item/84470/1/feijao-caupi.pdf (accessed on 6 April 2020).
  4. Biemond, P.C.; Oguntade, O.; Lava Kumar, P.; Stomph, T.J.; Termorshuizen, A.J.; Struik, P.C. Does the informal seed system threaten cowpea seed health? Crop Prot. 2013, 43, 166–174. [Google Scholar] [CrossRef]
  5. Brasil, Ministério da Agricultura, Pecuária e Abastecimento. Regras Para Análise de Sementes; Brasil, Ministério da Agricultura, Pecuária e Abastecimento: Brasilia, Brazil, 2009.
  6. Boelt, B.; Shrestha, S.; Salimi, Z.; Ravn Jørgensen, J.; Nicolaisen, M.; Jens Michael Carstensen, E. Multispectral imaging–a new tool in seed quality assessment? Seed Sci. Res. 2018, 28, 222–228. [Google Scholar] [CrossRef]
  7. Marcos-Filho, J. Fisiologia de Sementes de Plantas Cultivadas; Abrates: Londrina, PR, Brazil, 2015. [Google Scholar]
  8. Mondo, V.H.V.; Cicero, S.M. Análise de imagens na avaliação da qualidade de sementes de milho localizadas em diferentes posições na espiga. Rev. Bras. Sementes 2005, 27, 9–18. [Google Scholar] [CrossRef]
  9. Huang, M.; Wang, Q.G.; Zhu, Q.B.; Qin, J.W.; Huang, G. Review of seed quality and safety tests using optical sensing technologies. Seed Sci. Technol. 2015, 43, 337–366. [Google Scholar] [CrossRef]
  10. Olesen, M.H.; Nikneshan, P.; Shrestha, S.; Tadayyon, A.; Deleuran, L.C.; Boelt, B.; Gislum, R. Viability prediction of Ricinus cummunis L. seeds using multispectral imaging. Sensors 2015, 15, 4592–4604. [Google Scholar] [CrossRef] [Green Version]
  11. Bodevin, S.; Larsen, T.G.; Lok, F.; Carstensen, J.M.; Jørgensen, K.; Skadhauge, B. A rapid non-destructive method for quantification of fungal infection on barley and malt. In Proceedings of the 32nd EBC Congress, Hamburg, Germany, 10–14 May 2009. [Google Scholar]
  12. Jaillais, B.; Roumet, P.; Pinson-Gadais, L.; Bertrand, D. Detection of Fusarium head blight contamination in wheat kernels by multivariate imaging. Food Control 2015, 54, 250–258. [Google Scholar] [CrossRef]
  13. Vrešak, M.; Olesen, M.H.; Gislum, R.; Bavec, F.; Jørgensen, J.R. The use of image-spectroscopy technology as a diagnostic method for seed health testing and variety identification. PLoS ONE 2016, 11, e0152011. [Google Scholar] [CrossRef]
  14. Olesen, M.H.; Carstensen, J.M.; Boelt, B. Multispectral imaging as a potential tool for seed health testing of spinach (Spinacia oleracea L.). Seed Sci. Technol. 2011, 39, 140–150. [Google Scholar] [CrossRef]
  15. Galloway, M.M. Texture analysis using gray level run lengths. Comput. Graph. Image Process. 1975, 4, 172–179. [Google Scholar] [CrossRef]
  16. Albregtsen, F.; Nielsen, B. Texture classification based on cooccurrence of gray level run length matrices. Aust. J. Intell. Inf. Process. Syst. 2000, 6, 38–45. Available online: http://ajiips.com.au/papers/V6.1/V6N1.6%20%20Texture%20Classification%20based%20on%20Cooccurrence%20of%20Gray%20Level%20Run%20Length%20Matrices.pdf (accessed on 12 June 2020).
  17. Chu, A.; Sehgal, C.M.; Greenleaf, J.F. Use of gray value distribution of run lengths for texture analysis. Pattern Recognit. Lett. 1990, 11, 415–419. [Google Scholar] [CrossRef]
  18. Hill, B.; Roger, T.H.; Vorhhagen, F.W. Comparative analysis of the quantization of color spaces on the basis of the CIELAB color-difference formula. ACM Trans. Graph. 1997, 16, 109–154. [Google Scholar] [CrossRef]
  19. Martín, F.; Miró, J.V.; Moreno, L. Towards exploiting the advantages of colour in scan matching. In Proceedings of the ROBOT2013: First Iberian Robotics Conference, Madrid, Spain, 28–29 November 2013; pp. 217–231. [Google Scholar] [CrossRef]
  20. R Core Team. R: A Language and Environment for Statistical Computing. R Foundation for Statistical Computing, Vienna, Austria. 2019. Available online: http://www.r-project.org/index.html (accessed on 25 May 2020).
  21. Williams, P.J.; Geladi, P.; Britz, T.J.; Manley, M. Investigation of fungal development in maize kernels using NIR hyperspectral imaging and multivariate data analysis. J. Cereal Sci. 2012, 55, 272–278. [Google Scholar] [CrossRef]
  22. Su, W.H.; Sun, D.W. Multispectral imaging for plant food quality analysis and visualization. Compr. Rev. Food Sci. Food Saf. 2018, 17, 220–239. [Google Scholar] [CrossRef] [Green Version]
  23. Medeiros, A.D.; Pinheiro, D.T.; Xavier, W.A.; Silva, L.J.; Dias, D.C.F.S. Quality classification of Jatropha curcas seeds using radiographic images and machine learning. Ind. Crops Prod. 2020, 146, 112162. [Google Scholar] [CrossRef]
  24. Shrestha, S.; Deleuran, L.C.; Olesen, M.H.; Gislum, R. Use of multispectral imaging in varietal identification of tomato. Sensors 2015, 15, 4496–4512. [Google Scholar] [CrossRef] [PubMed] [Green Version]
  25. França-Silva, F.; Rego, C.H.Q.; Gomes-Junior, F.G.; Moraes, M.H.D.; Medeiros, A.D.; Silva, C.B. Detection of Drechslera avenae (Eidam) Sharif [Helminthosporium avenae (Eidam)] in Black Oat Seeds (Avena strigosa Schreb) Using Multispectral Imaging. Sensors 2020, 20, 3343. [Google Scholar] [CrossRef]
Figure 1. Raw RGB images of cowpea seeds and corresponding transformed images into grayscale and by canonical discriminant analysis (nCDA) captured at 780 nm, with reflectance patters in classes of healthy seeds, Fusarium pallidoroseum, Rhizoctonia solani and Aspergillus sp. before incubation (a), and after incubation (b).
Agriculture 10 00361 g001
Figure 2. Spectral signature for classes of healthy seeds, Fusarium pallidoroseum, Rhizoctonia solani and Aspergillus sp. at 19 wavelengths in a range from 365 to 970 nm before incubation (a) and after incubation (b).
Agriculture 10 00361 g002
Figure 3. Biplots of principal component analysis for multispectral reflectance, color and texture features for classes of healthy seeds, Fusarium pallidoroseum, Rhizoctonia solani and Aspergillus sp. at 19 wavelengths (365 to 970 nm) before incubation (a) and after incubation (b). Attributes: Color and texture features – (R2): RegionMSIThresh; (R1): RegionMSI_Mean; (M19): MultiColorMean1_(18); (M18): MultiColorMean1_(17); (M17): MultiColorMean1_(16); (M16): MultiColorMean1_(15); (M15): MultiColorMean1_(14); (M14): MultiColorMean1_(13); (M13): MultiColorMean1_(12); (M12): MultiColorMean1_(11); (M11): MultiColorMean1_(10); (M10): MultiColorMean1_(9); (M9): MultiColorMean1_(8); (M8): MultiColorMean1_(7); (M7): MultiColorMean1_(6); (M6): MultiColorMean1_(5); (M5): MultiColorMean1_(4); (M4): MultiColorMean1_(3); (M3): MultiColorMean1_(2); (M2): MultiColorMean1_(1); (M1): MultiColorMean1_(0); (I3): IHSSaturationMean; (I2): IHSIntensityMean;(I1): IHSHueMean; (G7): GraylevelRunStatistics_(6); (G6): GraylevelRunStatistics_(5); (G5): GraylevelRunStatistics_(4); (G4): GraylevelRunStatistics_(3); (G3): GraylevelRunStatistics_(2); (G2): GraylevelRunStatistics_(1); (G1): GraylevelRunStatistics_(0); (C5): CIELab_Saturation; (C4): CIELab_L; (C3): CIELab_Hue; (C2): CIELab_B; (C1): CIELab_A. Reflectance – (B19): Band_19; (B18): Band_18; (B17): Band_17; (B16): Band_16; (B15): Band_15; (B14): Band_14; (B13): Band_13; (B12): Band_12; (B11): Band_11; (B10): Band_10; (B9): Band_9; (B8): Band_8; (B7): Band_7; (B6): Band_6; (B5): Band_5; (B4): Band_4; (B3): Band_3; (B2): Band_2; (B1): Band_1.
Agriculture 10 00361 g003
Figure 4. Linear discriminant analysis (LDA) score plot based on reflectance, color and texture features of cowpea seeds at 19 wavelengths (365 to 970 nm) for class membership of inoculated seed (a), and incubated seed (b) with Healthy seeds, Fusarium pallidoroseum, Rhizoctonia solani and Aspergillus sp. Importance of variables in the models before inoculation (c), and after incubation (d). Attributes: Color and texture features – (R2): RegionMSIThresh; (R1): RegionMSI_Mean; (M19): MultiColorMean1_(18); (M18): MultiColorMean1_(17); (M17): MultiColorMean1_(16); (M16): MultiColorMean1_(15); (M15): MultiColorMean1_(14); (M14): MultiColorMean1_(13); (M13): MultiColorMean1_(12); (M12): MultiColorMean1_(11); (M11): MultiColorMean1_(10); (M10): MultiColorMean1_(9); (M9): MultiColorMean1_(8); (M8): MultiColorMean1_(7); (M7): MultiColorMean1_(6); (M6): MultiColorMean1_(5); (M5): MultiColorMean1_(4); (M4): MultiColorMean1_(3); (M3): MultiColorMean1_(2); (M2): MultiColorMean1_(1); (M1): MultiColorMean1_(0); (I3): IHSSaturationMean; (I2): IHSIntensityMean; (I1): IHSHueMean; (G7): GraylevelRunStatistics_(6); (G6): GraylevelRunStatistics_(5); (G5): GraylevelRunStatistics_(4); (G4): GraylevelRunStatistics_(3); (G3): GraylevelRunStatistics_(2); (G2): GraylevelRunStatistics_(1); (G1): GraylevelRunStatistics_(0); (C5): CIELab_Saturation; (C4): CIELab_L; (C3): CIELab_Hue; (C2): CIELab_B; (C1): CIELab_A. Reflectance – (B19): Band_19; (B18): Band_18; (B17): Band_17; (B16): Band_16; (B15): Band_15; (B14): Band_14; (B13): Band_13; (B12): Band_12; (B11): Band_11; (B10): Band_10; (B9): Band_9; (B8): Band_8; (B7): Band_7; (B6): Band_6; (B5): Band_5; (B4): Band_4; (B3): Band_3; (B2): Band_2; (B1): Band_1.
Agriculture 10 00361 g004
Table 1. Confusion matrices of the LDA model in training and testing set using reflectance, color and texture features of cowpea seeds at 19 wavelengths (365 to 970 nm) for class membership of healthy seed and inoculated seed with Fusarium pallidoroseum, Rhizoctonia solani and Aspergillus sp.
Before Incubation
TreatmentTraining set (n = 84)
Healthy seedsAspergillus sp.F. pallidoroseumR. solani
Healthy seed21000
Aspergillus sp.02100
F. pallidoroseum00210
R. solani00021
Overall acurracy1.00
Cohen’s Kappa1.00
Sensitivity1.001.001.001.00
Specificity1.001.001.001.00
Cross validation (fold = 10)
Overall acurracy0.89 ± 0.01
Cohen’s Kappa0.85 ± 0.14
Sensitivity0.97 ± 0.08
Specificity1.00 ± 0.00
TreatmentTesting set (n = 36)
Healthy seedsAspergillus sp.F. pallidoroseumR. solani
Healthy seed9010
Aspergillus sp.0900
F. pallidoroseum0071
R. solani0018
Overall acurracy0.92
Cohen’s Kappa0.89
Sensitivity1.001.000.780.89
Specificity0.961.000.960.96
Table 2. Confusion matrices of the LDA model in training and testing set using reflectance, color and texture features of cowpea seeds at 19 wavelengths (365 to 970 nm) for class membership of healthy seed and incubated seed with Fusarium pallidoroseum, Rhizoctonia solani and Aspergillus sp.
After Incubation
TreatmentTraining set (n = 84)
Healthy seedsAspergillus sp.F. pallidoroseumR. solani
Healthy seed21000
Aspergillus sp.02100
F. pallidoroseum00210
R. solani00021
Overall acurracy1.00
Cohen’s Kappa1.00
Sensitivity1.001.001.001.00
Specificity1.001.001.001.00
Cross validation (fold = 10)
Acurracy0.99 ± 0.04
Cohen’s Kappa0.98 ± 0.07
Sensitivity0.97 ± 0.08
Specificity1.00 ± 0.00
TreatmentTesting set (n = 36)
Healthy seedsAspergillus sp.F. pallidoroseumR. solani
Healthy seed9000
Aspergillus sp.0900
F. pallidoroseum0090
R. solani0009
Overall acurracy1.00
Cohen’s Kappa1.00
Sensitivity1.001.001.001.00
Specificity1.001.001.001.00

