The Dynamic of Nitrogen Uptake from Different Sources by Pea (Pisum sativum L.)


Faculty of Agrobioengineering and Animal Husbandry, Agriculture and Horticulture Institute, Siedlce University of Natural Sciences and Humanities, 08110 Siedlce, Poland
*
Author to whom correspondence should be addressed.
Agriculture 2021, 11(1), 81; https://0-doi-org.brum.beds.ac.uk/10.3390/agriculture11010081
Submission received: 30 November 2020
/
Revised: 13 January 2021
/
Accepted: 15 January 2021
/
Published: 19 January 2021
(This article belongs to the Special Issue Root-Soil Interactions in Organic Farming)
Abstract
:Nitrogen uptake from various sources by plants capable of biological reduction of N2 in symbiotic systems with root nodule bacteria is influenced by many factors. The aim of the study was to examine the influence of the development stage and variety of pea (Pisum sativum L.) cultivated in years with different temperature and precipitation conditions on the dynamics of nitrogen uptake from the atmosphere (Ndfa), fertilizer (Ndff), and soil (Ndfs). Pre-sowing nitrogen fertilization with the 15N isotope and the isotope dilution method were used in the research. The highest rate of Ndfa uptake was noted between the three-internode stage and the stage of the first visible flower buds outside the leaves, while Ndff and Ndfs uptake was highest between the 4-leaf stage and the 3-internode stage. The lowest rate of Ndfa uptake was noted from sowing to the four-leaf stage, while Ndff and Ndfs uptake was lowest between the stage when 50% of pods were of typical length and full maturity. Nitrogen uptake from all sources was similar for all pea cultivars, but significantly depended on the variable temperature and precipitation conditions (years of the study).
1. Introduction
Leguminous plants are an extremely important element of crop rotations, leaving a valuable site for the succeeding plants: cereals, root crops, and industrial crops [1,2,3]. They can be important in addressing the need to reduce the negative effects of continual intensification of agricultural crop production by introducing sustainable production methods that maximize utilization of fertilizers and natural processes [2,4]. The most important benefit of leguminous plant cultivation is the enrichment of soil with nitrogen from the nitrogen fixation process (biological reduction of atmospheric nitrogen), which is also used by the succeeding crops [2,5]. It is estimated that assimilation of nitrogen through symbiosis of microorganisms with plants provides 90–170 million Mg of nitrogen to soils every year [6,7,8]. This represents 70–80% of the total amount of nitrogen accumulating in the soil in the nitrogen fixation process by all microorganisms (symbiotic and free living) [9,10]. The efficiency of atmospheric nitrogen reduction in symbiotic systems usually reaches up to 200 kg N·ha−1 (but sometimes even 500 kg N·ha−1) in one year [11,12]. The amount of biologically reduced nitrogen as well as the percentage of N from symbiosis depends in part on, the genetic properties of the leguminous plant and its symbiont, the growth phase, environmental factors, and agro-technical treatments that directly affect nitrogenase activity [4,13,14,15,16].
Temperature and water conditions have a particularly important effect on the efficiency of nitrogen fixation [17,18]. Differences in vegetative and generative growth and in the rate and efficiency of N2 fixation have also been noted between varieties of individual legume species [18,19,20]. Research to date has involved older legume varieties whose morphological and utility characteristics have since been significantly changed through breeding. According to Abi-Ghanem and et al. [21], further research on a larger number of varieties is needed.
Pea (Pisum sativum L.) is one of the most commonly cultivated plants in this family due to its high nutritional value and high yield potential. The multiple uses of its seeds, its beneficial effect on soil properties, and the possibility of obtaining a favorable site for succeeding crops were additional reasons for undertaking research on the amount of nitrogen taken up by peas from various sources, with particular focus on the possibility of soil enrichment with atmospheric nitrogen. The results of previous research on nitrogen uptake from the atmosphere by this species are quite inconsistent [11,12,22,23], and there is no precise data describing the uptake of this macronutrient from initial application of N and from soil reserves.
The aim of the study was to determine the amount of nitrogen taken up from the atmosphere, mineral fertilizer, and soil reserves by two currently recommended pea cultivars, during six stages of growth, from the four-leaf stage to full maturity. Further, determined was the amount of nitrogen from each source removed from the field with the seed yield, as well as the amount of nitrogen introduced to the soil in the form of crop residues, which would be a source of this macronutrient for the succeeding crop.
It was hypothesized that mineral fertilizer (applied at the low recommended starting rate of 30 kg N·ha−1) and soil reserves would be the dominant sources of nitrogen for pea in the four-leaf and three-internode stages, while the atmosphere would be the major source in subsequent growth stages. It was further hypothesized that the amount of nitrogen taken up by pea from different sources would vary depending on the cultivar.
2. Materials and Methods
2.1. Field Experiment
In a field experiment conducted in Siedlce, Poland (52°10′12′′ N, 22°17′15′′ E) in 2015 and 2016, pea (Pisum sativum L.) was grown in a traditional soil cultivation system. The soil was classified among Luvisols (LV), consisting of 81% sand, 17% silt, and 2% clay. Some properties of the soil are given in Table 1. The experiment was two-factorial, set up in a randomized block design in three replications. The first factor was two pea cultivars: ‘Milwa’, a fodder cultivar, and ‘Batuta’, a multi-purpose cultivar. The second factor was the growth stage of pea (6 harvest dates according to the BBCH scale (Biologische Bundesantalt, Bundessortenamt und Chemische Industrie) [24]): (1) 4-leafstage, BBCH 14; (2) 3-internodestage, 33 BBCH; (3) stage of first visible single buds outside the leaves, BBCH 55; (4) full flowering stage, 65 BBCH; (5) stage when 50% of pods are of typical length, BBCH 75; and (6) full maturity, BBCH 90.
To calculate the amount of nitrogen taken up by legumes from different sources by the isotope dilution method, a reference plant which lacks the capacity to live in symbiosis with root nodule bacteria must be grown in parallel. Cereals may be grown as reference plants [18,23,25]. In this study, the ‘Ella’ cultivar of spring barley (Hordeum vulgare L.) was grown in the same conditions as pea. The harvest dates for barley were also the same as for pea (6 dates).
The experiment included 54 plots, 36 with pea and 18 with barley, each with an area of 1 m2. Winter rye was the forecrop for all test plants.
Nitrogen was introduced into the soil before sowing of pea and spring barley, at 30 kg N·ha−1 in the form of (NH4)2SO4 enriched with the 15N isotope. On the plots where pea and spring barley were harvested at BBCH stages 14–75 (5 harvest dates), 5% enrichment with 15N was applied. On the plots where the plants were harvested at full maturity, the level of enrichment with 15N was 10% (to test the effects for the succeeding crop). The phosphorus and potassium application rates were established after determining the available amounts of these elements in the soil (Table 1). Potassium was applied in an amount corresponding to 100 kg K·ha−1. Phosphorus was not applied, because the soil was shown to have very high content of this macronutrient in forms available to plants.
Before sowing, the pea seeds were inoculated with Nitraginae, which contained symbiotic Rhizobium leguminosarum bacteria. Pea and spring barley were sown by hand on April 8 of both years in the amount of 110 germinating seeds per m2 and 500 germinating grains per m2, respectively. No herbicides were used, and weeds were removed manually.
Whole pea and spring barley plants were harvested by hand at the specified growth stages by digging them out of the soil with a spade to a depth of 0.25 m, separately from each plot.
2.2. Laboratory Analyses
All plants harvested at pea BBCH stages 14–75 were separated into roots and aboveground part, and at BBCH stage 90 pea seeds and barley grain were separated as well. The aboveground part included all the aboveground organs of peas and barley except the seeds or grain, which were separated at full maturity. Then the harvested separated parts were weighed, and representative samples were taken from each plot. The following were determined in all samples of the test plants:
- −
- dry matter (d.m.) content—70 °C
- −
- total nitrogen content—Kjeldahl method
- −
- enrichment with the 15N isotope—after wet mineralization by the Kiejdahl method and distillation to an acid solution (5% HCl), on the NOI-6e emission spectrometer (Leipzig, Germany).
2.3. Weather Conditions
Analysis of the weather during the growing season of pea and spring barley showed that the temperature and moisture conditions were varied in the years of the study (Table 2 and Table 3).
Analysis of the precipitation needs of pea [26,27] and data on the amount of precipitation in its growing season (Table 2) shows that the total precipitation in 2015 was lower than optimal, while in 2016 it fully met the requirement. However, the distribution of rainfall in individual months of the growing season was unfavorable in both years of the experiment. Compared to 2016, in 2015 there was less rainfall in April, June, and July, and almost 3 times as much in May. Moreover, in the second year of pea cultivation, the air temperature during the entire growing season was higher than in 2015. Selyaninov’s hydrothermal index indicates that April and July of 2015 were moderately dry, May was very wet, and June was dry (Table 3). In 2016, April was moderately wet, May and June were dry, and July was wet.
2.4. Calculations of Nitrogen Sources
The percentages of nitrogen in the pea plants derived from different sources, i.e., from the atmosphere—(Ndfa), from mineral fertilizer—(Ndff), and from soil—(Ndfs), were calculated using formulas given by Rymuza et. al. [18], Kalembasa et al. [25], Azam and Farooq [28]:
- the percentage of nitrogen derived from the atmosphere (%Ndfa):%Ndfa = 1 − (%15Nenrichment_fx/%15Nenrichemnt_nfx)
- −
- % 15N enrichment_fx-15N isotope enrichment in pea;
- −
- % 15N enrichment_nfx-15N isotope enrichment in the references plant—barley;
- the percentage of nitrogen derived from the fertilizer (%Ndff):%Ndff = %15Nenrichment_fx/%15Nenrichment_fertilizer
- −
- % 15N enrichment_fx-15N isotope enrichment in pea;
- −
- % 15N enrichment_fertilizer-15N isotope enrichment of fertilizer;
- the percentage of nitrogen derived from soil (%Ndfs):%Ndfs = 100 − (%Ndfa − %Ndff)
- −
- %Ndfa—% of nitrogen derived from the atmosphere;
- −
- %Ndff—% of nitrogen derived from the fertilizer.
The amount of nitrogen referred to as "from soil (Ndfs)" included all sources except the atmosphere and mineral fertilizer (this was mainly nitrogen derived from soil reserves).
The amount of nitrogen taken up from the atmosphere (Ndfa), fertilizer (Ndff) and soil reserves (Ndfs) was calculated by multiplying the percentage %Ndfa, %Ndff, and %Ndfs, respectively, by the total nitrogen uptake by pea.
2.5. Statistical Analysis
The results of the experiments were analysed by ANOVA. The dry weight of pea, nitrogen content (Figure 1), accumulation of N from different sources, total uptake and uptake per day in the period from sowing to harvest were analysed by three-way ANOVA: growth stages (1), cultivars (2) and years of research (3). The data representing means for cultivars and for years of research in only one growth stage—full maturity, were analysed by two-way ANOVA: cultivars (1), and years (2). The significance of sources of variation was checked by the Fisher–Snedecor test, and mean values were separated using the Tukey test at the significance level of p < 0.05. Statistica version 12 PL software (12 PL version, StatSoft Inc., Tulsa, OK, USA) was used for these calculations.
3. Results
3.1. Dry Weight of Pea Plants
The dry weight of the harvested pea plants was significantly dependent on the growth stage (Table 4) and years of research, but no significant effect of the cultivar was demonstrated (Table 5).
The weight of pea roots increased from the four-leaf stage to the stage of the first visible flower buds outside the leaves (Table 4). The root mass was similar at BBCH stages 55 and 65. From the stage when 50% of the pods were of typical length to the stage of full maturity, a reduction in the weight of these organs was observed. The weight of the aboveground parts of the pea plants did not differ significantly between the 4-leaf stage and the 3-internode stage. An increase in the weight of the aboveground parts was noted from the stage of the first visible flower buds outside the leaves to the stage when 50% of the pods had reached typical length. The weight of the aboveground parts (without seeds) at full maturity was lower than at the stage when 50% of the pods were of typical length and at full flowering. The weight of the whole pea plants (the sum of weights of the separated parts) increased systematically from the four-leaf stage to full maturity. At full maturity, the average seed yield of 260.4 g·m−2 represented 38.2% of the total pea mass. The total weight of crop residues (sum of the aboveground parts and roots) was 420.5 g·m−2.
Under the conditions of the experiment conducted in 2016, the weight of the roots, aboveground parts, seeds and whole pea plants harvested at full maturity was 39.8%, 23.4%, 44.4% and 32.4% lower, respectively, than in 2015 (Table 5).
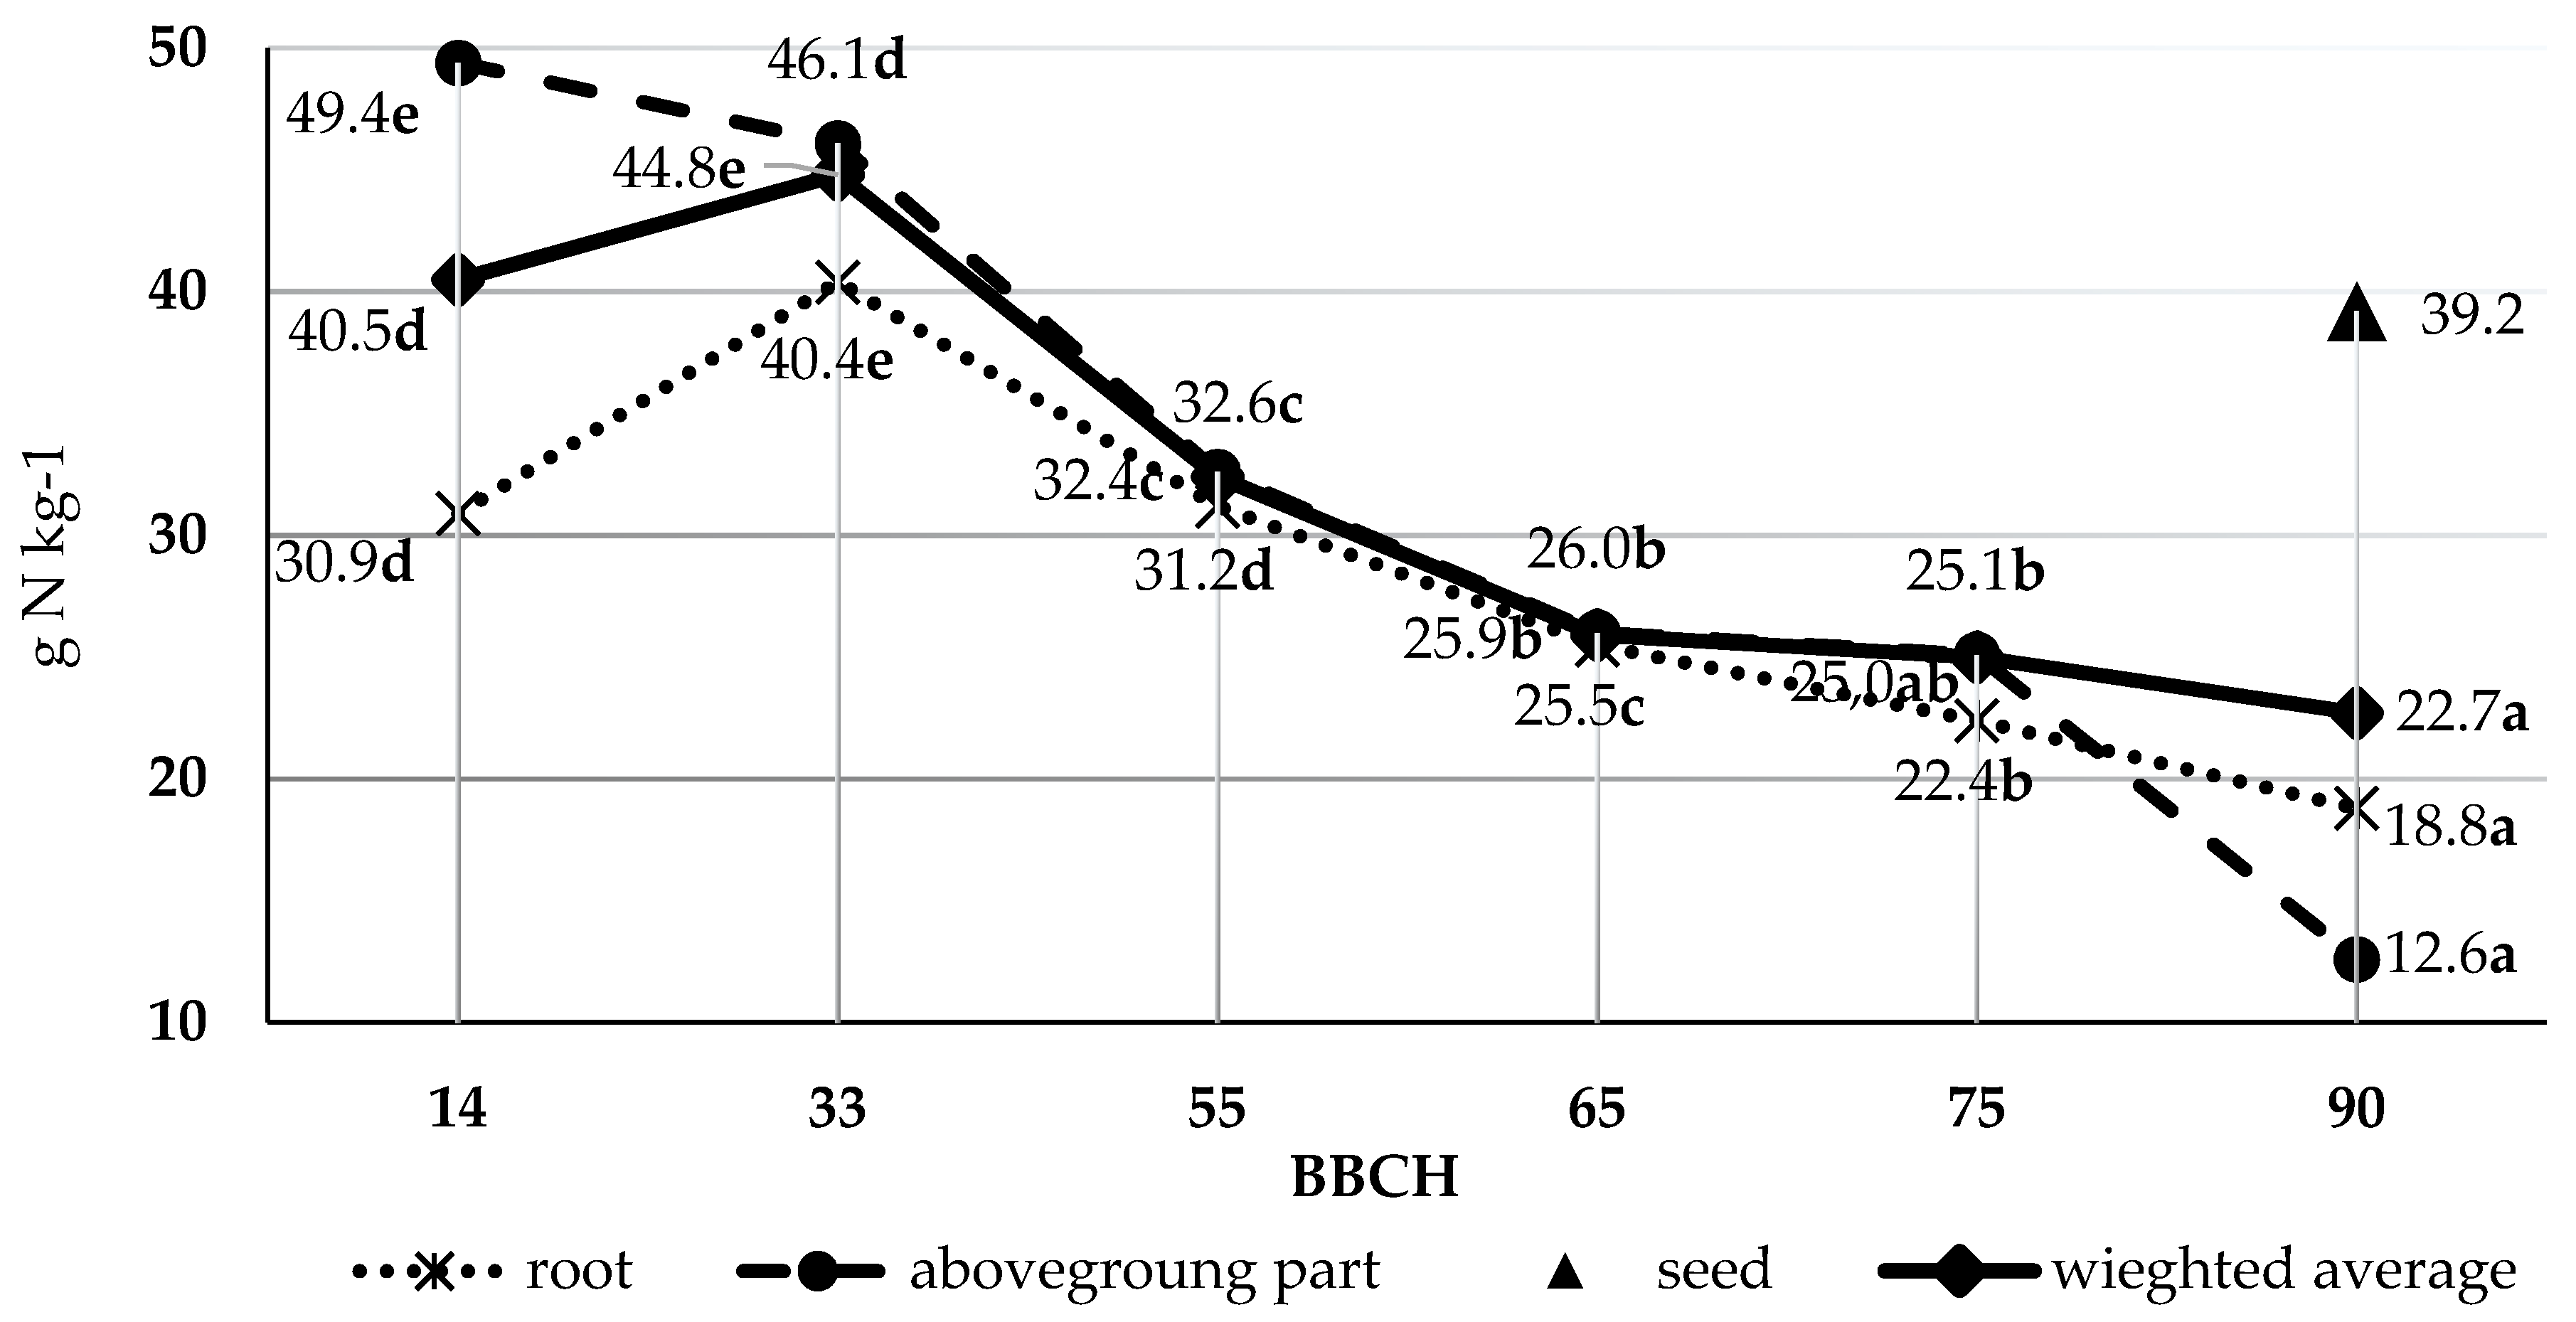
3.2. Nitrogen Content in Dry Wieght of Pea
The nitrogen content in the roots, aboveground parts, and on average in the whole pea plants was significantly dependent on the growth stage (Figure 1). The roots contained the most nitrogen (40.4 g N·kg−1 d.m.) at the three-internode stage. From the stage of the first visible flower buds outside the leaves, the N content in the roots decreased up to the full maturity stage. The nitrogen content in the roots at the four-leaf stage and the stage of the first visible flower buds was similar.
In the aboveground parts of the pea plants, the highest nitrogen content was obtained at BBCH stage 14 phase (49.4 g N·kg−1 d.m.). In subsequent growth stages, the content of this element in the aboveground parts decreased up to the full flowering stage. At BBCH stages 65 and 75 the concentration of nitrogen in the aboveground parts was similar. As in the case of the roots, the N content in the aboveground parts (without seeds) was also lowest on the last harvest date. The average nitrogen content in the whole plants was highest at the three-internode stage (44.8 g N·kg−1 d.m.) and lowest at full maturity (22.7 g N·kg−1 d.m.). The changes in nitrogen content in the whole pea plants harvested at different BBCH growth stages can be presented in decreasing order as follows: BBCH 33 > 14 > 55 > 65 > 90. The nitrogen content in the pea plants at BBCH stage 75 did not differ significantly compared to BBCH stages 65 and 90.
The nitrogen content in the roots was 19.9% higher in pea grown in 2015 than in 2016 (Table 6). The content of this macronutrient in the aboveground parts, seeds, and on average in the whole plants did not differ significantly between the two years of the study. The cultivar also did not significantly affect nitrogen content in any of the separated parts or an average in the whole plants.
3.3. The Amount of Nitrogen Uptake from Different Sources
The amount of nitrogen taken up from the atmosphere, mineral fertilizer, and soil reserves, as well as the total amount (sum from all sources) accumulated in the whole pea plants, differed significantly in successive growth stages (Table 7) and between years of the study (Table 8).
The amount of nitrogen derived from the atmosphere in the whole mass of pea did not differ significantly between the 4-leaf stage and the 3-internode stage (Table 7). The amount of nitrogen taken up from this source increased successively in the stages of the first visible flower buds outside the leaves and full flowering. No significant differences were found in the amount of this macronutrient derived from the nitrogen fixation process in the whole pea plants harvested at BBCH stages 65, 75, and 90.
The amount of nitrogen taken up from the mineral fertilizer by the whole pea plants increased between BBCH growth stages (14 and 33; 33 and 65; 55 and 90 (Table 7). The amount of nitrogen taken up from the mineral fertilizer did not increase significantly between BBCH stages 33 and 55; 55 and 65; 65 and 75; or 75 and 90.
In the whole pea plants, the amount of nitrogen derived from soil reserves increased between BBCH growth stages 14 and 33; 33 and 65; 65 and 90 (Table 7).
The total amount of nitrogen taken up by pea (sum of all sources) increased from the four-leaf stage through subsequent harvest stages up to full flowering. From the full flowering stage to full maturity, there was no significant increase in the total amount of nitrogen taken up by the plants (Table 7).
On average for both cultivars and both years of the study, in pea harvested at full maturity the nitrogen uptake from the atmosphere, from soil reserves, and from mineral fertilizer was 92.1, 52.8, and 10.6 kg N∙ha−1, respectively, which accounted for 59.2%, 34.0%, and 6.8% of the total N uptake (Table 7).
The amount of nitrogen taken up from the atmosphere, mineral fertilizer, and soil reserves, as well as the total amount taken up from all sources by pea harvested at full maturity, was lower by 49.1%, 33.9%, 9.7%, and 36.6%, respectively, under the conditions of the experiment conducted in 2016 than in 2015 (Table 8).
The total amount of nitrogen taken up by pea harvested at full maturity, as well as the amounts derived from the atmosphere, mineral fertilizer, and soil reserves, was not significantly influences by the cultivar (Table 8).
The varied rates of nitrogen uptake can be seen in the amount of this element taken up per day of the growing season (Table 9). The lowest rate of nitrogen uptake by pea from the atmosphere and in total from all sources was found in the period from sowing to the four-leaf stage and from the stage when 50% of the pods had reached typical length to full maturity, while the highest rate was found between the three-internode stage and the stage of the first visible flower buds outside the leaves. The lowest rate of nitrogen uptake from mineral fertilizer was noted between full flowering and full maturity, while the rate of intake from soil reserves was lowest between the stage when 50% of the pods were of typical length and full maturity. The highest rate of nitrogen uptake from mineral fertilizer and soil reserves per day was attained between the 4-leaf stage and the 3-internode stage. The rate of nitrogen uptake per day from soil reserves did not differ significantly between BBCH stages 14 and 65.
The rate of nitrogen accumulation per day during the whole period from sowing to harvesting of pea was the highest from the atmosphere—1.158 kg N·ha−1; lower from soil reserves—0.603 kg N·ha−1; and the lowest from mineral fertilizer—0.115 kg N·ha−1. The total uptake of nitrogen (as the sum from all sources) per day from sowing to full maturity was 1.876 kg N·ha−1 on average.
At the full maturity stage of pea on average 102.0 kg·ha−1 of nitrogen was removed from the field with the seeds, including 61.1 kg N·ha−1 derived from the atmosphere, 6.9 kg N·ha−1 from mineral fertilizer, and 34.0 kg N·ha−1 from soil reserves (Table 10). The pea seeds accumulated about two-thirds of the nitrogen derived from individual sources and all sources in total.
At the full maturity stage of pea, the amount of nitrogen introduced into the soil with the roots and aboveground parts (without seeds) averaged 53.5 kg·ha−1, including 31.0 kg·ha−1 derived from the atmosphere—(actual soil enrichment), 3.7 kg·ha−1 from mineral fertilizer, and 18.8 kg·ha−1 from soil reserves (Table 10).
4. Discussion
Pea can be grown for green fodder or protein-rich seeds. It has a very high crop yield potential, but in practice it has low and unstable yield due to its high sensitivity to agro-technical and habitat factors, especially weather conditions during the growing season [29,30,31,32,33]. Precipitation totals and distribution are the factors determining the yield of pea [29,34,35]. Excessively high temperature during the flowering period alters the course of some phenological stages of pea [36]. At higher temperatures, it finishes flowering earlier and also begins to bud and ripen a few days earlier than plants growing at optimum temperatures. The present study showed a strong reaction of pea to high temperature and uneven precipitation distribution. In the unfavourable weather conditions of May and June 2016 (a dry period with limited precipitation and high air temperatures), i.e., during the intensive vegetative growth and generative development of peas (from BBCH 14 to 75), a smaller harvested mass of peas was obtained compared to 2015. A decrease in the weight of pea plants and seed yield are a consequence of water stress, which causes the stomata to close in order to reduce water loss, thus reducing the rate of photosynthesis [37]. In the present study, after the period of low precipitation in May and June 2016 (dry period), a large amount of rainfall was recorded in July (half of the species’ rainfall requirement, wet month). Analysis of the dry weight obtained and the yield of pea seeds in 2016 indicates that the heavy rainfall during this period did not compensate for the yield losses caused by the earlier long period of drought. In contrast, in the first year of the research the inadequate precipitation noted in June was compensated for by water reserves from the heavy rainfall in May (very wet month).
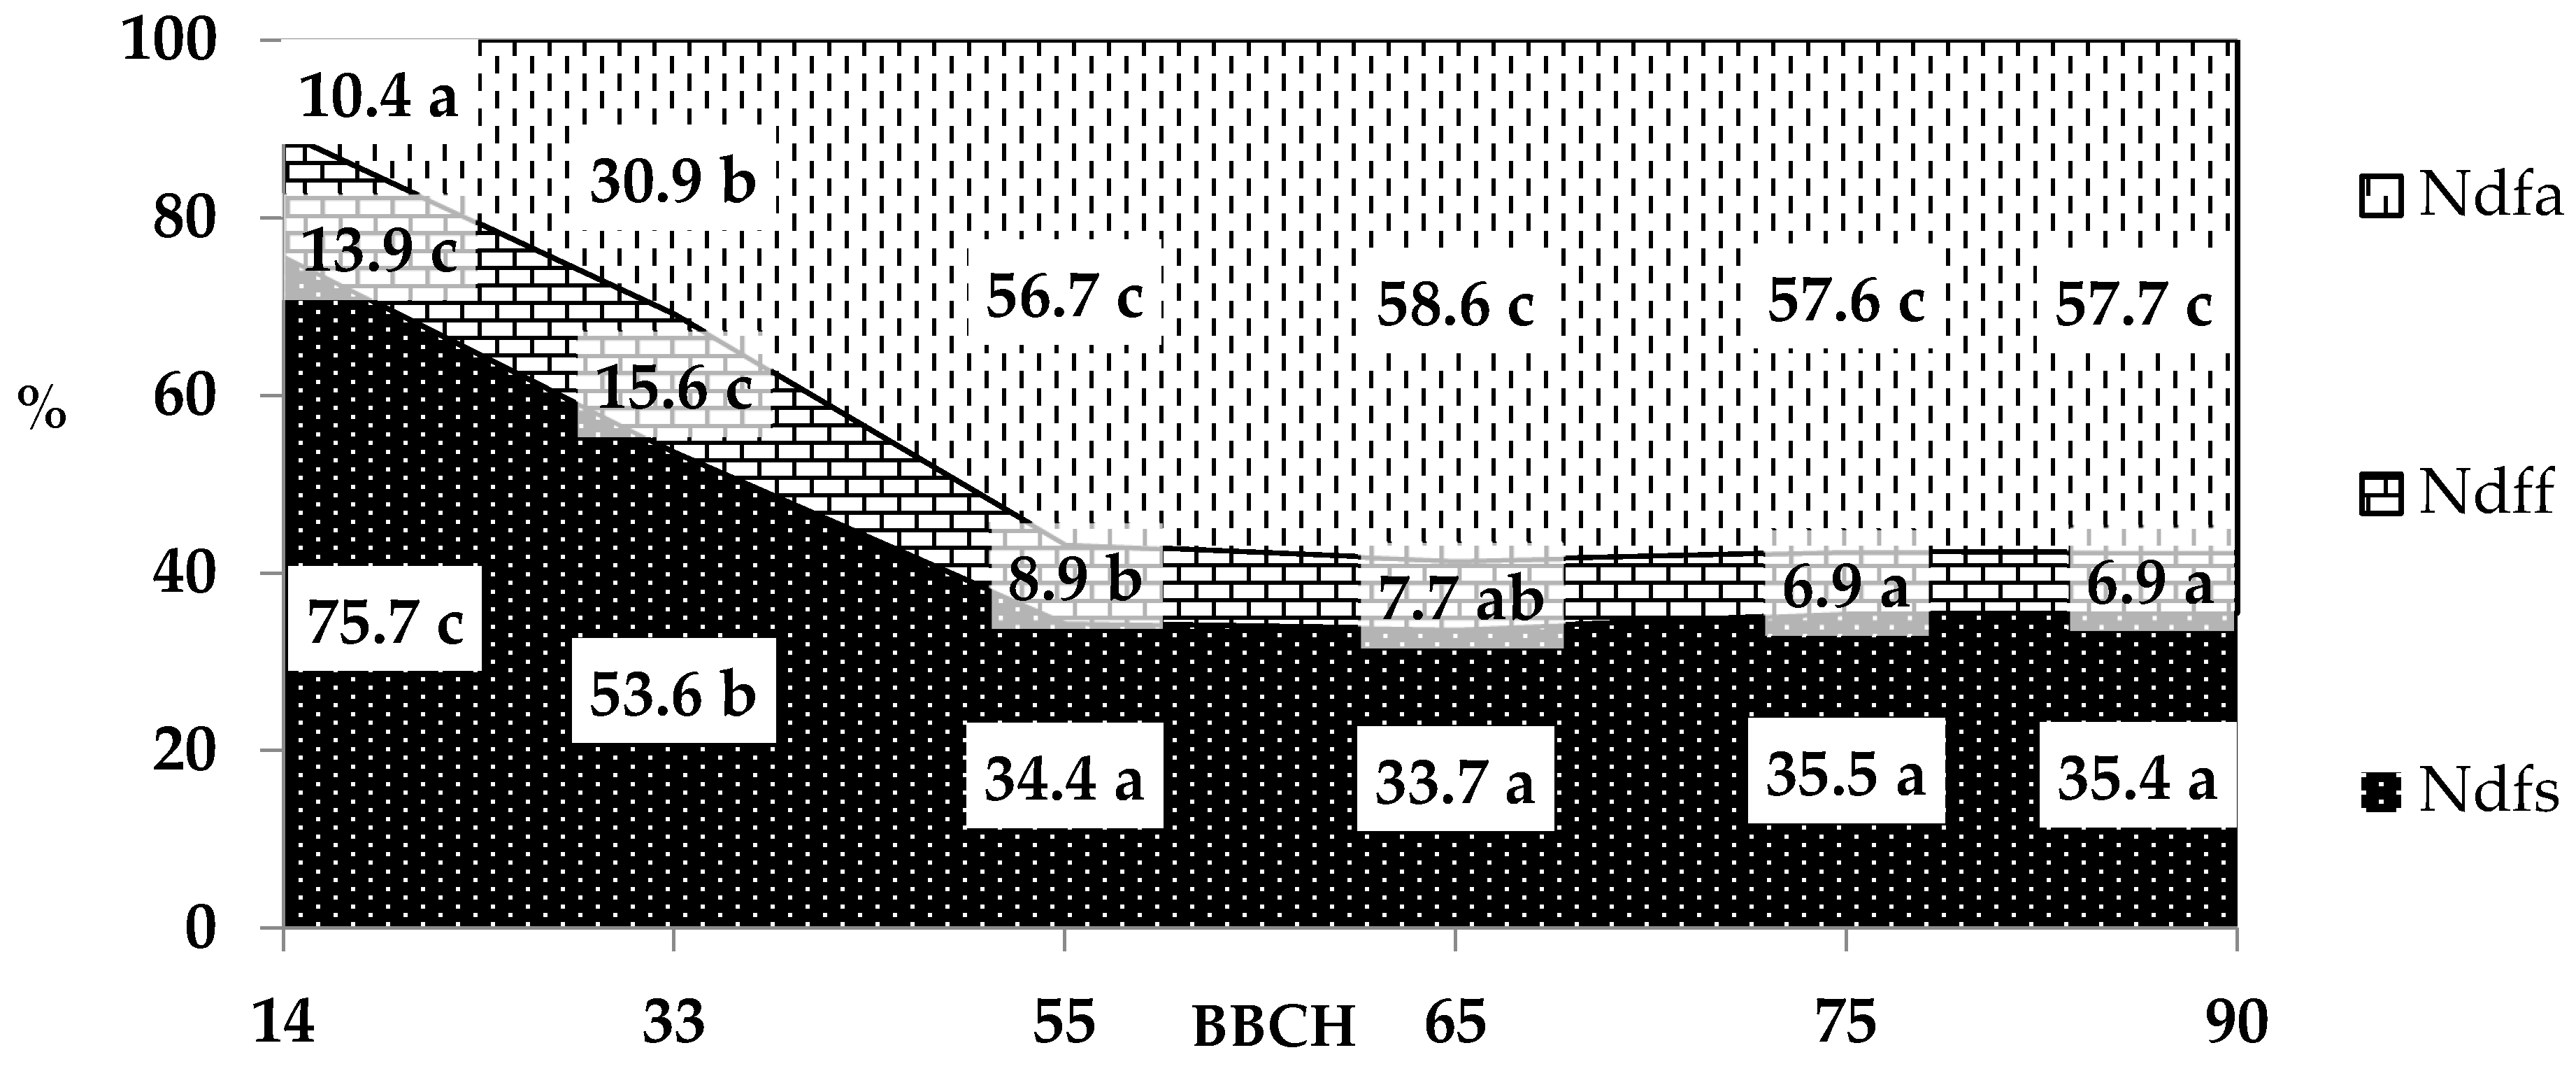
Pea can take up nitrogen from various sources: from the atmosphere as a result of symbiosis with Rhizobium leguminosarum, from fertilizers, and from soil reserves. Our results partially confirm the research hypothesis that mineral fertilizer and soil reserves would be the main sources of nitrogen for pea at the four-leaf stage and three–internode stage, while the atmosphere would be the main source in subsequent stages of growth and development. The analysis of the percentage share of nitrogen taken up from various sources by pea indicates that in the four-leaf stage and three-internode stage, the dominant source of this macronutrient was soil reserves (Figure 2). In the total nitrogen uptake, the percentage of nitrogen originating in the soil reserves in these growth stages was 75.7% and 53.6%, respectively. The rate of nitrogen uptake from this source was also highest up to the stage of the first visible flower buds outside the leaves. The small percentage of nitrogen from the atmosphere in the four-leaf stage (10.4% on average) may be due to the formation of a symbiotic system with root nodule bacteria during this period.
Herdina and Silsbury [38] report that symbiosis and reduction of N2 nitrogen begin on about the 20th day and cease before seed filling begins. The process is most intensive immediately before and during flowering. In subsequent growth stages it is inhibited, which is associated with a decrease in the rate of carbon dioxide assimilation and a reduction in the transport of assimilates to the root nodules. Lower demand for nitrogen results in an increase in the concentration of amino acids in the nodules and leads to their slow decomposition. Jensen [39] also found that symbiotic nitrogen fixation is not uniform throughout the growth and development of pea and decreases at the end of the growing season. Marrou et al. [40] report that this process slows down significantly at the beginning of the seed filling stage. Schiltz et al. [41] observed a decrease in the rate of atmospheric nitrogen reduction after the pea flowering period. In our research, the rate of nitrogen uptake from the atmosphere increased up to the stage of the first visible flower buds outside the leaves. The highest nitrogen uptake from this source per day of vegetation was recorded between the three-internode stage and the stage of the first visible flower buds outside the leaves. In subsequent development stages, the rate of reduction of atmospheric nitrogen decreased. Similar relationships were found for the total (rate of nitrogen uptake from all sources as for the rate of nitrogen uptake from the atmosphere. The highest rate of nitrogen uptake from easily available forms introduced into the soil in the form of mineral fertilizer () was obtained between the 4-leaf stage and the 3-internode stage.
There is some difficulty in generalizing how much biologically reduced nitrogen can be taken up by different leguminous plant species in different regions and cultivation systems [42]. The process of symbiotic nitrogen fixation is strongly dependent on environmental factors, such as temperature, moisture, and soil type, reaction, and nutrient content [43,44,45]. Duzdemir et al. [11] state that the amount of nitrogen taken up by peas and derived from nitrogen fixation ranges from 50 to 150 kg N·ha−1. In a cold and wet climate, pea uptake can reach 286 kg N·ha−1 [22], while according to Armstrong et al. [46], it can exceed 100 kg N·ha−1. In our experiment, pea at full maturity took up an average of 92.1 kg N·ha−1 from the atmosphere, with significant differentiation between the years of the research: 122.1 and 62.1 kg N·ha−1. The results indicate that temperature and precipitation conditions substantially influenced both the yield, which was presented at the beginning of this section, and the amount of nitrogen taken up from the atmosphere and from other sources (mineral fertilizer and soil reserves). The amount of nitrogen taken up by pea from the atmosphere, from mineral fertilizer, and from soil reserves varied between the two years of the research, as did the total weight of plants and the seed yield. The pea harvested in 2015 had a higher percentage of nitrogen derived from the atmosphere and a higher amount of N from this source than in 2016. Therefore, in terms of the efficiency of biological fixation of N2, the more beneficial year was the one with a lower average temperature and lower precipitation over the entire growing season, but with heavy rainfall in May (very wet month), which may also have affected water availability in June. Wysokinski et al. [23], examined the amounts of nitrogen taken up by peas from various sources in a pot experiment conducted in a greenhouse where the temperature was much higher than the outside temperature. They found that a small percentage of nitrogen was derived from the atmosphere in the whole pea plants: 9.6%, 9.2%, and 15.0%, at the start of flowering, and full flowering and full maturity, respectively. These authors suggest that, apart from the higher temperature, the small percentage of nitrogen from the atmosphere in the total amount in the yield could also have been the effect of mineral nitrogen introduced into the soil before sowing in the amount of 0.05 kg−1 of soil (which, given the weight of the arable soil layer on 1 ha amounting 3·106 kg, comes to 150 kg N·ha−1). Researches’ opinions on initial nitrogen application rates are varied. Some recommend low pre-sowing application of nitrogen, at 25–30 kg N·ha−1, for cultivation of leguminous plants [47]. Clayton et al. [48] demonstrated that tan initial nitrogen application rate above 40 kg·ha−1 in pea cultivation significantly inhibited the formation of root nodules. Some authors pay special attention to the content of mineral forms of nitrogen in soil and their inhibitory effect on the binding of atmospheric nitrogen [49]. According to Voisin et al. [50], in favorable conditions and with low soil nitrogen content, pea can take up to 80% of this element from the air. In present study, the percentage of nitrogen from the atmosphere (from the full flowering stage to full maturity ranged from 56.7% to 58.6%. The reason for the slightly lower percentage share of nitrogen derived from the air and the increase in the pool from soil reserves compared to the experiment by Voisin et al. [50] may have been high soil nitrogen content. High soil nitrogen content, caused by such factors as intensive agriculture and the application of high levels of mineral nitrogen, delays nodulation and the start of atmospheric nitrogen fixation, and also reduces the amount of this element taken up by leguminous plants from the air [51,52]. In our research, at full pea maturity the combined share of nitrogen from soil resources and mineral fertilizer was 42.4% of the total nitrogen accumulated in the whole mass of pea plants. A low level of mineral nitrogen (30 kg N·ha−1) was applied before sowing (methodological requirement of the research), and its average share from this source in peas harvested at full maturity was small (6.8%).
Whole green pea plants can be introduced into the soil as green manure. Crop residues are also most often used in this way. Nitrogen introduced into the soil with this organic matter may be taken up by succeeding crop, and its amount largely determines the forecrop value of legumes [1,23,53]. The application of whole pea plants at BBCH stages 55, 65 and 75 and crop residues (roots and aboveground parts, without seeds) at BBCH stage 90 would introduce 97.8, 134.9, 149.0, and 53.5 kg N·ha−1, respectively, to the soil, of which 56.6, 81.0, 88.1, and 31.0 kg·ha−1 would be nitrogen from the atmosphere actual nitrogen enrichment of the soil. This pool may be a significant source of nitrogen for the succeeding plants. It is therefore necessary to continue research to determine the availability of nitrogen introduced into the soil with crop residues of pea for subsequent crops and to determine the utilization of this macronutrient from the atmosphere and from mineral fertilizer.
5. Conclusions
The main source of nitrogen for pea in the initial growth stages (BBCH 14, and 33) was soil reserves, while from BBCH stage 55 to 90 it was the atmosphere. Mineral fertilizer applied at rate of 30 kg N·ha−1 was not found to be significant source of nitrogen for pea. The rate of nitrogen uptake by pea from the atmosphere (3.253 kg N·ha−1 per day) and from all sources in total (4.143 kg N·ha−1 per day) was highest between the three-internode stage and the stage of the first visible flower buds outside the leaves, while the rate of uptake from mineral fertilizer (0.333 kg N·ha−1 per day) and from soil reserves (0.882 kg N·ha−1 per day) was highest between the 4-leaf stage and the 3-internode stage. The rate of nitrogen uptake from the atmosphere (0.046 kg N·ha−1 per day) was lowest from sowing to the 4-leaf stage, while from mineral fertilizer (0.011 kg N·ha−1 per day), from soil reserves (0.071 kg N·ha−1 per day), and in total from all sources (0.210 kg N·ha−1 per day) it was lowest between the stage 50% of pods were of typical length and the full maturity stage. The main site of nitrogen accumulation (from all sources) was the seeds with 65.6% of the total nitrogen taken up by pea. Of the 102.0 kg N·ha−1 accumulated in the seeds 61.1 kg N·ha−1 was from the atmosphere 6.9 kg N·ha−1 from mineral fertilizer, and 34.0 kg N·ha−1 from soil reserves. Soil enrichment with atmospheric nitrogen introduced with crop residues (roots, straw, and stripped pods) was minor, amounting to 31.0 kg N·ha−1.
Author Contributions
Conceptualization, A.W.; methodology, A.W.; resources, I.L. and A.W.; writing—original draft preparation, A.W. and I.L.; writing—review and editing, A.W.; visualization, I.L. and A.W. All authors have read and agreed to the published version of the manuscript.
Funding
This research was funded by the Polish Ministry of Science and Higher Education, grant number 143/15/MN and 37/20/B.
Institutional Review Board Statement
Not applicable.
Informed Consent Statement
Not applicable.
Data Availability Statement
Not applicable.
Conflicts of Interest
The authors declare no conflict of interest. The funders had no role in the design of the study; in the collection, analyses, or interpretation of data; in the writing of the manuscript, or in the decision to publish the results.
References
- Fowler, C.J.E.; Condron, L.M.; McLenaghen, R.D. Effects of green manures on nitrogen loss and availability in an organic cropping system. N. Z. J. Agric. Res. 2004, 47, 95–100. [Google Scholar] [CrossRef]
- Stagnari, F.; Maggio, A.; Galieni, A.; Pisante, M. Multiple benefits of legumes for agriculture sustainability: An overview. Chem. Biol. Technol. Agric. 2017, 4, 2. [Google Scholar] [CrossRef] [Green Version]
- Uzoh, I.; Igwe, C.; Okebalama, C.B.; Babalola, O.O. Legume-maize rotation effect on maize productivity and soil fertility parameters under selected agronomic practices in a sandy loam soil. Sci. Rep. 2019, 9, 8539. [Google Scholar] [CrossRef] [PubMed] [Green Version]
- Yang, C.; Bueckert, R.; Schoenau, J.; Diederichsen, A.; Zakeri, H.; Warkentin, T.D. Evaluation of growth and nitrogen fixation of pea nodulation mutants in western Canada. Can. J. Plant Sci. 2017, 97, 1121–1129. [Google Scholar] [CrossRef] [Green Version]
- Hong, Y.; Ma, Y.; Wu, L.; Maki, M.; Qin, W.; Chen, S. Characterization and analysis of nifH genes from Paenibacillus sabinae T27. Microbiol. Res. 2012, 167, 596–601. [Google Scholar] [CrossRef]
- Ishizuka, J. Trends in biological nitrogen fixation research and application. Plant Soil 1992, 141, 197–209. [Google Scholar] [CrossRef]
- Kozłowski, S.; Swędrzyński, A.; Zielewicz, W. Leguminous plants in natural environment. Water Environ. Rural Areas 2011, 11, 161–181. [Google Scholar]
- Martyniuk, S. Scientific and practical aspects of legumes symbiosis with root-nodule bacteria. Pol. J. Agron. 2012, 9, 17–22. [Google Scholar]
- Peoples, M.B.; Craswell, E.T. Biological nitrogen fixation: Investments, expectations, and actual contributions to agriculture. Plant Soil 1992, 141, 13–39. [Google Scholar] [CrossRef]
- Cheng, Q. Perspectives in biological nitrogen fixation research. J. Integr. Plant Biol. 2008, 50, 784–796. [Google Scholar] [CrossRef]
- Duzdemir, O.; Kurunc, A.; Unlukara, A. Response of pea (Pisum sativum) to salinity and irrigation water regime. Bulg. J. Agric. Sci. 2009, 15, 400–409. [Google Scholar]
- Hauggaard-Nielsen, H.; Holdensen, L.; Wulfsohn, D.; Jensen, E.S. Spatial variation of N2-fixation in field pea (Pisum sativum L.) at the field scale determined by the 15N natural abundance method. Plant Soil 2010, 327, 167–184. [Google Scholar] [CrossRef]
- Reiter, K.; Schmidtke, K.; Rauber, R. The influence of long-term tillage systems on symbiotic N2 fixation of pea (Pisum sativum L.) and red clover (Trifolium pratense L.). Plant Soil 2002, 238, 41–55. [Google Scholar] [CrossRef]
- Karahne, V.; Singh, V.P. Effect of rhizobial inoculation on growth, yield, nodulation and biochemical characters of vegetable pea (Pisum sativum L.). Acta Agron. Hung. 2009, 57, 47–56. [Google Scholar] [CrossRef]
- Bonilla, I.; Bolańos, L. Mineral nutrition for legume-rhizobia symbiosis: B, Ca, N, P, S, K, Fe, Mo, Co, and Ni: A review. In Organic Farming, Pest Control and Remediation of Soil Pollutants; Lichtfouse, E., Ed.; Springer: Dordrecht, The Netherlands, 2010; pp. 253–274. [Google Scholar] [CrossRef]
- Schwember, A.R.; Schulze, J.; del Pozo, A.; Cabeza, R.A. Regulation of symbiotic nitrogen fixation in legume root nodules. Plants 2019, 8, 333. [Google Scholar] [CrossRef] [PubMed] [Green Version]
- Wu, L.; Baddeley, J.; Watson, C. Models of biological nitrogen fixation of legumes. A review. Agron. Sustain. Dev. 2011, 31, 155–172. [Google Scholar]
- Rymuza, K.; Radzka, E.; Wysokinski, A. Nitrogen uptake from different sources by non-GMO soybean varieties. Agronomy 2020, 10, 1219. [Google Scholar] [CrossRef]
- Bourion, V.; Laguerre, G.; Depret, G.; Voisin, A.S.; Salon, C.; Duc, G. Genetic variability in nodulation and root growth affects nitrogen fixation and accumulation in pea. Ann. Bot. 2007, 100, 589–598. [Google Scholar] [CrossRef]
- Abi-Ghanem, R.; Carpenter-Boggs, L.; Smith, J.L. Cultivar effects on nitrogen fixation in peas and lentils. Biol. Fertil. Soils 2011, 47, 115–120. [Google Scholar] [CrossRef]
- Abi-Ghanem, R.; Bodah, E.T.; Wood, M.; Braunwart, K. Potential breeding for high nitrogen fixation in Pisum sativum L.: Germplasm phenotypic characterization and genetic investigation. Am. J. Plant Sci. 2013, 4, 1597–1600. [Google Scholar] [CrossRef] [Green Version]
- Kumar, K.; Goh, K.M. Biological nitrogen fixation, accumulation of soil nitrogen and nitrogen balance for white clover (Trifolium repens L.) and field pea (Pisum sativum L.) grown for seed. Field Crops Res. 2000, 68, 49–59. [Google Scholar] [CrossRef]
- Wysokinski, A.; Kalembasa, S.; Symanowicz, B. Dynamic of nitrogen accumulation by pea (Pisum sativum L.) from different sources. Fragm. Agron. 2013, 30, 162–169. [Google Scholar]
- Bleinholder, H.; Weber, E.; Feller, C.; Hess, M.; Wicke, H.; Meier, U.; van den Boom, T.; Lancashire, P.D.; Buhr, L.; Hack, H.; et al. Growth stages of mono- and dicotyledonous plants. In BBCH Monograph; Meier, U., Ed.; JKI: Quedlinburg, Germany, 2001; pp. 1–160. [Google Scholar]
- Kalembasa, S.; Wysokinski, A.; Kalembasa, D. Quantitative assessment of the process of biological nitrogen reduction by yellow lupine (Lupinus luteus L.). Acta Sci. Pol. Agric. 2014, 13, 5–20. [Google Scholar]
- Dzieżyc, J.; Nowak, L.; Panek, K. Ten-day indices of rainfall requirements of crops cultivated in Poland. Adv. Agric. Sci. Probl. Iss. 1987, 31, 11–33. (In Polish) [Google Scholar]
- Chmura, K.; Chylińska, E.; Dmowski, Z.; Nowak, L. The role of the water factor in shaping the yield of selected field plants. Infrastruct. Ecol. Rural Areas 2009, 9, 33–44. (In Polish) [Google Scholar]
- Azam, F.; Farooq, S. An appraisal of methods for measuring symbiotic nitrogen fixation in legumes. Pak. J. Biol. Sci. 2003, 6, 1631–1640. [Google Scholar] [CrossRef]
- McPhee, K.E.; Muehlbauer, F.J. Variation for biomass and residue production by dry pea. Field Crops Res. 1999, 62, 203–212. [Google Scholar] [CrossRef]
- Andrzejewska, J.; Wiatr, K.; Pilarczyk, W. Economic value of selected pea (Pisum sativum L.) cultivars on very good rye soil complex. Acta Sci. Pol. Agric. 2002, 1, 59–72. [Google Scholar]
- Poggio, S.L.; Satorre, E.H.; Dethiou, S.; Gonzallo, G.M. Pod and seed numbers as a function of photothermal quotient during the seed set period of field pea (Pisum sativum) crops. Eur. J. Agron. 2005, 22, 55–69. [Google Scholar] [CrossRef]
- Annicchiarico, P.; Iannucci, A. Adaptation strategy, germplasm type and adaptive traits for field pea improvement in Italy based on variety response across climatically contrasting environments. Field Crops Res. 2008, 108, 133–142. [Google Scholar] [CrossRef]
- Grabowska, K.; Banaszkiewicz, B. Effect of air temperature and atmospheric precipitation on yielding of sowing pea in central Poland. Acta Agroph. 2009, 13, 113–120. [Google Scholar]
- Woźniak, A. The yielding of pea (Pisum sativum L.) under different tillage conditions. Acta Sci. Pol. Hortorum Cultus 2013, 12, 133–141. [Google Scholar]
- Santín-Montanyá, M.I.; Zambrana, E.; Fernández-Getino, A.P.; Tenorio, J.I. Dry pea (Pisum sativum L.) yielding and weed infestation response, under different tillage conditions. Crop Prot. 2014, 65, 122–128. [Google Scholar] [CrossRef]
- Podleśny, J.; Podleśna, A. Effect of high temperature in the flowering period on pea growth, development and yielding. Adv. Agric. Sci. Problem Iss. 2010, 545, 73–78. [Google Scholar]
- Tanguilig, V.C.; Yambao, E.B.; O’toole, J.C.; De Datta, S.K. Water stress effects on leaf elongation, leaf water potential, transpiration and nutrient uptake of rice, maize and soybean. Plant Soil 1987, 103, 155–168. [Google Scholar] [CrossRef]
- Herdina, L.; Silsbury, J.H. Growth, nitrogen accumulation and partitioning, and N2 fixation in faba bean (Vicia faba cv. Fiord) and pea (Pisum sativum cv. Early Dun). Field Crops Res. 1990, 24, 173–188. [Google Scholar] [CrossRef]
- Jensen, E.S. Seasonal patterns of growth and nitrogen fixation in field-grown pea. Plant Soil 1987, 101, 29–37. [Google Scholar] [CrossRef]
- Marrou, H.; Ricaute, J.J.; Ghanem, M.E.; Clavijo Michelangeli, J.A.; Ghaouti, L.; Rao, I.M.; Sinclair, T.R. Is nitrogen accumulation in grain legumes responsive to growth or ontogeny? Physiol. Plant. 2018, 162, 109–122. [Google Scholar] [CrossRef] [Green Version]
- Schiltz, S.; Munier-Jolain, N.; Jeudy, C.; Burstin, J.; Salon, C. Dynamics of exogenous nitrogen partitioning and nitrogen remobilization from vegetative organs in pea revealed by 15N in vivo labeling throughout seed filling. Plant Physiol. 2005, 137, 1463–1473. [Google Scholar] [CrossRef] [Green Version]
- Peoples, M.B.; Brockwell, J.; Herridge, D.F.; Rochester, I.J.; Alves, B.J.R.; Urquiaga, S.; Boddey, R.M.; Dakora, F.D.; Bhattarai, S.; Maskey, S.L.; et al. The contributions of nitrogen-fixing crop legumes to the productivity of agricultural systems. Symbiosis 2009, 48, 1–17. [Google Scholar] [CrossRef]
- Hungria, M.; Vargas, M.A.T. Environmental factors impacting N2 fixation in legumes grown in the tropics, with an emphasis on Brazil. Field Crops Res. 2000, 65, 151–164. [Google Scholar] [CrossRef]
- Meena, V.S.; Maurya, B.R.; Verma, J.P. Does a rhizospheric microorganism enhance K+ availability in agricultural soil. Microbiol. Res. 2014, 169, 337–347. [Google Scholar] [CrossRef] [PubMed]
- Kumar, A.; Bahadur, I.; Maurya, B.R.; Raghuwanshi, R.; Meena, V.S.; Singh, D.K.; Dixit, J. Does a plant growth-promoting rhizobacteria enhance agricultural sustainability? J. Pure Appl. Microbiol. 2015, 9, 715–724. [Google Scholar]
- Armstrong, E.L.; Pate, J.S.; Tennant, D. The field pea in south western Australia. Patterns of water use and root growth in genotypes of contrasting morphology and growth habit. Aust. J. Plant Physiol. 1994, 21, 517–532. [Google Scholar] [CrossRef]
- Huang, J.; Afshar, R.K.; Tao, A.; Chen, C. Efficacy of starter N fertilizer and rhizobia inoculant in dry pea (Pisum sativum L.) production in a semi-arid temperate environment. Soil Sci. Plant Nutr. 2017, 63, 248–253. [Google Scholar] [CrossRef] [Green Version]
- Clayton, G.W.; Rice, W.A.; Lupwayi, N.Z.; Johnston, A.M.; Lafond, G.P.; Grant, C.A.; Walley, F.L. Inoculant formulation and fertilizer nitrogen effects on field pea: Nodulation, N2 fixation and nitrogen partitioning. Can. J. Plant Sci. 2004, 84, 79–88. [Google Scholar] [CrossRef]
- Buttery, B.R.; Gibson, A.H. The effect of nitrate on the time course of nitrogen fixation and growth in Pisum sativum and Vicia faba. Plant Soil 1990, 127, 143–146. [Google Scholar] [CrossRef]
- Voisin, A.S.; Salon, C.; Munier-Jolain, N.G.; Ney, B. Quantitative effects of soil nitrate, growth potential and phenology on symbiotic nitrogen fixation of pea (Pisum sativum L.). Plant Soil 2002, 243, 31–42. [Google Scholar] [CrossRef]
- Van Kessel, C.; Hartley, C. Agricultural management of grain legumes: Has it led to an increase in nitrogen fixation? Field Crops Res. 2000, 65, 165–181. [Google Scholar] [CrossRef]
- Salvagiotti, F.; Cassman, K.G.; Specht, J.E.; Walters, D.T.; Weiss, A.; Dobermann, A. Nitrogen uptake, fixation and response to fertilizer N in soybeans: A review. Field Crops Res. 2008, 108, 1–13. [Google Scholar] [CrossRef] [Green Version]
- Fustec, J.; Lesuffleur, F.; Mahieu, S.; Cliquet, J.B. Nitrogen rhizodeposition of legumes. A review. Agron. Sustain. Dev. 2010, 30, 57–66. [Google Scholar] [CrossRef] [Green Version]
Figure 1.
Nitrogen content in dry weight of pea in following growth stages, g N·kg−1, (meanly from three replications, cultivars, and years), a, b, c, … —averages for the same separated part of the plant with different letters are significantly different, p < 0.05.
Figure 1.
Nitrogen content in dry weight of pea in following growth stages, g N·kg−1, (meanly from three replications, cultivars, and years), a, b, c, … —averages for the same separated part of the plant with different letters are significantly different, p < 0.05.

Figure 2.
Percentage of nitrogen uptake by pea from different sources (Ndfa—from atmosphere, Ndff—from fertilizer, Ndfs—from soil) in following growth stages, % (meanly from three replications, pea cultivars and years of research), a, b, c, …—averages for the same sources of nitrogen with different letters are significantly different.


Table 1.
Some properties of soil in the layer 0–0.25 m before foundation of experiment in 2015 and 2016.
Table 1.
Some properties of soil in the layer 0–0.25 m before foundation of experiment in 2015 and 2016.
| Soil Properties | Unit | Year | |
|---|---|---|---|
| 2015 | 2016 | ||
| pH1 mol·dm-3 KCl | - | 6.6 | 6.5 |
| Ctotal | g·kg−1 | 34.2 | 23.5 |
| Ntotal | 2.10 | 1.45 | |
| PEgnera-Rhiema | mg·kg−1 | 309.0 | 301.0 |
| KEgnera-Rhiema | 86.0 | 111.0 | |
| Fe1 mol·dm-3 HCl | 1327 | 1189 | |
| Mo1 mol·dm-3 HCl | 0.015 | 0.013 | |
| B1 mol·dm-3 HCl | 0.806 | 0.278 | |
Table 2.
Rainfall and air temperatures in 2015–2016, (Institute of Meteorology and Water Management, National Research Institute in Warsaw).
Table 2.
Rainfall and air temperatures in 2015–2016, (Institute of Meteorology and Water Management, National Research Institute in Warsaw).
| Month | Total Monthly Rainfall, mm | Average Monthly Temperatures, °C | ||||
|---|---|---|---|---|---|---|
| Year | Long-Term Mean 1981–2014 | Year | Long-Term Mean 1981–2014 | |||
| 2015 | 2016 | 2015 | 2016 | |||
| III | 53.1 | 46.4 | 29.6 | 4.8 | 3.3 | 2.0 |
| IV | 30.0 | 50.2 | 33.4 | 8.2 | 8.9 | 8.1 |
| V | 100.2 | 35.5 | 6.3 | 12.3 | 14.6 | 13.6 |
| VI | 43.3 | 55.6 | 72.9 | 16.5 | 18.1 | 16.3 |
| VII | 62.6 | 126.8 | 67.6 | 18.7 | 19.0 | 18.5 |
| Sum IV–VII | 236.1 | 268.1 | 234.2 | 13.9 | 15.1 | 14.1 |
Table 3.
Values of the Selyaninov hydrothermal index (k) during the vegetation periods of pea and spring barley and moisture characteristics (wm) of individual months.
Table 3.
Values of the Selyaninov hydrothermal index (k) during the vegetation periods of pea and spring barley and moisture characteristics (wm) of individual months.
| Month | Year | |||
|---|---|---|---|---|
| 2015 | 2016 | |||
| k | wm | k | wm | |
| IV | 1.2 | md | 1.9 | mw |
| V | 2.6 | vw | 0.8 | d |
| VI | 0.9 | d | 1.0 | d |
| VII | 1.1 | md | 2.2 | w |
| VIII | 0.2 | ed | 1.1 | md |
k ≤ 0.4—extremely dry (ed); 0.4 < k ≤ 0.7—very dry (vd); 0.7 < k ≤ 1.0—dry (d); 1.0 < k ≤ 1.3—moderately dry (md); 1.3 < k ≤ 1.6—optimum (o); 1.6 < k ≤ 2.0—moderately wet (mw); 2.0 < k ≤ 2.5—wet (w); 2.5 < k ≤ 3.0—very wet (vw); k > 3.0—extremely wet (ew).
Table 4.
Dry weight of pea plants in following growth stages, g·m−2 (meanly from three replications, peas cultivars, and years of research ± SD).
Table 4.
Dry weight of pea plants in following growth stages, g·m−2 (meanly from three replications, peas cultivars, and years of research ± SD).
| Part of Plant | Growth Stages (BBCH) | |||||
|---|---|---|---|---|---|---|
| 14 | 33 | 55 | 65 | 75 | 90 | |
| Seed | 260.4 ± 79.1 | |||||
| Above ground part | 18.6 ± 3.7 a | 74.1 ± 12.1 a | 271.2 ± 62.3 b | 491.5 ± 151.0 d | 571.7 ± 129.3 e | 407.2 ± 81.8 c |
| Root | 14.8 ± 2.7 a | 20.9 ± 3.0 b | 24.9 ± 4.7 cd | 25.9 ± 4.3 d | 21.7 ± 4.6 bc | 13.3 ± 4.2 a |
| Total mass | 33.4 ± 2.4 a | 95.0 ± 12.3 b | 296.1 ± 65.7 c | 517.4 ± 154.3 d | 593.4 ± 133.2 e | 680.8 ± 147.0 f |
a, b, c, ...—averages for the same separated part of the plant (in the rows) with different letters are significantly different, p < 0.05.
Table 5.
Dry weight of pea plants at BBCH stage 90, g·m−2 (means for cultivars and for years of research from three replications ± SD).
Table 5.
Dry weight of pea plants at BBCH stage 90, g·m−2 (means for cultivars and for years of research from three replications ± SD).
| Part of Plant | Source of Variation | |||
|---|---|---|---|---|
| Pea Cultivar | Year of Research | |||
| ‘Milwa’ | ‘Batuta’ | 2015 | 2016 | |
| Seed | 259.5 ± 89.9 a | 261.2 ± 65.5 a | 334.5 ± 35.8 b | 186.1 ± 14.5 a |
| Aboveground part | 409.1 ± 101.2 a | 405.4 ± 55.9 a | 461.3 ± 55.2 b | 353.2 ± 67.0 a |
| Root | 13.9 ± 5.1 a | 12.7 ± 3.1 a | 016.6 ± 3.5 b | 10.0 ± 1.5 a |
| Total mass | 682.5 ± 183.6 a | 679.3 ± 97.5 a | 812.4 ± 63.2 b | 549.3 ± 67.8 a |
a, b—means for investigated factors with different letters in the rows are significantly different, p < 0.05.
Table 6.
Nitrogen content in dry weight of pea at BBCH stage 90, g N·kg−1 (means for cultivars, and for years of research from three replications ± SD).
Table 6.
Nitrogen content in dry weight of pea at BBCH stage 90, g N·kg−1 (means for cultivars, and for years of research from three replications ± SD).
| Part of Plant | Source of Variation | |||
|---|---|---|---|---|
| Pea Cultivar | Year of Research | |||
| ‘Milwa’ | ‘Batuta’ | 2015 | 2016 | |
| Seed | 40.1 ± 1.8 a | 38.3 ± 0.8 a | 39.2 ± 1.9 a | 39.2 ± 1.4 a |
| Aboveground part | 11.8 ± 1.4 a | 13.5 ± 1.4 a | 12.2 ± 1.6 a | 13.1 ± 1.5 a |
| Root | 18.6 ± 1.6 a | 19.0 ± 2.2 a | 20.5 ± 1.0 b | 17.1 ± 0.5 a |
| Weighted average | 22.6 ± 2.0 a | 23.0 ± 2.1 a | 23.5 ± 1.8 a | 22.0 ± 2.0 a |
a, b—means for investigated factors with different letters in the rows are significantly different, p < 0.05.
Table 7.
Amount of nitrogen taken up by pea from different sources in following growth stages, kg N·ha−1 (meanly from three replications, cultivars, and years ± SD).
Table 7.
Amount of nitrogen taken up by pea from different sources in following growth stages, kg N·ha−1 (meanly from three replications, cultivars, and years ± SD).
| N Source | Part of Plant | Growth Stages (BBCH) | |||||
|---|---|---|---|---|---|---|---|
| 14 | 33 | 55 | 65 | 75 | 90 | ||
| Ndfa
(air) | Seed | 61.1 ± 24.0 | |||||
| Aboveground part | 0.9 ± 0.4 | 10.4 ± 4.1 | 52.1 ± 21.9 | 77.2 ± 30.5 | 85.3 ± 32.0 | 29.6 ± 8.3 | |
| Root | 0.5 ± 0.2 | 2.6 ± 0.7 | 4.5 ± 2.0 | 3.8 ± 1.8 | 2.8 ± 1.2 | 1.4 ± 0.6 | |
| Sum | 1.4 ± 0.8 a | 13.0 ± 4.5 a | 56.6 ± 23.6 b | 81.0 ± 31.9 c | 88.1 ± 32.9 c | 92.1 ± 30.9 c | |
| Ndff (fertilizer) | Seed | 6.9 ± 2.8 | |||||
| Aboveground part | 1.3 ± 0.5 | 5.3 ± 0.9 | 7.7 ± 1.7 | 9.6 ± 2.5 | 9.9 ± 2.5 | 3.5 ± 0.5 | |
| Root | 0.6 ± 0.1 | 1.3 ± 0.3 | 0.6 ± 0.2 | 0.5 ± 0.1 | 0.4 ± 0.1 | 0.2 ± <0.1 | |
| Sum | 1.9 ± 0.6 a | 6.6 ± 1.0 bc | 8.3 ± 1.8 cd | 10.1 ± 2.6 de | 10.3 ± 2.6 de | 10.6 ± 2.9 e | |
| Ndfs (soil) | Seed | 34.0 ± 9.7 | |||||
| Aboveground part | 6.8 ± 1.8 | 18.0 ± 4.0 | 30.0 ± 8.9 | 41.4 ± 13.3 | 48.8 ± 7.4 | 17.8 ± 3.9 | |
| Root | 3.4 ± 0.6 | 4.6 ± 1.1 | 2.9 ± 1.1 | 2.4 ± 0.8 | 1.8 ± 0.6 | 1.0 ± 0.3 | |
| Sum | 10.2 ± 2.1 a | 22.6 ± 4.4 b | 32.9 ± 9.7 bc | 43.8 ± 13.9 cd | 50.6 ± 7.7 de | 52.8 ± 9.4 e | |
| Total uptake (from all sources) | Seed | 102.0 ± 32.0 | |||||
| Aboveground part | 9.0 ± 1.2 | 33.7 ± 3.9 | 89.8 ± 30.1 | 128.2 ± 42.4 | 144.0 ± 36.4 | 50.9 ± 8.9 | |
| Root | 4.5 ± 0.5 | 8.5 ± 1.7 | 8.0 ± 3.2 | 6.7 ± 2.4 | 5.0 ± 1.8 | 2.6 ± 0.9 | |
| Sum | 13.5 ± 1.1 a | 42.2 ± 4.6 b | 97.8 ± 32.9 c | 134.9 ± 44.4 d | 149.0 ± 37.8 d | 155.5 ± 37.3 d | |
a, b, ...—means for investigated factors with different letters in the rows are significantly different, p < 0.05.
Table 8.
Nitrogen uptake from different sources by pea at BBCH stage 90, kg N·ha−1 (means for cultivars, and for years of research from three replications ± SD).
Table 8.
Nitrogen uptake from different sources by pea at BBCH stage 90, kg N·ha−1 (means for cultivars, and for years of research from three replications ± SD).
| N source | Part of Plant | Source of Variation | |||
|---|---|---|---|---|---|
| Pea Cultivars | Year of Research | ||||
| ‘Milwa’ | ‘Batuta’ | 2015 | 2016 | ||
| Ndfa (air) | Seed | 62.5 ± 28.5 | 59.6 ± 18.3 | 84.1 ± 7.6 | 38.0 ± 7.1 |
| Aboveground part | 27.1 ± 8.5 | 32.2 ± 7.2 | 36.0 ± 3.6 | 23.3 ± 6.6 | |
| Root | 1.5 ± 0.8 | 1.4 ± 0.5 | 2.0 ± 0.4 | 0.8 ± 0.2 | |
| Sum | 91.1 ± 37.0 a | 93.2 ± 23.1 a | 122.1 ± 8.1 b | 62.1 ± 8.5 a | |
| Ndff (fertilizer) | Seed | 7.0 ± 3.2 | 6.8 ± 2.2 | 8.8 ± 2.7 | 5.1 ± 0.8 |
| Aboveground part | 3.3 ± 0.5 | 3.6 ± 0.5 | 3.7 ± 0.3 | 3.2 ± 0.6 | |
| Root | 0.2 ± <0.1 | 0.2 ± <0.1 | 0.2 ± <0.1 | 0.1 ± <0.1 | |
| Sum | 10.5 ± 3.3 a | 10.6 ± 2.6 a | 12.7 ± 2.6 b | 8.4 ± 0.6 a | |
| Ndfs (soil) | Seed | 34.6 ± 11.2 | 33.4 ± 7.8 | 38.3 ± 10.9 | 29.8 ± 5.3 |
| Aboveground part | 17.0 ± 4.8 | 18.7 ± 2.6 | 16.0 ± 1.5 | 19.6 ± 4.7 | |
| Root | 1.0 ± 0.3 | 0.9 ± 0.2 | 1.2 ± 0.2 | 0.7 ± 0.1 | |
| Sum | 52.6 ± 10.9 a | 53.0 ± 7.6 a | 55.5 ± 10.6 b | 50.1 ± 6.9 a | |
| Total uptake
(from all sources) | Seed | 104.1 ± 37.8 | 99.8 ± 24.7 | 131.2 ± 17.5 | 72.9 ± 5.4 |
| Aboveground part | 47.4 ± 9.2 | 54.5 ± 7.1 | 55.7 ± 3.9 | 46.1 ± 9.8 | |
| Root | 2.7 ± 1.1 | 2.5 ± 0.8 | 3.4 ± 0.7 | 1.6 ± 0.3 | |
| Sum | 154.2 ± 44.0 a | 156.8 ± 29.1 a | 190.3 ± 15.7 b | 120.6 ± 9.7 a | |
a, b—means for investigated factors with different letters in the rows are significantly different, p < 0.05.
Table 9.
Amount of nitrogen taken up by pea (whole plant) from various sources per day during the period from sowing to harvest, kg N·ha−1.
Table 9.
Amount of nitrogen taken up by pea (whole plant) from various sources per day during the period from sowing to harvest, kg N·ha−1.
| N Source | Intervals between Growth Stages, (BBCH) | Meanly during
the Period from Sowing to Harvesting | |||||
|---|---|---|---|---|---|---|---|
| Sowing-14 | 14–33 | 33–55 | 55–65 | 65–75 | 75–90 | ||
| Ndfa (air) | 0.046 a | 0.833 b | 3.253 d | 1.895 c | 0.794 b | 0.128 a | 1.158 |
| Ndff (fertilizer) | 0.062 b | 0.333 d | 0.130 c | 0.134 c | 0.019 a | 0.011 a | 0.115 |
| Ndfs (soil) | 0.335 b | 0.882 d | 0.760 dc | 0.872 d | 0.697 c | 0.071 a | 0.603 |
| Total uptake | 0.443 a | 2.048 c | 4.143 e | 2.901 d | 1.510 b | 0.210 a | 1.876 |
a, b—means for investigated factors with different letters in the rows are significantly different, p < 0.05.
Table 10.
The amount of nitrogen removed from the field with seeds and introduced into the soil with crop residues of peas at BBCH stage 90, kg N·ha−1.
Table 10.
The amount of nitrogen removed from the field with seeds and introduced into the soil with crop residues of peas at BBCH stage 90, kg N·ha−1.
| Part of Plant | N Sources | Sum | ||
|---|---|---|---|---|
| Ndfa (Air) | Ndff (Fertilizer) | Ndfs (Soil) | ||
| Crop residues | 31.0 | 3.7 | 18.8 | 53.5 |
| Seeds | 61.1 | 6.9 | 34.0 | 102.0 |
| Sum | 92.1 | 10.6 | 52.8 | 155.5 |
Publisher’s Note: MDPI stays neutral with regard to jurisdictional claims in published maps and institutional affiliations. |
© 2021 by the authors. Licensee MDPI, Basel, Switzerland. This article is an open access article distributed under the terms and conditions of the Creative Commons Attribution (CC BY) license (http://creativecommons.org/licenses/by/4.0/).
Share and Cite
MDPI and ACS Style
Wysokinski, A.; Lozak, I. The Dynamic of Nitrogen Uptake from Different Sources by Pea (Pisum sativum L.). Agriculture 2021, 11, 81. https://0-doi-org.brum.beds.ac.uk/10.3390/agriculture11010081
AMA Style
Wysokinski A, Lozak I. The Dynamic of Nitrogen Uptake from Different Sources by Pea (Pisum sativum L.). Agriculture. 2021; 11(1):81. https://0-doi-org.brum.beds.ac.uk/10.3390/agriculture11010081
Chicago/Turabian StyleWysokinski, Andrzej, and Izabela Lozak. 2021. "The Dynamic of Nitrogen Uptake from Different Sources by Pea (Pisum sativum L.)" Agriculture 11, no. 1: 81. https://0-doi-org.brum.beds.ac.uk/10.3390/agriculture11010081
Note that from the first issue of 2016, this journal uses article numbers instead of page numbers. See further details here.