Article

Yield and Economic Results of Different Mechanical Pruning Strategies on “Navel Foyos” Oranges in the Mediterranean Area

1
Centro de Agroingeniería, Instituto Valenciano de Investigaciones Agrarias (IVIA), CV-315, km 10.7, 46113 Moncada (Valencia), Spain
2
Departamento de Ingeniería Rural y Agroalimentaria, Universitat Politècnica de València, Camino de Vera s/n, 46022 Valencia, Spain
*
Author to whom correspondence should be addressed.
Submission received: 2 December 2020 / Revised: 7 January 2021 / Accepted: 15 January 2021 / Published: 19 January 2021
(This article belongs to the Section Agricultural Systems and Management)

Abstract

:
Pruning is one of the most manpower-consuming agricultural operations in citrus production. Mechanical pruning can help to reduce pruning time and costs. In order to obtain the knowledge of its effects on the important orange variety “Navel Foyos”, several pruning strategies that include manual pruning and various intensities of mechanical pruning were tested for three years. The results showed that in “Navel Foyos” oranges, the mechanical pruning strategies did not affect the yield nor the size of the fruit in comparison with manual pruning. In conclusion, mechanical strategies are a potential alternative to manual pruning because they reduce the time necessary to prune and the pruning costs, thereby maintaining or even increasing the yield.

1. Introduction

Spain is the sixth largest world producer of citrus fruit and the biggest exporter of fresh citrus, representing over 50% of its production. The Spanish citrus area spans over 300,000 ha; over 50% of this surface is for the production of oranges, while 36% is for mandarins and 14% for lemons [1].
In recent years, the crop has experienced important economic problems because fruit prices have come to a standstill or even decreased while the production costs have risen continuously.
A reduction in production costs is necessary to guarantee the profitability of farmers as well as to compete with other countries where the production costs, mainly manpower costs, are lower because of the lower salaries [2]. Citrus pruning in Spain is done mainly by hand, and pruning plus biomass removal represents approximately 12% of the production costs [2,3].
Mechanical pruning in citrus started in the USA in the 1950s, demonstrating that this cost could be reduced by 30–50% without reducing fruit yield and quality [4]. In Spain, the first trials were conducted in the 1970s. In experiments performed in Valencia, the conclusions depended on the cultivar; a reduction of 17% in yield was observed with respect to mechanical over manual pruning in “Salustiana” oranges, while no differences in yield were found in “Washington Navel” oranges [5,6,7].
In the following decades, the interest in mechanical pruning decreased because the fruit prices were good, but in the current century, the economic problems of citrus production renewed the attention on this operation in order to reduce crop costs. Pruning experiments were performed in Murcia (Spain) in “Fortune” mandarins for this purpose [8]. No differences in yield were found between the manual pruning and the strategies that alternated manual and mechanical pruning over the years. In this last strategy, the years of mechanical pruning yield decreased, but the years of manual pruning yield increased, and therefore the total yield of the strategy was balanced. Only the strategy that involved the exclusive use of mechanical pruning over the years showed an accumulated yield reduction. Several experiments have shown that the reduction in production due to high-intensity pruning can be compensated by years with no pruning or less severe pruning [6,8,8,9,10,11,12,13,14].
The objective of this work was to study the effect of different strategies of pruning, involving different combinations of mechanical and/or manual pruning on the yield and the fruit size of “Navel Foyos” oranges (Citrus sinensis (L.) Osb.) in the Mediterranean area. Furthermore, the working capacity and the cost of the different pruning practices were determined.

2. Materials and Methods

2.1. Vegetal Material

Trials were carried out in a commercial “Navel Foyos” oranges (on Citrange Carrizo rootstock) orchard, located in Llíria (Valencia) (39°43′6″ N, 0°38′35″ W) and planted in 1999, with a planting pattern of 6 m between rows and 3.6 m along the rows (463 trees ha−1). Rows were formed on trapezoidal-shaped ridges.

2.2. Experimental Design

The experimental design consisted of a random block design with five repetitions, and the study included three consecutive years, starting in 2016. The factor of the study was the pruning strategy, and the following five strategies were studied: manual pruning (M); skirting, topping, and follow-up manual pruning of a complete tree (STFF); skirting, topping, and one-sided hedging, alternating annually between sides (STH); STH plus follow-up manual pruning of the nonhedged side (STHF); and skirting, topping and both-sided hedging (STHH). In all of the years, the same strategy was applied to the same trees (Table 1). Three consecutive trees were used per strategy and repetition, and the evaluations were performed in the central tree of each repetition.
The data of the pruning treatments and the Biologische Bundesanstalt, Bundessortenamt and Chemical industry (BBCH) citrus stage are shown in Table 2. The BBCH scale for citrus is a classification system used in biology to describe the phenological development of citrus plants.

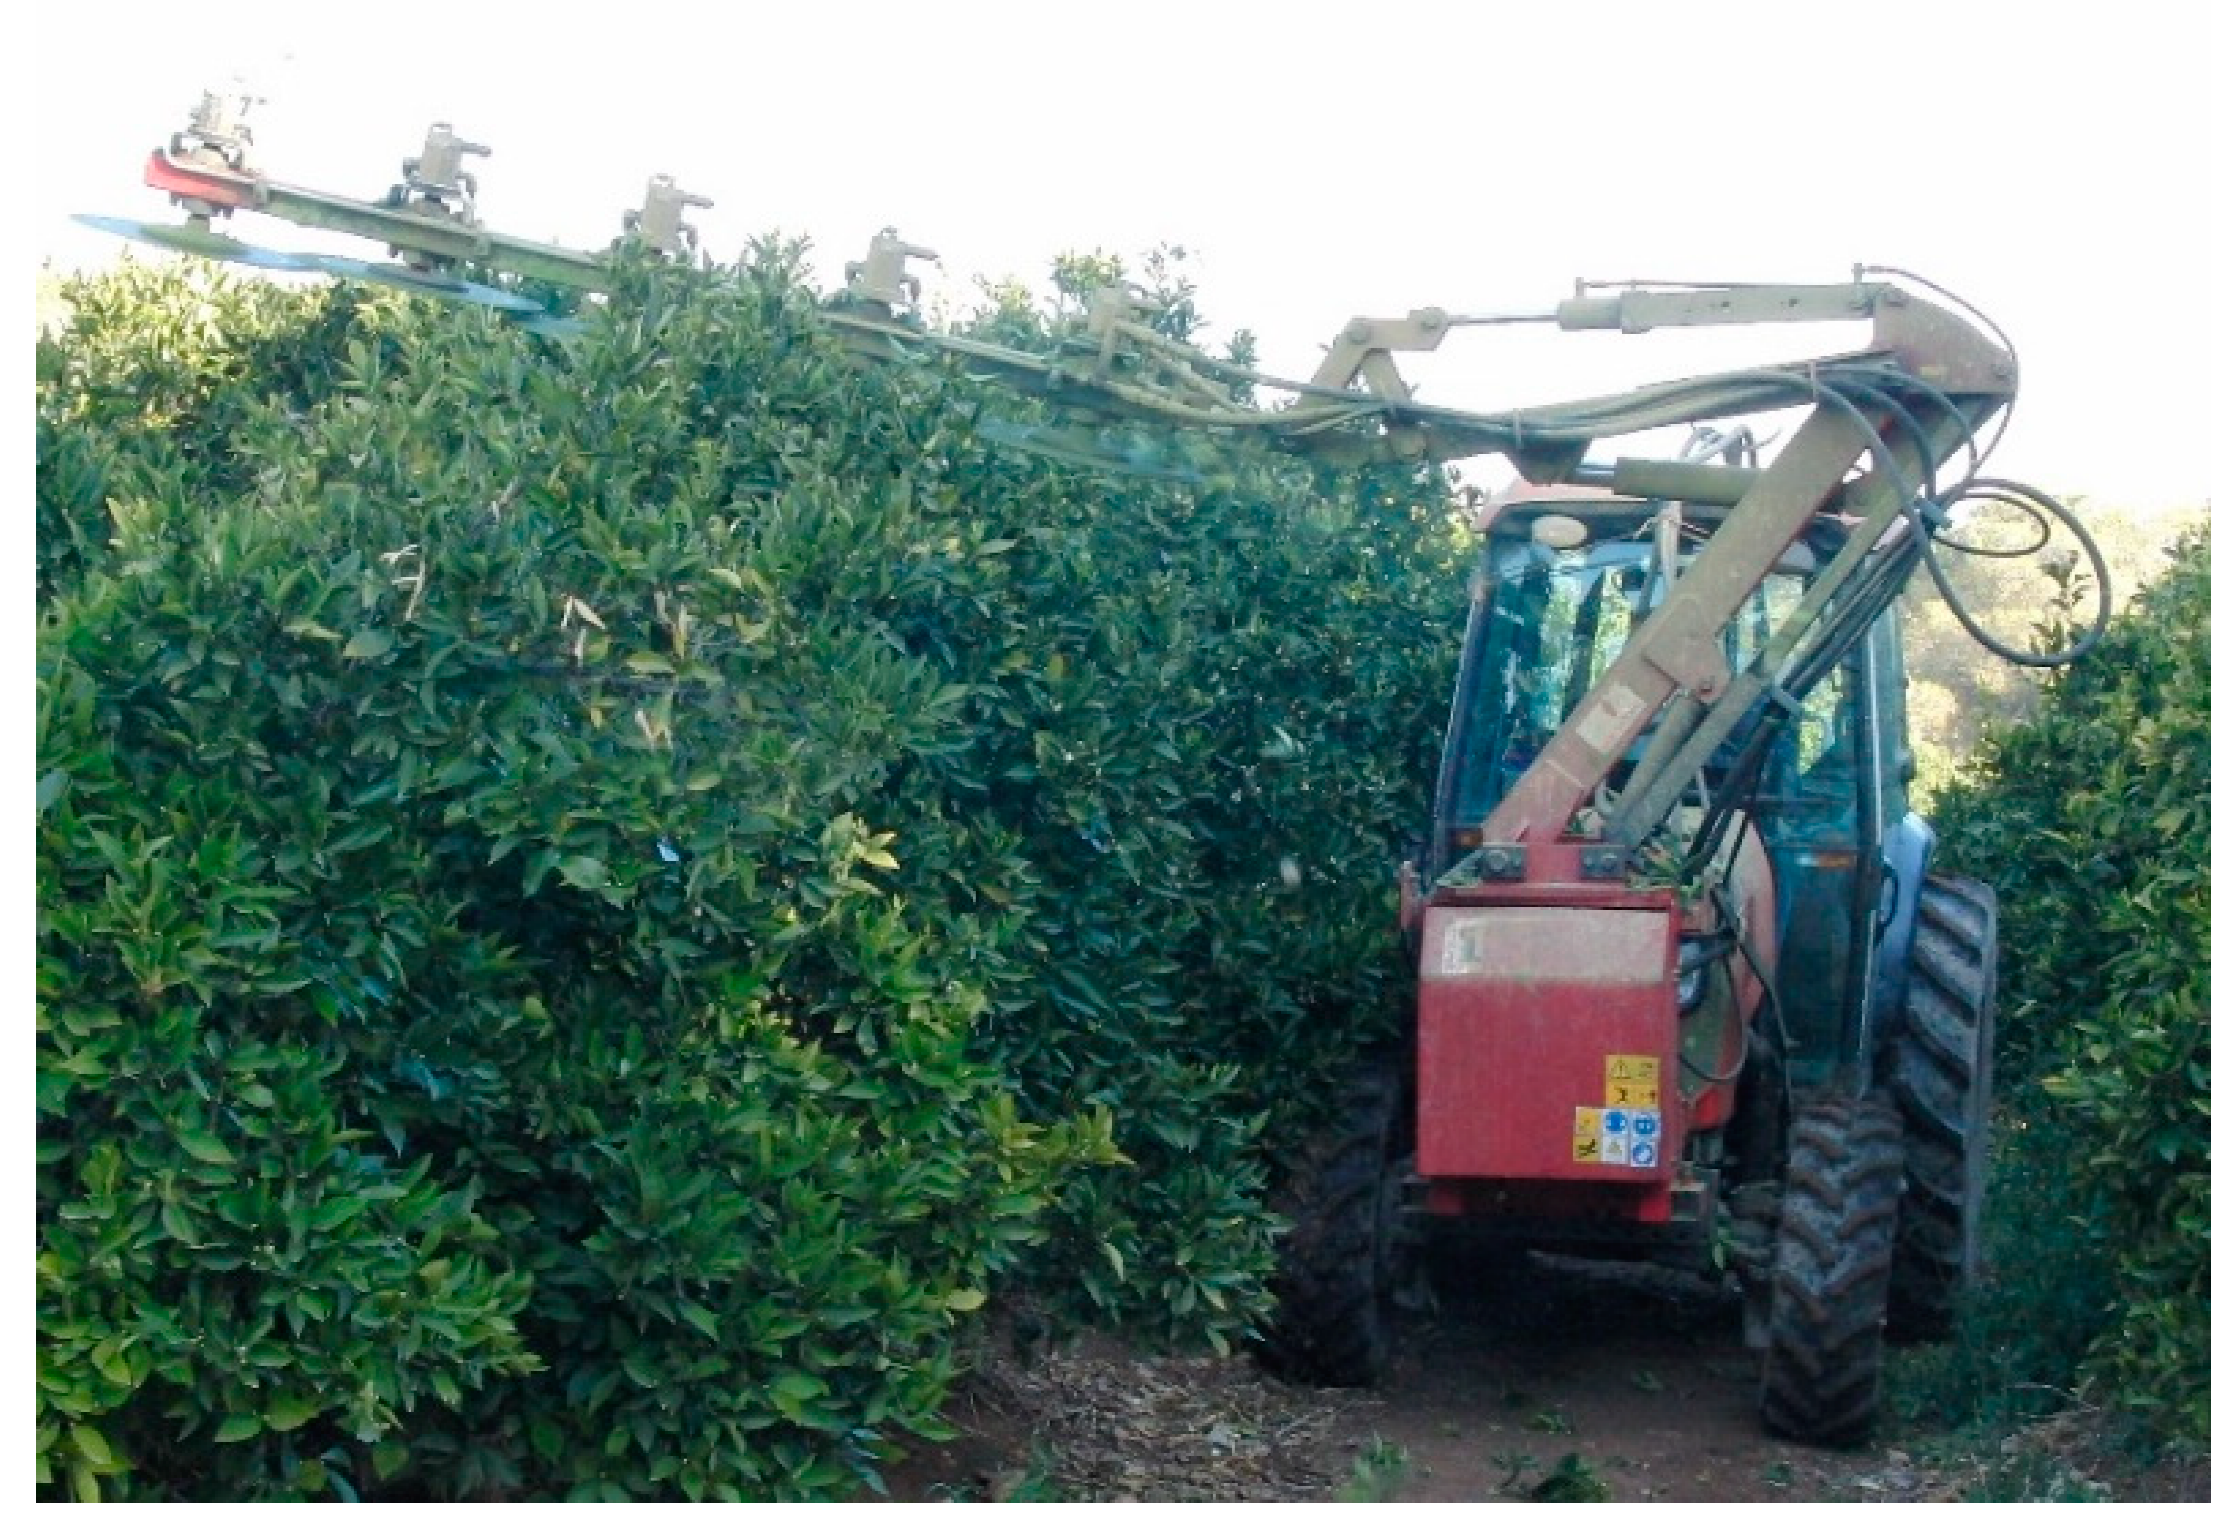
2.3. Pruning Machines

Manual pruning was done using handsaws and shears. For mechanical pruning, different machines were used depending on the type of cutting. Mechanical hedging and topping were performed with a pruner of a single arm provided with five cutting discs (model PFS pruner of Industrias David S.L.U.; Yecla, Murcia, Spain) mounted on a tractor, model M9540 of Kubota (71 kW) (Osaka, Japan) (Figure 1). Topping was done with two oblique cuttings, with an angle between 5 and 15° to the horizontal, one for each side of the crown, to cover the entire canopy top. Hedging consisted of vertically cutting, with a little inclination of 5° to the top part of the tree, the corresponding side of the tree, depending on the strategy and year. Skirting was done by horizontally cutting skirts with a petrol handheld trimmer, model HS-82R60 of Stihl (Waiblingen, Deutschland).

2.4. Assessments

2.4.1. Characterization of Pruned Biomass and Trees

In each season, pruned trees and biomass residues were characterized to determine the severity of the pruning tasks.
The percentage of the reduction in tree volume was calculated by measuring the size of the trees under study before and after pruning Not applicable, except in the first season (Table 2). The geometrical parameters measured were the canopy height (calculated by subtracting the distance between the ground and the skirt from the total tree height), the canopy diameter along the row, and the canopy diameter across the row. The canopy volume was calculated considering it as an ellipsoid and using the geometrical parameters. Taking into account the canopy volume before and after pruning, the percentage of the reduction by strategy was calculated.
Furthermore, after pruning, the pruned fresh biomass was characterized. In a minimum of 100 branches for each type of cutting (topping, hedging, skirting, and manual), the length (cm) and the diameter in the cutting area (mm) were measured. The quantity of fresh biomass removed with each strategy was measured (kg tree−1). For this, all of the cut branches of each type of cutting of the tree under study of each strategy and repetition were weighed with a digital dynamometer (Advanced Force Gauge 500 N, Mecmesin Ltd., England, UK). Finally, the total fresh biomass per tree and the strategy were calculated by adding the weights obtained in the different types of cuts included in each strategy. Moreover, in the laboratory, the percentage of moisture of the fresh biomass was measured. First, each fresh biomass sample was divided into leaves and wood, and the percentages of leaves and wood were calculated (%). Subsequently, the samples were placed in an oven at 65 °C for the time necessary until they reached a constant weight.

2.4.2. Pruning Effect on Citrus Production: Yield and Fruit Size

In order to evaluate the effect of the pruning strategy on citrus production, the yield and fruit diameter were determined at harvest time. For obtaining the yield (kg tree−1), all of the fruits of the sample tree of each repetition and strategy were collected and weighed. The outer equatorial diameter (mm) was measured in 50 fruits randomly selected per evaluation tree of each repetition and strategy.

2.4.3. Pruning Working Capacity and Costs

The theoretical working capacity (TWC; trees h−1) of each strategy was determined based on the productive time spent to prune a tree (min tree−1). The productive time spent in each operation was measured with a chronometer. This time was measured in a different way depending on if it was manual or mechanical pruning. In the case of manual pruning, pruning productive time was determined by measuring the time used to prune a single tree in the manual strategy and the time to carry out the manual follow up of a single tree in the cases of strategies that combined manual and mechanical pruning. The productive time spent per tree was multiplied by the number of operators involved in the operation to calculate the time needed by a single worker (min person tree−1). A minimum of five trees per strategy were considered.
In the case of mechanical pruning, the productive time used to make the different types of cuttings (skirting, topping, and hedging) was measured. Taking into account the number of trees in the known distance, the productive time corresponding to one tree was calculated. Once the productive time spent per type of cutting and tree was obtained, the productive time corresponding to each strategy was calculated by adding all of the productive times used in the different cuttings included in each strategy. Based on these values, the number of trees pruned per hour (tree h−1) with each strategy was calculated.
The cost of the pruning operation (€ ha−1), without considering delay times, for each strategy was determined based on the TWC using Equation (1):
Pruning   costs   ( ha ) =   C   ×   N TWC
where TWC is the theoretical working capacity (trees h−1), C is the hourly pruning cost (€ h−1), and N is the tree density (trees ha−1) (in this orchard: 463 trees ha−1).
The data of the hourly prices of the manual and mechanical pruning were obtained directly from the orchard technicians, and were 9.4 € h−1 for manual pruning and 45 € h−1 for mechanical pruning.

2.4.4. Economic Profit

The economic profit was evaluated by calculating the confidence interval of the net value (€ ha−1) for each strategy and year and for the three years together. For that, the net value per hectare was calculated with Equation (2):
Net value (€ ha−1) = Gross value (€ ha−1) − Pruning cost (€ ha−1)
where Pruning cost (€ ha−1) is the average of the pruning costs for the three years, and Gross value (€ ha−1) was calculated according to Equation (3):
Gross value (€ ha−1) = Yield (kg tree−1) × Oranges price (€ kg−1) × N (trees ha−1)
where Yield (kg tree−1) is the kilograms of oranges produced per tree; Orange prices refer to the mean prices of the citrus fruit in the harvesting dates for each year (Table 3) obtained from the official citrus price table [15]; N, the tree density of the orchard, was 463 trees ha−1.
Afterward, the confidence interval of the net value per strategy and year was calculated using Equation (4).
CI   net   value   ( ha )   =   A   net   value   ±   z   ×   s n
where A net value is the average of the net value per strategy (€ ha−1), z is the confidence level (95%) value, s is the standard deviation per strategy, and n is the number of elements in the sample.

2.5. Statistical Methods

Descriptive analysis for each pruning strategy per year was performed on the canopy dimensions before/after pruning as well as for the biomass characteristics and quantity, the pruning working capacity, and the costs. The confidence interval was calculated for the economic profit as explained in the previous section.
The effect of the pruning strategy and the year on the yield and fruit size were analyzed through multifactor analysis of variance (ANOVA). Tukey’s honestly significant difference (HSD) tests were used for mean comparisons. The assumption of the normal distribution of the data was assessed with the normal probability plot of the residues and the assumption of homoscedasticity with the Levene’s test. In all tests, a confidence level of 95% was considered.

3. Results

3.1. Characterization of Pruned Biomass and Canopy Dimensions

The canopy size before and after pruning and the percentage of the size reduction are shown in Table 4. The manual strategy produced the highest reduction of tree volume in the two assessment years: 36.41% in 2017 and 37.13% in 2018. The strategies, including mechanical pruning, reduced the tree volume between 19.93% and 33.43% in 2017 and between 14.20% and 30.68% in 2018. The tree height was reduced in a 46–53 cm range for both 2017 and 2018, regardless of the pruning strategy and the different starting heights, 2.31 m and 2.98 m, respectively. The diameter along and across the rows was reduced mainly in the strategies where manual pruning was done, which indicated that the mechanical hedging was performed with light intensity (Table 4).
The mean diameter and length of the cut branches by the type of cutting are shown in Table 5. As expected, the greatest difference of these parameters was between manual and mechanical hedging and topping because, while manual pruning cleans the interior of the canopy and opens windows to ease the penetration of light by removing internal branches, which are usually old and wide, mechanical pruning just limits the tree size by cutting external branches, which are usually younger and narrower.
In the same sense, the quantity of pruned biomass was higher (2–3 times, on average for the three years) in the strategies in which manual cutting was included compared to the strategies that included only mechanical pruning (Table 6). Moreover, it was possible to notice that strategies with mechanical plus manual follow-up pruning eliminated more biomass than pure manual pruning. The average percentage of moisture in the leaf biomass, which represented an average of 59.31% of the total biomass, was 66.14%, and the average percentage of moisture in the wood biomass, which represented an average of 40.69% of the total biomass, was 19.92%.

3.2. Pruning Effect on Citrus Production: Yield and Fruit Size

The interaction between the strategy of pruning and year on yield resulted as nonsignificant (F = 0.47; df = 8, 74; p = 0.8699), which means that in all of the years, the response of the yield to the pruning strategy was similar. The factor pruning strategy was not significant (F = 1.93; df = 4, 74; p = 0.1165); therefore, differences in yield between strategies were not found (Table 7). However, the effect of year on yield was significant (F = 4.92; df = 2, 74; p = 0.0105), with significant differences between the last two years, with 88.6 kg tree−1 and 108.3 kg tree−1 in 2017 and 2018, respectively.
Regarding the fruit size, the interaction between the pruning strategy and year was not significant (F = 0.67; df = 8, 74; p = 0.7180); therefore, in all of the years, the strategies affected the fruit size in a similar way. Moreover, the factor strategy was not significant (F = 0.69; df = 4, 74; p = 0.6012), which means that all of the pruning strategies produced fruits of similar sizes. However, as what happened for yield, the year resulted significant for the fruit size (F = 36.65; df = 2, 74; p < 0.0001), with significantly smaller fruits in 2018, with an equatorial diameter of 71.1 mm, followed by 2016 with 75.7 mm and 2017 with 79.1 mm (Table 8), the latter year characterized by the lowest yield.

3.3. Pruning Working Capacity and Costs

Manual pruning had the lowest working capacity (0.02 ha h−1) (Table 9). The use of mechanical pruning (skirting and topping) with follow-up manual pruning of full trees (Strategy 2) increased the working capacity slightly (0.03 ha h−1), followed by Strategy 4, where mechanical pruning (skirting, topping, and one-sided hedging) was followed up by manual pruning of half of the tree (0.04 ha h−1). The strategies that only included mechanical pruning considerably increased the working capacity with respect to those that included manual pruning (Table 9). The strategy that needed six passes of the mechanical pruner (Strategy 5, with two passes per type of cutting) increased the working capacity to 0.51 ha h−1. The strategy that needed five passes (Strategy 3, with two passes for both topping and skirting and one pass for hedging) increased the field capacity to 0.66 ha h−1.
Thus, mechanical pruning drastically reduced the time necessary for pruning, which allowed pruning a higher surface in a shorter period of time. Consequently, the operational costs also decreased (Table 9). The average pruning costs of the strategies fully mechanized (Strategies 3 and 5) required between one-sixth and one-seventh of the full manual pruning (Strategy 1). In the strategy where skirting, topping, and one-sided hedging were mechanically performed, with the other side manually pruned (Strategy 4), costs were reduced by 38.66% with respect to the total manual pruning, and in the strategy where only the skirting and the topping were mechanical but with follow-up manual pruning of the full tree (Strategy 2), the costs were reduced by 17% with respect to pure manual pruning.

3.4. Economic Profit

The confidence interval of the net value (€ ha−1) per strategy and year is shown in Table 10. All of the intervals overlapped, and therefore no differences in net value were found between strategies, even though the lowest values for each year and for the average of the three years were found in the manual strategy.

4. Discussion

In this study, with the variety of “Navel Foyos” oranges, no significant differences in yield and fruit size between manual and mechanical pruning strategies were found for the three years, despite the great differences in biomass removed by pruning. These results matched with those obtained for “Washington Navel” oranges, where the average yield for the four years in the manual pruning strategy, in the mechanical pruning strategy, and in the strategy with a mix of mechanical–manual pruning was similar [6,7]. Meanwhile, in lemon trees, no differences were found between mechanically and manually pruned trees [16,17]. However, in “Salustiana” oranges, there was a reduction of 17% in the yield of the trees pruned mechanically compared to the hand-pruned trees considering the average yield of the four years [6,7]. In “Fortune” mandarins, when only mechanical pruning was used during the three years, a 22% reduction in yield was observed with respect to the treatment involving just hand-pruning [8]. In “Clemenules” mandarin, the results of one year of pruning experience showed that the highest yields were obtained in the control treatment with no pruning, which coincides with the trials by Zaragoza et al. [6,7], and all strategies in which mechanical pruning was performed at topping had lower production. [18]. These results evidence the different behavior of the different species/varieties and highlight the importance of studying the response of the different varieties of this practice.
The effect of the year observed in the yield was due to the alternative bearing behavior of citrus fruit [19]. Recently, Mesejo et al. demonstrated that cutting the flowering shoots annually in half-length by means of mechanical pruning attenuates alternate bearing behavior in “Nadorcott” mandarin, increasing the cumulative yield by 25% with regard to unpruned trees during the four years of the trial [20]. Based on these results, in the “Navel Foyos” variety, a delaying the period of mechanical pruning practices when a year with higher production is expected could compensate for the alternate bearing behavior. However, because this variety is different from “Nadorcott,” more research is required.

5. Conclusions

The cost of mechanical pruning strategies was nearly a quarter of the cost of manual pruning; therefore, as there were no significant differences in yield and fruit size, this technique can be recommended for “Navel Foyos” grown under these production conditions. Furthermore, the range of the net value of some mechanical strategies showed higher benefits than manual pruning. This, together with the reduction of investment in this practice and the lower necessity of manpower, which is scarce in some periods, can facilitate the management of the crop for the grower. Furthermore, it has to be taken into account that mechanical pruning can open the space between the rows necessary for the passage of other machines and eases other practices such as phytosanitary treatments. It can also reduce the height of the crop, which could make harvesting operations easier.

Author Contributions

Conceptualization, P.C. and A.T.; data curation, A.F.; formal analysis, C.G. and C.O.; investigation, P.C., G.M., C.G., A.F., C.O. and A.T.; methodology, P.C., G.M. and C.G.; project administration, P.C.; writing—original draft, P.C. and A.T.; writing—review and editing, P.C., G.M., C.G., A.F. and C.O. All authors have read and agreed to the published version of the manuscript.

Funding

This research was funded by (1) the project “Application of new technologies for a comprehensive strategy of mechanized citrus harvesting (CITRUSREC)” funded by the Spanish National Institute for Agriculture and Food Research and Technology (INIA) and the Ministry of Economy, Industry and Competitiveness of Spain (project RTA2014-00025-C05-00), cofunded by the European Regional Development Fund (ERDF); (2) the project of the Operative Group “Technological advances for modernization and sustainability in citrus production. (GO CITRUSTECH)” cofunded by the Agricultural European of Rural Developing–EAFRD (80%) and the Ministry of Agriculture, Fisheries, and Food (20%); (3) the project “Engineering developments to ensure profitable, sustainable and competitive agriculture from farm to fork” cofinanced by the Valencian Institute of Agricultural Research (IVIA) and by the European Regional Development Fund (ERDF). G.M. was a beneficiary of a scholarship for training and specialization of the European Social Fund (ESF).

Data Availability Statement

The data presented in this study are available on request from the corresponding author.

Acknowledgments

The authors would like to thank Benjamín Torres for lending the experimental plot and for their collaboration. The authors also thank Iván Carrillo, Juan José Gil, Begoña Cebrián, and Ramón Salcedo from IVIA, as well as Florentino Juste, Montano Pérez, Juan José Peña, Ángel Pérez, and Diego Guerra from UPV, for their technical support.

Conflicts of Interest

The authors declare no conflict of interest.

References

  1. Ministerio de Agricultura, Alimentación y Medio Ambiente (MAGRAMA). Anuario de Estadística. Available online: https://www.mapa.gob.es/estadistica/pags/anuario/2019-Avance/CAPITULOS_TOTALES/AE19-C07.pdf (accessed on 5 June 2020). (In Spanish).
  2. Juste, F.; Martín, B.; Fabado, F.; Moltó, E. Estudio sobre la reducción de los costes de producción de cítricos mediante la mecanización de las prácticas de cultivo. Comunidad Valencia. Agrar 2000, 12, 23–29. (In Spanish) [Google Scholar]
  3. Mateu, G.; Caballero, P.; Torregrosa, A.; Segura, B.; Juste, F.; Chueca, P. Análisis de la influencia de las operaciones de cultivo sobre los costes de producción en la citricultura de la Comunidad Valenciana. Levante Agrícola Rev. Int. Cítricos 2018, 440, 60–64. (In Spanish) [Google Scholar]
  4. Moore, P.W. Mechanical pruning for citrus. Calif. Agric. 1958, 11, 7–13. [Google Scholar]
  5. Ortiz-Cañavate, J. Mechanical pruning of citrus. An. Inst. Nac. Investig. Agrar. Tecnol. Agrar. 1979, 5, 155–167. (In Spanish) [Google Scholar]
  6. Zaragoza, S.; Alonso, E. La poda mecanizada de los agrios en España. An. Inst. Nac. Investig. Agrar. Ser. Prod. Veg. 1980, 12, 157–180. (In Spanish) [Google Scholar]
  7. Zaragoza, S.; Alonso, E. Citrus pruning in Spain. Proc. Int. Soc. Citric. 1981, 1, 172–175. [Google Scholar]
  8. Martín-Górriz, B.; Porras Castillo, I.; Torregrosa, A. Effect of mechanical pruning on the yield and quality of ‘Fortune’ mandarins. Span. J. Agric. Res. 2014, 12, 952–959. [Google Scholar] [CrossRef]
  9. Fallahi, E.; Kilby, M. Rootstock and pruning influence on yield and fruit quality of ‘Lisbon’ lemon. Fruit Var. J. 1997, 51, 242–246. [Google Scholar]
  10. Kallsen, C.E. Topping and manual pruning effects on the production of commercially valuable fruit in a midseason Navel Orange variety. HorTecnology 2005, 15, 335–341. [Google Scholar] [CrossRef]
  11. Rouse, B.; Parsons, L.; Wheaton, T.A. Hedging, topping and skirting trees in the citrus canker era. Citrus Ind. 2006, 12, 1–2. [Google Scholar]
  12. Sauls, J.W. Citrus Pruning. Texas Citrus and Subtropical Fruits. 2008. Available online: http://aggie-horticulture.tamu.edu/citrus/pruning/L2308.htm (accessed on 16 March 2020).
  13. Mendonça, V.; Ramos, J.D.; Neto, S.E.A.; Rufini, J.C.M. Production of ‘Poncan’ tangerine tree after pruning recovery. Cienc. Agrotecnol. 2008, 32, 103–109. [Google Scholar] [CrossRef] [Green Version]
  14. Yildirim, B.; Yesiloglu, T.; Incesu, M.; Kamiloglu, M.; Ozguven, F.; Tuzcu, O.; Aka, Y. The effects of mechanical pruning on fruit yield and quality in ‘Star Ruby’ grapefruit. J. Food Agric. Environ. 2010, 8, 834–838. [Google Scholar]
  15. Cámara de Valencia. 2020. Lonja de Cítricos. Información de la Mesa de Precios de Cítricos del Consulado de la Lonja de Valencia. Available online: http://www.precioscitricos.com/indexp.asp (accessed on 12 August 2020). (In Spanish).
  16. Martín-Górriz, B.; Torregrosa, A.; Martínez Barba, C. Tres años de ensayos de poda mecánica y manual en limonero ‘Fino 95’. In Proceedings of the X Congreso Ibérico de Agroingeniería, Huesca, Spain, 3–6 September 2019; p. 10. (In Spanish). [Google Scholar]
  17. Martín-Górriz, B.; Martínez-Barba, C.; Torregrosa, A. Lemon trees response to different long-term mechanical and manual pruning practices. Sci. Hortic. 2021, 275, 109700. [Google Scholar] [CrossRef]
  18. Mateu, G.; Torregrosa, A.; Chueca, P. Analysis of different mechanical pruning strategies on the production of ‘Clemenules’ mandarin and its costs. In Proceedings of the European Conference on Agricultural Engineering AgEng2018, Wageningen, The Netherlands, 8–12 July 2018; p. 8. [Google Scholar]
  19. Monselise, S.P.; Goldschmidt, E.E. Alternate bearing in fruit trees. Am. Soc. Hortic. Sci. 1982, 4, 128–173. [Google Scholar]
  20. Mesejo, C.; Martínez-Fuentesa, A.; Reiga, C.; Balasch, S.; Primo-Millo, E.; Agustí, A. Mechanical pruning attenuates alternate bearing in ‘Nadorcott’ mandarin. Sci. Hortic. 2020, 261, 108993. [Google Scholar] [CrossRef]
Figure 1. The tractor disc pruner used in the trials.
Agriculture 11 00082 g001
Table 1. Intervention sequences by pruning strategy.
Pruning StrategiesYear 1Year 2Year 3
1M Agriculture 11 00082 i001 Agriculture 11 00082 i001 Agriculture 11 00082 i001
2STFF Agriculture 11 00082 i002 Agriculture 11 00082 i002 Agriculture 11 00082 i002
3STH Agriculture 11 00082 i003 Agriculture 11 00082 i004 Agriculture 11 00082 i003
4STHF Agriculture 11 00082 i005 Agriculture 11 00082 i006 Agriculture 11 00082 i005
5STHH Agriculture 11 00082 i007 Agriculture 11 00082 i007 Agriculture 11 00082 i007
Agriculture 11 00082 i008Manual pruning
Mechanical pruning
Agriculture 11 00082 i009
M, manual pruning; STFF, skirting, topping, and follow-up manual pruning of a complete tree; STH, skirting, topping, and one-sided hedging; STHF, STH plus follow-up manual pruning of the nonhedged side; STHH, skirting, topping, and both-side hedging.
Table 2. Dates of the canopy dimension measurements before and after pruning and dates of the pruning and Biologische Bundesanstalt, Bundessortenamt and Chemical industry (BBCH) citrus developmental stage.
YearMeasurement before PruningPruningBBCHMeasurement after PruningDays after Pruning
2016-9–16 March57–60--
201721 February23 February1028 February5
201812 March13–14 March55–5628 March15
Table 3. Average prices of citrus fruit “Navel Foyos” at the corresponding harvesting dates for each trial season in Valencia [15].
Harvesting Date€ kg−1 (On Tree)
30 December 20160.14
3 January 20180.22
18 January 20190.16
Table 4. Characterization of the canopy size before and after pruning and the percentage of reduction.
YearStrategyBefore PruningAfter PruningPercentage of Reduction
H
(m)
Øc
(m)
Øl
(m)
Canopy Volume
(m3 Tree−1)
H
(m)
Øc
(m)
Øl
(m)
Canopy Volume
(m3 Tree−1)
HØcØlCanopy Volume
20171 M2.48 (0.04)4.22 (0.12)3.02 (0.14)16.62 (1.52)2.10 (0.12)3.63 (0.24)2.63 (0.13)10.57 (1.21)15.4413.8312.7136.41
2 STFF2.37 (0.15)3.95 (0.18)2.67 (0.12)13.03 (1.02)1.77 (0.03)3.90 (0.10)2.60 (0.06)9.38 (0.34)25.351.272.5028.02
3 STH2.15 (0.06)3.85 (0.16)2.83 (0.12)12.33 (1.17)1.72 (0.07)3.33 (0.09)2.73 (0.13)8.21 (0.69)20.1613.423.5333.43
4 STHF2.35 (0.05)3.98 (0.08)2.70 (0.23)13.28 (1.48)1.77 (0.07)3.73 (0.07)2.67 (0.20)9.30 (1.21)24.826.281.2329.99
5 STHH2.18 (0.08)4.13 (0.19)2.92 (0.02)13.76 (0.55)1.92 (0.14)3.77 (0.12)2.92 (0.02)11.02 (0.81)12.218.870.0019.93
Average2.31 (0.06)4.03 (0.07)2.83 (0.07)13.80 (0.74)1.85 (0.07)3.62 (0.10)2.71 (0.06)9.69 (0.50)19.60 (2.57)8.73 (2.34)3.99 (2.26)29.56 (2.80)
20181 M3.05 (0.09)4.38 (0.15)2.56 (0.16)17.96 (1.49)2.50 (0.16)3.70 (0.12)2.32 (0.15)11.29 (1.09)18.2715.439.2237.13
2 STFF2.88 (0.17)4.19 (0.34)2.97 (0.29)18.67 (2.41)2.32 (0.04)4.13 (0.29)2.60 (0.15)12.94 (0.23)19.241.5912.3630.68
3 STH2.95 (0.07)3.83 (0.03)2.73 (0.07)16.19 (0.31)2.39 (0.01)3.83 (0.03)2.63 (0.09)12.65 (0.46)18.960.003.6621.85
4 STHF2.88 (0.18)3.83 (0.15)2.60 (0.12)14.97 (0.65)2.50 (0.14)3.83 (0.15)2.57 (0.09)12.84 (0.86)13.410.001.2814.20
5 STHH3.15 (0.31)3.87 (0.12)2.57 (0.09)16.35 (1.63)2.56 (0.06)3.80 (0.15)2.43 (0.15)12.38 (0.82)18.821.725.1924.32
Average2.98 (0.05)4.02 (0.11)2.69 (0.15)16.83 (1.11)2.45 (0.11)3.86 (0.08)2.51 (0.12)12.42 (0.38)17.74 (3.09)3.75 (2.41)6.34 (1.93)25.64 (4.95)
Data are expressed as means, with standard errors in parentheses. H = canopy height; Øc = canopy across-row diameter; Øl = canopy along-row diameter.
Table 5. Mean (standard error) diameter of the cutting area (Ø) and the length (L) of cut branches by the type of cutting.
Type of Cutting201620172018Average
Øbranches (mm)Lbranches (cm)Øbranches (mm)Lbranches (cm)Øbranches (mm)Lbranches (cm)Øbranches (mm)Lbranches (cm)
Skirting4.59 (0.14)29.91 (0.77)--4.37 (0.15)29.50 (1.06)4.48 (0.11)29.71 (0.21)
Hedging4.55 (0.15)28.87 (0.72)7.32 (0.19)37.22 (0.83)5.09 (0.31)43.96 (2.34)5.65 (0.85)36.68 (4.37)
Topping6.00 (0.18)28.82 (0.83)9.82 (0.21)52.53 (1.70)3.56 (0.26)32.62 (1.69)6.46 (1.82)37.99 (7.35)
Manual16.34 (0.44)87.36 (1.91)11.27 (0.16)88.90 (1.24)6.55 (0.51)76.20 (3.43)11.39 (2.83)84.15 (4.00)
Table 6. Mean (standard error) values of pruned fresh biomass by pruning strategy.
StrategyPruned Fresh Biomass (kg Tree−1)
201620172018Average
1 M18.87 (2.83)11.44 (1.77)5.66 (1.02)11.99 (3.83)
2 STFF21.63 (2.55)6.75 (0.98)19.74 (1.86)16.04 (4.68)
3 STH5.56 (0.29)3.18 (0.17)8.98 (0.29)5.91 (1.69)
4 STHF13.77 (1.10)10.26 (1.47)18.34 (2.00)14.12 (2.34)
5 STHH6.36 (0.59)5.80 (0.75)11.00 (0.62)7.72 (1.65)
Table 7. Yield (kg tree−1) for each strategy and year, ordered by the increasing 3-year average yield 1.
StrategyYield (kg Tree−1)
201620172018Average
1 M98 (13) a83 (14) a100 (8) a94 (7) a
3 STH95 (14) a84 (9) a111 (11) a97 (7) a
4 STHF94 (8) a91 (17) a105 (7) a97 (6) a
5 STHH116 (12) a79 (9) a104 (7) a100 (7) a
2 STFF116 (9) a106 (6) a122 (6) a115 (4) a
Average103.8 (4) AB88.6 (5) A108.3 (3) B97.3 (3)
Data are expressed as means, with standard errors in parentheses. 1 The same lowercase letters in a column means that there were no significant differences in the yield (p < 0.05) according to Tukey’s multiple range test between strategies. The same uppercase letter in the row means that there were no significant differences in the yield (p < 0.05) according to Tukey’s multiple range test between years.
Table 8. Fruit size (equatorial diameter, mm) for each strategy and year, ordered by the increasing 3-year average size 1.
StrategyFruit Size (Equatorial Diameter, mm)
201620172018Average
5 STHH75.6 (1.4) a76.7 (1.2) a70.9 (0.9) a74.4 (1.3) a
3 STH75.6 (1.5) a78.4 (2.6) a71.2 (1.2) a75.1 (0.9) a
2 STFF75.4 (0.4) a78.5 (1.8) a72.0 (0.8) a75.3 (0.9) a
1 M76.2 (0.5) a79.8 (2.1) a70.2 (0.2) a75.4 (1.2) a
4 STHF76.0 (1.7) a82.1 (2.6) a71.1 (0.7) a76.4 (1.5) a
Average75.7 (0.5) B79.1 (0.9) A71.1 (0.4) C74.6 (0.5)
Data are expressed as means, with standard errors in parentheses. 1 The same lowercase letter in a column means that there were no significant differences in fruit size (p < 0.05) according to Tukey’s multiple range test between strategies. The same uppercase letter in the row means that there were no significant differences in fruit size (p < 0.05) according to Tukey’s multiple range test between years.
Table 9. Time spent to prune a tree (min/tree and operator), pruning theoretical working capacities (TWC 1, ha h−1 and operator), and cost 2 (€ ha−1) for each strategy and year.
Strategy201620172018Average
TimeTWCCostTimeTWCCostTimeTWCCostTimeTWCCost
(min Tree−1 Operator−1)(ha h−1 Operator−1)(€ ha−1)(min Tree−1 Operator−1)(ha h−1 Operator−1)(€ ha−1)(min Tree−1 Operator−1)(ha h−1 Operator)(€ ha−1)(min Tree−1 Operator−1)(ha h−1 Operator−1)(€ ha−1)
1 M6.770.02490.757.550.02547.576.480.02470.046.930.02502.79
2 STFF6.310.02499.074.100.03343.785.200.02407.175.200.03416.67
3 STH0.230.5779.290.220.5976.400.160.8155.560.200.6670.41
4 STHF3.300.04301.734.110.03358.803.040.04264.713.480.04308.42
5 STHH0.310.42106.490.270.4893.760.210.6272.920.260.5191.06
1 Density 463 trees ha−1. 2 Manual pruning at 9.4 € h−1, mechanical pruning at 45 € h−1.
Table 10. Net value (€ ha−1) (95% confidence interval) for each year and the average of the three years.
StrategyNet Value (€ ha−1)
201620172018Average
1 M4210–74905185–10,6625717–80595748–8026
2 STFF5900–82819268–11,4687736–95717797–9611
3 STH4309–78736690–10,3406478–97826488–8670
4 STHF4837–67665636–12,3026508–84086109–8710
5 STHH5935–89036237–96546524–86746873–8436
Publisher’s Note: MDPI stays neutral with regard to jurisdictional claims in published maps and institutional affiliations.

