Article

A Comparison of IPCC Guidelines and Allocation Methods to Estimate the Environmental Impact of Barley Production in the Basque Country through Life Cycle Assessment (LCA)

NEIKER-Basque Institute for Agricultural Research and Development, Basque Research and Technology Alliance (BRTA), Parque Científico y Tecnológico de Bizkaia, P812, 48160 Derio, Spain
*
Author to whom correspondence should be addressed.
Submission received: 18 September 2021 / Revised: 5 October 2021 / Accepted: 6 October 2021 / Published: 14 October 2021
(This article belongs to the Special Issue Effects of Fertilizer and Irrigation on Crop Production)

Abstract

:
This study aimed to estimate the environmental impact of barley production in the Basque Country, Northern Spain, using cradle-to-gate life cycle assessment (LCA) methodology, as well as to assess how methodological choices (i.e., the use of IPCC 2019 Guidelines versus allocation methods) can influence such estimation. The production of mineral fertiliser and the direct emissions of nitrous oxide (N2O) resulting from the application of nitrogen (N) fertiliser were identified as the two main contributors (40% and 30% of all greenhouse gas emissions, respectively) to the environmental impact of barley production. Pertaining to GHG emissions themselves, the use of calcium ammonium nitrate fertiliser was found to be the main contributor. Therefore, the optimization of N fertiliser application was established as a key process to reduce the environmental impact of barley production. The fertiliser-related release of N and phosphorous (P) to the environment was the main contributor to particulate matter formation, terrestrial acidification, and terrestrial and marine eutrophication. The incorporation of environmental data on NH3, NOx, NO3, and PO43− to the LCA led to a more accurate estimation of barley production impact. A sensitivity analysis showed that the use of economic allocation, compared to mass allocation, increased the estimation of climate change-related impact by 80%. In turn, the application of the IPCC 2019 Refinement Guidelines increased this estimation by a factor of 1.12 and 0.86 in wet regions and decreased in dry regions, respectively. Our results emphasise the importance of the choice of methodology, adapted to the specific case under study, when estimating the environmental impact of food production systems.

1. Introduction

In the Basque Country (Northern Spain), barley (Hordeum vulgare L.) production makes up a large portion of the agricultural land use. Barley is a commonly cultivated feed and food crop, which is widely adaptable to unfavourable climate conditions and superior as a raw material for the malt and beer industries. Barley is the 12th most important agricultural product in the world, with Europe being the largest producer (60.2%) [1]. In Spain, according to recent Eurostat data, the annual production of barley is approximately 6.7 and 3.6 million tons of grain and straw, respectively [2]. In the Basque Country, barley production is located in the southern province of Araba/Álava, with an area of nearly 14,000 hectares and an annual production of 59,200 to 95,800 tonnes in the five-year period of 2015–2019 [3], making this region the largest producer of malting barley in Spain (10% of national production).
The estimation and assessment of the environmental impact of agricultural practices and systems is key to promote the sustainability of the agricultural sector. Understanding the magnitude of the potential environmental impact derived from food production activities and, in particular, the different options and strategies to minimise this impact is a major challenge to achieve sustainable and productive agricultural systems that can meet global food demand. Agriculture can certainly cause a wide variety of adverse environmental effects (e.g., land and soil degradation, eutrophication, contamination, climate change, loss of biodiversity, landscape impoverishment, etc.) due to their dependence on several inputs, such as land, fertilisers, pesticides, water, fossil fuels, machinery, and so on [4].
Life cycle assessment (LCA) is a most suitable methodology for assessing the potential environmental impact and resource consumption associated with a given production system [5]. As a decision support tool, LCA can be a key instrument to estimate and/or quantify the environmental impact of agricultural production [6,7,8]. Life cycle assessment has been applied to assess the environmental impact of cereal production [4] and, in particular, barley production [7,8,9,10,11,12,13]. However, the results of LCA are highly dependent on the methodological assumptions, such as the functional unit and the allocation criteria, and are therefore not directly comparable and translatable. On the other hand, the allocation of environmental burdens is a well-known methodological issue in LCA [14]. Relevantly, according to a sensitivity analysis, the application of mass allocation for LCA, compared to economic allocation, estimated a lower environmental impact for cereal production in Italy [4].
Furthermore, the application of non-specific N2O emission factors can lead to different LCA outputs, as N2O plays a major role in agricultural LCA. In this respect, when performing an LCA of wheat production, the estimations of greenhouse gas (GHG) emissions were reduced by almost 40% when using regional-specific emission factors for N2O emissions instead of the Intergovernmental Panel on Climate Change (IPCC) default values [15]. Recently, the IPCC launched the 2019 Refinement to the 2006 IPCC Guidelines for National Greenhouse Gas Inventories [16]. Its key development was the disaggregation of the emission factors for direct and indirect soil N2O emissions from the climate and by the mineral fertiliser type.
The aim of this study was to evaluate the environmental impact of barley production in the Basque Country through life cycle assessment and, most importantly, to determine the influence of methodological choices (i.e., allocation method, IPCC Guidelines) on the results of this evaluation. We hypothesised that the selected methodological approaches and assumptions can considerably influence LCA output data and, hence, its conclusions. The ultimate goal of this research is to provide farmers, land planners, policy makers, etc., with the best available information regarding the potential environmental impact of barley production, through a better understanding of the LCA-based decision-making process.

2. Materials and Methods

The LCA methodology implemented in SimaPro 9.1.1.1 software was chosen to perform the abovementioned environmental analysis, according to the principles described in the corresponding ISO standards and considering the following four phases: (i) goal and scope definition; (ii) life cycle inventory (LCI); (iii) life cycle impact assessment (LCIA); and (iv) life cycle interpretation. Finally, a sensitivity analysis was carried out to determine the robustness of our LCA results and their sensitivity to uncertainty factors and to identify the most important set of model parameters to determine whether the data quality needs to be improved, and to enhance interpretation of results.

2.1. Goal and Scope Definition

This study was conducted to assess the environmental impact of barley production in the province of Araba/Álava, Basque Country, Northern Spain. In this respect, we aimed to compare the estimated environmental impact resulting from the application of different allocation methods (i.e., mass allocation vs. economic allocation) and the IPCC Guidelines (the IPCC 2006 Guidelines vs. the 2019 Refinement to the 2006 IPCC Guidelines, hereinafter called IPCC 2019) [16,17].
The results of this study are of interest to all those interested in the identification of the most important contributors (“critical hotspots”) regarding the environmental sustainability of agricultural food production systems and, specifically, barley production.

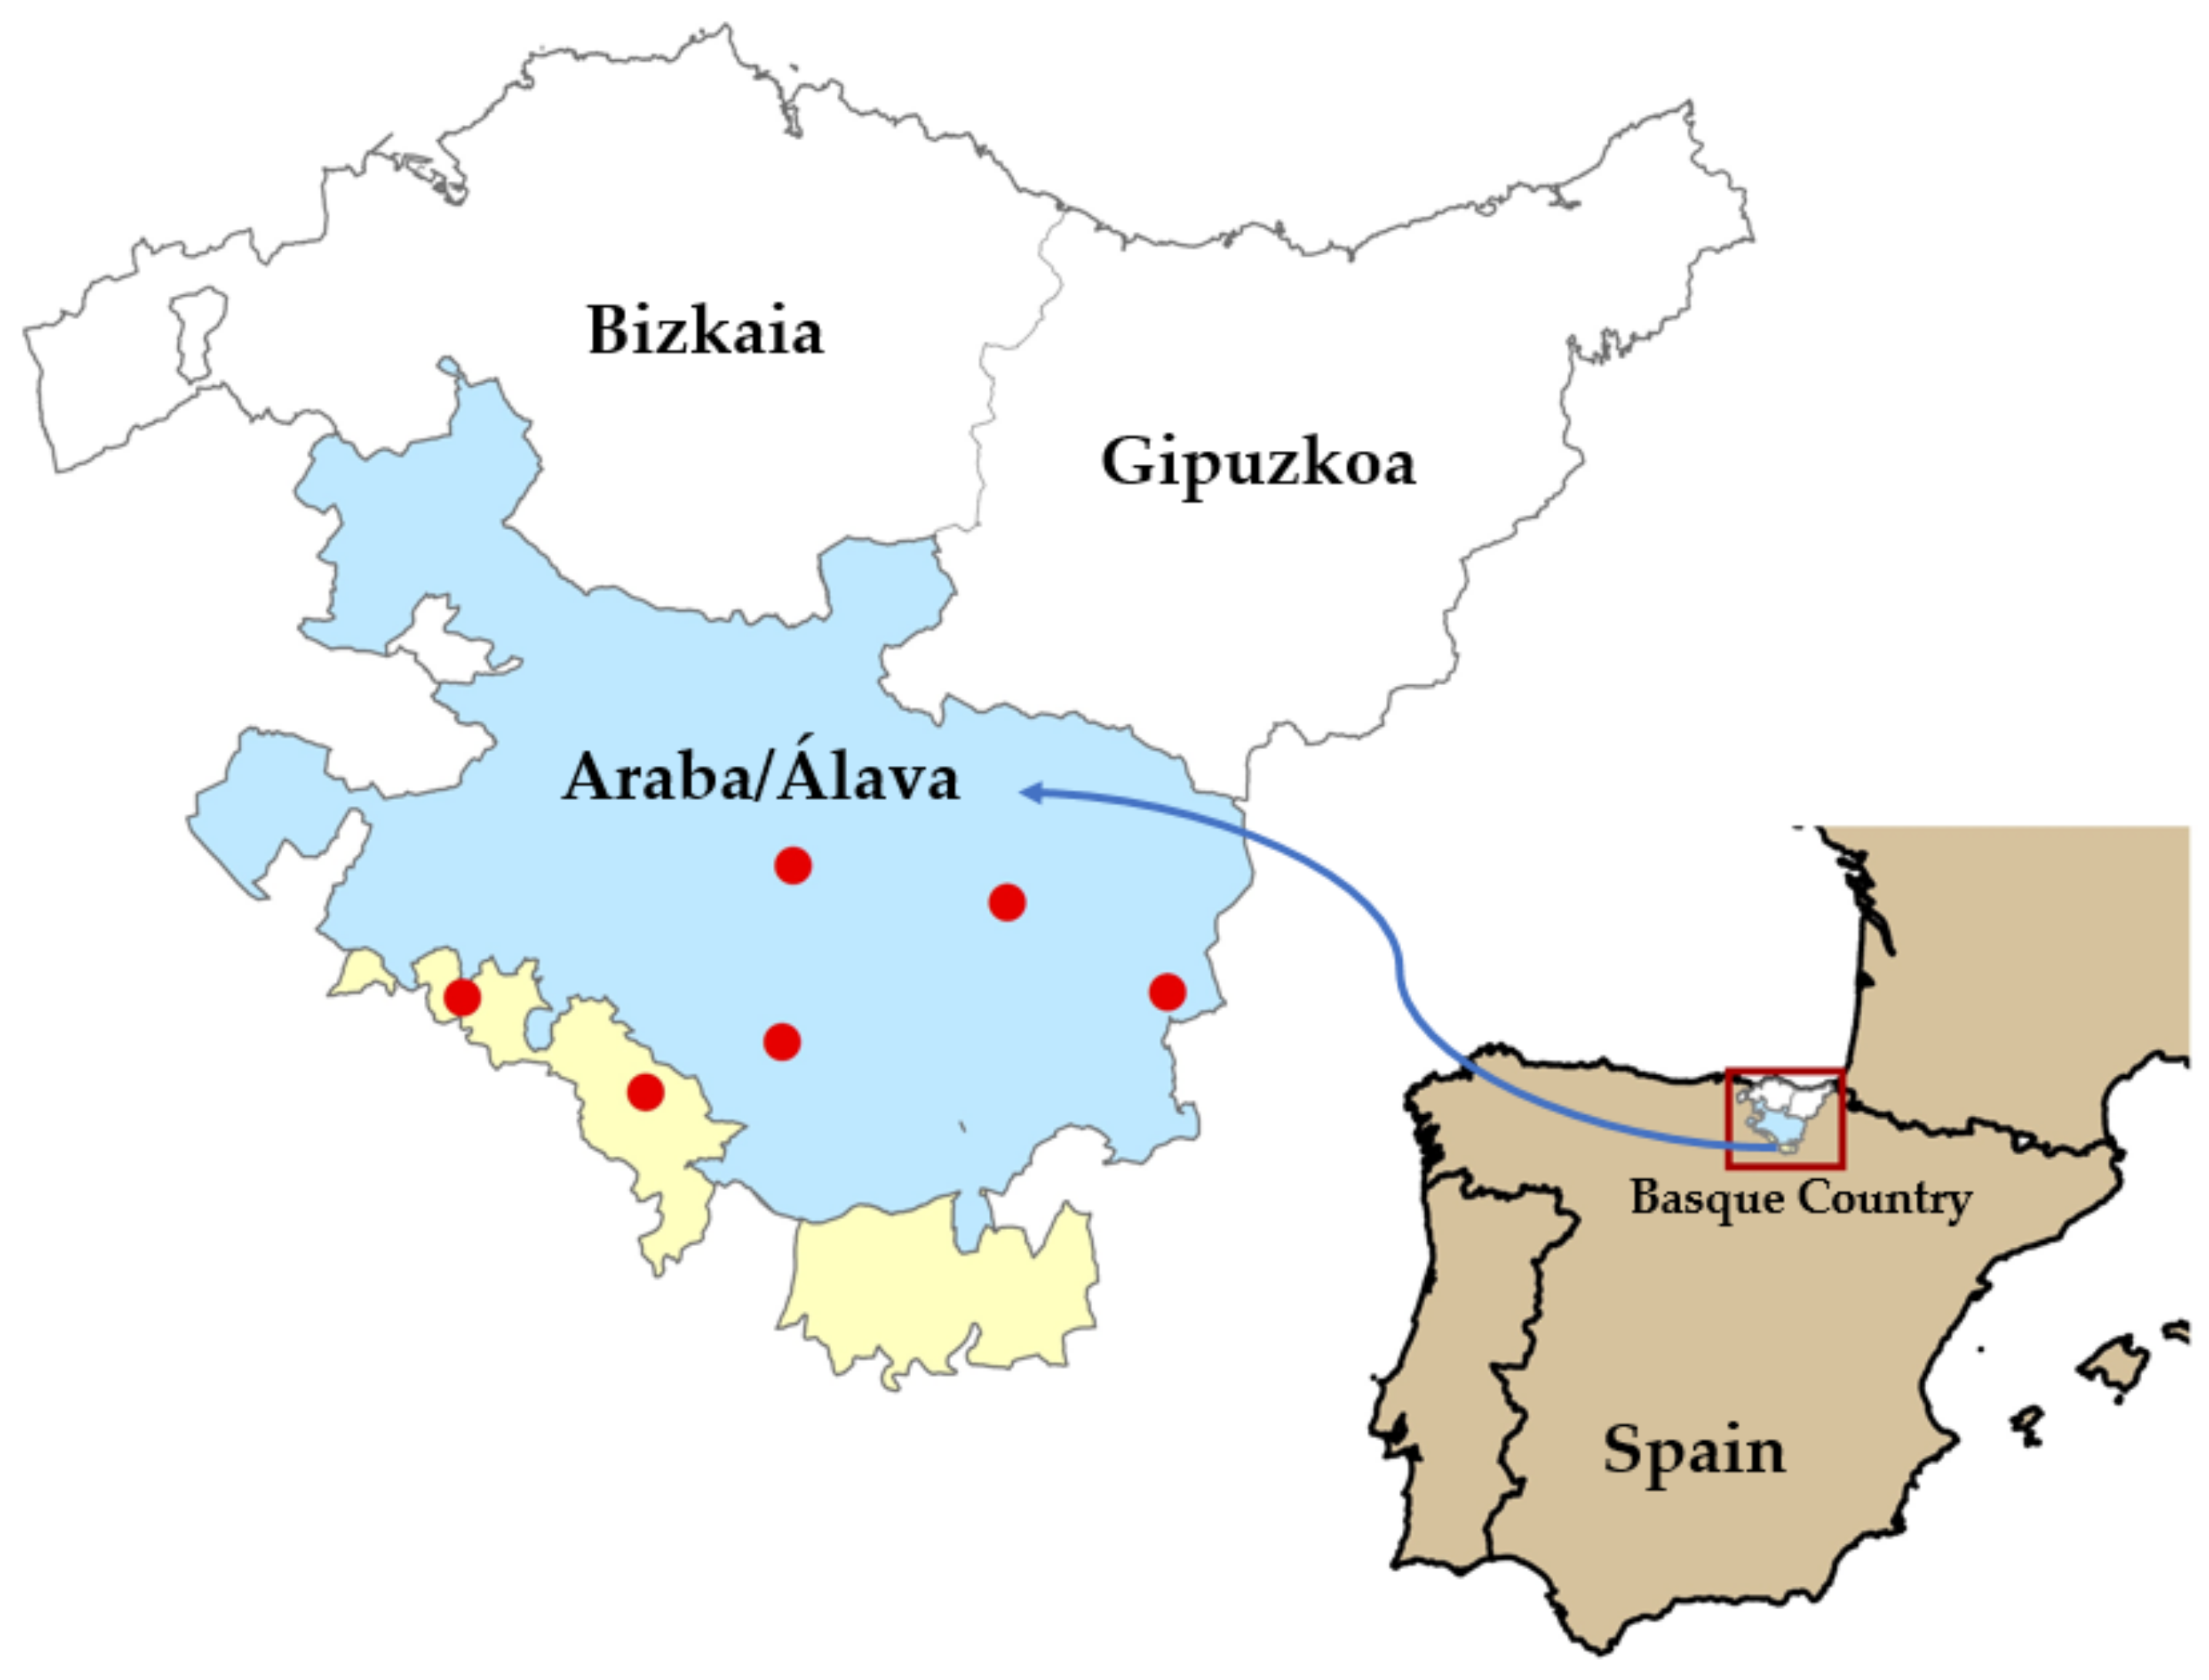
2.2. Characteristics of the Study Area

The climate and soil conditions in the province of Araba/Álava are highly favourable for cereal cultivation (wheat, maize, rye, oat, and barley). In the five-year period of 2015–2019, an average of 13,900 ha was dedicated to barley cultivation, with an average yield of 5350 kg ha−1 (ranging from 4200 to 7000 kg ha−1).
The climate in the province of Araba/Álava is characterised by an average temperature of 11.6 °C (ranging from 10.2 °C to 13.2 °C). Peak temperatures are recorded during the summer. Rainfall averages 674 mm, ranging from 626 mm to 733 mm. The highest rainfall occurs in the autumn and winter seasons.
Taking into account the climatic data, at the municipality level, provided by SIGA (Agrarian Geographic Information System, Spanish Government) [15], as well as the IPCC 2019 guideline (i.e., wet climate (W) = ratio of annual precipitation to potential evapotranspiration >1; dry climate (D) = ratio of annual precipitation to potential evapotranspiration <1), the province of Araba/Álava can be disaggregated into two different climatic regions, wet (W) and dry (D), as shown in Figure 1.

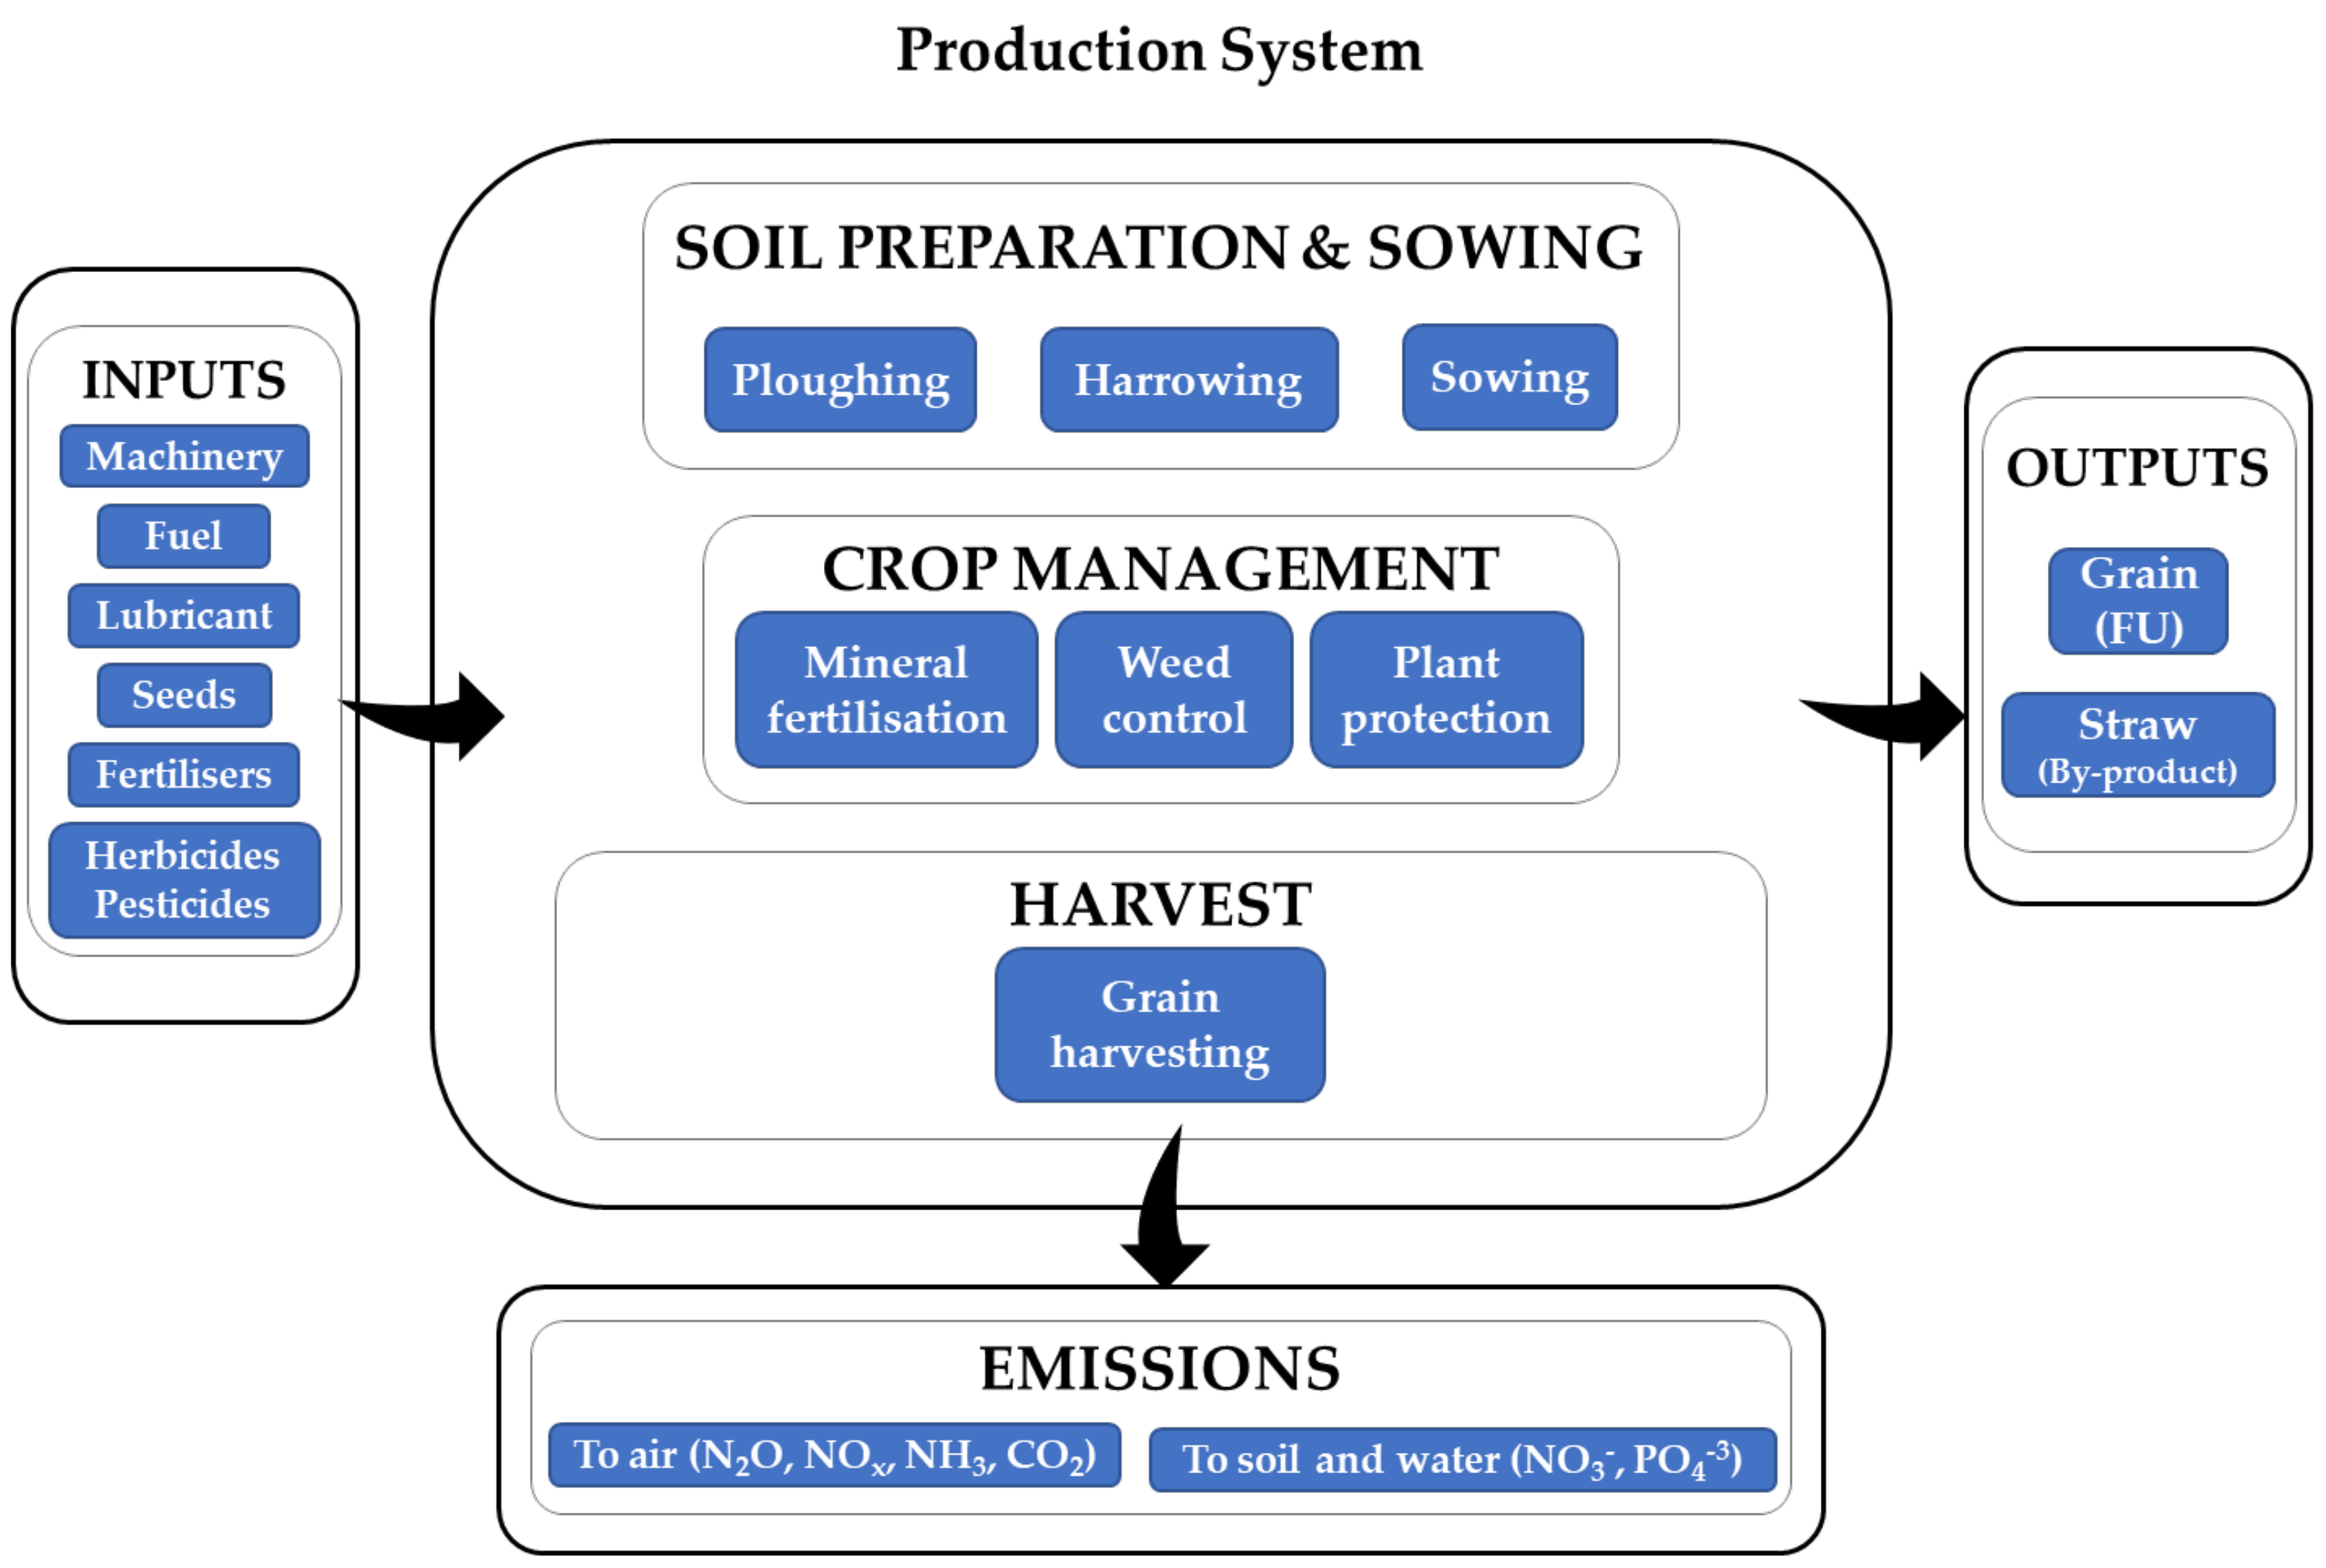
2.3. System Boundaries and Functional Unit

The system included all purchased inputs and activities carried out for barley production in the study area during the 2014–2015 and 2015–2016 growing seasons, following a cradle-to-gate approach from field preparation to crop harvest. Figure 2 shows the inventory data and the system boundaries taken into consideration in our estimation of the environmental impact of barley production in Araba/Álava, including the main inputs (i.e., seeds, fertilisers, pesticides, and fuel); the agricultural field operations (fuel consumption divided into three categories: soil preparation and sowing, crop management, and crop harvest); the outputs (barley grain and straw); and the emissions to air, soil, and water. The influence of transportation and the drying stage were not considered in our analysis.
The functional unit (FU), a quantified performance of a product system to be used as a reference unit in LCA, is the basis for comparisons between different systems [5]. Since the main function of the agricultural system under study here is barley grain production, the FU was defined as “one tonne of harvested barley grain (dry mass of 85%) at the farm gate”, in agreement with related studies [10,12]. In addition to barley grain (the target product), straw was generated as a by-product.

2.4. Allocation Procedure

In this study, a mass-based allocation criterion was implemented as the first suggestion considered by the product category rules (PCR) for arable crops, which are defined as “sets of specific rules, requirements and guidelines for developing environmental declarations that use quantified environmental data” [18]. Permit analysis of the system that avoids market variations could occur from economic allocation. Mass allocation percentages were estimated by considering the biomass production (kg) of barley grain and barley straw, achieving the allocation factors of 49.50% and 50.50% for grain and straw, respectively. Data on barley straw production were not available for our studied plots. In consequence, barley straw production was estimated by considering a ratio of the above-ground residue dry matter to the harvested yield (RAG(T)) of 1.2, according to the IPCC 2006 Guidelines [17].
For the sensitivity analysis (see below), the allocation procedure was based on economic criteria. According to Ardente and Cellura (2012), the economic allocation option should be considered, among other cases, whenever the prices of by-products and co-services differ widely [19]. For our economic allocation, annual average prices for the period of 2010–2020, available in databases from the Basque Government [20,21], were considered, thus assigning a greater percentage value for barley grain (89.29%) due to its higher price compared to straw. This percentage value is very similar to that proposed in the Ecoinvent Database [22], a compliant data source for studies and assessments, based on ISO 14040 and ISO 14044, reported in the PCR for arable crops. In fact, the Ecoinvent Database applies a value of 89.90% and 10.10% for grain and straw, respectively, when no other allocation criteria other than economic criteria can be applied.

2.5. Life Cycle Inventory (LCI)

Our life cycle inventory (LCI) was defined as follows: (i) seed and fertiliser production; (ii) pesticide production; (iii) agriculture field operations; and (iv) emissions from soil (N2O, NOx, NH3, NO3 and PO43−). Data for the LCI were obtained from farmer surveys carried out during the development of the LIFE AGROgestor [23] project. The corresponding farmers provided the required information on the most widely adopted agricultural practices used for barley production in the studied region. This information was incorporated to the LCA (Table A1, Appendix A). Table 1 shows a summary of the inventory flows (including the average quantities), as well as a brief description of the Ecoinvent processes, used in barley production in the studied region.
An average yield of 6.21 tonnes ha−1 of barley grain (dry mass = 85%) with a straw production of 6.33 tonnes ha−1 (dry mass = 85%) was established. We assumed that the straw (i) was not incorporated into the soil after crop harvesting and (ii) had an export rate of 90%. Following Noya et al. (2015) [4], in our assessment, no change in the overall soil carbon content was assumed because of the difficulty of its measurement, due to its dependency on a wide variety of factors such as management practices, climate, previous cropping regimes in the area, etc.

2.5.1. Emissions from Seed, Fertiliser, and Pesticide Production

Emission factors for the production of barley seed, fertiliser, and pesticide were taken from the Ecoinvent Database [24] (Table 1). Seed production was referenced to 1 kg of barley seed, with a maximum water content of 15%, at a regional storage centre. The seed rate used in our LCI was 228 kg ha−1.
Since, in general, no organic fertilisers are used for barley production in the studied region, we assumed that only mineral fertilisers were applied with an average application rate of 158-80-24 kg of N-P2O5-K2O per hectare. The following mineral fertilisers were considered for our estimation: calcium ammonium nitrate (CAN: 400 kg ha−1) and NPK mixture (13-20-6: 400 kg ha−1). Since the emission factor for the specific NPK mixture used in the studied region (13-20-6) was not available, we used the factor for the NPK 15-15-15 mixture.
According to some authors [25], in terms of emissions, the contribution of pesticide application can be considered negligible. Nonetheless, emissions from pesticide use were estimated in this study. Since emission factors for each individual pesticide were not available, we assumed the same emission factor for all of them (Table 1), based on the active ingredients (a.i.) of unspecified pesticides. An average application of 0.48 kg a.i. ha−1 was estimated.
Transport and packaging of seeds, fertilisers, and pesticide were included in the system boundaries, as reflected in Table 1.

2.5.2. Emissions from Agricultural Field Operations (Fuel Consumption)

All field operations for barley cultivation in the studied region are normally carried out by the farmers themselves, including ploughing, harrowing, sowing, fertilisation, pesticide applications, and harvesting. Fuel consumption data for these agricultural practices were obtained from the above-mentioned surveys, including information on tractor power, machinery operation time (hours), and fuel consumption during field work activities (L ha−1). When consumption data were not available, they were estimated using Spanish databases (IDAE [22]) and/or the consumption values proposed by Lovarelli et al. (2020) [10]. According to the information obtained from the farmer surveys, as well as from these sources, diesel consumption was adapted to the study conditions, setting a specific value for each field operation (Table 1).
Emissions derived from fuel consumption for the different agricultural operations were obtained from the Ecoinvent Database (Table 1). The specific weight of diesel was set as 0.84 kg L−1 [25,26,27].

2.5.3. Emissions from Field

The accuracy, robustness, and reliability of LCA data depend on the quality and representativeness of the input–output data [14]. The inclusion of emission data, in addition to material purchases and energy flows, is a crucial stage of the LCA framework [5,28]. Therefore, emissions of NOx, NH3, NO3, and PO43− were included in our LCI due to its relevance for various impact categories, such as acidification and eutrophication [29]. Moreover, field emissions from fertilisation (N2O) affect GHG emissions [30] and, therefore, the climate change impact category.
Two different methodologies were considered to estimate the field emissions derived from mineral fertiliser application, as well as from crop residues, during barley production in the studied region: (i) the IPCC 2006 [17] methodology, as the baseline scenario, and (ii) the IPCC 2019 Refinement [16] methodology, as the sensitivity analysis (see below). Table 2 shows information on the N2O factors used here. Disaggregation of EF1 by climate was calculated according to the IPCC 2019 Guidelines for wet (W) and dry (D) climates.
Pertaining to crop residues, we estimated that 90% of the straw is removed and, hence, only 10% remains as crop residue, being an additional source of nitrogen for nitrification and denitrification processes, leading to N2O emissions. The amount of N in crop residues (FCR) was estimated from above-ground and below-ground crop residue biomass values multiplied by the corresponding N concentration, as defined by the IPCC Guidelines [16,17]. The emission factors for the N content of above-ground residues (NAG(T)) and below-ground residues (NBG(T)) were 0.007 and 0.014, respectively.
Nitrate (NO3) emissions due to leaching and runoff were estimated following the emission factors proposed by Zampori and Pant (2019) [31]. The emission values are reflected in the IPCC methodology, namely, 1.33 and 1.06 kg NO3 emitted per kg of N in fertilisers applied (IPCC 2006 [17] and IPCC 2019 [16], respectively). As indicated in the IPCC methodologies, this estimation only applies to wet climate regions.
Regarding ammonia emissions from fertiliser application, emission factors as reported in the EMEP/EEA Air Pollutant Emission Inventory Guidebook [32] were used, i.e., 17 and 91 g NH3 kg−1 N applied for the CAN and NPK mixtures, respectively. For the selection of the NH3 emission factor, a cool climate (i.e., average temperature below 15 °C) and a soil pH > 7.0 were assumed.
Emissions derived from fertiliser volatilisation (kg NO–N volatilised per kg of N in fertiliser) were differentiated according to the type of fertiliser, as per Zampori and Pant (2019) [31], as follows: 0.016 kg of NO–N for CAN and 0.0225 kg of NO–N for NPK mixtures as a mix of ammonium nitrate (50%, with a emission factor of 0.029 kg of NO–N per kg of N applied) and CAN (50%), in accordance with PCR 2020 [18]. Since no applications of lime, urea, or urea-containing compounds were made in the studied plots, their related emissions were not included.
Phosphate emissions (PO43−) were estimated following the Swiss agricultural life cycle analysis (SALCA) model [33], which distinguishes between the leaching of soluble phosphate to groundwater (Pgw) and the run-off of soluble phosphate to surface water (Psw) that was corrected by mineral P fertilisation (Fro) (Table 3). Phosphorus correction factors of 0.07 kg P ha−1 year−1 and 0.175 kg P ha−1 year−1 were used for P leaching to groundwater in arable land and P lost through run-off to rivers, respectively [24,34].
Air, water, and soil emissions from pesticide application were estimated considering that 10, 8.5, and 76.5% of the pesticide active ingredient were released to the air, water, and soil, respectively. The remaining 5% of the active ingredient was assumed to be maintained on the crop itself, in line with recent research [35,36]. By contrast, more simplified approaches assume that pesticides are entirely released to the soil compartment, e.g., Ecoinvent [26]. For the simulation in SimaPro, all the pesticide active ingredients (a.i.) were considered to be glyphosate.
Except for N2O (Table 2), all the other emission factors used here are shown in Table 3.

2.6. Life Cycle Impact Assessment (LCIA)

The environmental impact from the emissions and resource consumption associated to barley production can be divided in different general categories (i.e., acidification, eutrophication, climate change, and formation of photochemical oxidants) which are significantly affected by CO2, CH4, NH3, NOx, and N2O emissions. These aforementioned categories are the most commonly used in life cycle impact assessment (LCIA) studies, regardless of the type of agricultural system [37,38,39,40,41,42,43].
Environmental impacts were quantified using the ILCD (international reference life cycle data system) midpoint and method [44], endorsed by the European Commission and published by the Joint Research Centre of the European Commission. In this study, the following specific categories were assessed using SimaPro 9.1.1.1 software (Amersfoort, The Netherlands):
Climate change (CC, kg CO2 eq);
Ozone depletion (OD, kg chlorofluorocarbons-11 equivalents, kg CFC-11 eq);
Human toxicity–no cancer effect (HTnoc, comparative toxic unit for human, CTUh);
Human toxicity–cancer effect (HTC, comparative toxic unit for human, CTUh);
Particulate matter formation (PM, kg 2.5 particulate matter equivalents, kg PM 2.5 eq);
Photochemical ozone formation (POF, kg non-methane volatile organic compounds equivalents, kg NMVOC eq);
Terrestrial acidification (TA, molc H+ eq);
Terrestrial eutrophication (TE, molc N eq);
Freshwater eutrophication (FE, kg P eq);
Marine eutrophication (ME, kg N eq);
Freshwater ecotoxicity (FEx, comparative toxic units ecotoxicity, CTUe);
Mineral, fossil, and renewable resource depletion (MFRD, kg antimony equivalents, kg Sb eq).

2.7. Sensitivity Analysis

In this type of estimation, the formulated assumptions are critical to the outcome and, hence, strongly influence the results and conclusions. Regarding the allocation method and the emission factors, several changes in the formulated assumptions were made to carry out a sensitivity analysis of the CC impact category. According to ISO 14044 [28], “whenever several alternative allocation procedures seem applicable, a sensitivity analysis shall be conducted to illustrate the consequences of the deviation from the selected approach”.
Our baseline scenario was based on two assumptions: (i) we are dealing with a mass-based allocation system where the system loads between the product mass (barley grain) and the by-product mass (barley straw) and (ii) the IPCC 2006 Guidelines [17]. Estimates were calculated for both wet and dry regions. The sensitivity analysis was carried out in order to compare the baseline with two alternative scenarios: (i) allocation based on economic criteria and (b) the IPCC 2019 Guidelines [16]. Table 4 summarises the baseline (BS1) and these two alternative scenarios (SC).

3. Results

Firstly, following the methodology depicted in Table 2 and Table 3, the following emissions were estimated and included in the LCA. Nitrate (NO3) emissions due to leaching and runoff in wet regions were estimated as follows: 210 and 167 kg NO3 ha−1 per 2006 IPCC and 2019 IPCC, respectively, due to the FracLEACH update that was carried out in the 2019 IPCC Guidelines. Regarding the NH3 emissions in the air, the same emission factor was used for both IPCC Guidelines, with an estimated value of 6.53 kg ha−1. With respect to NO emissions, the value used in the baseline (BS1) and alternative (SC1, SC2, and SC3) scenarios was estimated at 6.14 kg ha−1. After applying the SALCA-P model, the phosphate emissions (PO43−) were estimated at 0.21 (Pgw) and 0.64 (Pro) for phosphorous leaching to groundwater and phosphorous run-off to surface water, respectively. Finally, air, water, and soil emissions from the pesticide were included in the LCA: 4.80 × 10⁻² (air), 4.08 × 10⁻² (water), and 3.62 × 10⁻¹ (soil).

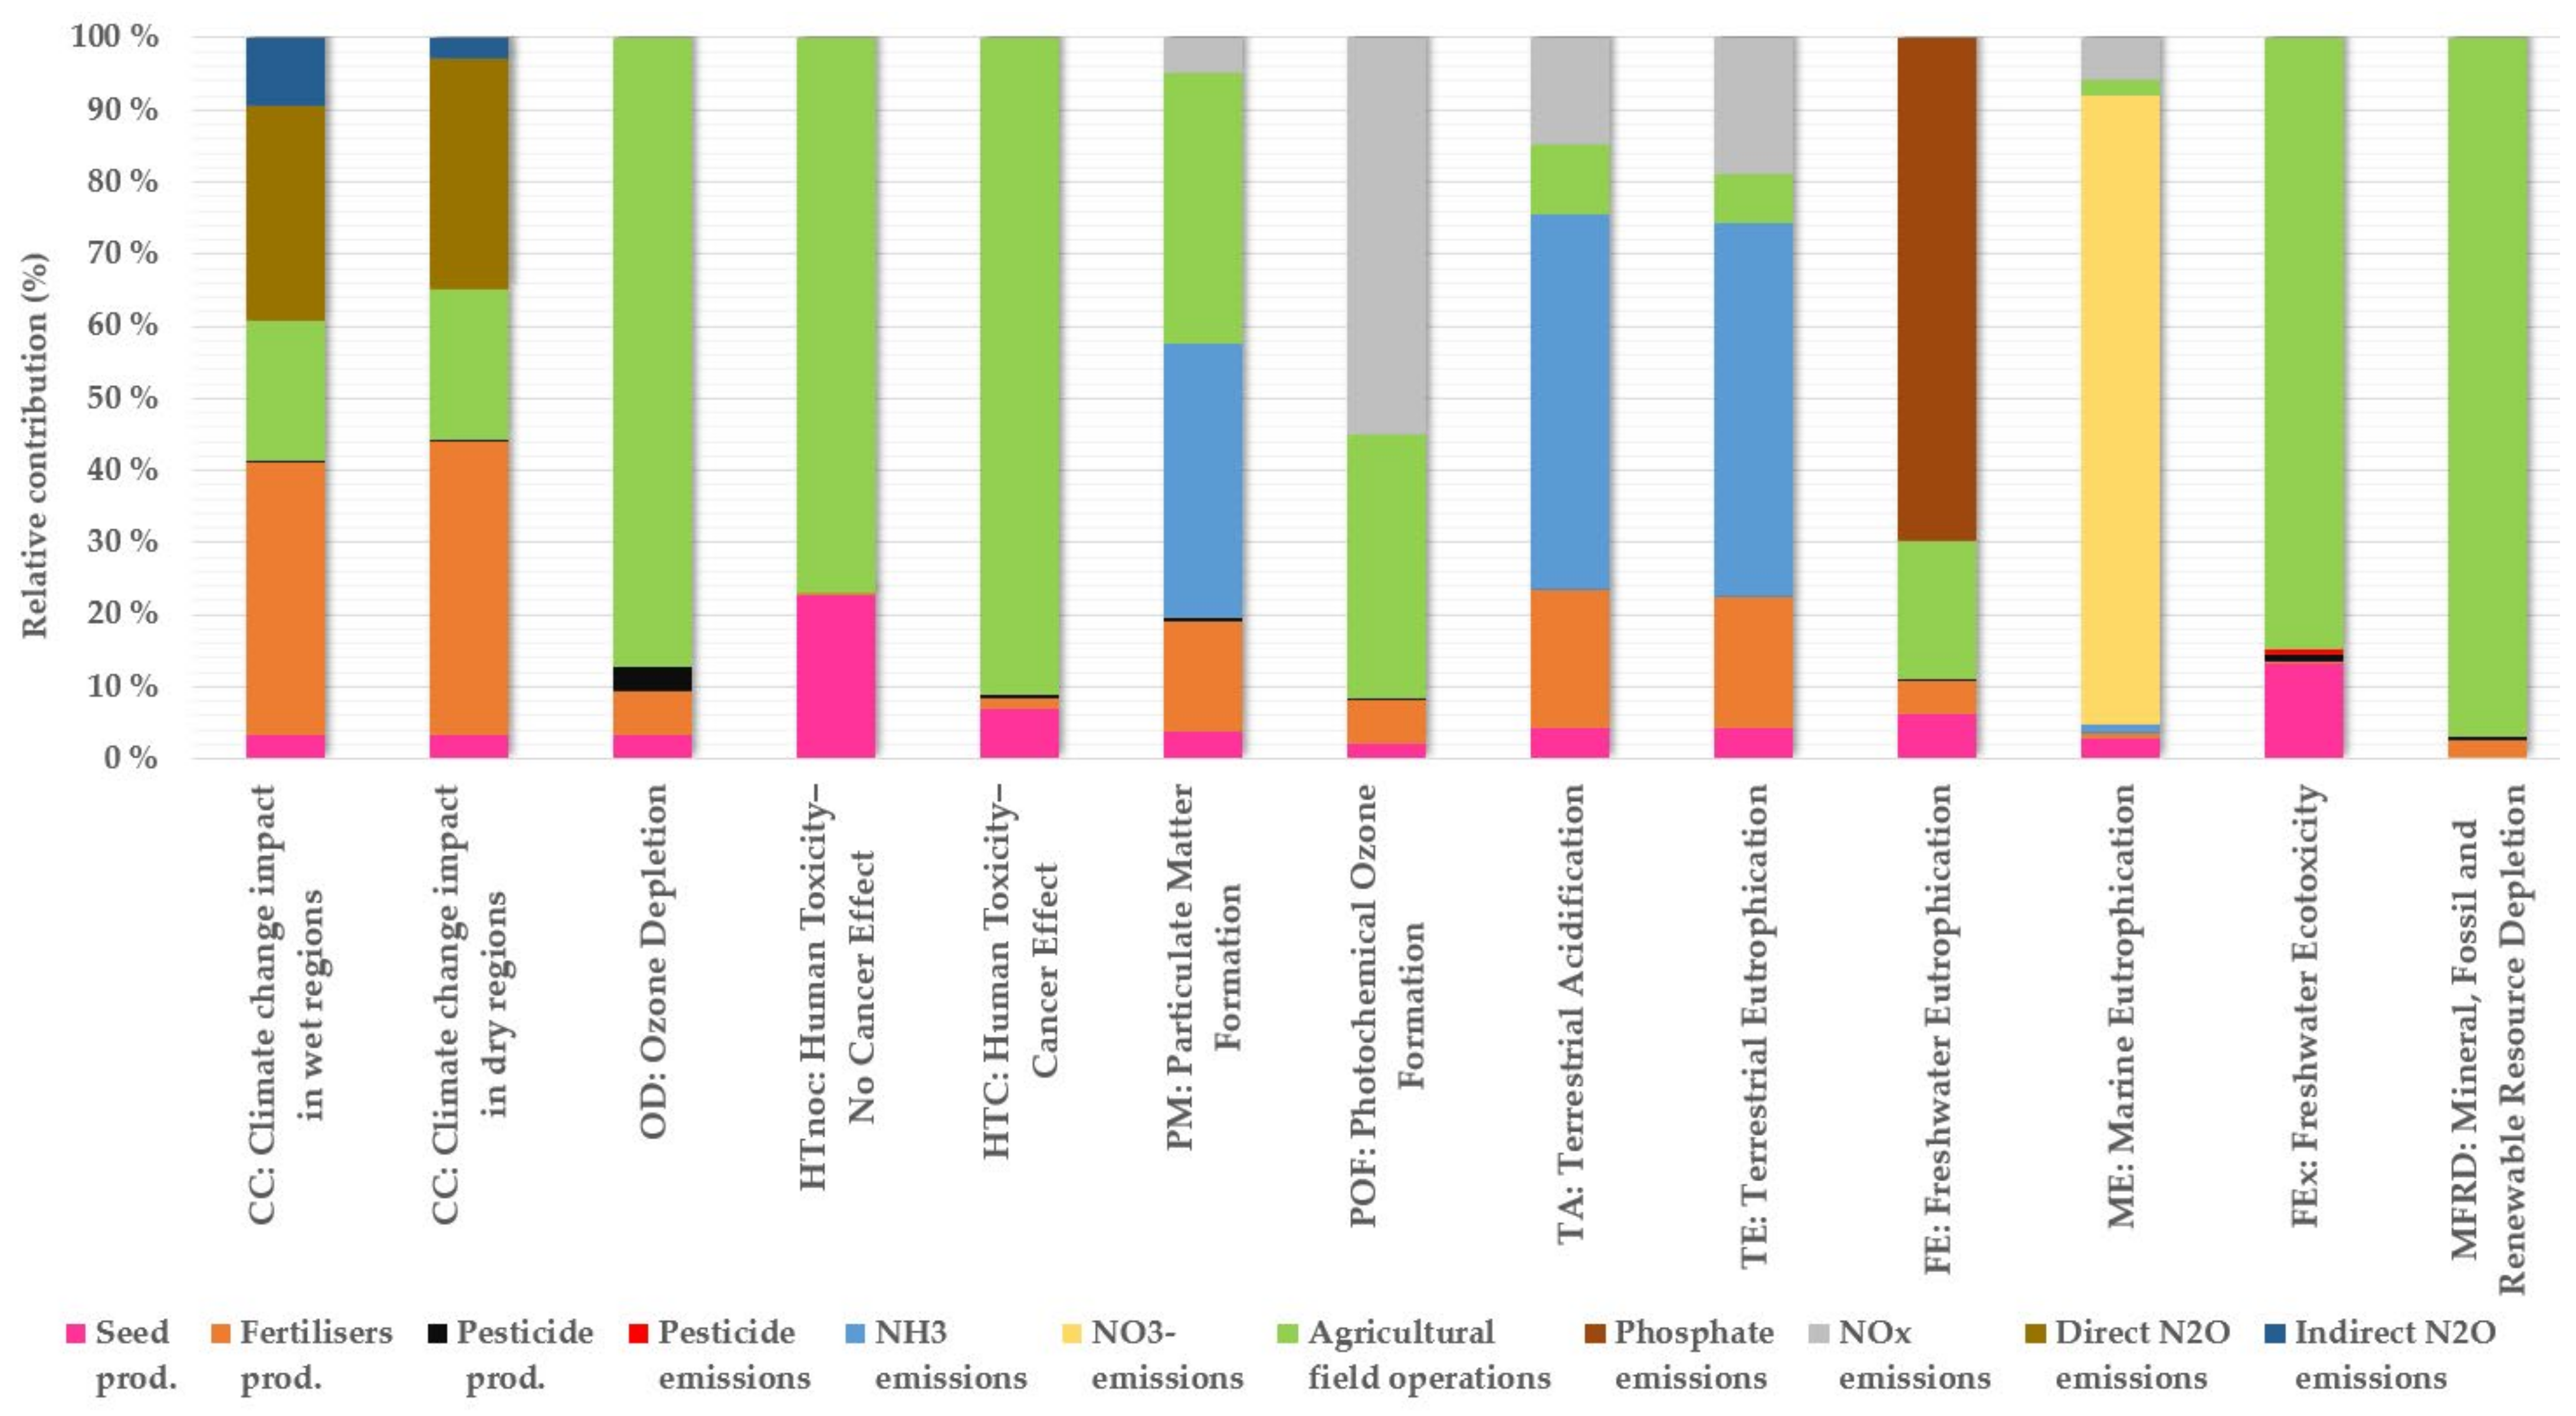
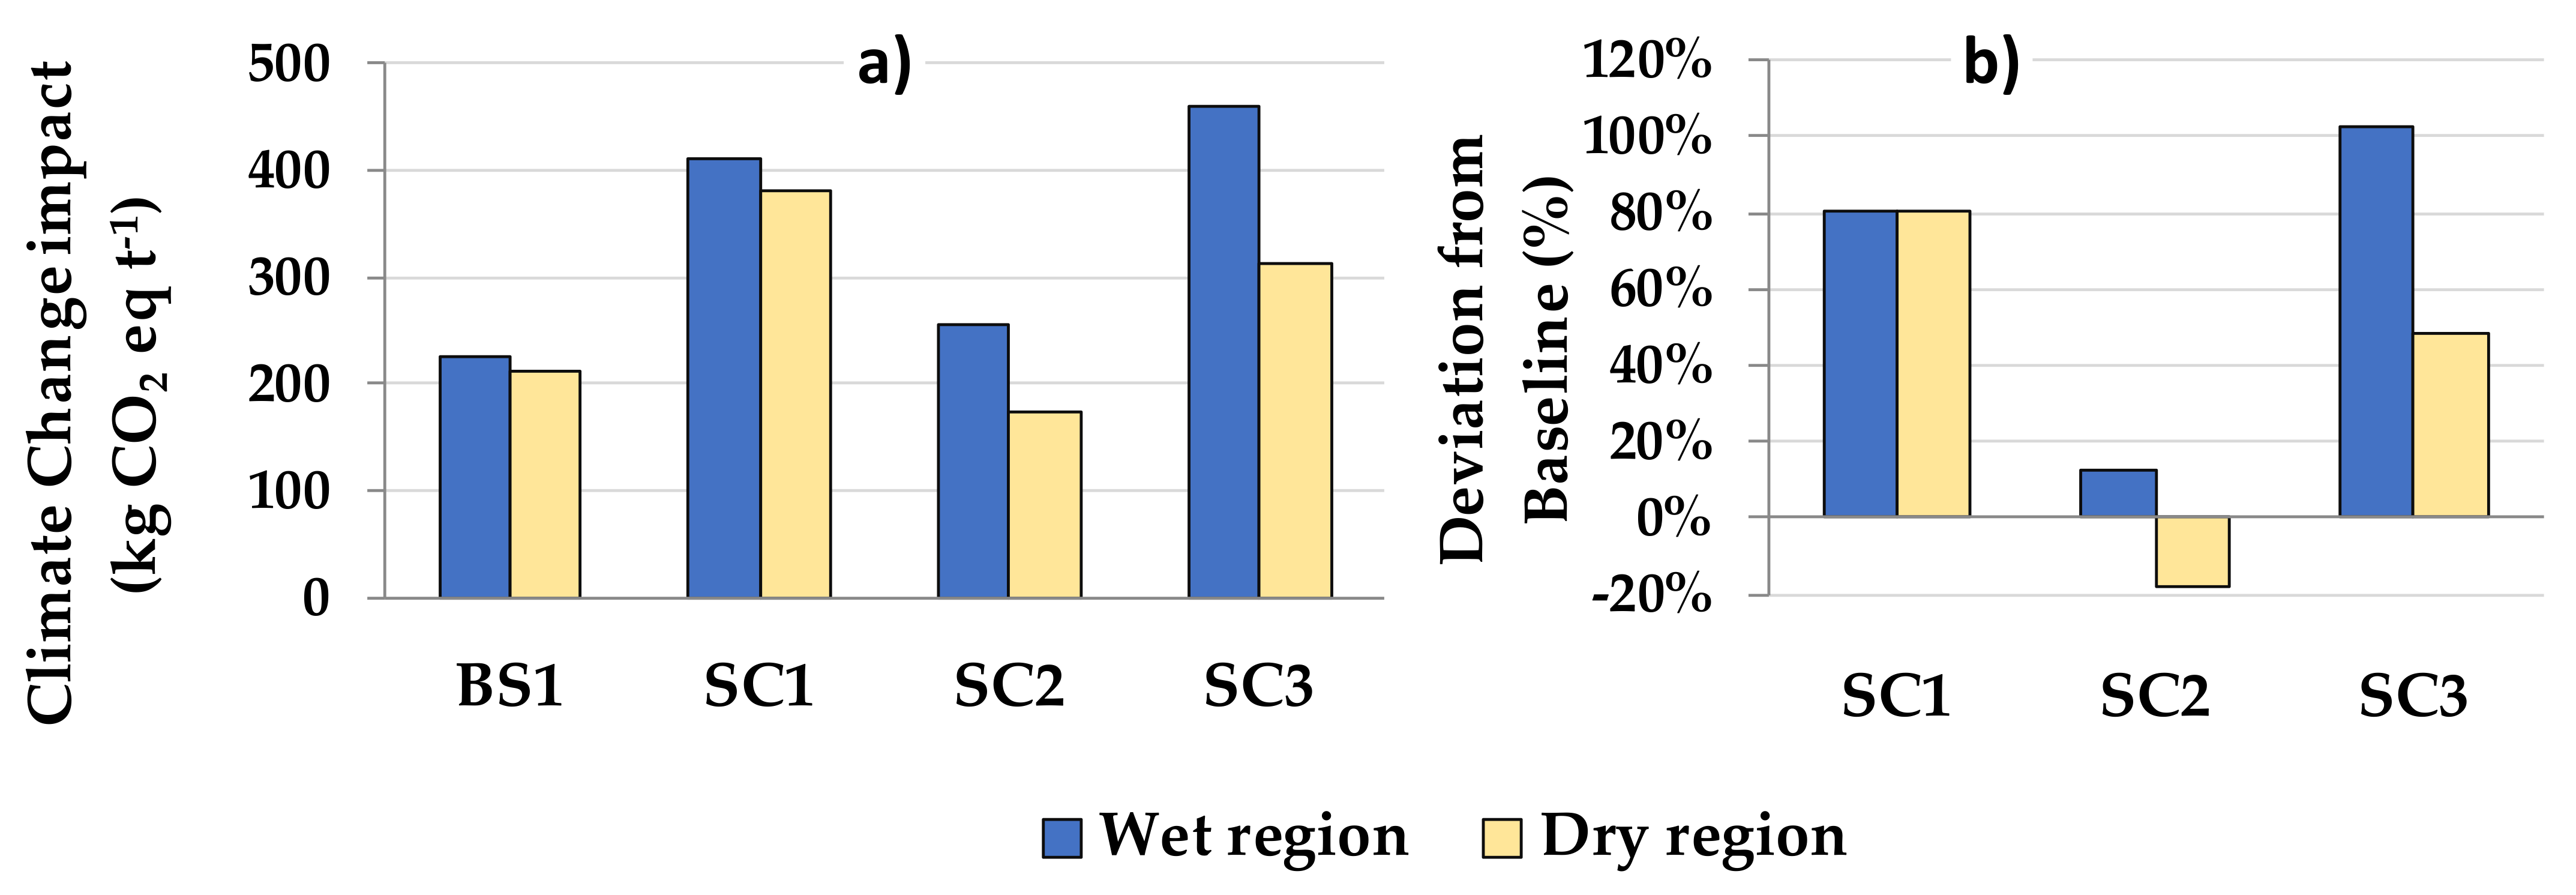
3.1. Environmental Impacts of Barley Production in Araba/Álava

The effect of the climatic area (wet and dry) is only shown for the climate change (CC) category, as this is the only one on which the different climate has an effect.
The field operations stage was one of the main contributors to all the environmental impacts; for instance, the field operations were responsible for 87% of OD, 77% of HTnoc, 91% of HTC, 85% of FEx, and 97% of MFRD (Figure 3). This stage is important in PM (almost 40%) and contributes around 20% to the CC impact category.
In this study, NH3 emissions derived from mineral fertiliser application were the main contributors to TA (52.1%) and TE (51.8%), while NO3 emissions were the main source (87.3%) of ME. In terms of the mineral fertiliser type, the CAN and NPK mixtures contributed 22% and 30% for TA and TE, respectively. The FE impact category was mainly determined (70%) by the phosphate emissions, followed by agricultural field operations (19%). Only five impact categories were affected by NOx: 5% of PM, 55% of POF, 15% of TA, 19% of TE, and 6% of ME.
For the CC impact, the relative contribution of the main inputs required for barley production in Araba/Álava differed only slightly by climatic region (W and D). The production of fertilisers was the main contributor to the CC impact (about 40%) in both regions. Fertiliser production also played an important role in other impacts, such as TA (19%), TE (18%), and PM (15%). Direct and indirect N2O emissions accounted for almost 40% of the CC impact in wet regions and 35% in dry regions (indirect emissions factors were not applied in the dry regions). The results are discussed in more detail in the following section.
The pesticide production and the pesticide emissions were a minor contribution to all the environmental impact categories (<4%).

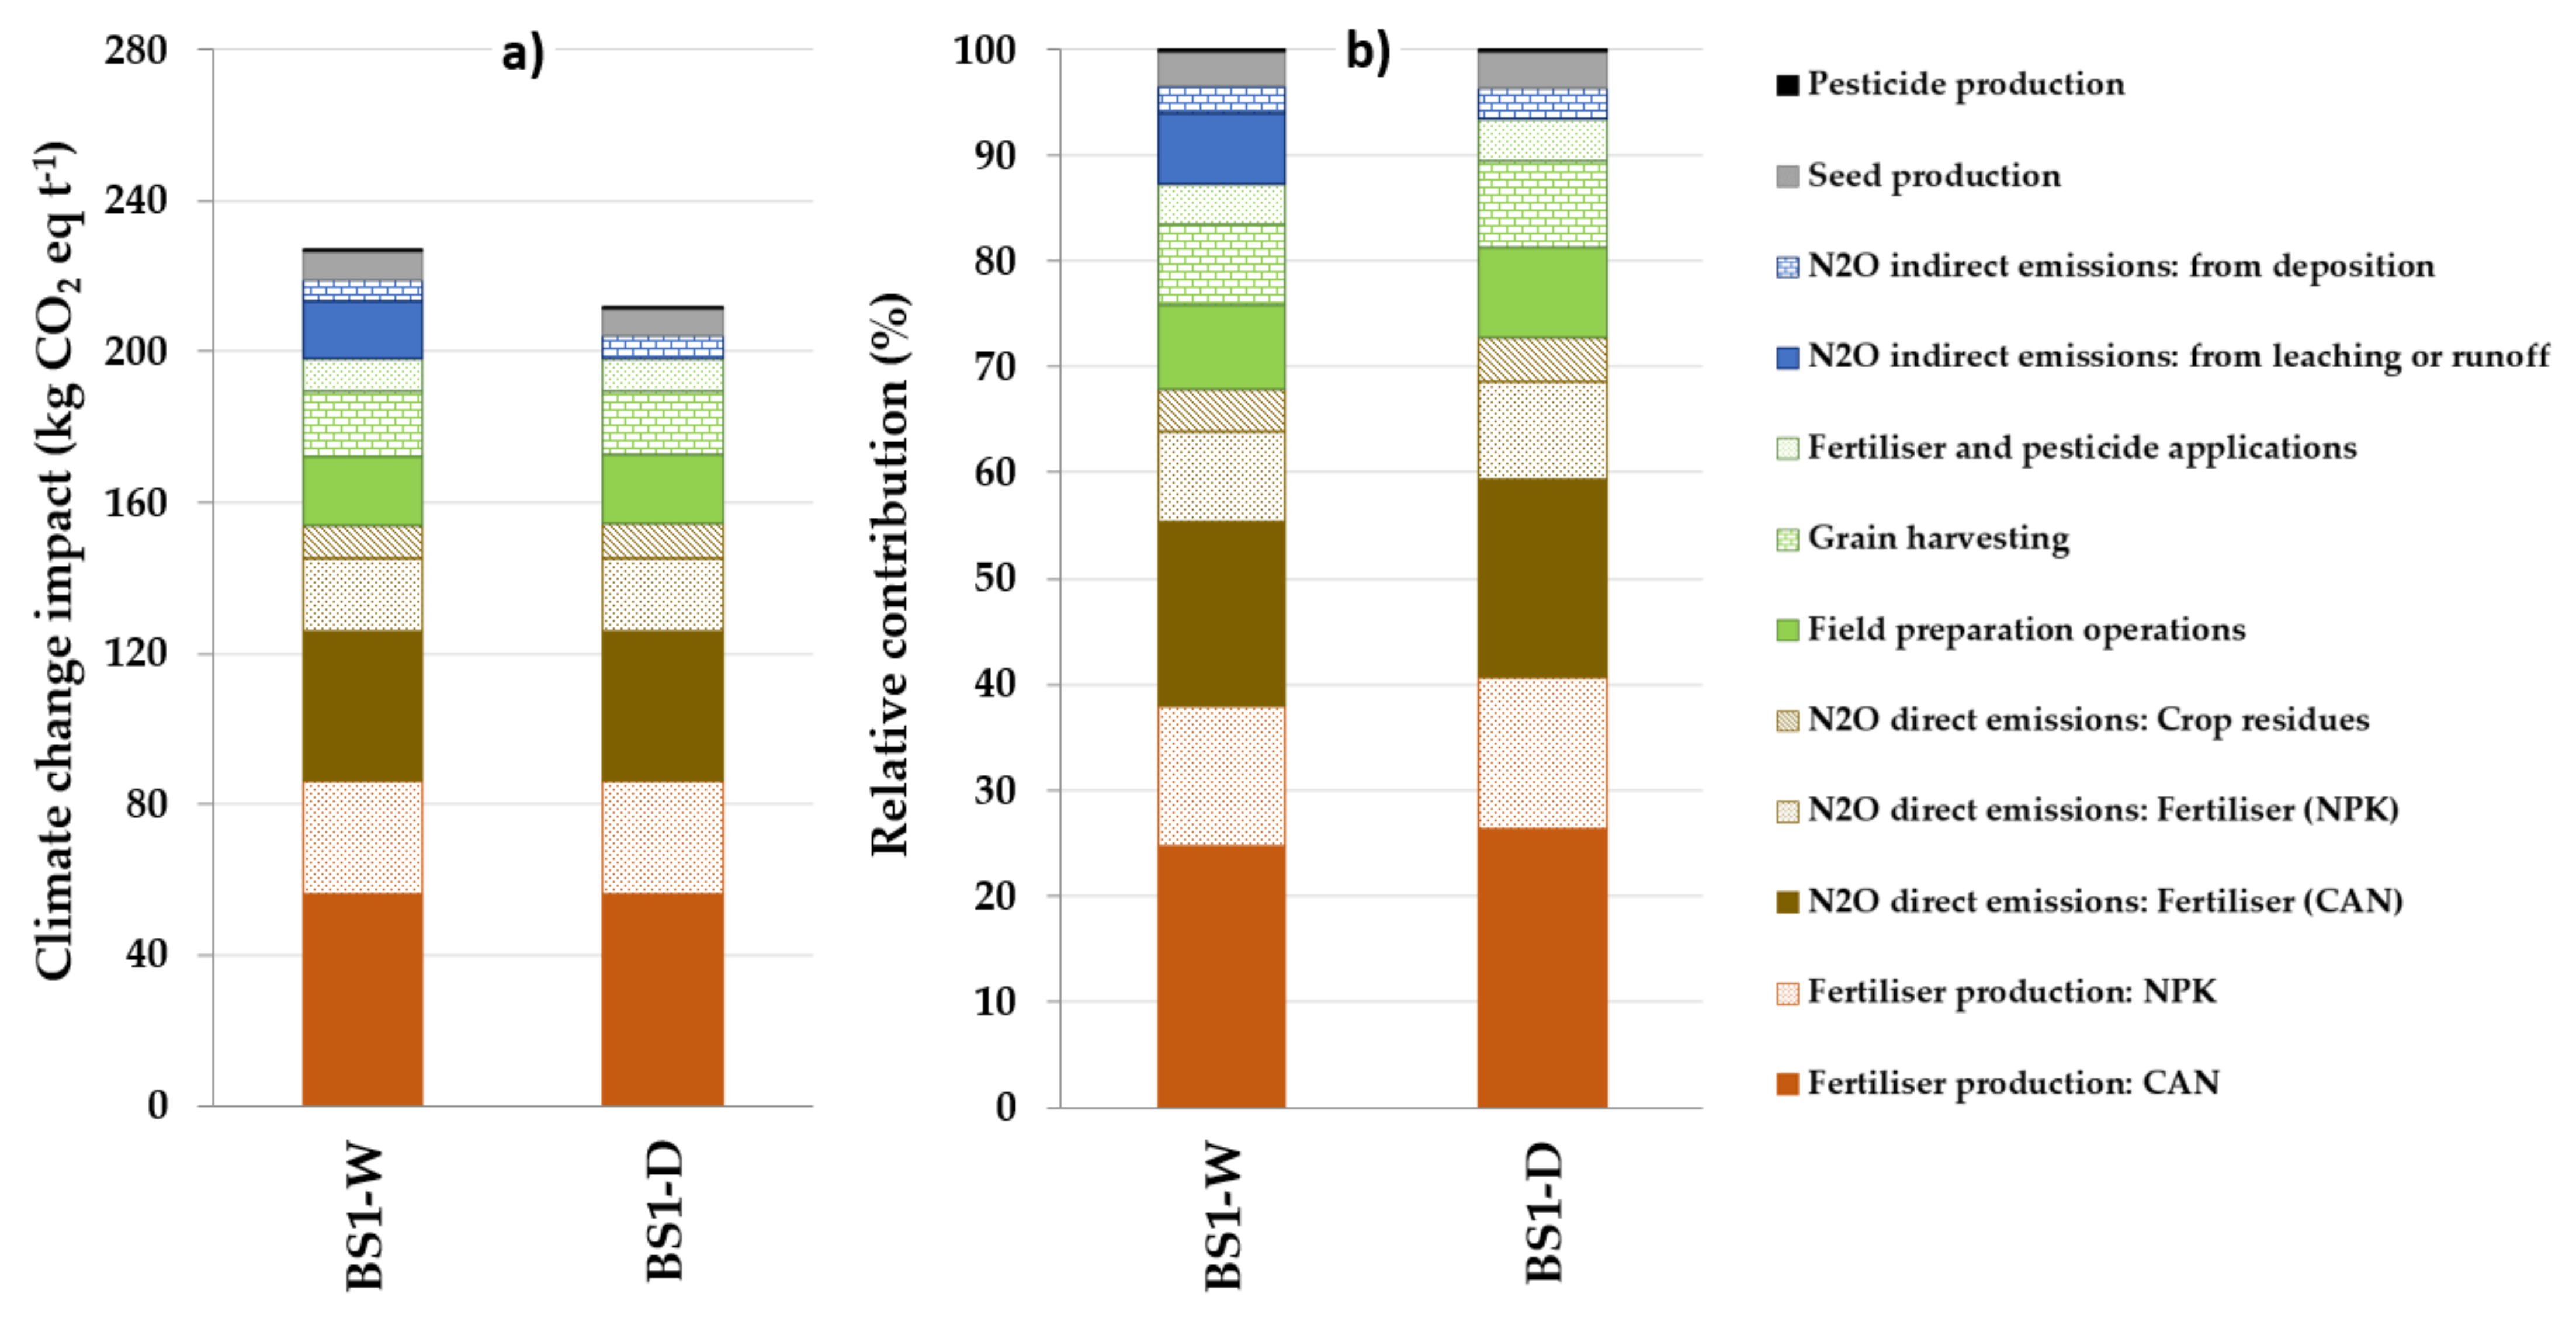
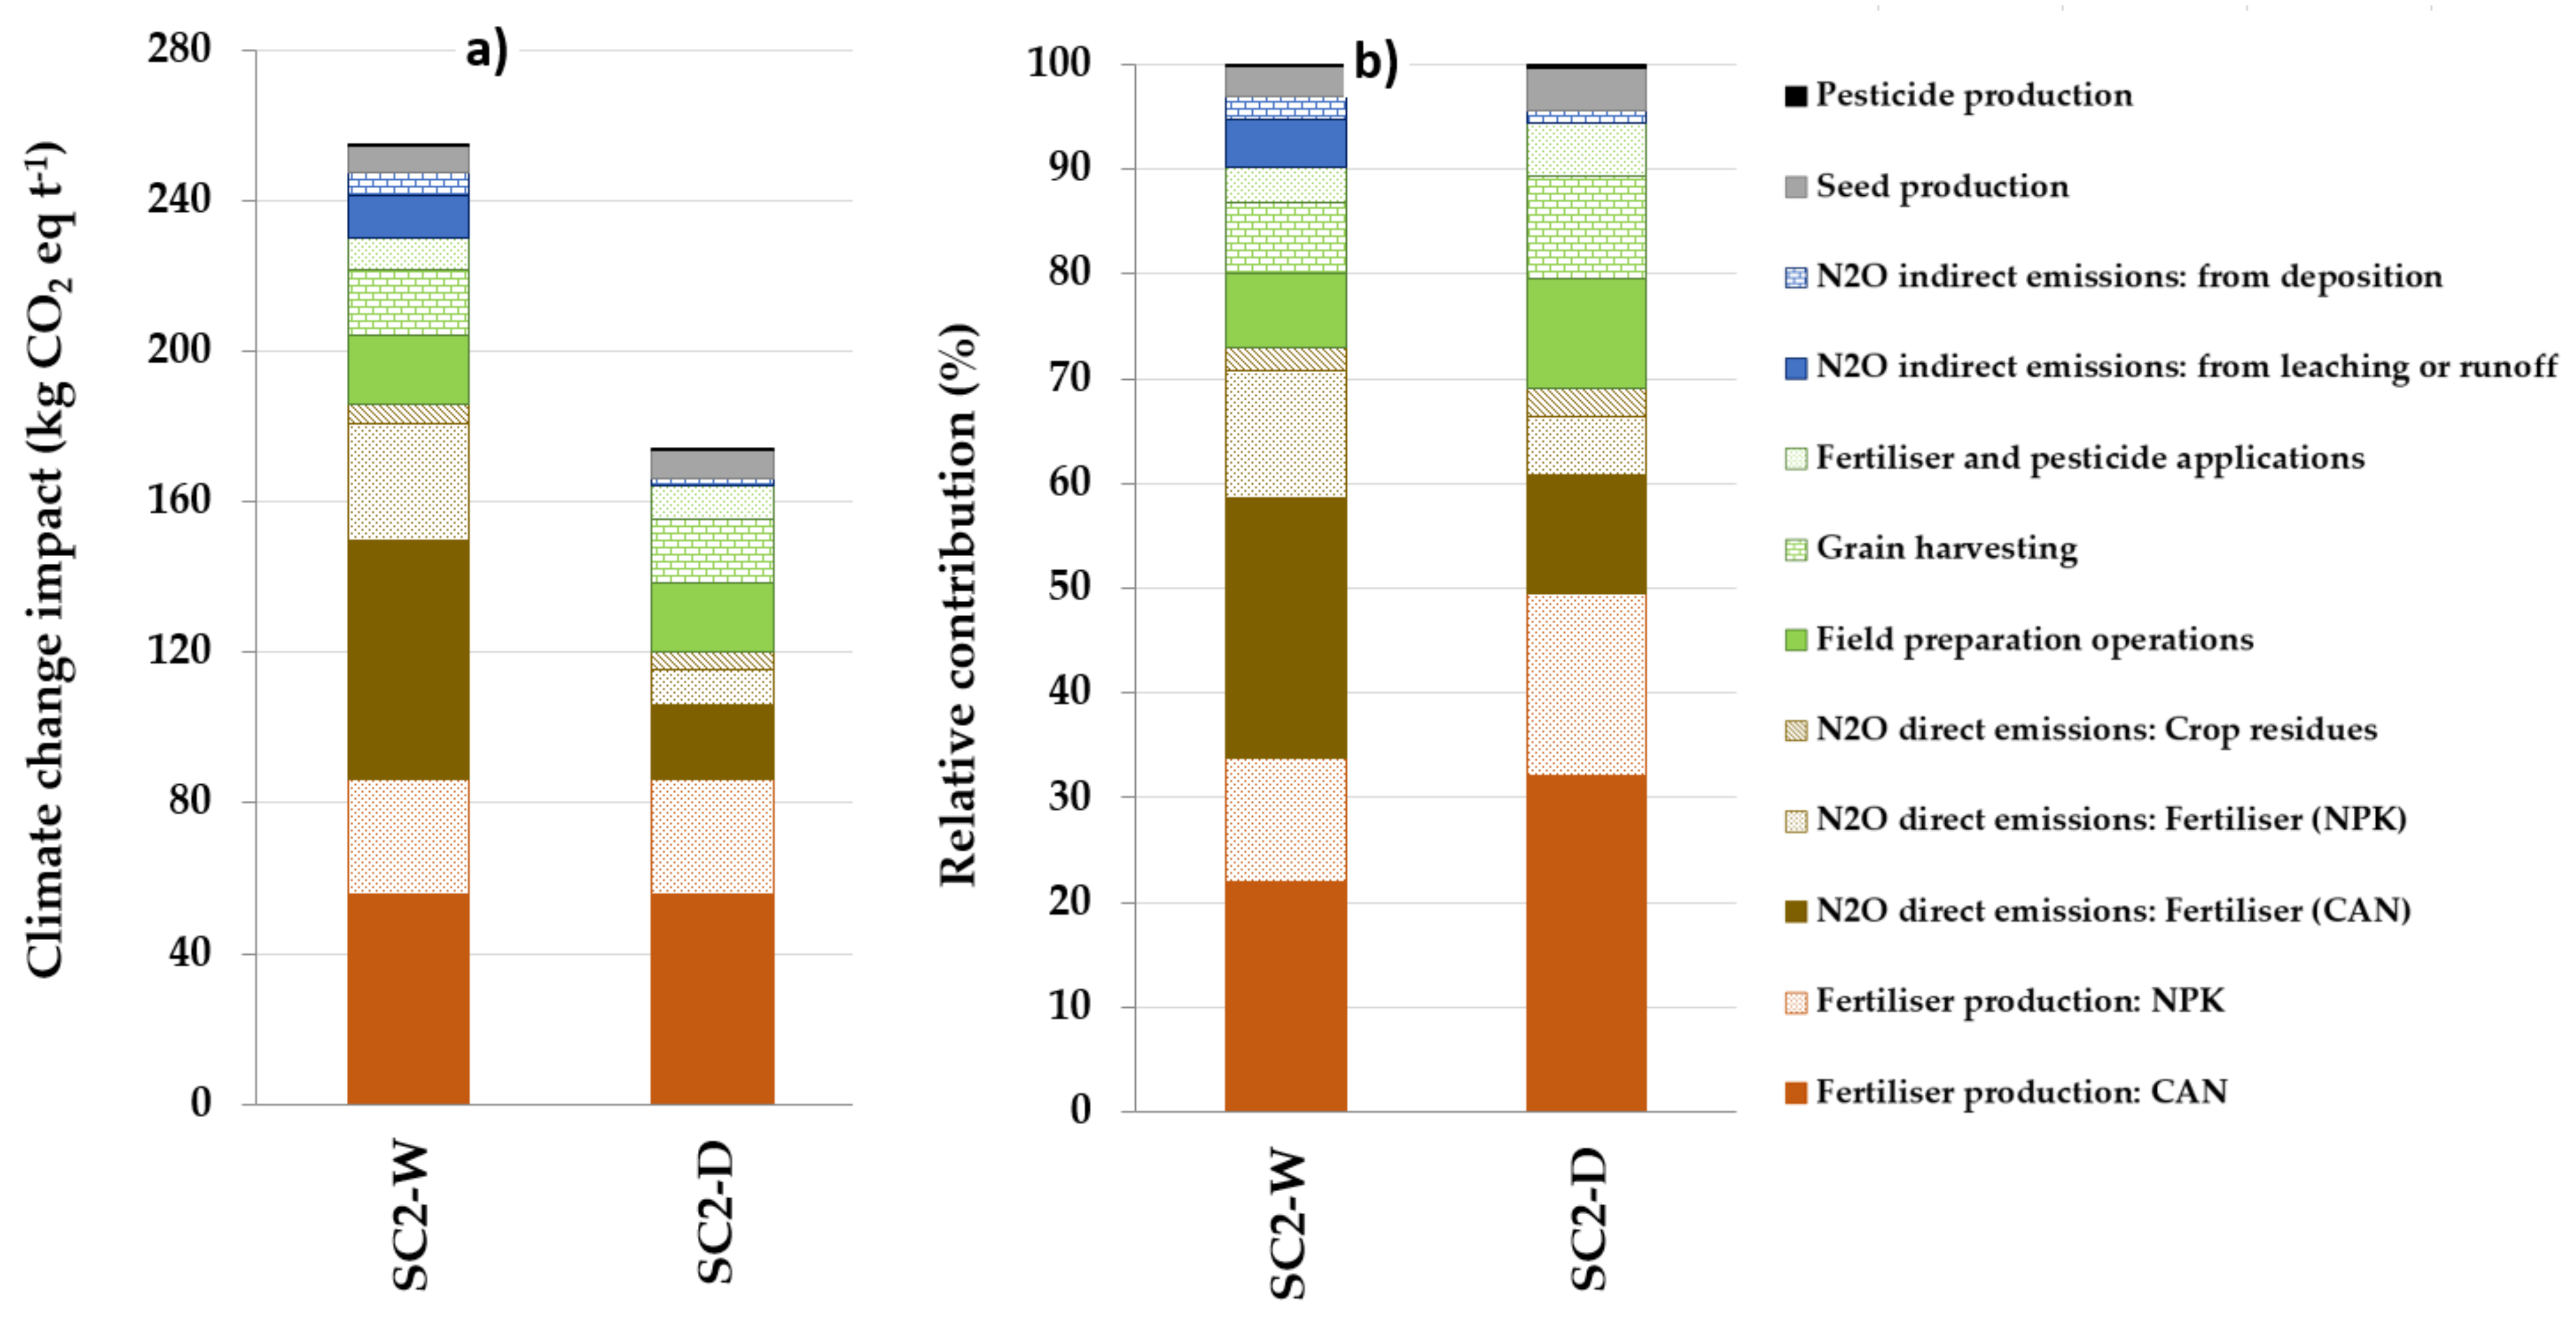
3.2. Relative Contribution of Agricultural Management Inputs and Activities on Climate Change Impact

As mentioned in the previous section, fertiliser production was the main contributor to the CC impact in barley production in Araba/Álava, both in dry and wet areas (38% and 41%, respectively), with CAN production being the largest contributor (25% on average) (Figure 4). Secondly, direct N2O emissions from N application to soils constituted 30% of the total emissions. The largest contributors to N2O emissions were those from CAN fertilisation (17–19% of the total emission), followed by those from NPK fertilisation (9%), due to the different quantities of nitrogen per fertiliser type.
Regarding diesel combustion for barley crop production, the results have been disaggregated into three different groups, with field preparation and harvesting practices contributing a similar amount (8% on average), and cultivation practices contributing only 4%.
In this study, the indirect N2O emissions made up 9% and 3% of the contributions to the climate change impact for wet and dry regions, respectively.
Finally, pesticide and seed production were minor contributors (<4% for both wet and dry regions) to the climate change impact.

3.3. Sensitivity Analysis of the Climate Change Impact Category to Allocation Types and Emission Factors

The main objective of the sensitivity analysis was to investigate the effect of the choice of different allocations systems (mass-based vs. economic allocation) and IPCC methodologies (IPCC 2006 vs. IPCC 2019).
When economic allocation was considered instead of mass-based allocation in the wet regions of Araba/Álava (SC1-W), the CC impact worsened, due to the increase in the allocation factors obtained for grain, from 50% (by mass) to 80% (by economic). Hence, the CC impact increased by 80.6% (Figure 5). In dry regions (SC1-D), there was a similar increase from 212 to 382 kg CO2 eq t−1 (80.2%).
In general, the IPCC 2019 methodology significantly increased the CC impact in SC2-W (by 12%), SC3-W (by 103%), and SC3-D (by 48%), as compared to their corresponding baseline scenarios (BS1). These increases are the result of the new emission factors developed in the IPCC 2019 Refinement, which is based on the latest advances in science for direct and indirect N2O emissions. Only in the case of SC2-D was the CC impact reduced (18%), as compared to the BS1-D.
When we compare the baseline to scenario 2 (IPCC 2019 and mass allocation), the direct N2O emissions increased in wet regions and decreased below the baseline in dry regions (Figure 6). The reason why the wet region’s direct N2O emissions increased is because the EF1 factor updated from 1% to 1.6% in wet regions when synthetic fertilisers were applied to the soil. In dry regions, the EF1 was updated from 1% to 0.05% for all nitrogen inputs, leading to a deep decrease in the contribution of emissions. However, the emissions from the N in crop residues decreased by the decrease in EF from 1% to 0.06% kg N2O–N kg N applied−1.
In the case of indirect emissions, the new emission factors decreased the relative contribution of the indirect N2O emissions to CC in both climatic regions. When comparing the baseline scenario to scenario 2 (mass allocation + 2019 IPCC), the emissions from leaching and runoff in wet regions decreased from 6% to 4%, while the N2O emissions from atmospheric deposition decreased from 3% to 1%. In dry regions, no leaching or runoff was calculated, but the atmospheric deposition decreased.
The other processes (seed, fertiliser, and pesticide production and diesel consumption) reduced their relative contributions to CC in wet regions due to the increase in direct N2O emissions. The opposite occurred in dry regions due to the decrease in both direct and indirect N2O emissions.

4. Discussion

4.1. Environmental Impacts of Barley Production in Araba/Álava

In this study we found that the climate change impact was 220 kg CO2 eq t−1 in barley produced on average for the baseline scenario. This result is lower than that obtained by Lovarelli et al. (2020) [10] (279 kg CO2 eq t−1), who used the ILCD midpoint method [45] and performed a mass allocation to quantify the environmental impact of barley cultivated in Spain. Our results, when an economic allocation was applied (496 kg CO2 eq t−1 on average), are higher than those obtained by Rivera et al. (2017) [12], who used the same ILCD methodology and implemented an economic-based allocation method for barley production in Italy and Denmark (265 and 345 kg CO2-eq t ha−1, respectively). Our study is useful as it allows for the direct comparison of the different methodologies used in different studies, which used one methodology each.
The different methodological approaches between the present and other recent studies underline the difficulties involved in comparing LCA studies. Thus, a study carried out by Bartzas et al. (2015) [46], who used a different LCA methodology (CML [47]), determined that barley production in Spain has an overall impact of 171 kg CO2-eq t ha−1, 0.67 kg SO2-eq for PA, and 0.56 PO4-eq for PE, with a grain yield of 5.42 t ha−1.
Another difference between the present and other studies is mainly due to the amount and type of the fertilisers applied in the field. For instance, Lovarelly et al. (2020) [10] highlighted the improvement of the results on the impact categories affected by fertiliser production when animal slurry is applied, while worsening those affected by the N emissions. In the case of the use of mineral fertilisers, all the environmental effects related to ammonia volatilisation are reduced. This reveals that there is a trade-off between both scenarios (mineral vs. organic fertilisation) that must be considered when farmers, advisors, and policy makers are deciding upon a fertilisation regimen. However, the environmental impacts are largely affected by yield, which in the present study is quite high (6.2 t ha−1) in comparison to other studies (3.13 and 6.1 t ha−1 [10,12,46]).
Another factor that affects several environmental impacts is the level of machinery used and the definition of the boundaries and type of LCA that the study carried out. In the present study, diesel combustion from different field operations averaged 75.29 kg diesel ha−1. Lovarelli et al. (2020) [10] set a value of 64.2 kg diesel ha−1 for the Spanish barley production, including straw windrowing and straw baling, in addition to associated transport, which were not included in the present study. The agricultural field operations stage was one of the main contributors to all of the environmental impacts, as found by Rivera et al. (2017) [12] and Lovarelli et al. (2020) [10].
In regard to field emissions related to barley cultivation, differences could be found between the emissions that are included in the studies. As Rivera et al. (2017) [12] summarised, most studies on cereals include N2O, NH3, and NO3 emissions [11,13,43,48,49,50], but many do not consider the contribution of NOx [4,51]. In our study, the emissions of NOx had an effect on five impact categories: particulate matter formation, photochemical ozone formation, terrestrial acidification, terrestrial eutrophication, and marine eutrophication. NOx was responsible for more than half the impact of POF. This demonstrates that not considering NOx emissions in the LCA inventories reduces their accuracy. This is in agreement with Roer et al. (2012) [40], who found that exclusion of NOx loss from the use of mineral fertiliser resulted in high reductions of PMF (65–71%), POF (83–82%), and TA (68–75%).

4.2. Relative Contributions of Inputs and Activities to Estimated Climate Change Impact

Our results are in accordance with previous studies, which identify field emissions and fertiliser applications as the main contributors to the estimated climate change impact [11,40]. Nitrogen fertiliser production is highly energy intensive; thus, fertiliser production in this and other studies was the greatest contributor to the barley production estimated climate change impact and accounted for an average of 40% of the estimated impact in this study. Furthermore, the direct N2O emissions implied an average of 31% of the contribution to the CC impact. Fertiliser production and N2O emissions are priority areas for focusing efforts to reduce greenhouse gas emissions from barley production. In this regard, other authors have focused on studying the improvement of the N uptake efficiency. These authors observed CC impact decrease due to a combination of higher yield, soil carbon sequestration, and lower indirect emissions of N2O due to lower N leaching [8]. According to Hasler et al. (2015) [52], with an optimised fertilisation strategy, the environmental burden can be reduced by up to 15%. Other previous studies showed that N2O emission can be significantly reduced by using non-nitrate fertilisers, because high amounts of N2O are emitted during the industrial production of nitric acid, which is part of the ammonium nitrate production [53,54]. High N use efficiency and lower N input might be key factors to minimise GHG emissions.
In addition, indirect N2O emissions contributed 9% and the other processes contributed less than 4% to the estimated climate change impact (seed production and pesticide production and emissions). The emissions of N and P compounds related to the mineral fertilisers are the main contributors to TA and TE (86% and 89%) and FE (70%), mainly due to ammonia volatilisation and phosphorus run-off, respectively, in accordance with the results obtained by other authors [10,12].

4.3. Sensitivity Analysis

Firstly, in comparison to the mass-based allocation method suggested by the product category rules (PCR) for arable crops, and consistent with other LCA studies [55,56], an economic-based allocation method has been evaluated; this is because, over a 5–10 year period, the price variability of the grain in Araba/Álava was reduced. When economic allocation was applied instead of mass-based allocation, all impact categories increased by 80% due to the higher load allocation to the main product (barley grain), as reported in other studies [4].
Secondly, the results of the sensitivity analysis underline how the IPCC 2019 Refinement method affects the climate change impact of barley production. The climate change impact increased by 1.12 times in wet regions, while it decreased 0.82 times in dry regions. However, the rest of the impact categories were not influenced as the methodological refinement only influences the calculation of direct and indirect N2O emissions. The IPCC 2006 default values assume a linear relationship between the amount of N applied to the soil as fertiliser or crop residue and the amount of N2O emissions [8]. However, the IPCC 2019 Guidelines identify the influence of the climate type, the N fertiliser type, and the influence of irrigation in dry regions.
Consequently, the emission factor disaggregation by climate and fertiliser (nitrogen) type resulted in an increase in estimated direct emissions of N2O in wet regions, while a significant decrease of estimated emissions was calculated in dry regions. The estimated indirect emissions of N2O decreased in both climatic regions.
Therefore, the results of the sensitivity analysis underline how the allocation method and the IPCC guideline selected significantly affects the estimated impact of CC of the barley production in Araba/Álava.

4.4. Future Research Directions

Even though the study of S. González-García et al. (2016) was focused on the production of animal feed, according to the results reported, a selection of alternative functional units could be proposed in future works since different units could be used in agricultural systems [40]. For example, (i) 1 ha; (ii) 1 t crude protein; and (iii) 1 MJ metabolisable energy. It would also be desirable to study the consequences of implementing the energy allocation system in the environmental assessment of barley production as an alternative or complementary method, based on the low heating value (LHV) of the product and by-product (27 MJ kg−1 and 16 MJ kg−1 for the grain and straw, respectively). However, and as indicated in the PCR of arable crops [18], the allocation could be avoided by introducing a system expansion method. In that case, the avoided production of other bedding material for livestock use could be considered as a consequence of the straw production and, consequently, its environmental impact could be subtracted from the barley production.
The accuracy of the LCA results here could be improved by applying more robust models that require specific regional information in order to be applied, such as temperature, annual precipitation distribution, wind speed, month of fertiliser or pesticide application, soil characterisation (e.g., pH, texture, soil organic matter, etc.), pesticide type, crop type, stage of the development of the crop, and application method [12,34].
Further research could also be directed to include the environmental impacts assessment of the barley production in Araba/Álava under current and future climatic scenarios. In addition, it could help farmers and policy makers establish solutions to mitigate the environmental impact of crop production by adjusting the fertiliser application rate according to fertiliser type and climate region, and to establish adaptation measures through climate change [11,13].
Finally, conventional LCA only considers the emissions of the agricultural products, and not the incomes, such as the carbon sequestration in the products and the net increase in soil organic carbon (SOC). Hence, instead of conventional LCA, a carbon sequestration LCA accounting method should be considered to value the changes in SOC stocks, allowing for the estimate of net emissions instead of gross emissions. Several soil accounting LCA methods could be used, based on user expertise and data availability, as summarised by Goglio et al. (2015) [57].

5. Conclusions

The environmental impacts of barley production in Araba/Álava were evaluated using the LCA approach. For this purpose, the most representative cultivation practices were identified through farmer survey data. This study highlights how the choice of allocation system and IPCC methodology is a key issue when agriculture emissions are estimated. In this regard, the economic allocation increased all the impact categories due to the increase in the percentages attributed to the grain relative to the by-product (straw), as compared to the mass-based allocation method.
The 2019 IPCC Refinement Guidelines allowed for the delivery of more robust estimations of the climate change impact, as compared to the conventional IPCC 2006 methodology. Thus, relative estimates increased in wet regions and decreased in the dry regions by a factor of 1.12% and 0.86%, respectively. The disaggregation of emission factors in the new guidelines provides policy makers with reliable information to establish better fertiliser use guidelines to properly account for nitrogen emissions from barley production.
Fertiliser production, diesel combustion, and N2O direct emissions are the main contributors to GHG emissions. Regarding other environmental impacts analysed, the emissions of water-soluble N and P compounds related to mineral fertiliser applications are the main contributors to PM, TA, TE, and ME. Furthermore, the inclusion of NH3, NOx, NO3, and PO43− in the LCI makes it more accurate.
Finally, the results obtained in the present study, in conjunction with other studies, can help policy makers establish mitigation options for the processes that affect the environmental sustainability of barley production in regions like Spain.

Author Contributions

Conceptualization, Ó.d.H. and C.G.; methodology, Ó.d.H. and P.G.; formal analysis, Ó.d.H., P.G. and A.A.; resources, Ó.d.H., P.G. and A.A.; data curation, Ó.d.H. and P.G.; writing—original draft preparation, Ó.d.H. and P.G.; writing—review and editing, Ó.d.H., P.G., C.G., G.B. and A.A.; visualization, Ó.d.H., P.G., G.B., C.G. and A.A.; project administration, Ó.d.H. and C.G.; funding acquisition, Ó.d.H. and C.G. All authors have read and agreed to the published version of the manuscript.

Funding

This research was founded by the project LIFE16 ENV/ES/287: LIFE AGROGESTOR: “Collective management of crops at the service of environmental programs related to the use and quality of water”.

Institutional Review Board Statement

Not applicable.

Informed Consent Statement

Not applicable.

Data Availability Statement

The study did not report any additional data.

Acknowledgments

The authors would like to acknowledge the work of the three anonymous reviewers in helping us to improve the article.

Conflicts of Interest

The authors declare no conflict of interest.

Appendix A

Table A1. Data inventory for barley production in 17 fields in Araba/Álava that helped to define the case study used in the LCA.
FieldSurfaceYieldNACNPK Mixtures 1ASAN 33%a.i. 2Diesel Consumption
Nohakg ha−1
13.5548004409-24-10; (392) 0.60953.71
23.13500040010-20-6; (400)
10-23-9; (400)
0.06946.16
34.00502536021-6-9; (400) 0.78857.75
43.55716046013-20-06; (400) 0.57190.86
53.656910 13-20-06; (440) 4500.140117.83
63.13780031013-20-06; (440)250 0.41346.96
75.4170004007-10-06; (500) 0.21832.76
82.5758373208-15-15; (500)360 2.53886.61
94.005800 20-10-5, (400) 3600.18075.60
103.59707525013-20-06; (364)230 0.19556.39
112.075600 13-20-06; (440)450 0.271120.93
128.66700030013-20-06; (440)250 0.35442.29
137.99500040013-20-06; (440) 0.35040.69
144.74516940020-07-06; (400) 0.53143.59
152.577200 13-20-06; (400) 4000.31869.29
163.43690036813-20-06; (380) 0.32350.45
175.24624035020-10-05; (400) 0.36943.28
1 Type of NPK mixture applied and the application rate (kg ha−1). 2 a.i.: active ingredient (pesticide application).

References

  1. FAOSTAT. Available online: http://www.fao.org/faostat/en/#data/QC/visualize (accessed on 2 June 2021).
  2. Eurostat. Available online: https://ec.europa.eu/eurostat/databrowser/view/tag00051/default/table?lang=en (accessed on 2 June 2021).
  3. Organo Estadístico Departamental del Gobierno Vasco. Available online: https://www.euskadi.eus/web01-ejeduki/es/contenidos/estadistica/estadistica_rapida_agrario/es_dapa/index.shtml (accessed on 15 June 2021).
  4. Noya, I.; González-García, S.; Bacenetti, J.; Arroja, L.; Moreira, M.T. comparative life cycle assessment of three representative feed cereals production in the Po Valley (Italy). J. Clean. Prod. 2015, 99, 250–265. [Google Scholar] [CrossRef]
  5. ISO 14040 Environmental Management—Life Cycle Assessment—Principles and Framework. 2006. Available online: https://www.iso.org/cms/render/live/en/sites/isoorg/contents/data/standard/03/74/37456.html (accessed on 6 May 2021).
  6. Notarnicola, B.; Sala, S.; Anton, A.; McLaren, S.J.; Saouter, E.; Sonesson, U. The role of life cycle assessment in supporting sustainable agri-food systems: A review of the challenges. J. Clean. Prod. 2017, 140, 399–409. [Google Scholar] [CrossRef]
  7. Tricase, C.; Lamonaca, E.; Ingrao, C.; Bacenetti, J.; Lo Giudice, A. A comparative life cycle assessment between organic and conventional barley cultivation for sustainable agriculture pathways. J. Clean. Prod. 2018, 172, 3747–3759. [Google Scholar] [CrossRef]
  8. Tidåker, P.; Bergkvist, G.; Bolinder, M.; Eckersten, H.; Johnsson, H.; Kätterer, T.; Weih, M. Estimating the environmental footprint of barley with improved nitrogen uptake efficiency—A Swedish scenario study. Eur. J. Agron. 2016, 80, 45–54. [Google Scholar] [CrossRef]
  9. Gan, Y.; Liang, C.; May, W.; Malhi, S.S.; Niu, J.; Wang, X. Carbon footprint of spring barley in relation to preceding oilseeds and n fertilization. Int. J. Life Cycle Assess. 2012, 17, 635–645. [Google Scholar] [CrossRef]
  10. Lovarelli, D.; Garcia, L.R.; Sánchez-Girón, V.; Bacenetti, J. Barley production in Spain and Italy: Environmental comparison between different cultivation practices. Sci. Total Environ. 2020, 707, 135982. [Google Scholar] [CrossRef] [PubMed]
  11. Niero, M.; Ingvordsen, C.H.; Peltonen-Sainio, P.; Jalli, M.; Lyngkjær, M.F.; Hauschild, M.Z.; Jørgensen, R.B. Eco-efficient production of spring barley in a changed climate: A life cycle assessment including primary data from future climate scenarios. Agric. Syst. 2015, 136, 46–60. [Google Scholar] [CrossRef] [Green Version]
  12. Schmidt Rivera, X.C.; Bacenetti, J.; Fusi, A.; Niero, M. The influence of fertiliser and pesticide emissions model on life cycle assessment of agricultural products: The case of Danish and Italian barley. Sci. Total Environ. 2017, 592, 745–757. [Google Scholar] [CrossRef] [PubMed] [Green Version]
  13. Dijkman, T.J.; Birkved, M.; Saxe, H.; Wenzel, H.; Hauschild, M.Z. Environmental impacts of barley cultivation under current and future climatic conditions. J. Clean. Prod. 2017, 140, 644–653. [Google Scholar] [CrossRef] [Green Version]
  14. Suh, S.; Weidema, B.; Schmidt, J.H.; Heijungs, R. Generalized Make and Use Framework for allocation in life cycle assessment. J. Ind. Ecol. 2010, 14, 335–353. [Google Scholar] [CrossRef]
  15. MAPA Sistema de Información Geográfica de Datos Agrarios (SIGA). Available online: https://www.mapa.gob.es/es/agricultura/temas/sistema-de-informacion-geografica-de-datos-agrarios/default.aspx (accessed on 4 June 2021).
  16. IPCC. 2019 Refinement to the 2006 IPCC Guidelines for National Greenhouse Gas Inventories; Calvo Buendia, E., Tanabe, K., Kranjc, A., Baasansuren, J., Fukuda, M., Ngarize, S., Osako, A., Pyrozhenko, Y., Shermanau, P., Federici, S., Eds.; IPCC: Geneva, Switzerland, 2019. [Google Scholar]
  17. Eggleston, S.; Buendia, L.; Miwa, K.; Ngara, T.; Tanabe, K. (Eds.) IPCC Guidelines for National Greenhouse Gas Inventories; IGES: Hayama, Japan, 2006. [Google Scholar]
  18. Environdec Product Category Rules for Arable and Vegetable Crops; Product Category Classification: UN CPC 011, 012, 014, 017, 0191. PCR 2020-07 (VERSION 1.0); EPD International: Stockholm, Sweden, 2020.
  19. Ardente, F.; Cellura, M. Economic allocation in life cycle assessment. J. Ind. Ecol. 2012, 16, 387–398. [Google Scholar] [CrossRef]
  20. Nekazaritza Elikagaien. Behatokia Observatorio Del Sector Agroalimentario Vasco (2009–2014). Departamento de Desarrollo Económico, Sostenibilidad y Medio Ambiente del Gobierno Vasco. Available online: https://www.euskadi.eus/gobierno-vasco/departamento-desarrollo-economico-infraestructuras/ (accessed on 30 August 2021).
  21. Nekazaritza Elikagaien. Behatokia Observatorio Del Sector Agroalimentario Vasco (2015–2020). Departamento de Desarrollo Económico, Sostenibilidad y Medio Ambiente del Gobierno Vasco. Available online: https://www.euskadi.eus/web01-s2ekono/es/contenidos/entidad/entity3ee14da4/es_def/index.shtml (accessed on 30 August 2021).
  22. IDEA. Available online: https://www.idae.es/home (accessed on 25 June 2021).
  23. Life AGROgestor Gestión Colectiva de Cultivos al Servicio de Programas Ambientales Relacionados con el Uso y la Calidad del Agua. Available online: https://www.agrogestor.es/ (accessed on 25 June 2021).
  24. Nemecek, T.; Heil, A.; Huguenin-Elie, O.; Meier, S.; Erzinger, S.; Blaser, S. Life cycle inventories of agricultural production systems. Final Rep. Ecoinvent 2004, 15, 145–146. [Google Scholar]
  25. Althaus, H.-J.; Doka, G.; Dones, R.; Heck, T.; Hellweg, S.; Hischier, R.; Nemecek, T.; Rebitzer, G.; Spielmann, M.; Wernet, G. Overview and Methodology; Final Report Ecoinvent Data v2.0, No. 1; Frischknecht, R., Jungbluth, N., Eds.; Swiss Centre for LCI: Dübendorf, Switzerland, 2007; p. 77. [Google Scholar]
  26. Nemecek, T.; Kägi, T. Life Cycle Inventories of Agricultural Production Systems; Final Report Ecoinvent V2.0 No. 15; Agroscope Reckenholz-Taenikon Research Station ART, Swiss Centre for Life Cycle Inventories: Zurich and Dübendorf, CH, 2007; Available online: Www.Ecoinvent.Ch (accessed on 6 May 2021).
  27. Spielmann, M.; Bauer, C.; Dones, R.; Tuchschmid, M. Transport Services; Ecoinvent Report No. 14; Swiss Centre for Life Cycle Inventories: Dübendorf, Switzerland, 2007. [Google Scholar]
  28. ISO 14044 Environmental Management—Life Cycle Assessment—Requirements and Guidelines. Available online: https://www.iso.org/obp/ui#iso:std:iso:14044:ed-1:v1:en (accessed on 17 June 2021).
  29. Renzulli, P.A.; Bacenetti, J.; Benedetto, G.; Fusi, A.; Ioppolo, G.; Niero, M.; Proto, M.; Salomone, R.; Sica, D.; Supino, S. Life cycle assessment in the cereal and derived products sector. In Life Cycle Assessment in the Agri-Food Sector: Case Studies, Methodological Issues and Best Practices; Notarnicola, B., Salomone, R., Petti, L., Renzulli, P.A., Roma, R., Cerutti, A.K., Eds.; Springer International Publishing: Cham, Switzerland, 2015; pp. 185–249. ISBN 978-3-319-11940-3. [Google Scholar]
  30. Peter, C.; Fiore, A.; Hagemann, U.; Nendel, C.; Xiloyannis, C. Improving the accounting of field emissions in the carbon footprint of agricultural products: A comparison of default IPCC methods with readily available medium-effort modeling approaches. Int. J. Life Cycle Assess. 2016, 21, 791–805. [Google Scholar] [CrossRef] [Green Version]
  31. Zampori, L.; Pant, R. Suggestions for Updating the Organisation Environmental Footprint (OEF) Method. EUR 29682 EN; Publications Office of the European Union: Luxembourg, 2019; ISBN 978-92-76-00654-1. [Google Scholar] [CrossRef]
  32. EMEP/EEA. Air Pollutant Emission Inventory Guidebook 2019—European Environment Agency. Technical Guidance to Prepare National Emission Inventories; EEA Technical Report No9/2009; European Environment Agency: Copenhagen, Denmark, 2019; Available online: https://www.eea.europa.eu/publications/emep-eea-guidebook-2019 (accessed on 6 May 2021).
  33. Prasuhn, V. Erfassung Der PO4-Austräge Für Die Ökobilanzierung SALCA Phosphor; Agroscope Reckenholz-Tänikon: Zurich, Switzerland, 2006. [Google Scholar]
  34. Brentrup, F.; Küsters, J.; Lammel, J.; Kuhlmann, H. Methods to estimate on-field nitrogen emissions from crop production as an input to LCA studies in the agricultural sector. Int. J. Life Cycle Assess. 2000, 5, 349. [Google Scholar] [CrossRef]
  35. Althaus, H.J.; Chudacoff, M.; Hischier, R.; Jungbluth, N.; Osses, M.; Primas, A.A. Life Cycle Inventories of Chemicals; Ecoinvent Report No. 8, v2.0; Swiss Centre of Life Cycle Inventories: Dübendorf, CH, 2007; Available online: Www.Ecoinvent.Org (accessed on 6 June 2021).
  36. Margni, M.; Rossier, D.; Crettaz, P.; Jolliet, O. Life cycle impact assessment of pesticides on human health and ecosystems. Agric. Ecosyst. Environ. 2002, 93, 379–392. [Google Scholar] [CrossRef]
  37. Buratti, C.; Fantozzi, F. Life cycle assessment of biomass production: Development of a methodology to improve the environmental indicators and testing with fiber sorghum energy crop. Biomass Bioenergy 2010, 34, 1513–1522. [Google Scholar] [CrossRef]
  38. Castanheira, É.G.; Dias, A.C.; Arroja, L.; Amaro, R. The environmental performance of milk production on a typical portuguese dairy farm. Agric. Syst. 2010, 103, 498–507. [Google Scholar] [CrossRef]
  39. González-García, S.; Bacenetti, J.; Negri, M.; Fiala, M.; Arroja, L. Comparative environmental performance of three different annual energy crops for biogas production in Northern Italy. J. Clean. Prod. 2013, 43, 71–83. [Google Scholar] [CrossRef]
  40. Roer, A.-G.; Korsaeth, A.; Henriksen, T.M.; Michelsen, O.; Strømman, A.H. The influence of system boundaries on life cycle assessment of grain production in Central Southeast Norway. Agric. Syst. 2012, 111, 75–84. [Google Scholar] [CrossRef]
  41. Bacenetti, J.; Fusi, A.; Negri, M.; Guidetti, R.; Fiala, M. environmental assessment of two different crop systems in terms of biomethane potential production. Sci. Total Environ. 2014, 466–467, 1066–1077. [Google Scholar] [CrossRef] [PubMed]
  42. Mogensen, L.; Kristensen, T.; Nguyen, T.L.T.; Knudsen, M.T.; Hermansen, J.E. Method for calculating carbon footprint of cattle feeds—Including contribution from soil carbon changes and use of cattle manure. J. Clean. Prod. 2014, 73, 40–51. [Google Scholar] [CrossRef]
  43. González-García, S.; Baucells, F.; Feijoo, G.; Moreira, M.T. Environmental performance of sorghum, barley and oat silage production for livestock feed using life cycle assessment. Resour. Conserv. Recycl. 2016, 111, 28–41. [Google Scholar] [CrossRef]
  44. Hauschild, M.; Goedkoop, M.; Guinee, J.; Heijungs, R.; Huijbregts, M.; Jolliet, O.; Margni, M.; De Schryver, A.; Pennington, D.; Pant, R.; et al. Recommendations for Life Cycle Impact Assessment in the European Context—Based on Existing Environmental Impact Assessment Models and Factors (International Reference Life Cycle Data System—ILCD Handbook). EUR 24571 EN; Publications Office of the European Union: Luxembourg, 2011. [Google Scholar]
  45. Commission of the European Union; Joint Research Centre; Institute for Environment and Sustainability; International Reference Life Cycle Data System (ILCD). Handbook: General Guide for Life Cycle Assessment: Provisions and Action Steps; Publications Office: Luxembourg, 2011. [Google Scholar]
  46. Bartzas, G.; Zaharaki, D.; Komnitsas, K. Life cycle assessment of open field and greenhouse cultivation of lettuce and barley. Inf. Process. Agric. 2015, 2, 191–207. [Google Scholar] [CrossRef] [Green Version]
  47. Guinée, J.B.; Huppes, G.; Heijungs, R. Developing an LCA guide for decision support. Environ. Manag. Health 2001, 12, 301–311. [Google Scholar] [CrossRef]
  48. Niero, M.; Ingvordsen, C.H.; Jørgensen, R.B.; Hauschild, M.Z. How to manage uncertainty in future life cycle assessment (LCA) scenarios addressing the effect of climate change in crop production. J. Clean. Prod. 2015, 107, 693–706. [Google Scholar] [CrossRef] [Green Version]
  49. Fedele, A.; Mazzi, A.; Niero, M.; Zuliani, F.; Scipioni, A. Can the life cycle assessment methodology be adopted to support a single farm on its environmental impacts forecast evaluation between conventional and organic production? An italian case study. J. Clean. Prod. 2014, 69, 49–59. [Google Scholar] [CrossRef]
  50. Hamelin, L.; Jørgensen, U.; Petersen, B.M.; Olesen, J.E.; Wenzel, H. Modelling the carbon and nitrogen balances of direct land use changes from energy crops in Denmark: A consequential life cycle inventory. GCB Bioenergy 2012, 4, 889–907. [Google Scholar] [CrossRef]
  51. Bacenetti, J.; Lovarelli, D.; Fiala, M. Mechanisation of organic fertiliser spreading, choice of fertiliser and crop residue management as solutions for maize environmental impact mitigation. Eur. J. Agron. 2016, 79, 107–118. [Google Scholar] [CrossRef]
  52. Hasler, K.; Bröring, S.; Omta, S.W.F.; Olfs, H.-W. Life cycle assessment (LCA) of different fertilizer product types. Eur. J. Agron. 2015, 69, 41–51. [Google Scholar] [CrossRef]
  53. Brentrup, F.; Küsters, J.; Lammel, J.; Barraclough, P.; Kuhlmann, H. environmental impact assessment of agricultural production systems using the life cycle assessment (LCA) methodology II. The application to N fertilizer use in winter wheat production systems. Eur. J. Agron. 2004, 20, 265–279. [Google Scholar] [CrossRef]
  54. Laegreid, M.; Bockman, O.C.; Kaarstad, O. Agriculture, Fertilizers and the Environment; CABI publishing: Wallingford, UK, 1999. [Google Scholar]
  55. Fallahpour, F.; Aminghafouri, A.; Ghalegolab Behbahani, A.; Bannayan, M. The environmental impact assessment of wheat and barley production by using life cycle assessment (LCA) methodology. Environ. Dev. Sustain. 2012, 14, 979–992. [Google Scholar] [CrossRef]
  56. Fusi, A. Improving Environmental Sustainability of the Agro-Food Sector through the Application of the LCA Methodology; Universitá Degli Studi Di Milano: Milano, Italy, 2014. [Google Scholar]
  57. Goglio, P.; Smith, W.N.; Grant, B.B.; Desjardins, R.L.; McConkey, B.G.; Campbell, C.A.; Nemecek, T. Accounting for soil carbon changes in agricultural life cycle assessment (LCA): A review. J. Clean. Prod. 2015, 104, 23–39. [Google Scholar] [CrossRef]
Figure 1. Study area. Dry (D) regions are shown in yellow and Wet (W) regions in blue. Red dots indicate those municipalities where the 17 studied plots are located. These plots exemplify the most representative barley cultivation practices in the province of Araba/Álava. Details about the plots are shown in Table A1 (Appendix A).
Agriculture 11 01005 g001
Figure 2. Inputs and processes, according to life cycle stages, for the barley production system analysed here.
Agriculture 11 01005 g002
Figure 3. Relative contribution (%) of the main processes of barley grain production in Araba/Álava to the LCA impact categories in wet (W) and dry regions (D) under the baseline scenario (IPCC 2006 + mass-based allocation).
Agriculture 11 01005 g003
Figure 4. Climate change impact for the baseline scenario (BS1) under wet (W) and dry (D) climates: (a) kg CO2 eq t−1 and (b) percentages of the relative contributions of the main emissions sources.
Agriculture 11 01005 g004
Figure 5. Results of the sensitivity analysis in terms of (a) climate change impact (kg CO2 eq t−1) and (b) percentage of deviation from the baseline scenario. BS1: Baseline scenario; SC1: IPCC 2006 + economic allocation; SC2: IPCC 2019 + mass allocation; SC3: IPCC 2019 + economic allocation.
Agriculture 11 01005 g005
Figure 6. Climate change impact for SC2 scenario (mass-based allocation + 2019 Refinement) simulated under wet (W) and dry (D) climate: (a) kg CO2 eq t−1 and (b) percentage of relative contribution of the main emissions sources.
Agriculture 11 01005 g006
Table 1. Input and output flows included in the LCI modelling. Functional unit = 1 tonne of harvested barley grain (dry mass of 85%).
CategoryFarmUnitInput RatesEcoinvent Process 1
YieldGrain yield
(0.85 DM)
kg ha−16207
Straw yield 6331
Seed productionBarley seed for sowingkg ha−1228Barley grain, seed, at farm/ES
FertilisersCalcium ammonium nitrate (CAN, 26.5% N)kg ha−1400CAN at a regional storehouse in 25 kg containers, including
an associated transport and packaging material—RER
NPK mixture
(13-20-6)
400NPK mixture is considered as (NPK 15-15-15) (13-20-6 unavailable in the database) at a regional storehouse in 25 kg containers, including an associated transport and packaging material—RER
PesticidesPesticide, unspecifiedkg (a.i.) 2 ha−10.48Market for pesticide, unspecified—GLO
As glyphosate
Agricultural field operationsPloughing + harrowing
+ sowing
kg ha−131.29Diesel, burned in agricultural machinery {GLO}| market, Alloc Rec, S, (kg fuel)
1 kg diesel burned (corresponds to 45 MJ diesel)
Mineral fertilisation
+ weed disease
pest control
29.36
Grain harvesting14.64
1 Process of the Ecoinvent database used for each category. ES, RER, GLO = Spain, Europe, global, respectively. The Ecoinvent database is widely recognised as the largest and most consistent LCI database on the market being used for many life cycle assessments studies [24]. 2 a.i.: Active ingredient.
Table 2. Emission factors from barley production under wet (W) and dry (D) climates. N2O direct and indirect emissions.
Emission FactorIPCC (2006)IPCC (2019)Equations
EF10.01Synthetic fertiliser inputs in (W): 0.016N2O direct emissions:
N2O = (FSN + FCR) × EF1 × 44/28
N2O indirect emissions
N2O(ATD) = (FSN × FracGASF) × EF4 × 44/28
N2O(L) = (FSN + FCR) × FracLEACH × EF5
Other N inputs in (W): 0.006
All N inputs in (D): 0.005
EF40.010.014 (W)–0.005 (D)
EF50.00750.011
FracGASF0.10Ammonium-based: 0.08
Nitrate-based: 0.01
Ammonium nitrate-based: 0.05
FracLEACH-(H)0.300.24
EF1 = Emission factor for N2O emissions from N inputs (kg N2O–N (kg N input)−1); EF4 = emission factor for N2O emissions from atmospheric deposition of N on soils and water surfaces (kg N–N2O (kg NH3–N + NOx–N volatilised)−1); EF5 = emission factor for N2O emissions from N leaching and runoff (kg N2O–N (kg N leached and runoff)−1); FracGASF = fraction of synthetic fertiliser N that volatilises as NH3 and NOx (kg N volatilised (kg of N applied)−1); FracLEACH-(H) = fraction of all N added to/mineralised in managed soils in wet regions (kg N (kg of N additions)−1). FSN = amount of synthetic fertiliser N applied to soils (kg N year−1); FCR = amount of N in crop residues (above-ground and below-ground), returned to soils (kg N year−1); N2O(ATD) = amount of N2O produced from atmospheric deposition of N volatilised from managed soils (kg N2O year−1); N2O(L) = amount of N2O produced from leaching and runoff of N additions to managed soils in regions where leaching/runoff occurs (kg N2O year−1).
Table 3. Emission factors used for the LCA of barley production.
Emission FactorIPCC MethodEmission FactorEquation
NO320061.33 kg NO3 kg−1 N appliedkg NO3 = kg N × FracLEACH
NO320191.06 kg NO3 kg−1 N appliedkg NO3 = kg N × FracLEACH
NH32006–2019CAN-0.017 kg NH3 kg−1 N applied
NPK-0.091 kg NH3 kg−1 N applied
CAN
NPK mixtures
NO2006–2019CAN-0.016 kg NO–N kg−1 N applied
NPK-0.0225 kg NO–N kg−1 N applied
Phosphate (PO43−)2006–2019Pgw = 0.07 kg P ha−1 year−1Leaching to groundwater
Pgw = Pgwl × Fgw
Run-off
Pro = 0.175 kg P ha−1 year−1Pro = Prol × Fro
Fro = 1 + (0.2/80 × P2O5 min)
Pesticide2006–201910% of the active ingredient was released to the air, 8.5% to water, 76.5% to soil,
and the rest (5%) was kept on the crop.
CAN: Calcium ammonium nitrate; FracLEACH-(H): (N losses by leaching/runoff in wet climates), kg N−1 (0.30 and 0.24 for IPCC 2006 and IPCC 2019, respectively); a.i.: pesticide active ingredient; Pgw = quantity of P leached to groundwater (kg P ha−1 year−1); Pgwl = average P leached to groundwater (0.07 kg P ha−1 year−1 for arable land); Fgw = correction factor for fertilisation with slurry (no organic application in the present study); Pro = average P lost through run-off to rivers kg P ha−1; Prol = average quantity of P lost through run-off (0.175 kg P ha−1 year−1 for arable land and with slope ≥3%); Fro = correction factor for fertilisation with mineral and organic P applied (min = P2O5 from mineral fertiliser, kg ha−1).
Table 4. Scenarios established for the sensitivity analysis of barley production.
ScenariosIPCC GuidelinesAllocation MethodClimatic Region
Baseline (BS1)IPCC 2006Mass-based 1Wet and dry
SC1 3IPCC 2006Economic 2Wet and dry
SC2IPCC 2019Mass-basedWet and dry
SC3IPCC 2019EconomicWet and dry
1 Mass based allocation factors: 49.50 and 50.50% for grain and straw, respectively. 2 Economic allocation factors: 89.29 and 10.71% for grain and straw, respectively. 3 SC: Scenario analysis.
Publisher’s Note: MDPI stays neutral with regard to jurisdictional claims in published maps and institutional affiliations.

