
Nitrous Oxide Emission and Crop Yield in Arable Soil Amended with Bottom Ash

 , , and
Abstract
:1. Introduction
2. Materials and Methods
2.1. Experimental Site
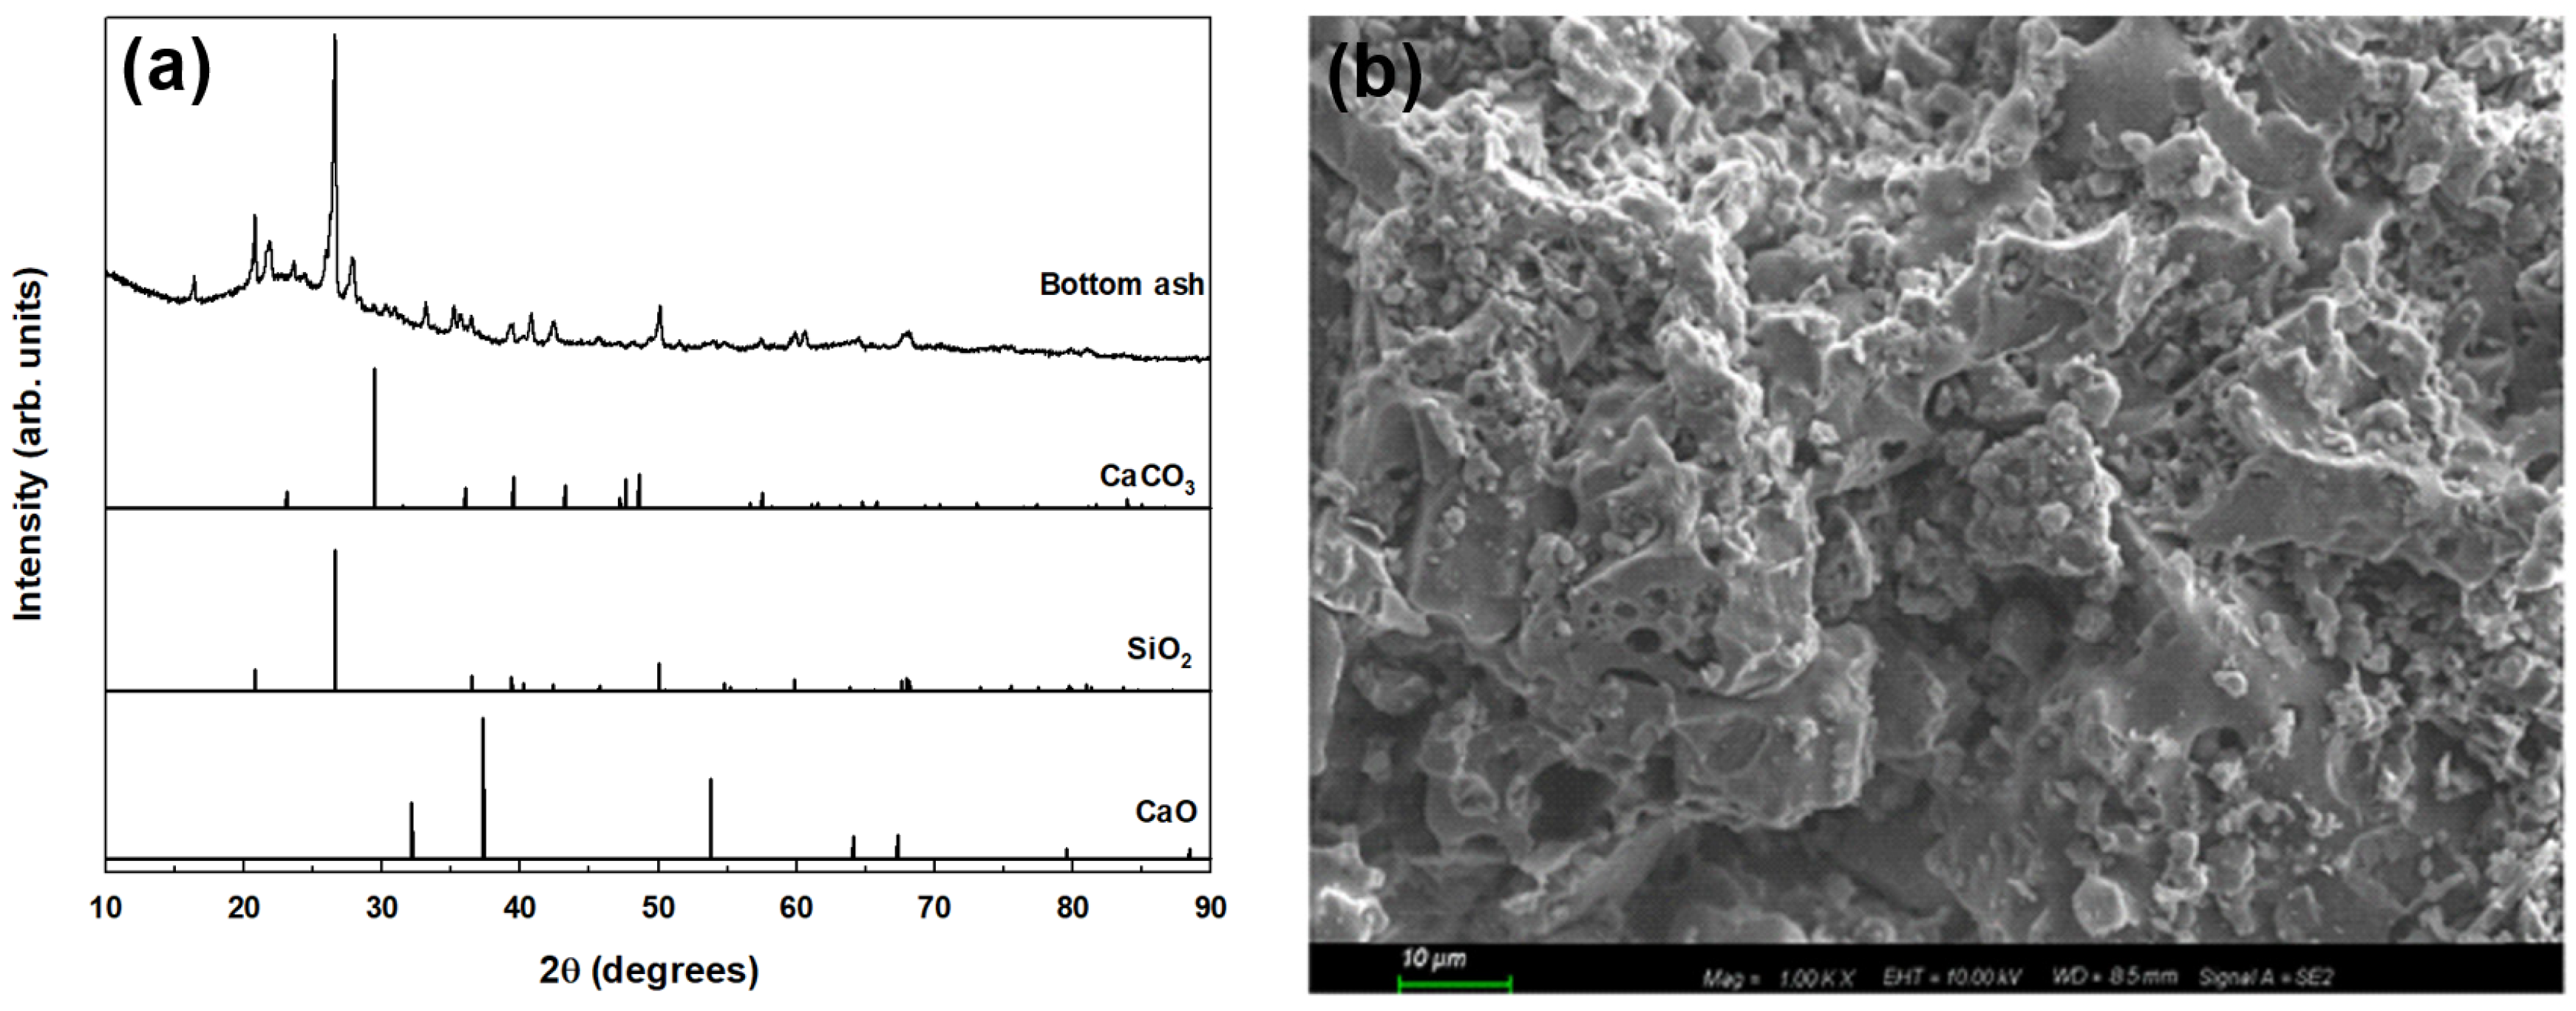
2.2. Characterization of BA
2.3. Experimental Design and Crop Management
2.4. N2O Emission Measurements
2.5. Soil Sampling and Analysis
2.6. Statistical Analysis
3. Results
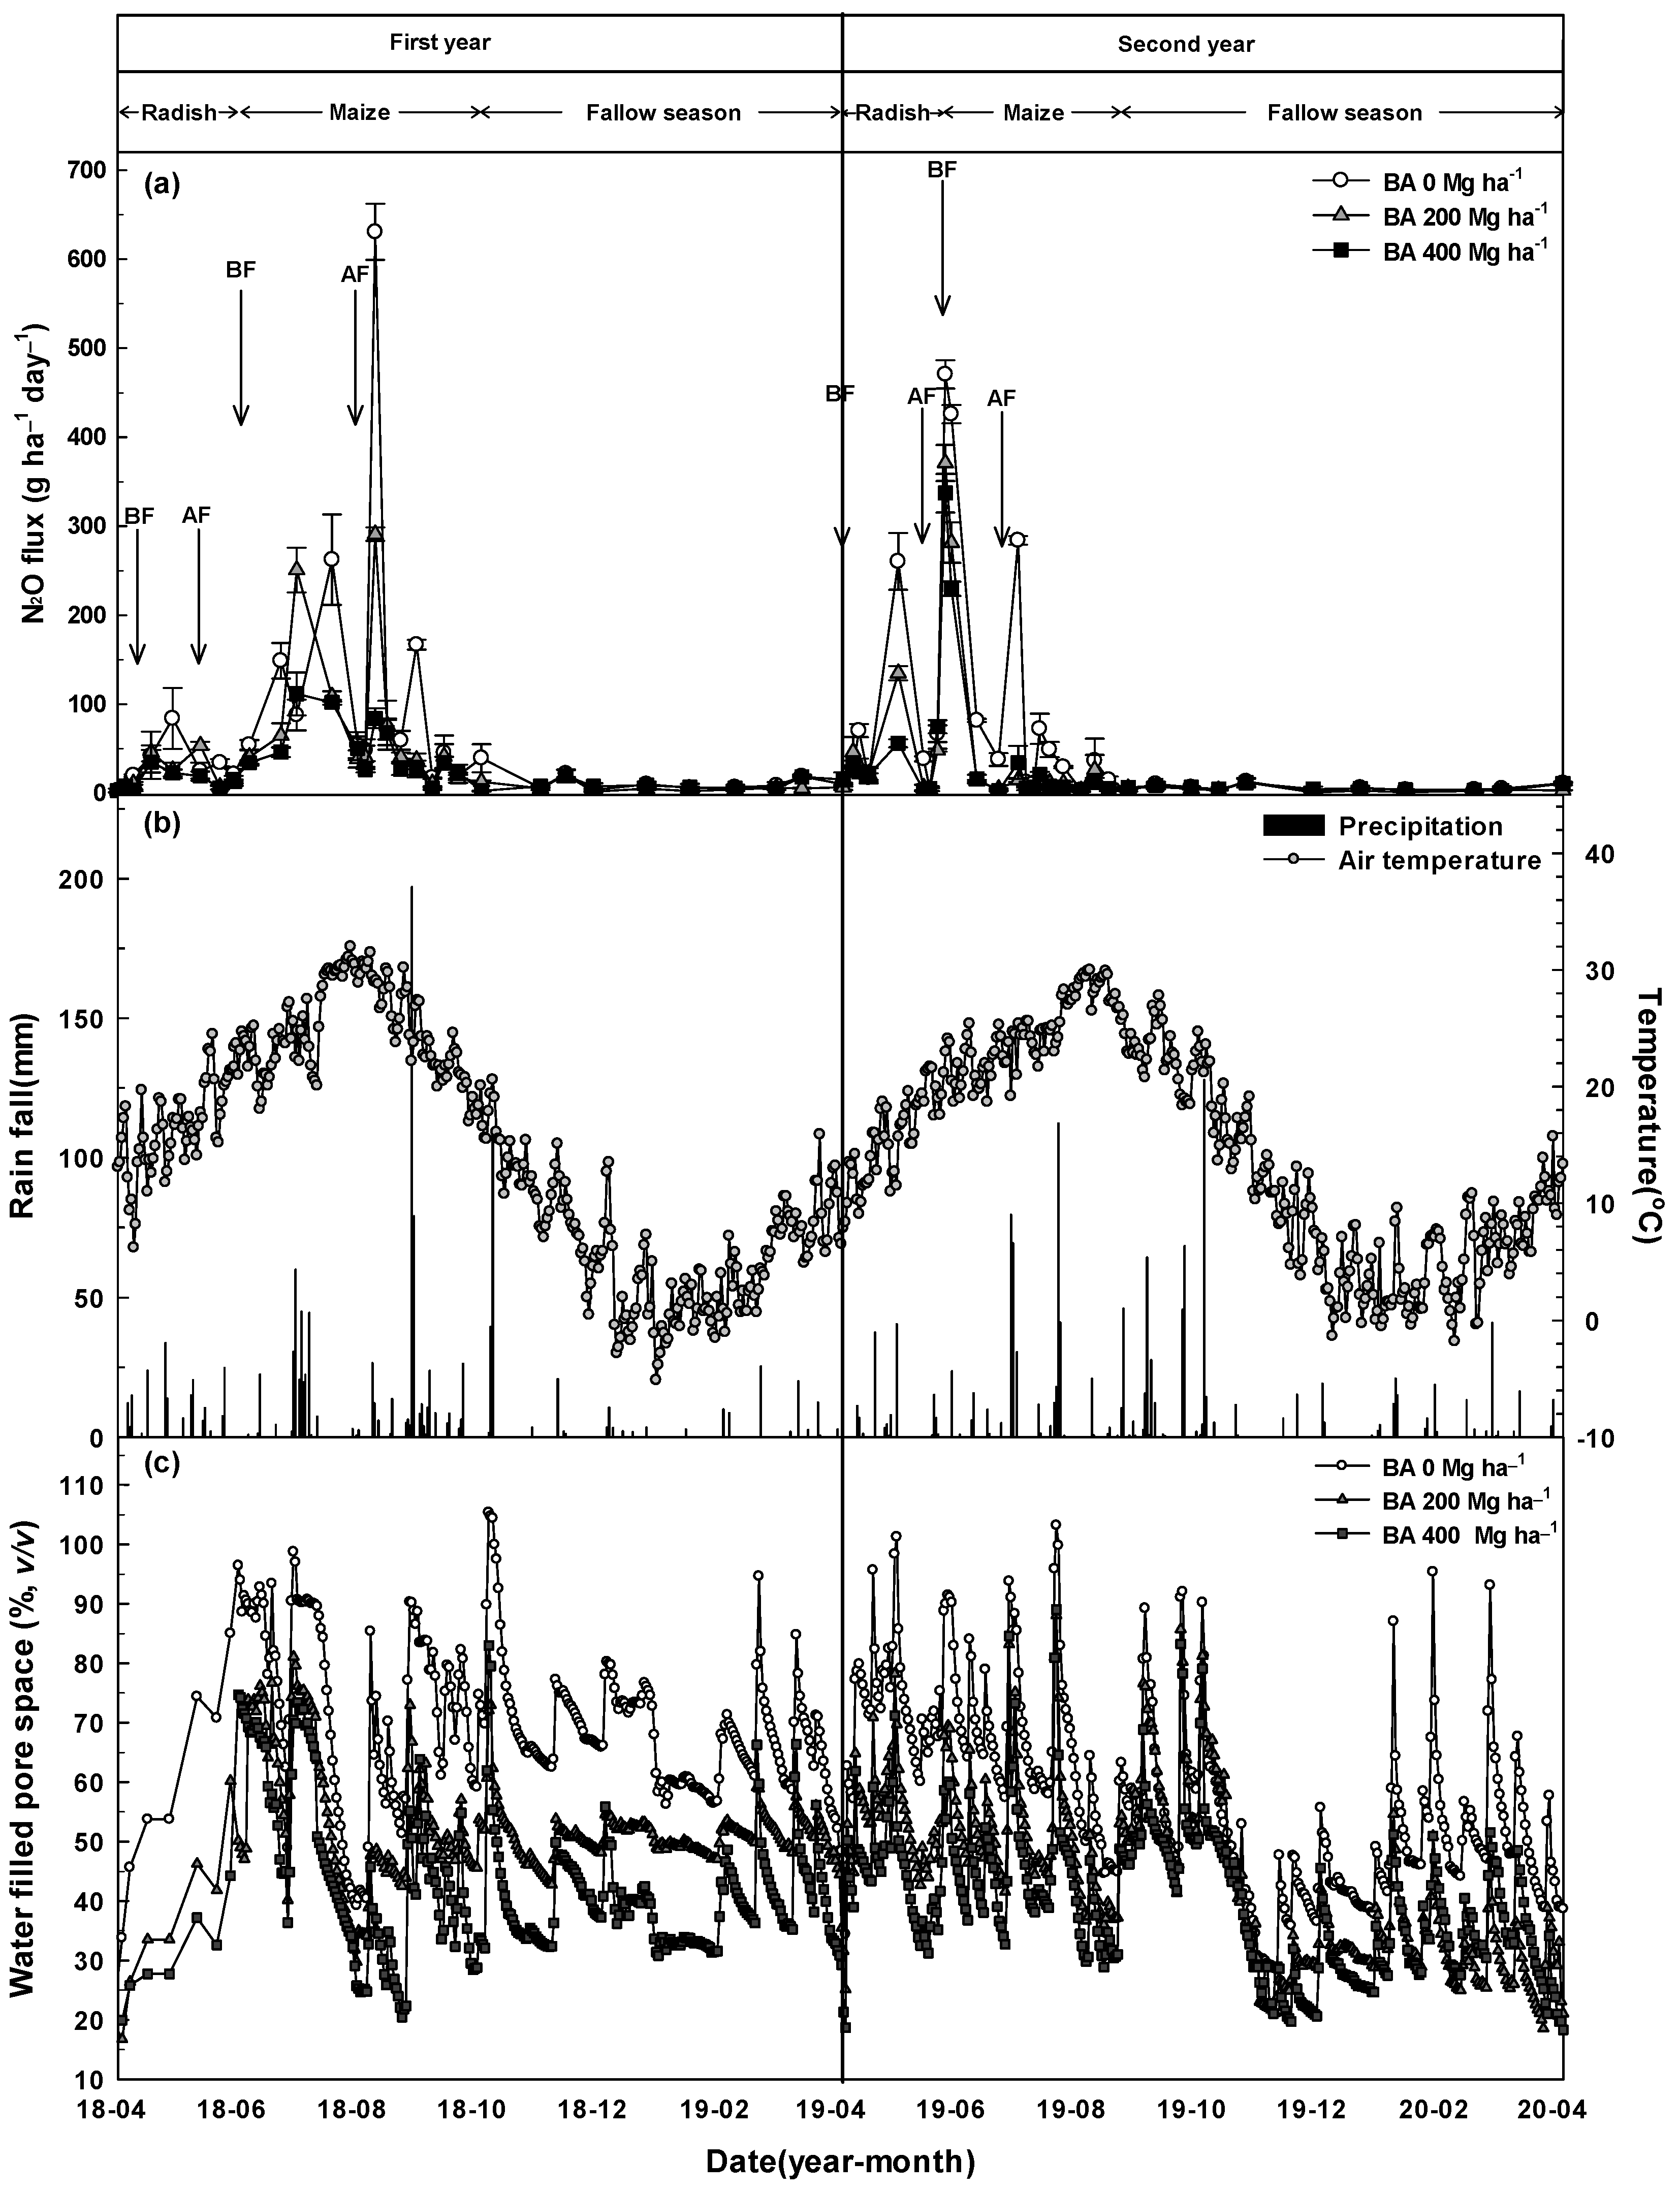
3.1. N2O Flux
3.2. Cumulative N2O Emission
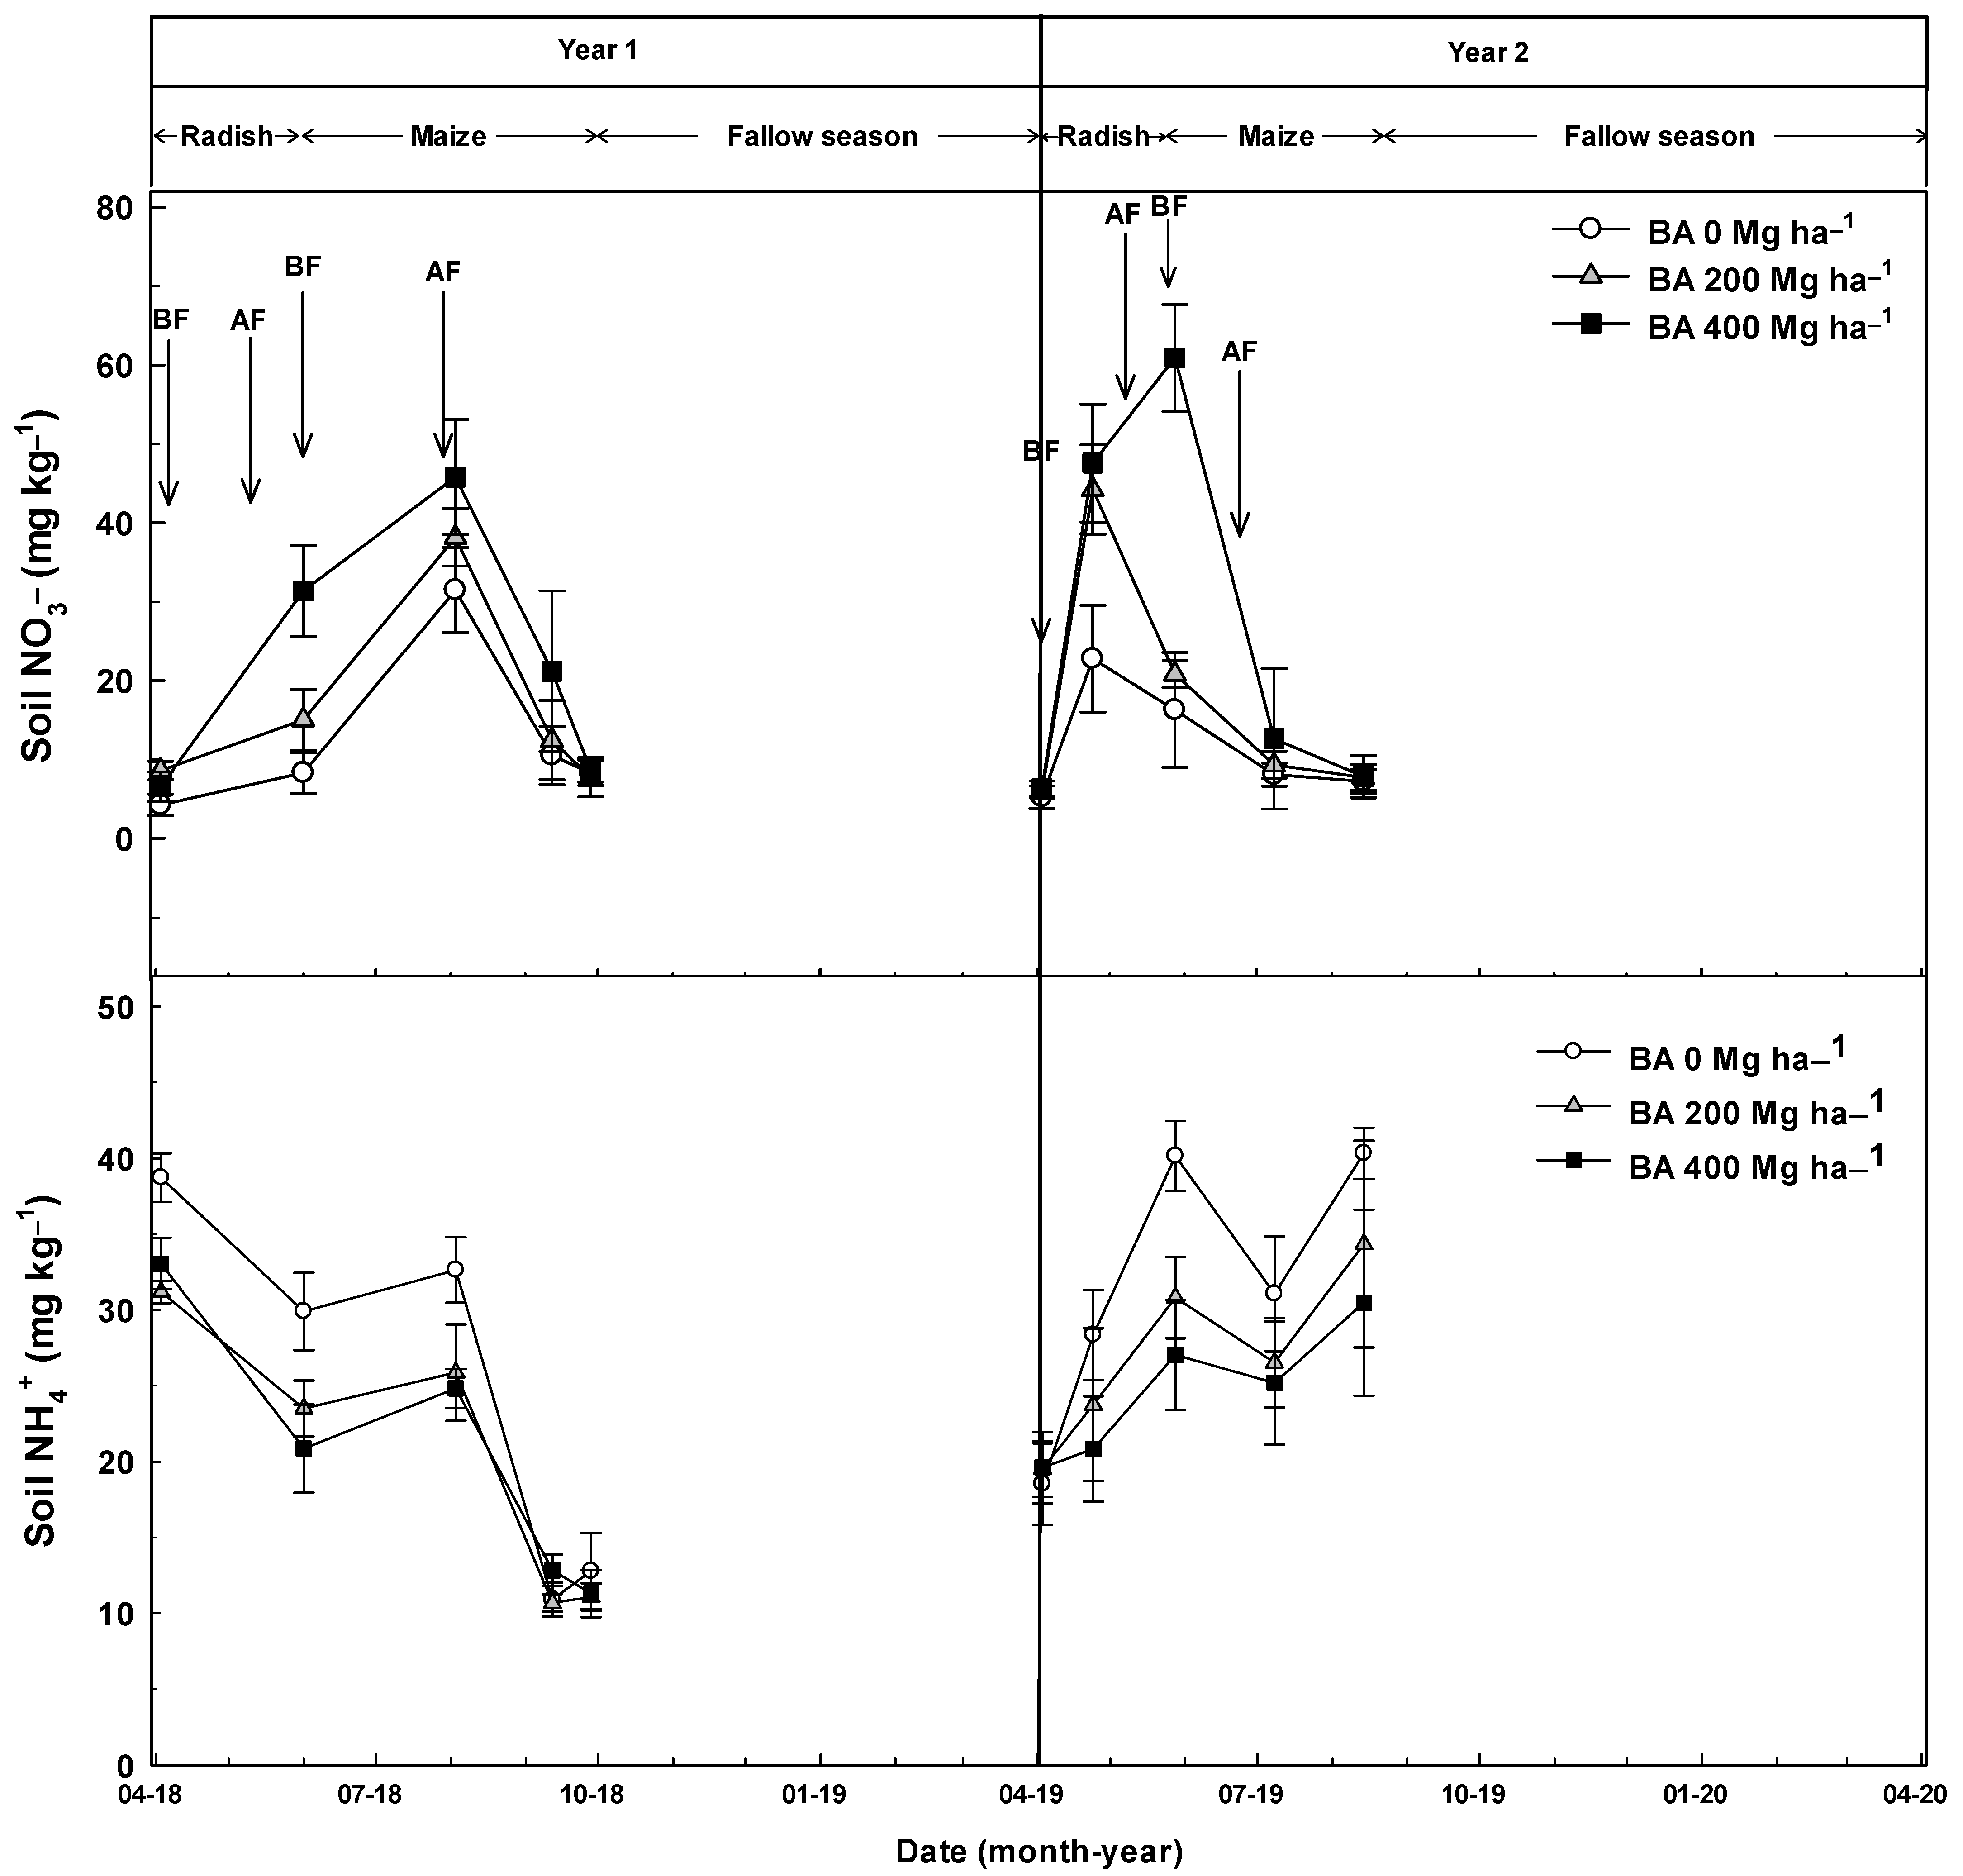
3.3. Changes in the Physical and Chemical Properties of Soil
3.4. Crop Yield and Yield-Scaled N2O Emission
4. Discussion
5. Conclusions
Author Contributions
Funding
Institutional Review Board Statement
Informed Consent Statement
Acknowledgments
Conflicts of Interest
References
- World Meteorological Organization (WMO). WMO Greenhouse Gas Bulletin: The State of Greenhouse Gases in the Atmosphere Based on Global Observations through 2018; WMO: Geneva, Switzerland, 2019; p. 15. [Google Scholar]
- Intergovernmental Panel on Climate Change (IPCC). 2019 Refinement to the 2006 IPCC Guidelines for National Greenhouse Gas Inventories; Core Writing Team, Calvo, E., Guendehou, S., Limmeechokchai, B., Pipatti, R., Rojas, Y., Sturgiss, R., Tanabe, K., Wirth, T., Eds.; IPCC: Geneva, Switzerland, 2019; Volume 5, p. 194. [Google Scholar]
- Lam, S.K.; Suter, H.; Mosier, A.R.; Chen, D. Using nitrification inhibitors to mitigate agricultural N2O emission: A double-edged sword? Glob. Change Biol. 2016, 23, 485–489. [Google Scholar] [CrossRef]
- Butterbach-Bahl, K.; Baggs, E.M.; Dannenmann, M.; Kiese, R.; Zechmeister-Boltenstern, S. Nitrous oxide emissions from soils: How well do we understand the processes and their controls? Philos. Trans. R. Soc. Lond. B 2017, 368, 1–13. [Google Scholar] [CrossRef] [PubMed]
- Westphal, M.; Tenuta, M.; Entz, M.H. Nitrous oxide emissions with organic crop production depends on fall soil moisture. Agric. Ecosyst. Environ. 2018, 254, 41–49. [Google Scholar] [CrossRef]
- Shen, J.P.; Zhang, L.M.; Di, H.J.; He, J.Z. A review of ammonia-oxidizing bacteria and archaea in Chinese soils. Front. Microbiol. 2012, 3, 296. [Google Scholar] [CrossRef] [PubMed] [Green Version]
- Hu, J.; Inglett, K.S.; Clark, M.W.; Inglett, P.W.; Reddy, K.R. Nitrous oxide production and consumption by denitrification in a grassland: Effects of grazing and hydrology. Sci. Total Environ. 2015, 532, 702–710. [Google Scholar] [CrossRef] [PubMed]
- Gregorutti, V.C.; Caviglia, O.P. Nitrous oxide emission after the addition of organic residues on soil surface. Agric. Ecosyst. Environ. 2017, 246, 234–242. [Google Scholar] [CrossRef]
- Kuang, W.; Gao, X.; Gui, D.; Tenuta, M.; Flaten, D.N.; Yin, M.; Zeng, F. Effects of fertilizer and irrigation management on nitrous oxide emission from cotton fields in an extremely arid region of northwestern China. Field Crops Res. 2018, 229, 17–26. [Google Scholar] [CrossRef]
- Dobbie, K.E.; Smith, K.A. The effects of temperature, water-filled pore space and land use on N2O emissions from an imperfectly drained gleysol. Eur. J. Soil Sci. 2001, 52, 667–673. [Google Scholar] [CrossRef]
- Dobbie, K.E.; Smith, K.A. N2O emission factors for agricultural soils in Great Britain: The impact of soil water-filled pore space and other controlling variables. Glob. Chang. Biol. 2003, 9, 204–218. [Google Scholar] [CrossRef]
- Bateman, E.J.; Baggs, E.M. Contribution of nitrification and denitrification to N2O emissions from soils at different water-filled pore space. Biol. Fertil. Soils 2005, 41, 379–388. [Google Scholar] [CrossRef]
- Ruangcharus, C.; Kim, S.U.; Yoo, G.Y.; Choi, E.J.; Kumar, S.; Kang, N.G.; Hong, C.O. Nitrous oxide emission and sweet potato yield in upland soil: Effects of different type and application rate of composted animal manures. Environ. Pollut. 2021, 279, 116892. [Google Scholar] [CrossRef]
- Žurovec, O.; Wall, D.P.; Brennan, F.P.; Krol, D.J.; Forrestal, P.J.; Richards, K.G. Increasing soil pH reduces fertiliser derived N2O emissions in intensively managed temperate grassland. Agric. Ecosyst. Environ. 2021, 311, 107319. [Google Scholar] [CrossRef]
- Russenes, A.L.; Korsaeth, A.; Bakken, L.R.; Dorsch, P. Spatial variation in soil pH controls off-season N2O emission in an agricultural soil. Soil Biol. Biochem. 2016, 99, 36–46. [Google Scholar] [CrossRef]
- Hu, J.; Inglett, K.S.; Wright, A.L.; Clark, M.W.; Reddy, K.R. Nitrous oxide dynamics during denitrification along a hydrological gradient of subtropical grasslands. Soil Use Manag. 2020, 36, 682–692. [Google Scholar] [CrossRef]
- Liu, B.; Frostegård, Å.; Bakken, L.R. Impaired reduction of N2O to N2 in acid soils is due to a posttranscriptional interference with the expression of nosZ. mBio 2014, 5, e01383-14. [Google Scholar] [CrossRef] [PubMed] [Green Version]
- Maeng, J.H.; Kim, T.Y.; Cho, H.N.; Kim, E.Y. Minimizing environmental impact of ash treatment in thermal power plants (II). Kor. Environ. Inst. 2015, 1, 4–12. [Google Scholar]
- Park, S.B.; Jang, Y.I.; Lee, J.; Lee, B.J. An experimental study on the hazard assessment and mechanical properties of porous concrete utilizing coal bottom ash coarse aggregate in Korea. J. Hazard. Mater. 2009, 166, 348–355. [Google Scholar] [CrossRef]
- Chindaprasirt, P.; Jaturapitakkul, C.; Chalee, W.; Rattanasak, U. Comparative study on the characteristics of fly ash and bottom ash geopolymers. Waste Manag. 2009, 29, 539–543. [Google Scholar] [CrossRef]
- Kim, S.U.; Owens, V.N.; Kim, S.Y.; Hong, C.O. Effect of different way of bottom ash and compost application on phytoextractability of cadmium in contaminated arable soil. Appl. Biol. Chem. 2017, 60, 353–362. [Google Scholar] [CrossRef]
- Argriz, C.; Menéndez, E.; Sanjuán, M.A. Effect of mixes made of coal bottom ash and fly ash on the mechanical strength and porosity of Portland cement. Mater. Construc. 2013, 63, 49–64. [Google Scholar]
- Albuquerque, A.R.L.; Angelica, R.S.; Merino, A.; Paz, S.P.A. Chemical and mineralogical characterization and potential use of ash from Amazonian biomasses as an agricultural fertilizer and for soil amendment. J. Clean. Prod. 2021, 295, 126472. [Google Scholar] [CrossRef]
- Phan, N.T.; Sengsingkham, T.; Tiyayon, P.; Maneeintr, K. Utilization of bottom ash for degraded soil improvement for sustainable technology. In IOP Conference Series: Earth and Environmental Science; IOP Publishing: Bristol, UK, 2019; Volume 268, p. 012043. [Google Scholar]
- Maneeintr, K.; Tran, T.T.A.; Kaewmaneewan, W. Bottom ash waste management for soil improvement in Saraburi Province, Thailand. Mater. Sci. Forum 2019, 947, 114–118. [Google Scholar] [CrossRef]
- Kuraz, F.; Alebachew, H.; Sahu, O. Fertibility effect of eucalyptus bottom wood ash on yield and yield components of maize (Zea mays) Ethiopia. J. Adv. Res. Agri. Sci. Tech. 2020, 3, 5–12. [Google Scholar]
- Conen, F.; Smith, K.A. A re-examination of closed flux chamber methods for the measurement of trace gas emissions from soils to the atmosphere. Eur. J. Soil Sci. 1998, 49, 701–707. [Google Scholar] [CrossRef]
- Venterea, R.T.; Bijesh, M.; Dolan, M.S. Fertilizer Source and tillage effects on yield-scaled nitrous oxide emissions in a corn cropping system. J. Environ. Qual. 2011, 40, 1521–1531. [Google Scholar] [CrossRef] [Green Version]
- Allison, L.; Bollen, W.B.; Moodie, C.D. Total carbon. In Methods of Soil Analysis, Part 2; Agronomy Monographs 9; ASA: Madison, WI, USA, 1965; pp. 1346–1366. [Google Scholar]
- Cox, M.S. The lancaster soil test method as an alternative to the mehlich 3 soil test metho. Soil Sci. 2001, 166, 484–489. [Google Scholar] [CrossRef]
- Searle, P.L. The berthlot or indophenol reaction and its use in the analysis chemistry of nitrogen. Analyst 1984, 109, 549–565. [Google Scholar] [CrossRef]
- Wolf, B. Determination of nitrate, nitrite, and ammonium nitrogen rapid photometric determination in soil and plant extracts. Ind. Eng. Chem. Anal. Ed. 1944, 16, 446–447. [Google Scholar] [CrossRef]
- Abed, R.M.M.; Lam, P.; de Beer, D.; Stief, P. High rates of denitrification and nitrous oxide emission in arid biological soil crusts from the Sultanate of Oman. ISME J. 2013, 7, 1862–1875. [Google Scholar] [CrossRef]
- Hu, J.; VanZomeren, C.M.; Inglett, K.S.; Wright, A.L.; Clark, M.W.; Reddy, K.R. Greenhouse gas emissions under different drainage and flooding regimes of cultivated peatlands. J. Geophys. Res. Biogeo. 2017, 122, 3047–3062. [Google Scholar] [CrossRef]
- Kim, D.G.; Mishurov, M.; Kiely, G. Effect of increased N use and dry periods on N2O emission from a fertilized grassland. Nutri. Cycl. Agroecosyst. 2010, 88, 397–410. [Google Scholar] [CrossRef]
- Hu, J.; Liao, X.; Vardanyan, L.G.; Huang, Y.; Inglett, K.S.; Wright, A.L.; Reddy, K.R. Duration and frequency of drainage and flooding events interactively affect soil biogeochemistry and N flux in subtropical peat soils. Sci. Total Environ. 2020, 727, 138740. [Google Scholar] [CrossRef]
- Hall, S.J.; Matson, P.A.; Roth, P.M. NOx Emissions from soil: Implications for air quality modeling in agricultural regions. Annu. Rev. Energy Environ. 1996, 21, 311–346. [Google Scholar] [CrossRef]
- Pihlati, M.; Syvasalo, E.; Simojoki, A.; Esala, M.; Regina, K. Contribution of nitrification and denitrification to N2O production in peat, clay and loamy sand soils under different soil moisture conditions. Nutr. Cycl. Agroecosyst. 2004, 70, 135–141. [Google Scholar] [CrossRef]
- Carvalho, M.T.M.; Madari, B.E.; Bastiaans, L.; Oort, P.A.J.; Leal, W.G.O.; Souza, D.M.; Santos, R.C.; Matsushige, I.; Maia, A.H.N.; Heinemann, A.B.; et al. Nitrogen availability, water-filled pore space, and N2O-N fluxes after biochar application and nitrogen fertilization. Pesq. Agropec. Bras. 2016, 51, 1203–1212. [Google Scholar] [CrossRef] [Green Version]
- Yanai, Y.; Toyota, K.; Okazaki, M. Effects of charcoal addition on N2O emissions from soil resulting from rewetting air-dried soil in short-term laboratory experiments. Soil Sci. Plant Nutr. 2007, 53, 181–188. [Google Scholar] [CrossRef]
- Cayuela, M.L.; Sanchez-Monedero, M.A.; Roig, A.; Hanley, K.; Enders, A.; Lehmann, J. Biochar and denitrification in soils: When, how much and why does biochar reduce N2O emissions? Sci. Rep. 2013, 3, 1732. [Google Scholar] [CrossRef] [PubMed] [Green Version]
- Hu, J.; Inglett, K.S.; Wright, A.L.; Reddy, K.R. Nitrous Oxide Production and Reduction in Seasonally-Flooded Cultivated Peatland Soils. Soil Sci. Soc. Am. J. 2016, 80, 783. [Google Scholar] [CrossRef]
- He, J.Z.; Shen, J.P.; Zhang, L.M.; Zhu, Y.G.; Zheng, Y.M.; Xu, M.G.; Di, H. Quantitative analyses of the abundance and composition of ammonia-oxidizing bacteria and ammonia-oxidizing archaea of a Chinese upland red soil under long-term fertilization practices. Environ. Microbiol. 2007, 9, 2364–2374. [Google Scholar] [CrossRef]
- Shen, J.; Treu, R.; Wang, J.; Nicholson, F.; Bhogal, A.; Thorman, R. Modeling nitrous oxide emissions from digestate and slurry applied to three agricultural soils in the United Kingdom: Fluxes and emission factors. Environ. Pollut. 2018, 243, 1952–1965. [Google Scholar] [CrossRef]
- Bakken, L.R.; Bergaust, L.; Liu, B.; Frostegård, A. Regulation of denitrification at the cellular level: A clue to the understanding of N2O emissions from soils. Philos. Trans. R. Soc. Lond. B Biol. Sci. 2012, 367, 1226–1234. [Google Scholar] [CrossRef] [PubMed] [Green Version]
- Hu, H.W.; Zhang, L.M.; Dai, Y.; Di, H.J.; He, J.Z. pH-dependent distribution of soil ammonia oxidizers across a large geographical scale as revealed by high-throughput pyrosequencing. J. Soils Sediments 2013, 13, 1439–1449. [Google Scholar] [CrossRef]
- Sylvia, D.M.; Hartel, P.G.; Fuhrmann, J.J.; Zubber, D.A. Principles and Applications of Soil Microbiology, 2nd ed.; Pearson Education, Inc.: London, UK, 2005. [Google Scholar]
- Chapuis-Lardy, L.; Wrage, N.; Metay, A.; Chotte, J.L.; Bernoux, M. Soils, a sink for N2O? A review. Glob. Change Biol. 2007, 13, 1–17. [Google Scholar] [CrossRef]
- Barton, L.; Gleeson, D.B.; Maccarone, L.D.; Zúñiga, L.P.; Murphy, D.V. Is liming soil a strategy for mitigating nitrous oxide emissions from semi-arid soils? Soil Biol. Biochem. 2013, 62, 28–35. [Google Scholar] [CrossRef]
- Shaaban, M.; Peng, Q.; Lin, S.; Wu, Y.; Zhao, J.; Hu, R. Nitrous oxide emission from two acidic soils as affected by dolomite application. Soil Res. 2014, 52, 841–848. [Google Scholar] [CrossRef]
- Cárcer, P.S.; Sinaj, S.; Santonja, M.; Fossati, D.; Jeangros, B. Long-term effects of crop succession, soil tillage and climate on wheat yield and soil properties. Soil Tillage Res. 2019, 190, 209–219. [Google Scholar] [CrossRef]
- Büchi, L.; Wendling, M.; Amossé, C.; Jeangros, B.; Sinaj, S.; Charles, R. Long and short term changes in crop yield and soil properties induced by the reduction of soil tillage in a long term experiment in Switzerland. Soil Tillage Res. 2017, 174, 120–129. [Google Scholar] [CrossRef]
- Pittelkow, C.M.; Liang, X.; Linquist, B.A.; van Groenigen, K.J.; Lee, J.; Lundy, M.E.; van Gestel, N.; Six, J.; Venterea, R.T.; van Kessel, C. Productivity limits and potentials of the principles of conservation agriculture. Nature 2015, 517, 365–368. [Google Scholar] [CrossRef]
- Pittelkow, C.M.; Linquist, B.A.; Lundy, M.E.; Liang, X.; van Groenigen, K.J.; Lee, J.; van Gestel, N.; Six, J.; Venterea, R.T.; van Kessel, C. When does no-till yield more? global meta-analysis. Field Crops Res. 2015, 183, 156–168. [Google Scholar] [CrossRef] [Green Version]
- Geisseler, D.; Horwath, W.R.; Joergensen, R.G.; Ludwig, B. Pathways of nitrogen utilization by soil microorganisms—A review. Soil Biol. Biochem. 2011, 42, 2058–2067. [Google Scholar] [CrossRef]
- Kuzyakov, Y. Priming effects: Interactions between living and dead organic matter. Soil Biol. Biochem. 2010, 42, 1363–1371. [Google Scholar] [CrossRef]
- Dotaniya, M.L.; Meena, V.D. Rhizosphere effect on nutrient availability in soil and its uptake by plants: A review. Proc. Natl. Acad. Sci. Ind. Sect. B Biol. Sci. 2014, 85, 1–12. [Google Scholar] [CrossRef]
- Giuseppe, B.; Ruisi, P.; Rees, R.M. An assessment of factors controlling N2O and CO2 emissions from crop residues using different measurement approaches. Biol. Fertil. Soils 2017, 53, 547–561. [Google Scholar]
- Markfoged, R.; Nielsen, L.P.; Nyord, T.; Ottosen, L.D.M.; Revsbech, N.P. Transient N2O accumulation and emission caused by O2 depletion in soil after liquid manure injection. Eur. J. Soil Sci. 2011, 62, 541–550. [Google Scholar] [CrossRef]
- Qin, S.; Wang, Y.; Hu, C.; Oenema, O.; Li, X.; Zhang, Y.; Dong, W. Yield-scaled N2O emissions in a winter wheat–summer corn double-cropping system. Atmos. Environ. 2012, 55, 240–244. [Google Scholar] [CrossRef]


| Ph (1:5 H2O) | Electrical Conductivity (ds·m−1) | Bulk Density (g·cm−3) | Organic Matter (g·kg−1) | Total Nitrogen (g·kg−1) | Available Phosphate (mg·kg−1) | NH4 (mg·kg−1) | NO3 (mg·kg−1) | Soil Texture |
|---|---|---|---|---|---|---|---|---|
| 5.47 ± 0.25 | 0.35 ± 0.15 | 1.26 ± 0.12 | 16.4 ± 0.18 | 1.05 ± 0.15 | 215 ± 20 | 5.1 ± 0.14 | 2.9 ± 0.12 | Silt loam |
| pH (1:5, KCl) | Electrical Conductivity (dS·m−1) | Total Carbon (g·kg−1) | Total Nitrogen (g·kg−1) | Total Phosphorus (mg·kg−1) | SiO2 (%) | CaCO3 (%) | CaO (%) | Surface Area (m2·g−1) | Porosity (%) |
|---|---|---|---|---|---|---|---|---|---|
| 9.3 ± 0.19 | 1.4 ± 0.09 | 6.6 ± 0.4 | 0.9 ± 0.06 | 130 ± 17 | 60 ± 1.4 | 39 ± 0.9 | 1 ± 0.06 | 10.1 ± 0.12 | 58 ± 3.4 |
| Source of Variation | Application Rate (R) | Year (Y) | R × Y |
|---|---|---|---|
| Df | 2 | 1 | 2 |
| Cumulative N2O emission during radish growing season | <0.001 | <0.001 | 0.0232 |
| Cumulative N2O emission during maize growing season | <0.001 | <0.001 | 0.0166 |
| Cumulative N2O emission during entire year | <0.001 | NS | NS |
| Averaged bulk density | <0.001 | <0.001 | NS |
| Averaged water-filled pore space during radish growing season | <0.001 | <0.001 | <0.001 |
| Averaged water-filled pore space during maize growing season | <0.001 | NS | NS |
| Averaged water-filled pore space during entire year | <0.001 | NS | NS |
| Soil pH | <0.001 | NS | NS |
| Electrical conductivity | NS | NS | NS |
| Organic matter | NS | <0.001 | NS |
| Total nitrogen | NS | <0.001 | NS |
| Av. P2O5 | NS | <0.001 | NS |
| Exchangeable K | NS | NS | NS |
| Exchangeable Ca | NS | NS | NS |
| Exchangeable Mg | NS | NS | NS |
| Bulk density | <0.001 | <0.001 | NS |
| Ammonium (NH4+) in soil | 0.0224 | <0.001 | NS |
| Nitrate (NO3−) in soil | <0.001 | NS | NS |
| Radish yield | NS | <0.001 | NS |
| Maize yield * | NS | NS | NS |
| Radish yield-scaled N2O emission | <0.001 | <0.001 | NS |
| Maize yield-scaled N2O emission | 0.0015 | NS | NS |
| Total yield-scaled N2O emission | <0.001 | NS | NS |
| Bottom Ash Application Rate (Mg/ha) | Cumulative N2O Emission during Radish Growing Season (kg·ha−1) | Cumulative N2O Emission during Maize Growing Season (kg·ha−1) | Cumulative N2O Emission during Entire Year (kg·ha−1) | ||||
|---|---|---|---|---|---|---|---|
| Year 1 | Year 2 | Year 1 | Year 2 | Year 1 | Year 2 | Year Mean | |
| 0 | 2.3 a | 4.7 a | 14.6 a | 9.9 a | 19.5 | 16.0 | 17.7 a |
| 200 | 1.6 ab | 2.6 b | 9.9 b | 4.5 b | 12.9 | 8.0 | 10.4 b |
| 400 | 1.0 b | 1.5 c | 6.3 c | 4.0 b | 9.2 | 6.9 | 8.0 c |
| Rate mean 1 | 13.8 A | 10.3 A | - | ||||
| Application Rate (Mg·ha−1) | Averaged WFPS during the Radish Growing Season (%) | Averaged WFPS during the Maize Growing Season (%) | Averaged WFPS during the Entire Year (%) | ||||||
|---|---|---|---|---|---|---|---|---|---|
| Year 1 | Year 2 | Year 1 | Year 2 | Year Mean | Year 1 | Year 2 | Year Mean | ||
| 0 | 54.9 a | 71.0 a | 73.1 | 66.6 | 69.9 a | 71.9 | 68.5 | 70.2 a | |
| 200 | 34.7 b | 53.0 b | 55.0 | 51.6 | 53.3 b | 53.6 | 52.3 | 52.9 b | |
| 400 | 29.3 b | 43.3 c | 47.3 | 44.7 | 46.0 b | 46.1 | 44.5 | 45.3 b | |
| Rate mean 1 | - | 58.5 A | 54.3 A | - | 57.2 A | 55.1 A | - | ||
| BA Application Rate (Mg·ha−1) | pH | Electrical Conductivity (dS/m) | Organic Matter (g/kg) | Total Nitrogen (g/kg) | AV. P2O5 (mg/kg) | Exchangeable Cations (cmolc·kg−1) | Bulk Density (g/cm3) | |||
|---|---|---|---|---|---|---|---|---|---|---|
| K | Ca | Mg | ||||||||
| Year mean | 0 | 5.5 b | 0.6 a | 18.8 a | 1.16 a | 277 a | 0.57 a | 5.38 a | 1.77 a | 1.17 a |
| 200 | 5.9 a | 0.6 a | 19.0 a | 1.09 a | 278 a | 0.58 a | 5.47 a | 1.82 a | 1.04 b | |
| 400 | 5.8 a | 0.7 a | 19.9 a | 1.16 a | 285a | 0.58 a | 5.44 a | 1.82 a | 1.01 b | |
| Bottom Ash Rate (Mg·ha−1) | Year Mean | |
|---|---|---|
| Radish yield | 0 | 1.51 a |
| 200 | 1.43 a | |
| 400 | 1.49 a | |
| Maize yield | 0 | 5.26 a |
| 200 | 5.35 a | |
| 400 | 5.14 a | |
| Radish yield-scaled N2O emission (kg·N2O·Mg−1 radish) | 0 | 3.16 a |
| 200 | 1.90 b | |
| 400 | 1.01 c | |
| Maize yield-scaled N2O emission (kg·N2O·Mg−1 maize) | 0 | 2.61 a |
| 200 | 1.41 b | |
| 400 | 1.11 b | |
| Total yield-scaled N2O emissions (kg·N2O·Mg−1 radish + maize) | 0 | 2.49 a |
| 200 | 1.39 b | |
| 400 | 0.99 b |
Publisher’s Note: MDPI stays neutral with regard to jurisdictional claims in published maps and institutional affiliations. |
© 2021 by the authors. Licensee MDPI, Basel, Switzerland. This article is an open access article distributed under the terms and conditions of the Creative Commons Attribution (CC BY) license (https://creativecommons.org/licenses/by/4.0/).
Share and Cite
Hur, D.-Y.; Kim, S.-U.; Park, H.-C.; Kim, K.-K.; Son, H.-J.; Lee, K.-M.; Kim, Y.-J.; Hong, C.-O. Nitrous Oxide Emission and Crop Yield in Arable Soil Amended with Bottom Ash. Agriculture 2021, 11, 1012. https://0-doi-org.brum.beds.ac.uk/10.3390/agriculture11101012
Hur D-Y, Kim S-U, Park H-C, Kim K-K, Son H-J, Lee K-M, Kim Y-J, Hong C-O. Nitrous Oxide Emission and Crop Yield in Arable Soil Amended with Bottom Ash. Agriculture. 2021; 11(10):1012. https://0-doi-org.brum.beds.ac.uk/10.3390/agriculture11101012
Chicago/Turabian StyleHur, Do-Yeong, Sung-Un Kim, Hyeon-Cheol Park, Keun-Ki Kim, Hong-Ju Son, Kwang-Min Lee, Yu-Jin Kim, and Chang-Oh Hong. 2021. "Nitrous Oxide Emission and Crop Yield in Arable Soil Amended with Bottom Ash" Agriculture 11, no. 10: 1012. https://0-doi-org.brum.beds.ac.uk/10.3390/agriculture11101012