1. Introduction
Lignin is a complex aromatic polymer in the cell wall, which increases with plant maturity development. It consists of phenylpropane units [
1], filling the gaps between cellulose and hemicellulose similarly to resin [
2]. In addition, it is known that lignin content provides structural strength and rigidity for plant cell walls.
Few animal species have been reported with the ability of lignin degradation except termites and longicorn; interestingly, buffalos have recently been found to have the ability to degrade lignin. Xu and Zhong found that when ingesting the same forage with high fiber and low protein, buffalo showed higher dry mater intake and stronger growth performance than cattle. By conducting comparative experiments between buffalo and cattle, they reported that buffalo could degrade lignin efficiently but cattle cannot [
3]; however, the studies focusing on this area are scarce. In rumen, lignin limits microbial enzymatic access to lignocellulose, which affects roughage digestibility [
4] and closely disturbs the utilization extent. When the lignin content decreases, the dry matter digestibility rate significantly increases [
5] because the nature of lignin’s inhibits microbial enzymatic activity [
6].
Lignin’s main monomers are coniferyl alcohol (G),
ρ-coumaryl alcohol (H) and sinapyl alcohol (S), and when formed by polymerization they become G-type, H-type and S-type lignin, respectively [
7]. In the lignin-macromolecules complex, which originated from different classes, lignin bonds with C-C and C-O intermolecular bonds in a random pattern [
8]. Hence, monomer variances resulted in widely different inter-unit bonds, such as β-O-4 and β-1 and biphenyl [
9,
10].
Although lignin is considered a critical limiting factor for cell-wall digestibility [
11], the variations in cell-wall digestibility cannot be attributed solely to lignin content. In addition to the lignin concentration, monomer composition was a critical factor affecting fiber degradation in animal digestibility studies. However, few trials have evaluated the contribution of lignin types in altering forage utilization. During forage maturation, lignin composition in the cell wall shifts from G-type to S-type and was identified as a typical marker of cell-wall maturation. A previous study had reported that a lower S/G ratio in the Populus family was linked to a higher extent of xylose released by diluted acid hydrolysis [
12]. Jung tested various forage maize and also proved that lower S monomer components were mainly related to more milk and meat production [
13]. Through previous studies using Arabidopsis mutant [
14], transgenic alfalfa [
15] and the biomimetic cell wall model [
16], it was reported that G-type and S-type lignin could alter cell-wall digestibility by affecting cellulolytic enzymes activity and rumen microbes action. However, Fontaine put forward a completely different opinion that the S-type content is positively correlated with maize digestibility [
17]. In Arabidopsis plant tissues, the abundance of S-type lignin plays a more important role in glucose production [
18].
Various roughage contains different lignin composition, which is closely linked with ruminant production. However, few reports discussed the composition of the lignin monomer and its linkage to roughage utilization. Thus, we hypothesized that the lignin monomer composition is a leading marker affecting the fiber fractions’ degradation of roughage. The present study aimed to explore the functional relationship between lignin monomer composition and ruminal fiber fractions degradation in water buffalo by using different roughage sources, which may establish a novel approach for evaluating roughage’s nutritional value.
2. Materials and Methods
2.1. Animal and Roughage Treatment
Three non-pregnant, non-lactating fistulated female water buffaloes (Nili-Ravi × Mediterranean, five years old, 480 ± 20 kg) bred in Jingniu Husbandry Co., Ltd., buffalo farm (Hubei, Jingmen, China) were used in this experiment. The buffaloes were fed separately with Total Mixed Ration (TMR) in order to prevent them from the interference of other animals, and they were allowed access to water freely. All animals had been well adapted to stable feeding. Eight types of roughage (rice straw, bracts, maize stalks, peanut vine, sweet potato vine, rice husk, maize silage and vinasse) were used in a completely randomized design. Each type of dried roughage was placed in 63 nylon bags (the size of the nylon bags is 12 cm long and 8 cm wide, and the pore sizes are 53 μm). Twenty-one nylon bags of each roughage were placed into the rumen of each buffalo 1 h before morning feeding at 6:00 a.m., following the principle of placing at the same time. The retention time of nylon bags in the rumen was 4 h, 8 h, 16 h, 24 h, 36 h, 48 h and 72 h after placing the bag. Three nylon bags of each roughage were taken out at each specific times. After being taken out, the nylon bags were washed, dried at 65 °C to constant weight and the chemical compositions were determined. A control test that only placed empty nylon bags without samples into the rumen was performed in order to correct the sample’s experimental error.
2.2. Sample Analyses
In order to analyze the fiber content in roughage. Eight types of roughage (rice straw, bracts, maize stalks, peanut vine, sweet potato vine, rice husk, maize silage and vinasse) were analyzed for neutral detergent fiber (NDF), acid detergent fiber (ADF), cellulose (CEL) and hemicellulose (HC) based on the method revised by AOAC, and HC and CEL were estimated as NDF-ADF and ADF-ADL, respectively [
19]. Samples were pretreated with α-amylase before NDF determination, and the samples were exclusive of residual ash.
The escape rate of bag sample was calculated as follows [
20,
21].
The corrected weight was calculated as follows.
The degradation amount (D) of a nutrient at a certain time point (g) was calculated as follows:
where Bn is the content of a nutrient in the residue of the control test (%), Rw is the weight of residue at this culture time point (g) and Rn is the content of a nutrient in residue at this culture time point (%).
The degradation rate (Dr) of a nutrient at a certain time point (%) was calculated as follows.
The effective degradability (ED) of feed ingredients was calculated as follows:
where a is the fast degradation part of the tested feed (%), b is the slow degradation part of the tested feed (%), c is the degradation rate of the slow degradation part of tested feed (h
−1) and k is the rumen flow rate of feed to be tested (h
−1) (0.025/h
−1 was adopted in this test).
2.3. Pyrolysis-Gas Chromatography/Mass Spectrometry (Py-GC-MS)
Eight types of roughage (rice straw, bracts, maize stalks, peanut vine, sweet potato vine, rice husk, maize silage and vinasse) were analyzed for lignin composition by Py-GC-MS [
22]. The amount of 4.25 mg sample of each roughage was placed in a platinum cup on a FRONTIER 3030D pyrolyzer (Frontier Laboratories Ltd, Fukushima, Japan), and pyrolysis temperature was adjusted to 500 °C [
23]. After that, the samples were separated on a capillary column (25 m × 250 μm × 0.25 μm), and 5% Phenyl Methyl Silox was melted on the surface and then inserted in the pyrolysis outlet that was adjusted at 325 °C using helium as a carrier gas. The GC program time lasted for 40.5 min and begun with an initial temperature of 45 °C, followed by 8 h at 220 °C and, finally, the temperature increased to 280 °C. The MS program was operated at an ion source temperature of 230 °C and EM voltage of 2.141 kV, and the mass ranged from 33 to 550
m/
z. The compounds were classified according to the experimental spectrum and the database map comparison. Moreover, the analysis considered the isomeric lignin monomers that had more than a single analog and were structurally similar and clustered as the same monomer. The final contents of G, S and H lignin monomers were obtained.
2.4. DNA Extraction, Sequencing of Microbial Diversity, Sequencing Data Analysis
To avoid samples disturbance with forage, a total of six rumen contents samples named Rumen0.1, Rumen0.2, Rumen0.3, Rumen0.4, Rumen0.5 and Rumen0.6 were collected after 24 h fasting of three fistulated buffalo; two samples were collected from each buffalo rumen (“Rumen” means the samples from buffalo rumen; in order to prevent the interference from forages microorganisms, sampling should be carried out before feeding. “0” means fasting. The last digit represents the numbering of samples. The DNA of microorganisms in rumen content was extracted according to DNeasy PowerSoil Kit 100 manufactured by QIAGEN. The bacterial 16S rRNA V3-V4 genes were amplified by PCR using the forward primer 27F (5′-AGRGTTTGATYNTGGCTCAG-3′) and the reverse primer 1492R (5′-TASGGHTACCTTGTTASGACTT-3′). PCR amplification was performed in a total reaction volume of 30 μL, which contained 15 μL buffer, 0.6 μL Tks Gflex DNA Polymerase (1.25 U/μL), 1 μL of each primer (5 pmol/μL) and 1 μL template DNA. PCR was set up as follows: an initial denaturation step for 5 min at 95 °C, followed by 30 cycles of denaturation at 95 °C for 30 s, annealing at 50 °C for 30 s and extension at 72 °C for 1 min and a final extension step at 72 °C for 7 min. After purification, quantification and homogenization to create a sequence library, the marker gene was sequenced using the Illumina MiSeq 300PE sequencing platform and a single-molecule real-time sequencing method. All the procedures mentioned above were completed by Oebiotech Technology Co., Ltd. (Shanghai, China).
After completing Illumina MiSeq platform sequencing, the raw data were exported, and then Trimmomatic (version 0.35) [
24] was used to remove low-quality data. After that, Flash (version 1.2.11) [
25] was used to splice the qualified double-ended raw data in the previous step. The maximum overlap used during sequence splicing is 200 bp in order to obtain a complete paired end sequence. split_libraries (version 1.8.0) [
26] in QIIME was used to remove the sequence containing N base as a paired-end sequence, and it removes the sequence with a single base repeat greater than 8 and also removes the sequence with length less than 200 bp to obtain clean tags sequence. UCHIME (version 2.4.2) software [
26] was used to remove the chimera in the clean tags and for obtaining the valid tags for subsequent OTU division. Valid tags were clustered into operational taxonomic units (OTUs) at 97% similarity using the Vsearch (version 2.4.2) [
27].
2.5. Cluster of Orthologous Groups of Proteins (COG) and Kyoto Encyclopedia of Genes and Genomes (KEGG) Analysis
2.6. Isolation of Lignin Degradation Microorganisms
The rumen content is taken out and stored immediately in an anaerobic condition of 39 °C and returned to the laboratory. The enrichment medium of lignin-degrading bacteria constitutes the following: 165 mL/L phosphate-buffered mineral salts medium A: (per liter) (NH4)2SO4, 3.0 g, NaCl, 6.0 g, KH2PO4, 3.0 g, CaCl2·2H2O, 0.4 g, MgSO4·7H2O, 0.6 g; 165 mL/L phosphate-buffered mineral salts medium B: (per liter) K2HPO4·3H2O, 4.0 g, 5 g/L sodium lignosulfonate; 170 mL/L rumen fluid: supernatant fluid of rumen content that was filtered with four layers of gauze and centrifuged at 9000× g at 4 °C for 10 min, then stored in −20 °C, 0.5 mg/L copper sulfate, 1.0 g/L tryptone, 1.0 g/L yeast extract. Screening medium consisted of the following: 165 mL/L phosphate-buffered mineral salts medium A, 165 mL/L phosphate-buffered mineral salts medium B and 5.0 g/L sodium lignosulfonate. The enriched cultures were transferred to a screening medium grown at 39 °C in anaerobic conditions. For 10 d, three successive transfers were performed, after which the cultures were streaked onto Luria Broth (LB) agar in order to obtain pure cultures.
2.7. Statistical Analysis
We analyzed the chemical composition and degradation characteristics of samples using a t-test with SPSS 19.0. The Pearson correlation coefficient in SPSS 19.0 was used to evaluate the correlation between lignin composition and fiber fractions degradation. Due to the fact that all correlations were linear, a multiple regression linear model was established. The multiple regression prediction model was defined as y = a + b1x1 + b2x2 + b3x3 + ··· + bmxm, where y is NDFD, ADFD, CELD, HCD and ADLD; a is the random error constant; b is the independent variable coefficient; and x is H content, S content, G content, S/G ratio, H/G ratio, H/S ratio, (G+S+H) content, G/(G+S+H) ratio, S/(G+S+H) ratio and H/(G+S+H) ratio. The regression equation was obtained by stepwise regression of the above model variables with SPSS 19.0. Statistical significance was set at p < 0.05 (significant difference) and p < 0.01 (extremely significant difference).
3. Results
3.1. Scanned Information of Lignin Monomers of Eight Kinds of Roughage
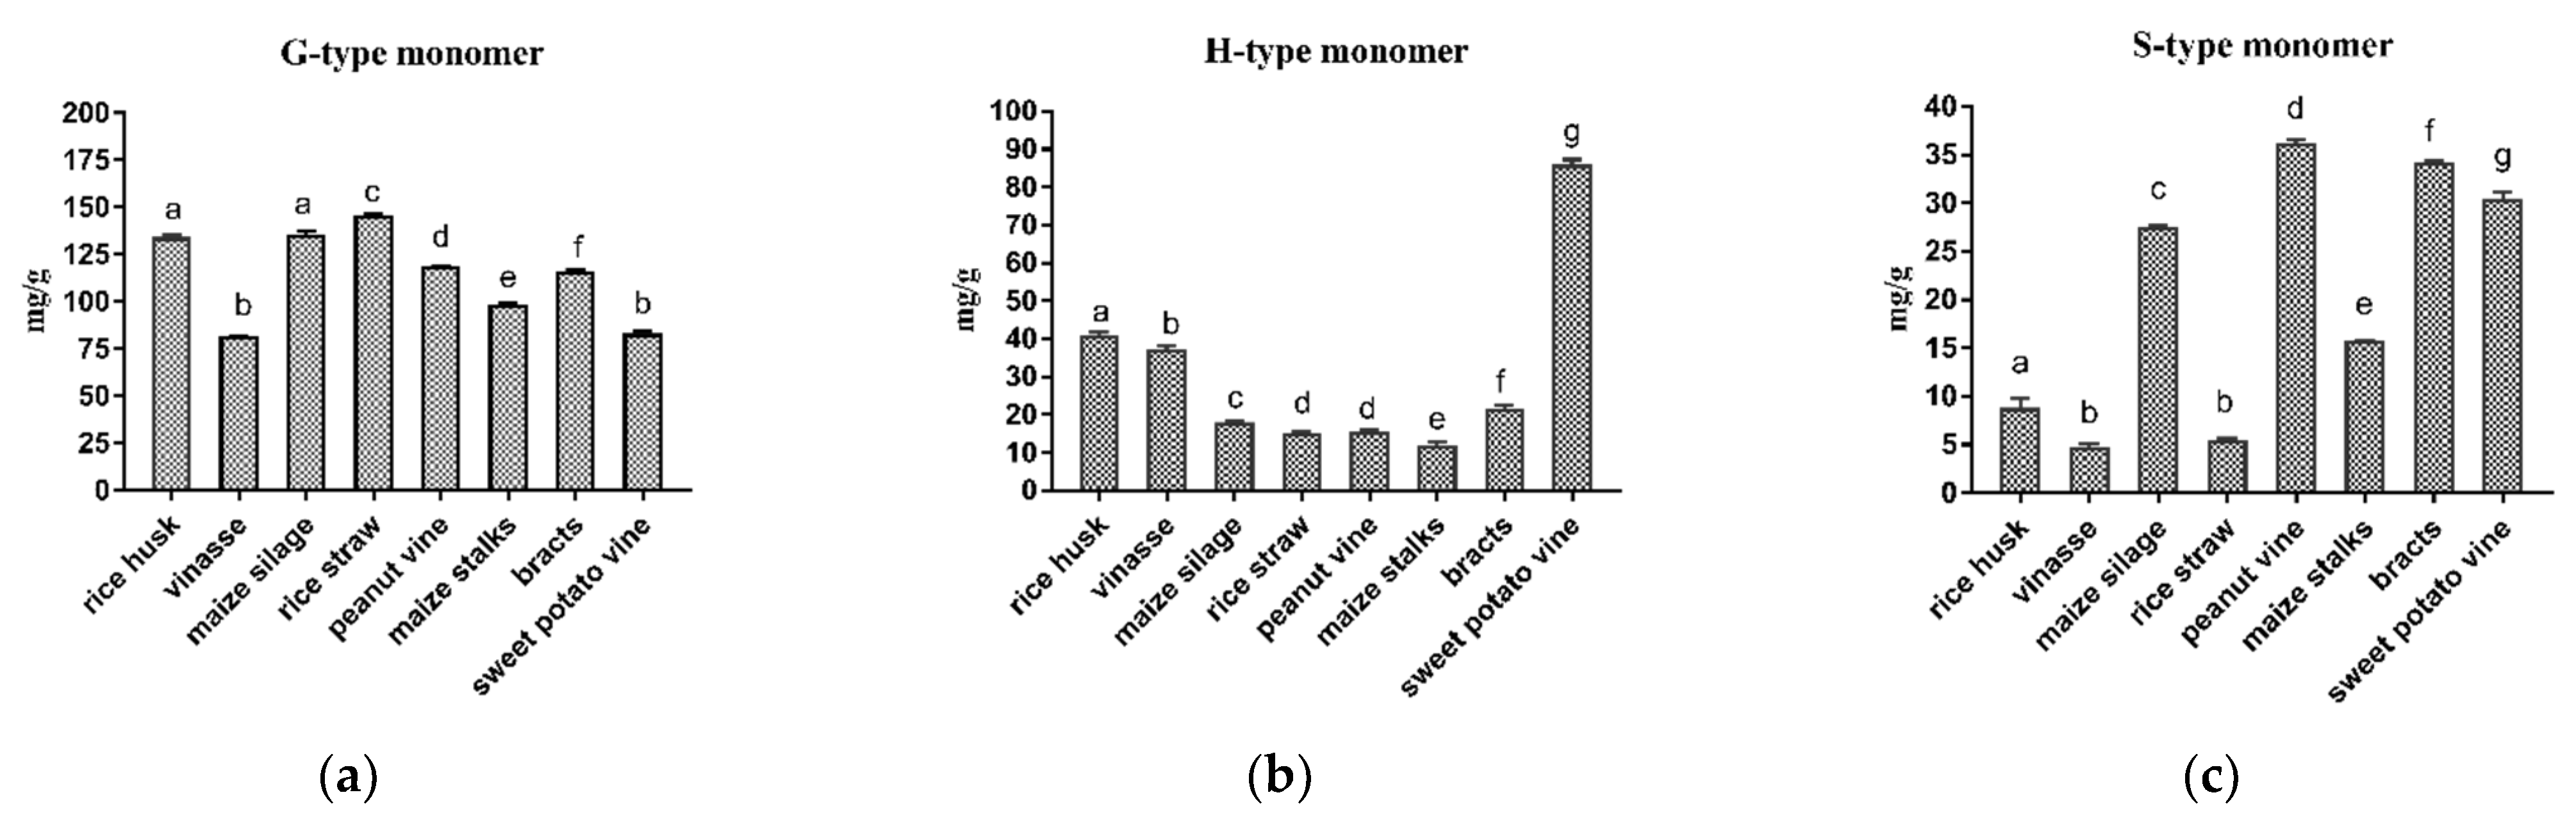
As shown in
Figure 1, the lignin monomer analysis reported that all the tested roughages contained three lignin monomers; G, S and H.
The higher G monomer types were as follows: rice straw, maize silage, rice husk, peanut vine, bracts, maize stalks, sweet potato vine and vinasse, respectively. For H monomer, the arrangement from rich to poor was as follows: sweet potato vine, rice husk, vinasse, bracts, maize silage, peanut vine, rice straw and maize stalks. Moreover, The higher S monomer types were peanut vine, bracts, sweet potato vine, maize silage, maize stalks, rice husk, rice straw and vinasse. For all tested roughages, G type was the most abundant monomer among other lignin classes, except sweet potato vine, which contained H unit more than G unit, which was the most abundant class in grass crops. Therefore, both S/G and H/G ratios were the highest for sweet potato vines and the lowest for the straw.
3.2. The Fiber Fraction Digestibility among Different Roughage Sources
As presented in
Table 1,
Table 2,
Table 3,
Table 4 and
Table 5, among the tested roughages for the effective degradability of NDF, ADF, ADL, CEL and HC fractions, rice husk was the lowest type. However, both sweet potato vine and bracts recorded the highest effective degradability of NDF (NDFD) and effective degradability of ADF (ADFD) coefficients. Moreover, the effective degradability of CEL (CELD) of sweet potato vine was the highest among the eight roughages; the highest effective degradability of HC (HCD) was in peanut vine, and the highest effective degradability of ADL (ADLD) was in peanut vine and maize silage, respectively.
3.3. Correlation between Lignin Composition and Rumen Digestibility of Fiber
As shown in
Table 6, there was no significant correlation between the H-type lignin, G-type lignin content and the NDFD, ADFD, CELD and HCD. There was no significant correlation between G-type lignin and ADLD. However, there was a highly significant positive correlation between the S-type lignin content and all the measured coefficients of NDFD, ADFD, CELD, HCD and ADLD. S, S/G and S/(G+S+H) showed a significant positive correlation with NDFD, ADFD, CELD and HCD, although H/S significantly correlated negatively. ADLD was negatively linked to H, H/G, H/S and H/(G+S+H), and it was positively linked to S-type lignin content and S/(G+S+H).
3.4. Multiple Regression Model among Lignin Composition and Fiber Fractions Degradation
The fiber-fractions’ degradation could be predicted using stepwise regression through the model presented in
Table 7. The essence of stepwise regression is to establish an “optimal” multiple linear regression model; thus, only the monomers representing “x” that have a significant impact on the fiber fractions degradation are retained, and other monomers representing “x” that have no significant impact are excluded. Therefore, the monomers representing “x” in different models are different. The ADLD model could explain the degradation (R
2) of 0.758, followed by HCD (0.709), ADFD (0.678), NDFD (0.628) and CELD (0.620). According to these models, the factors affecting fiber fractions degradation could accurately describe and predict the ruminal digestibility of different forages with a similar approach.
3.5. Composition of Rumen Microorganisms
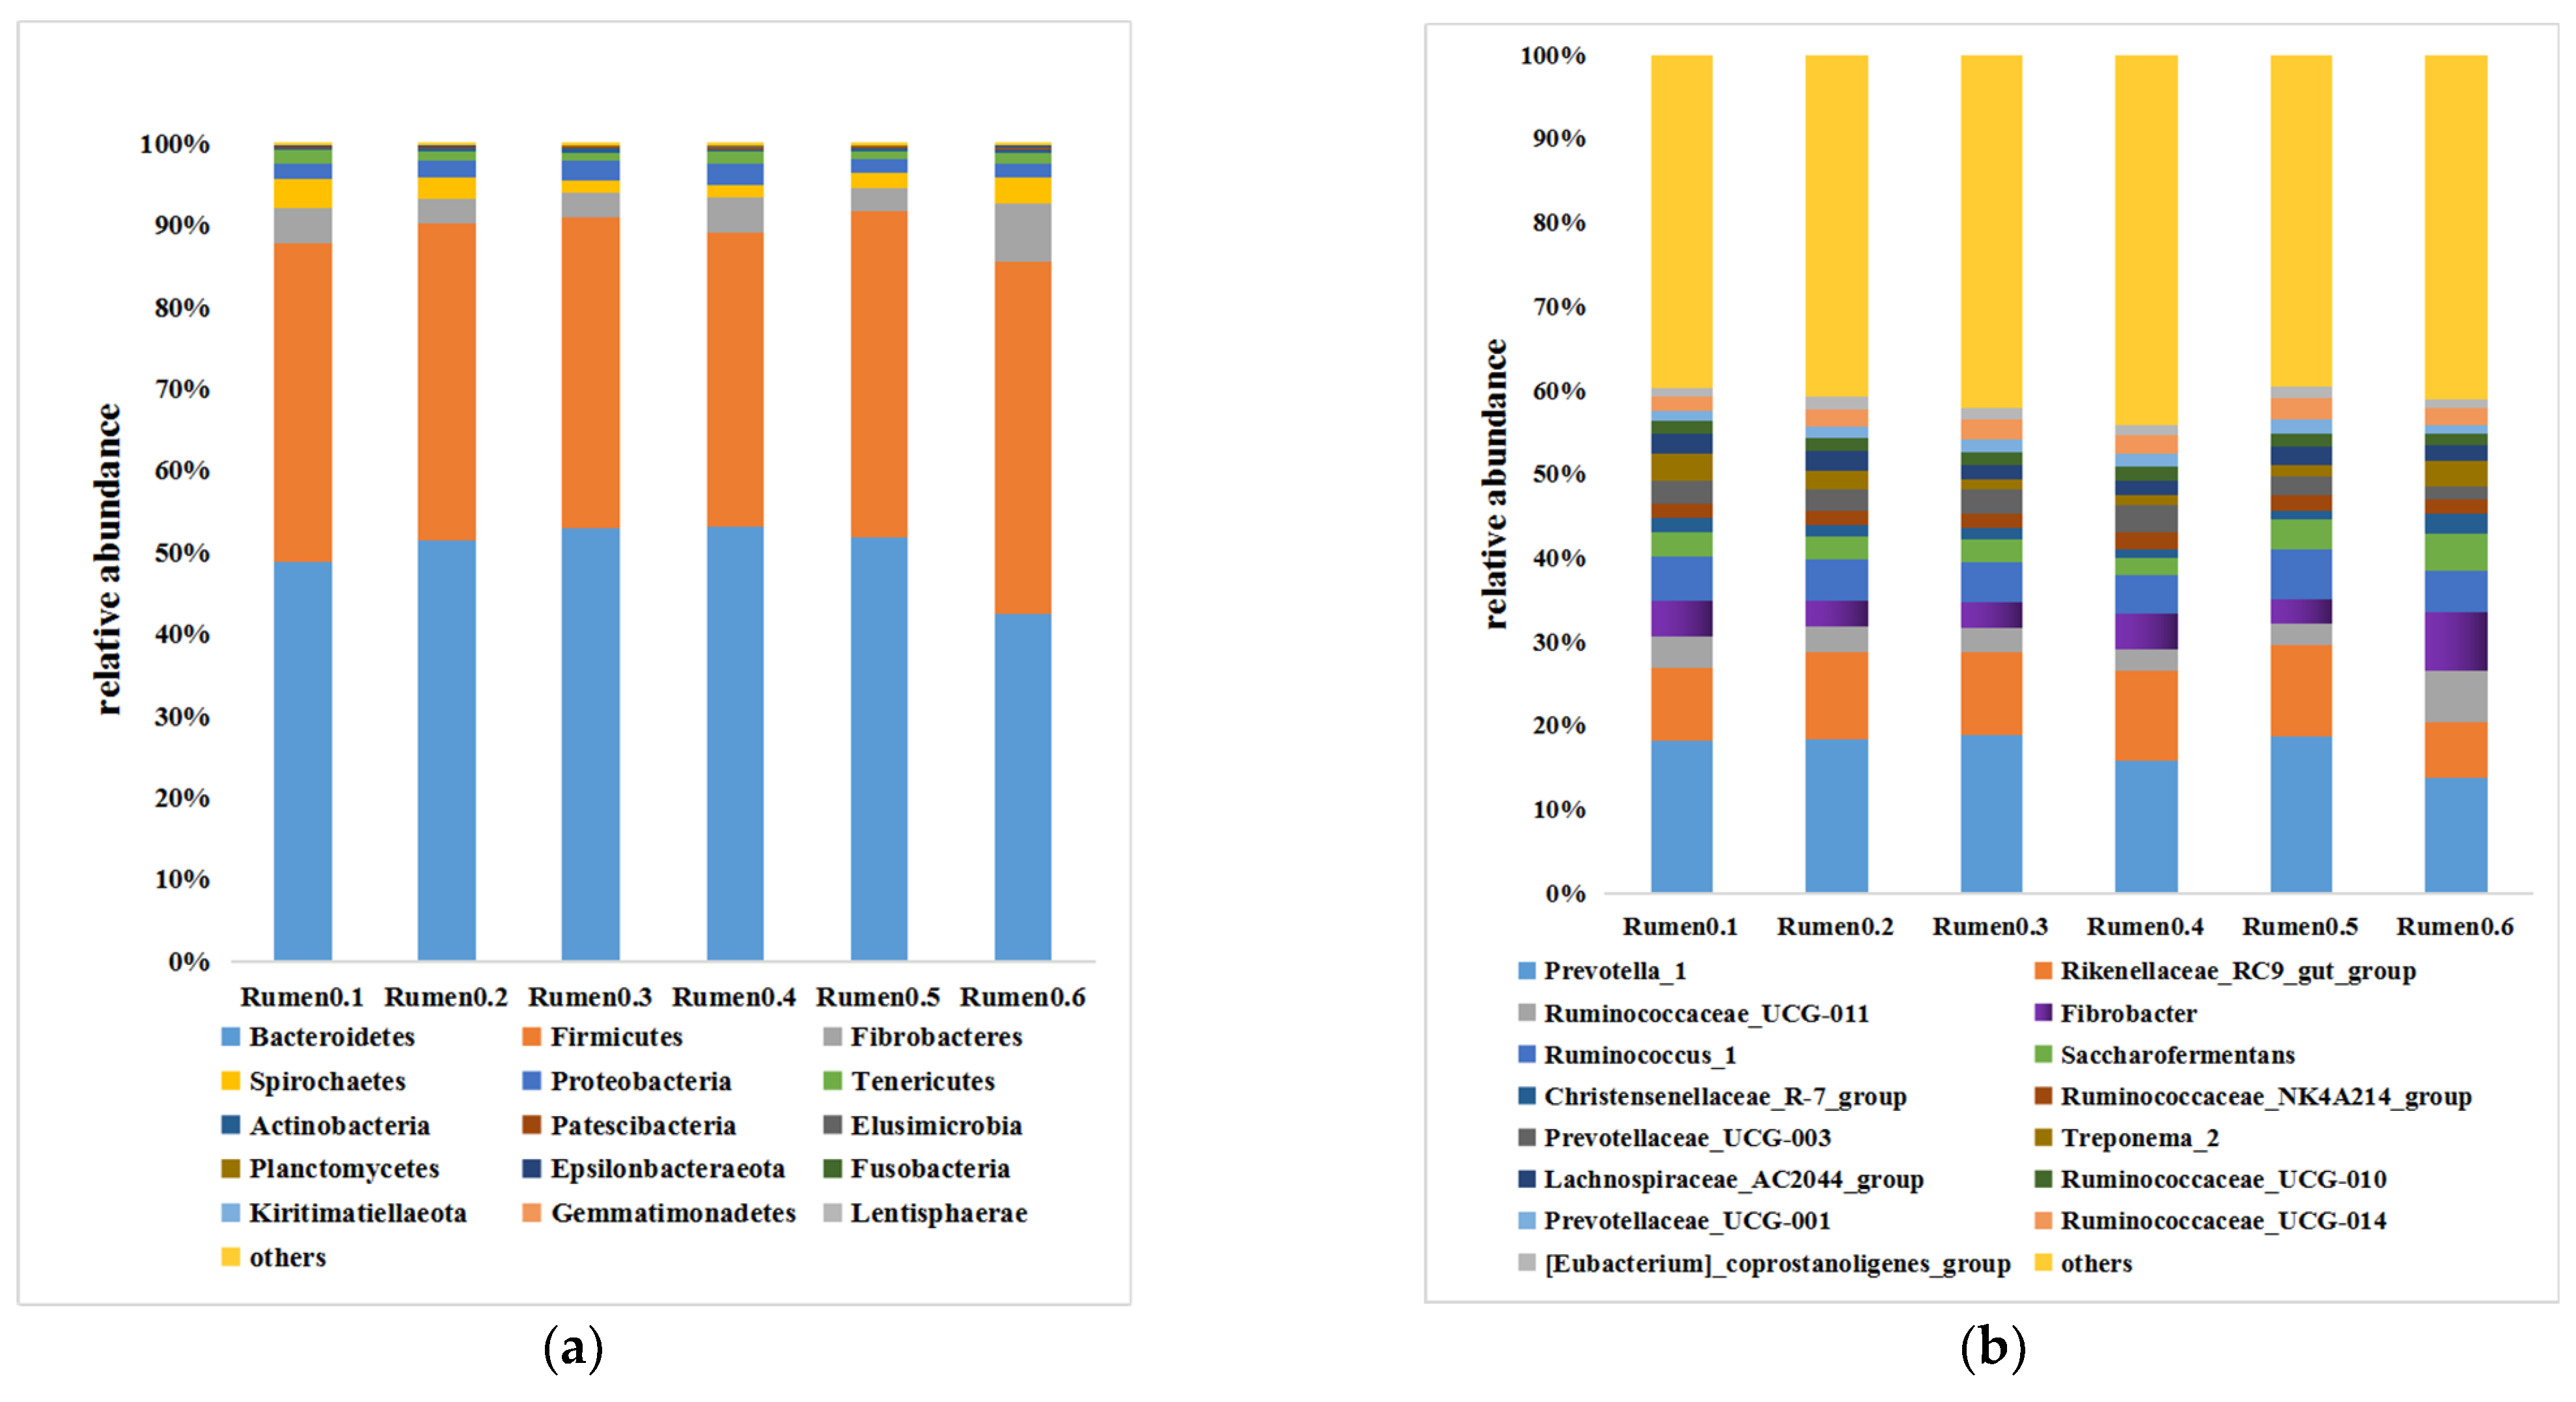
As shown in
Figure 2, at the phylum level (the results only show the top 15 in relative abundance), the rumen microorganisms are almost clustered in Bacteroidetes and Firmicutes. The most dominant phylum is Bacteroidetes, following by Firmicutes, Fibrobacteres, Spirochaetes, Proteobacteria and Tenericutes. At the bacterial genus level (the results only show the top 15 in relative abundance), the strain with absolute predominance in the microbial composition of rumen flora is Prevotella_1, followed by Rikenellaceae_RC9_gut_group, Ruminococcaceae_UCG-011, Fibrobacter, Ruminococcus_1 and Saccharofermentans.
3.6. Annotation Results of Rumen Microorganisms in COG and KEGG Database
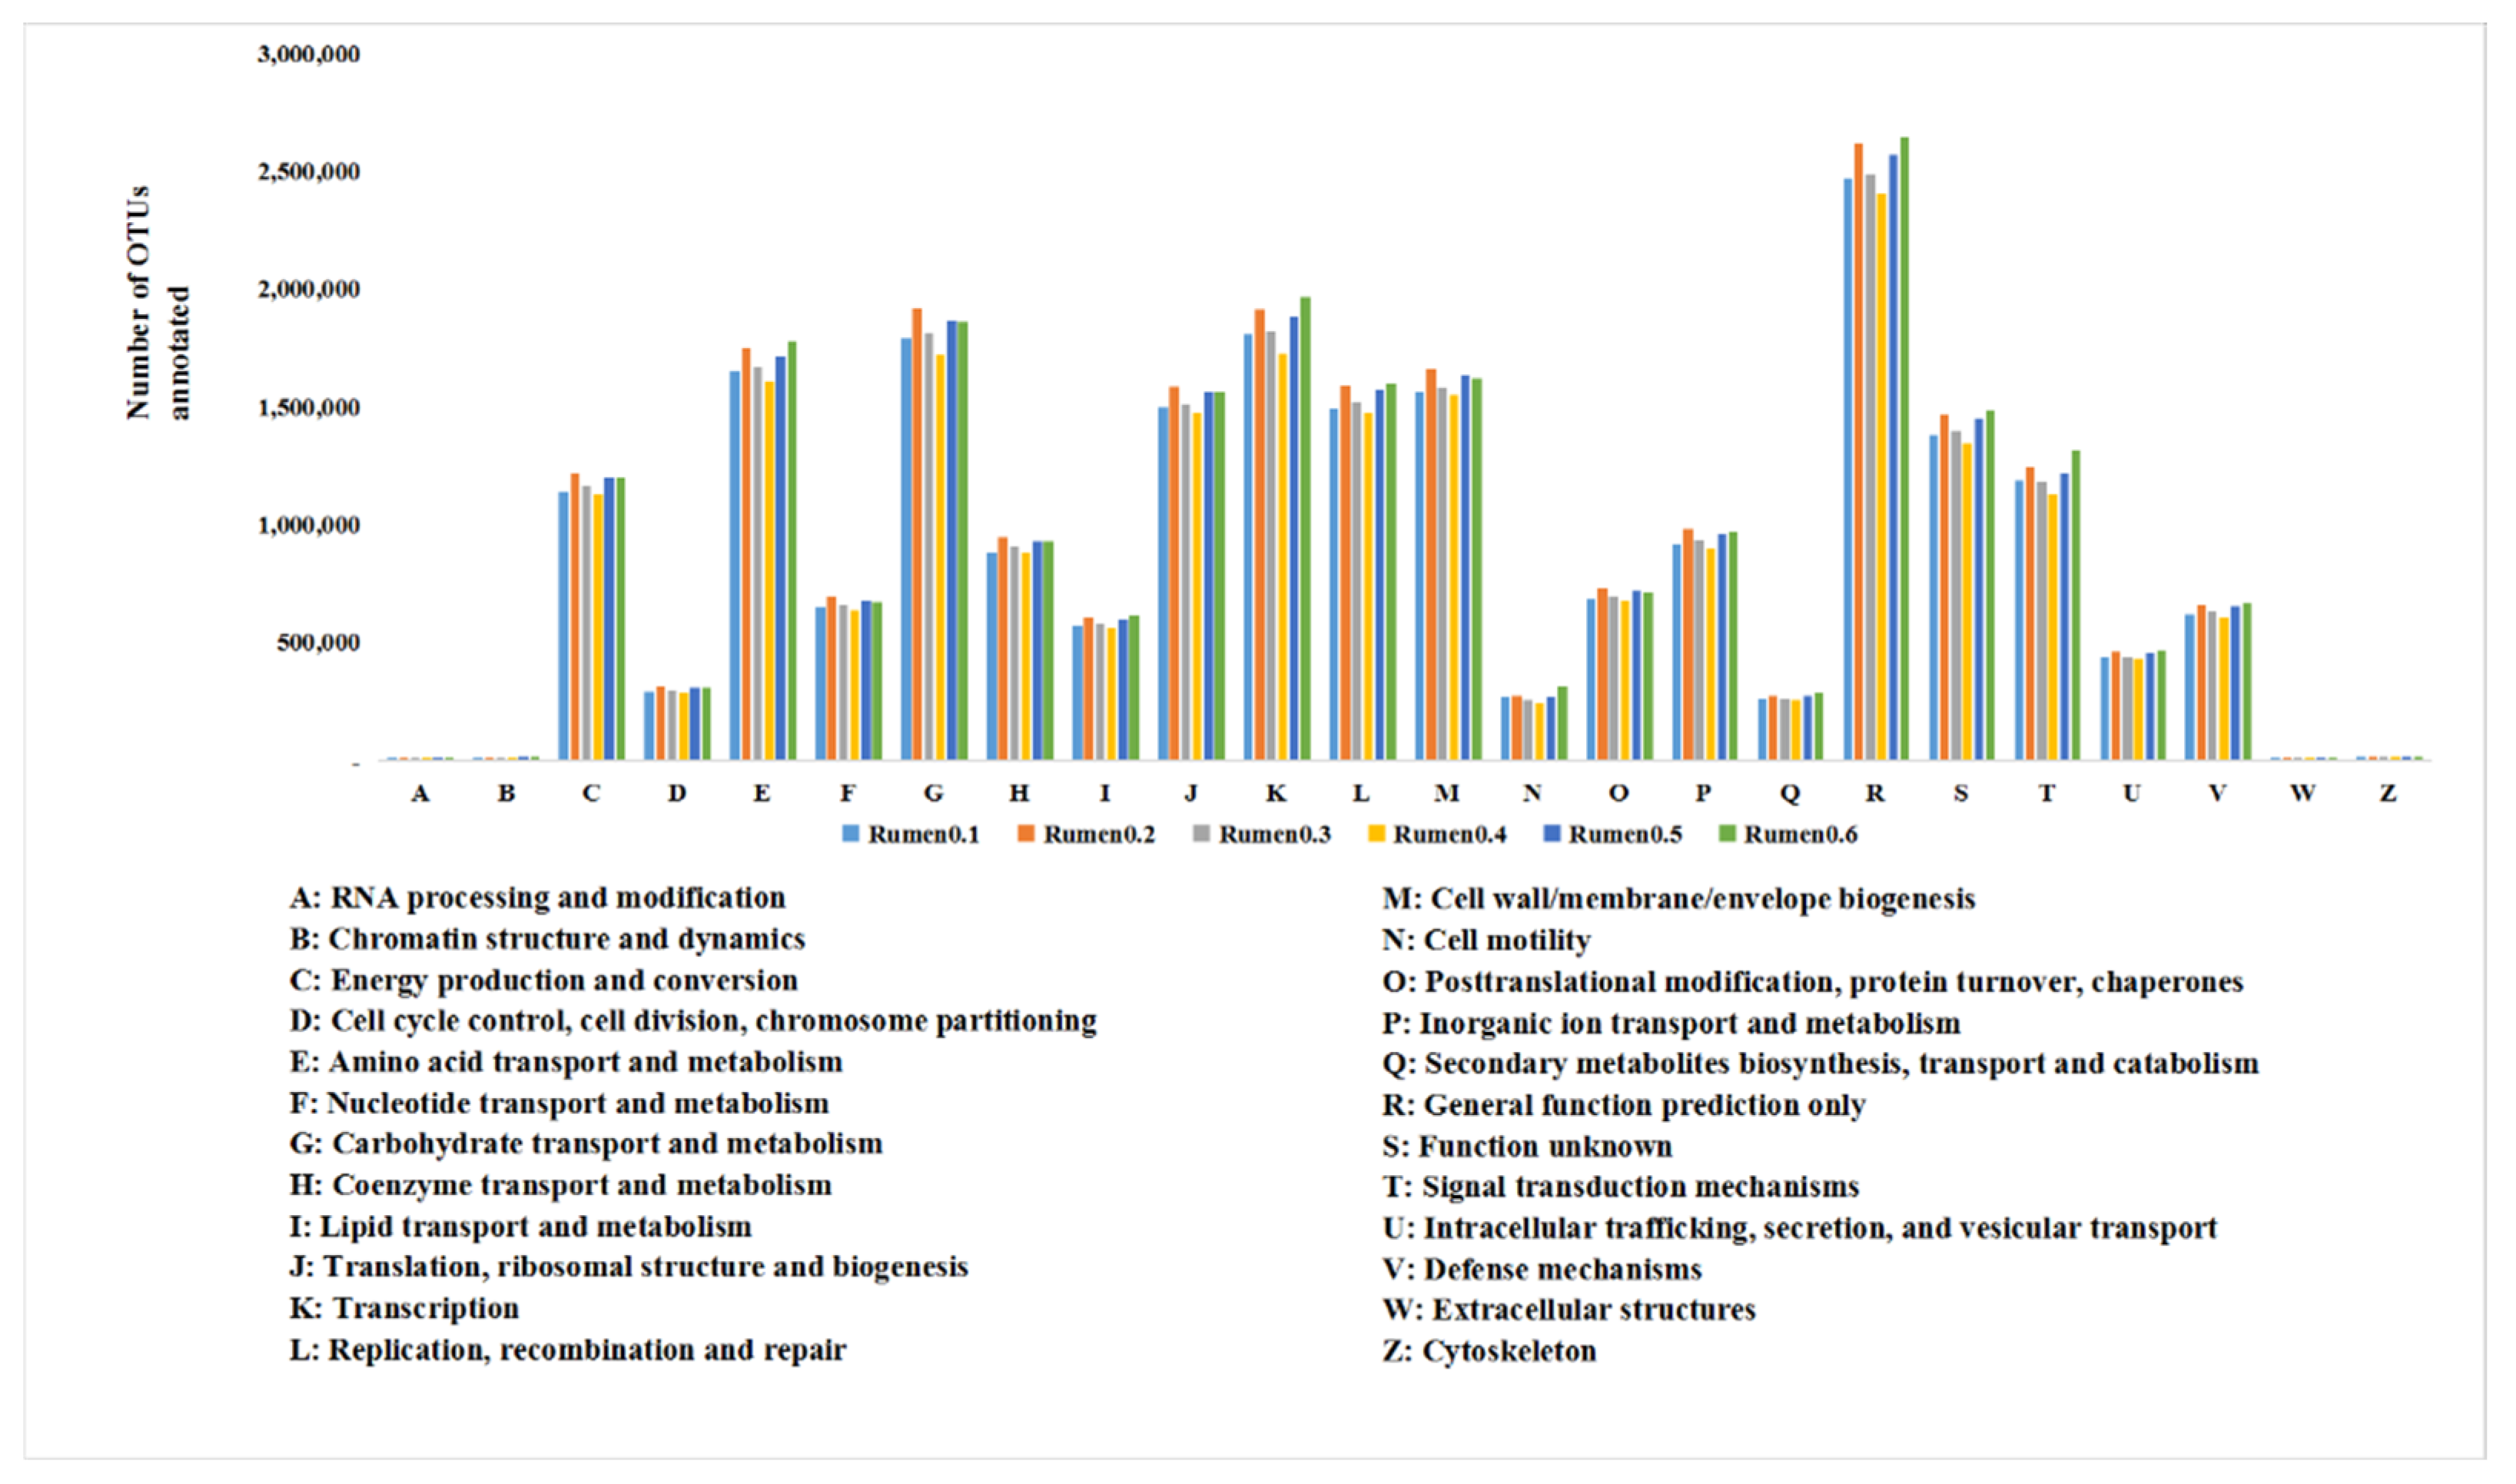
As shown in
Figure 3, the rumen flora is enriched in 24 sorts of COG functions. The top three are general function predictions only (R), transcription (K) and carbohydrate transport and metabolism (G). The last four with significantly less enriched functions are cytoskeleton (Z), chromatin structure and dynamics (B), RNA processing and modification (A) and extracellular structures (W).
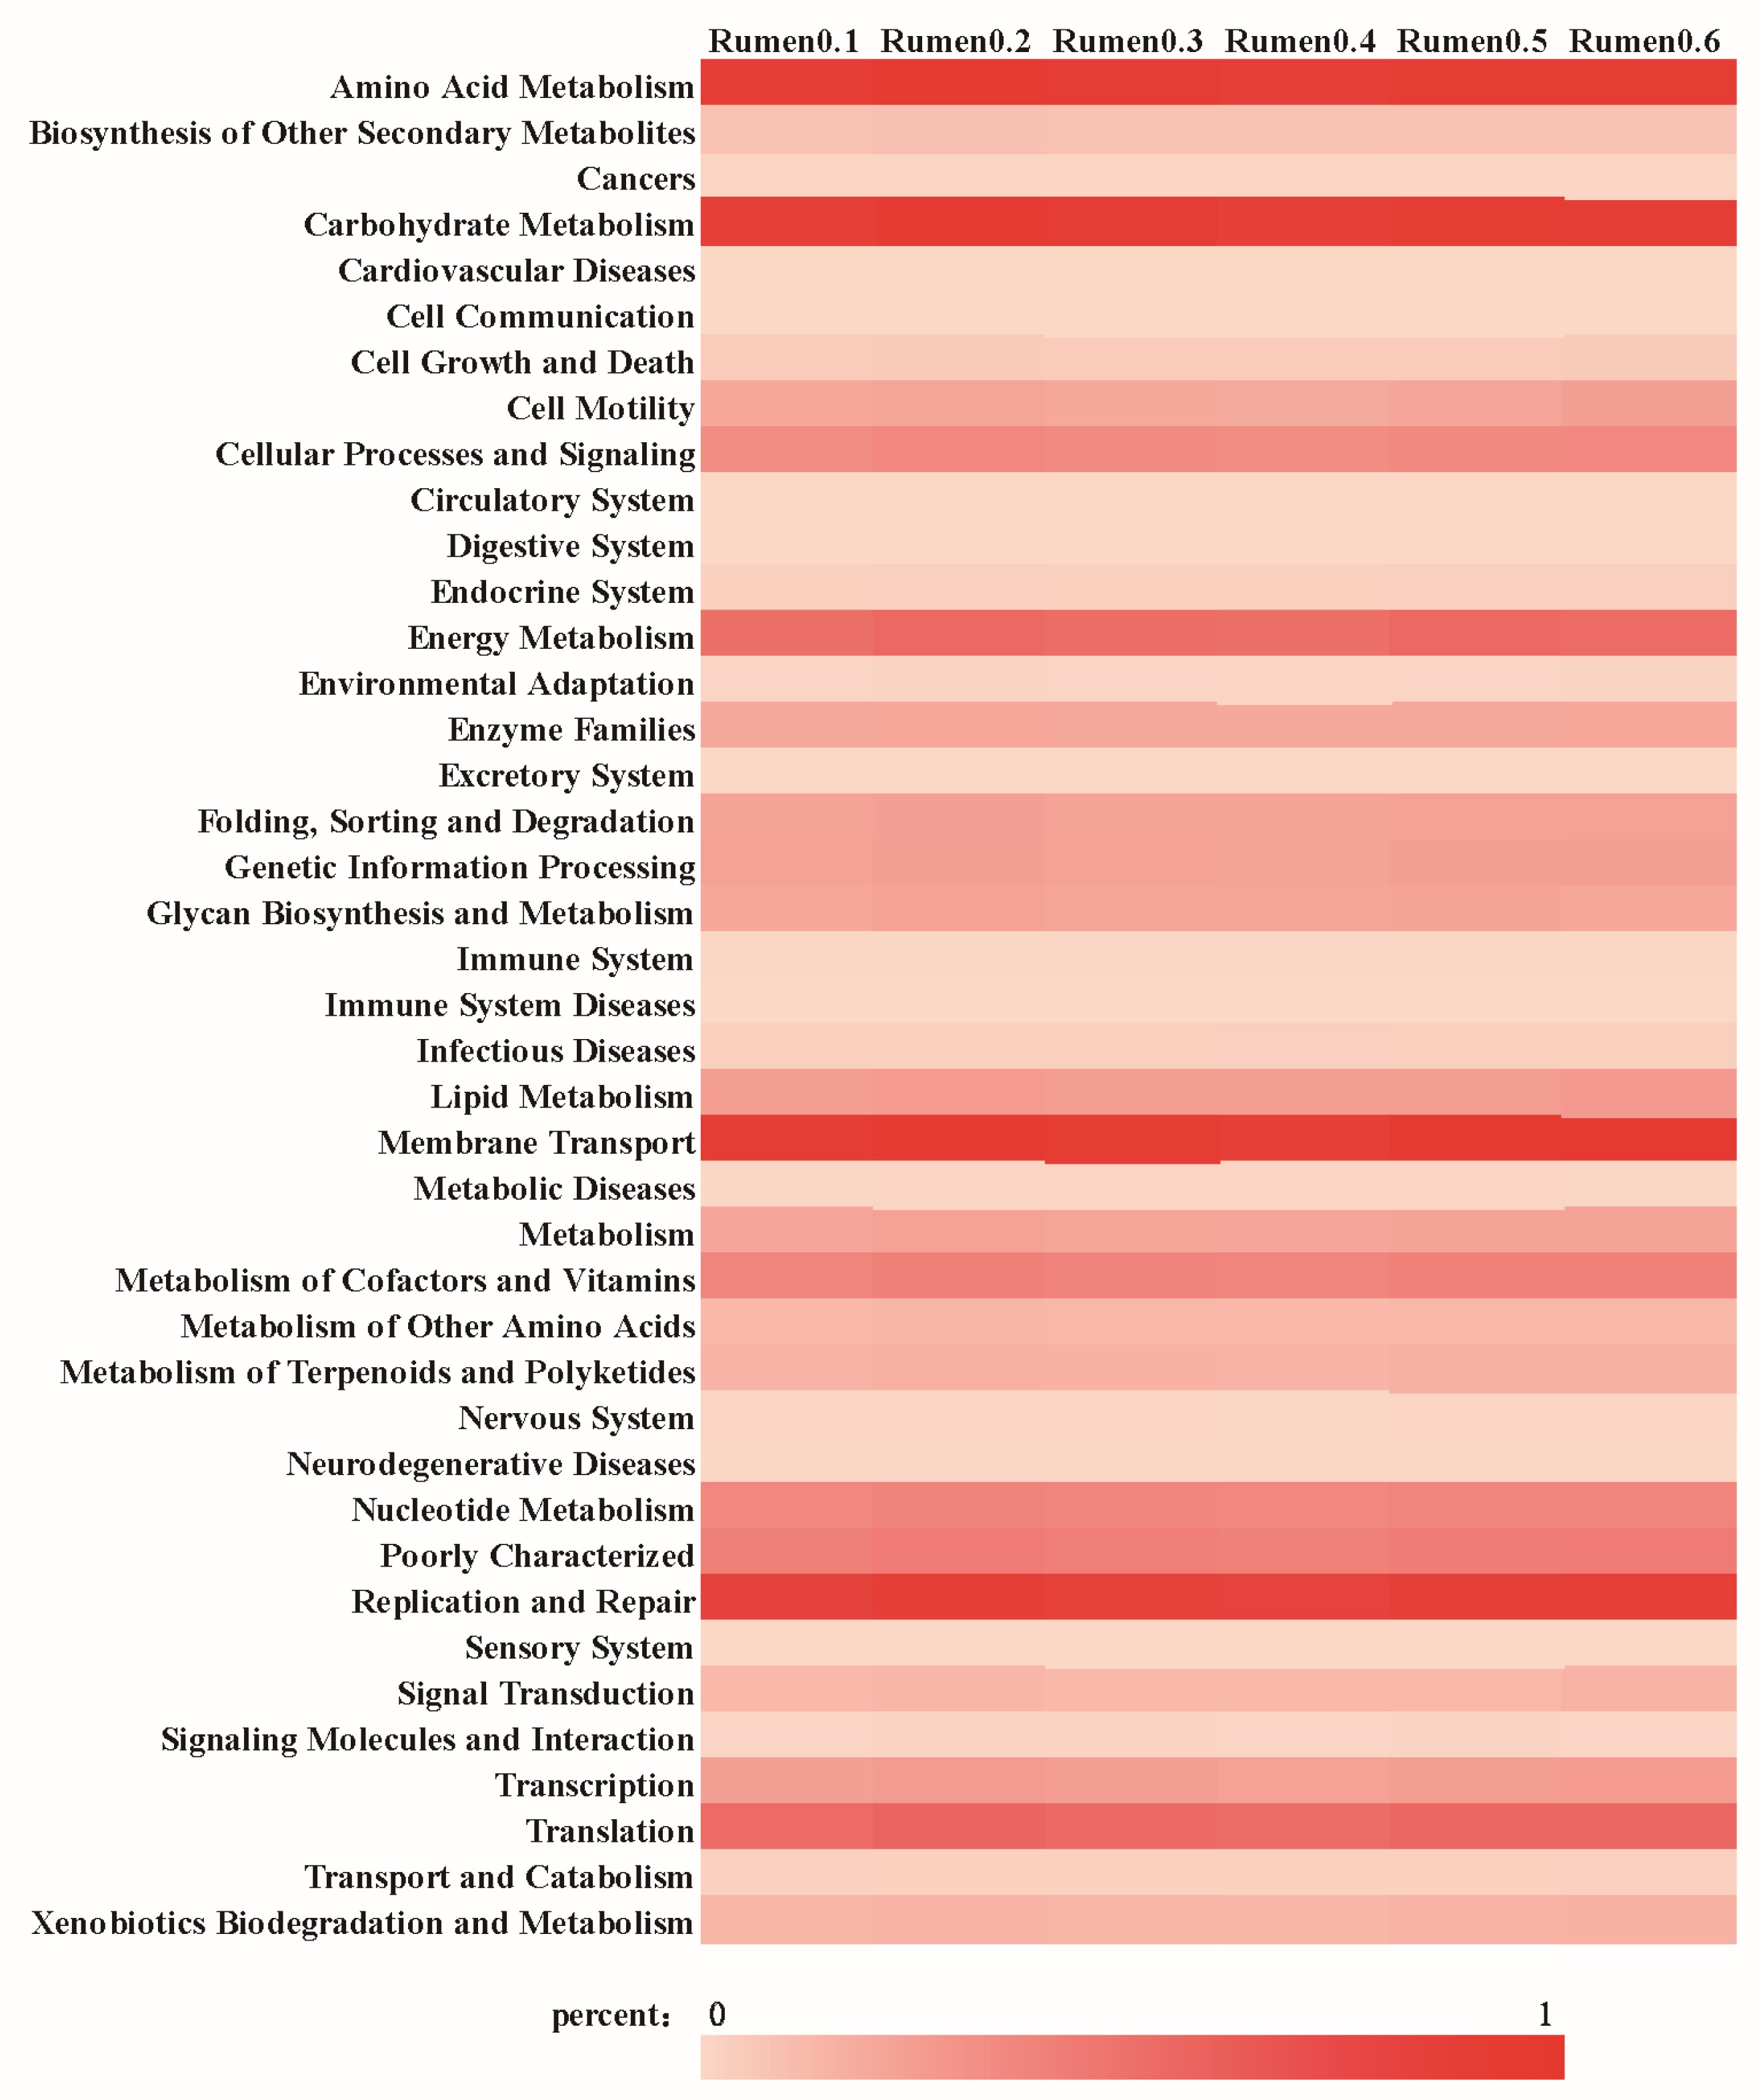
The annotation results of rumen microorganisms on the secondary pathway of the KEGG database are shown in
Figure 4, which are mainly involved in membrane transport, amino acid metabolism, carbohydrate metabolism, replication and repair, translation and energy metabolism. Rumen microorganisms are enriched in KEGG annotate relative to metabolic pathways related to aromatic compound degradation, as shown in
Table 8, including aminobenzoate degradation, benzoate degradation, ethylbenzene degradation, fluorobenzoate degradation, metabolism of xenobiotics by cytochrome P450, naphthalene degradation, phenylalanine metabolism, styrene degradation and xylene degradation.
3.7. Isolation of Lignin Degradation Microorganisms of Buffalo Rumen
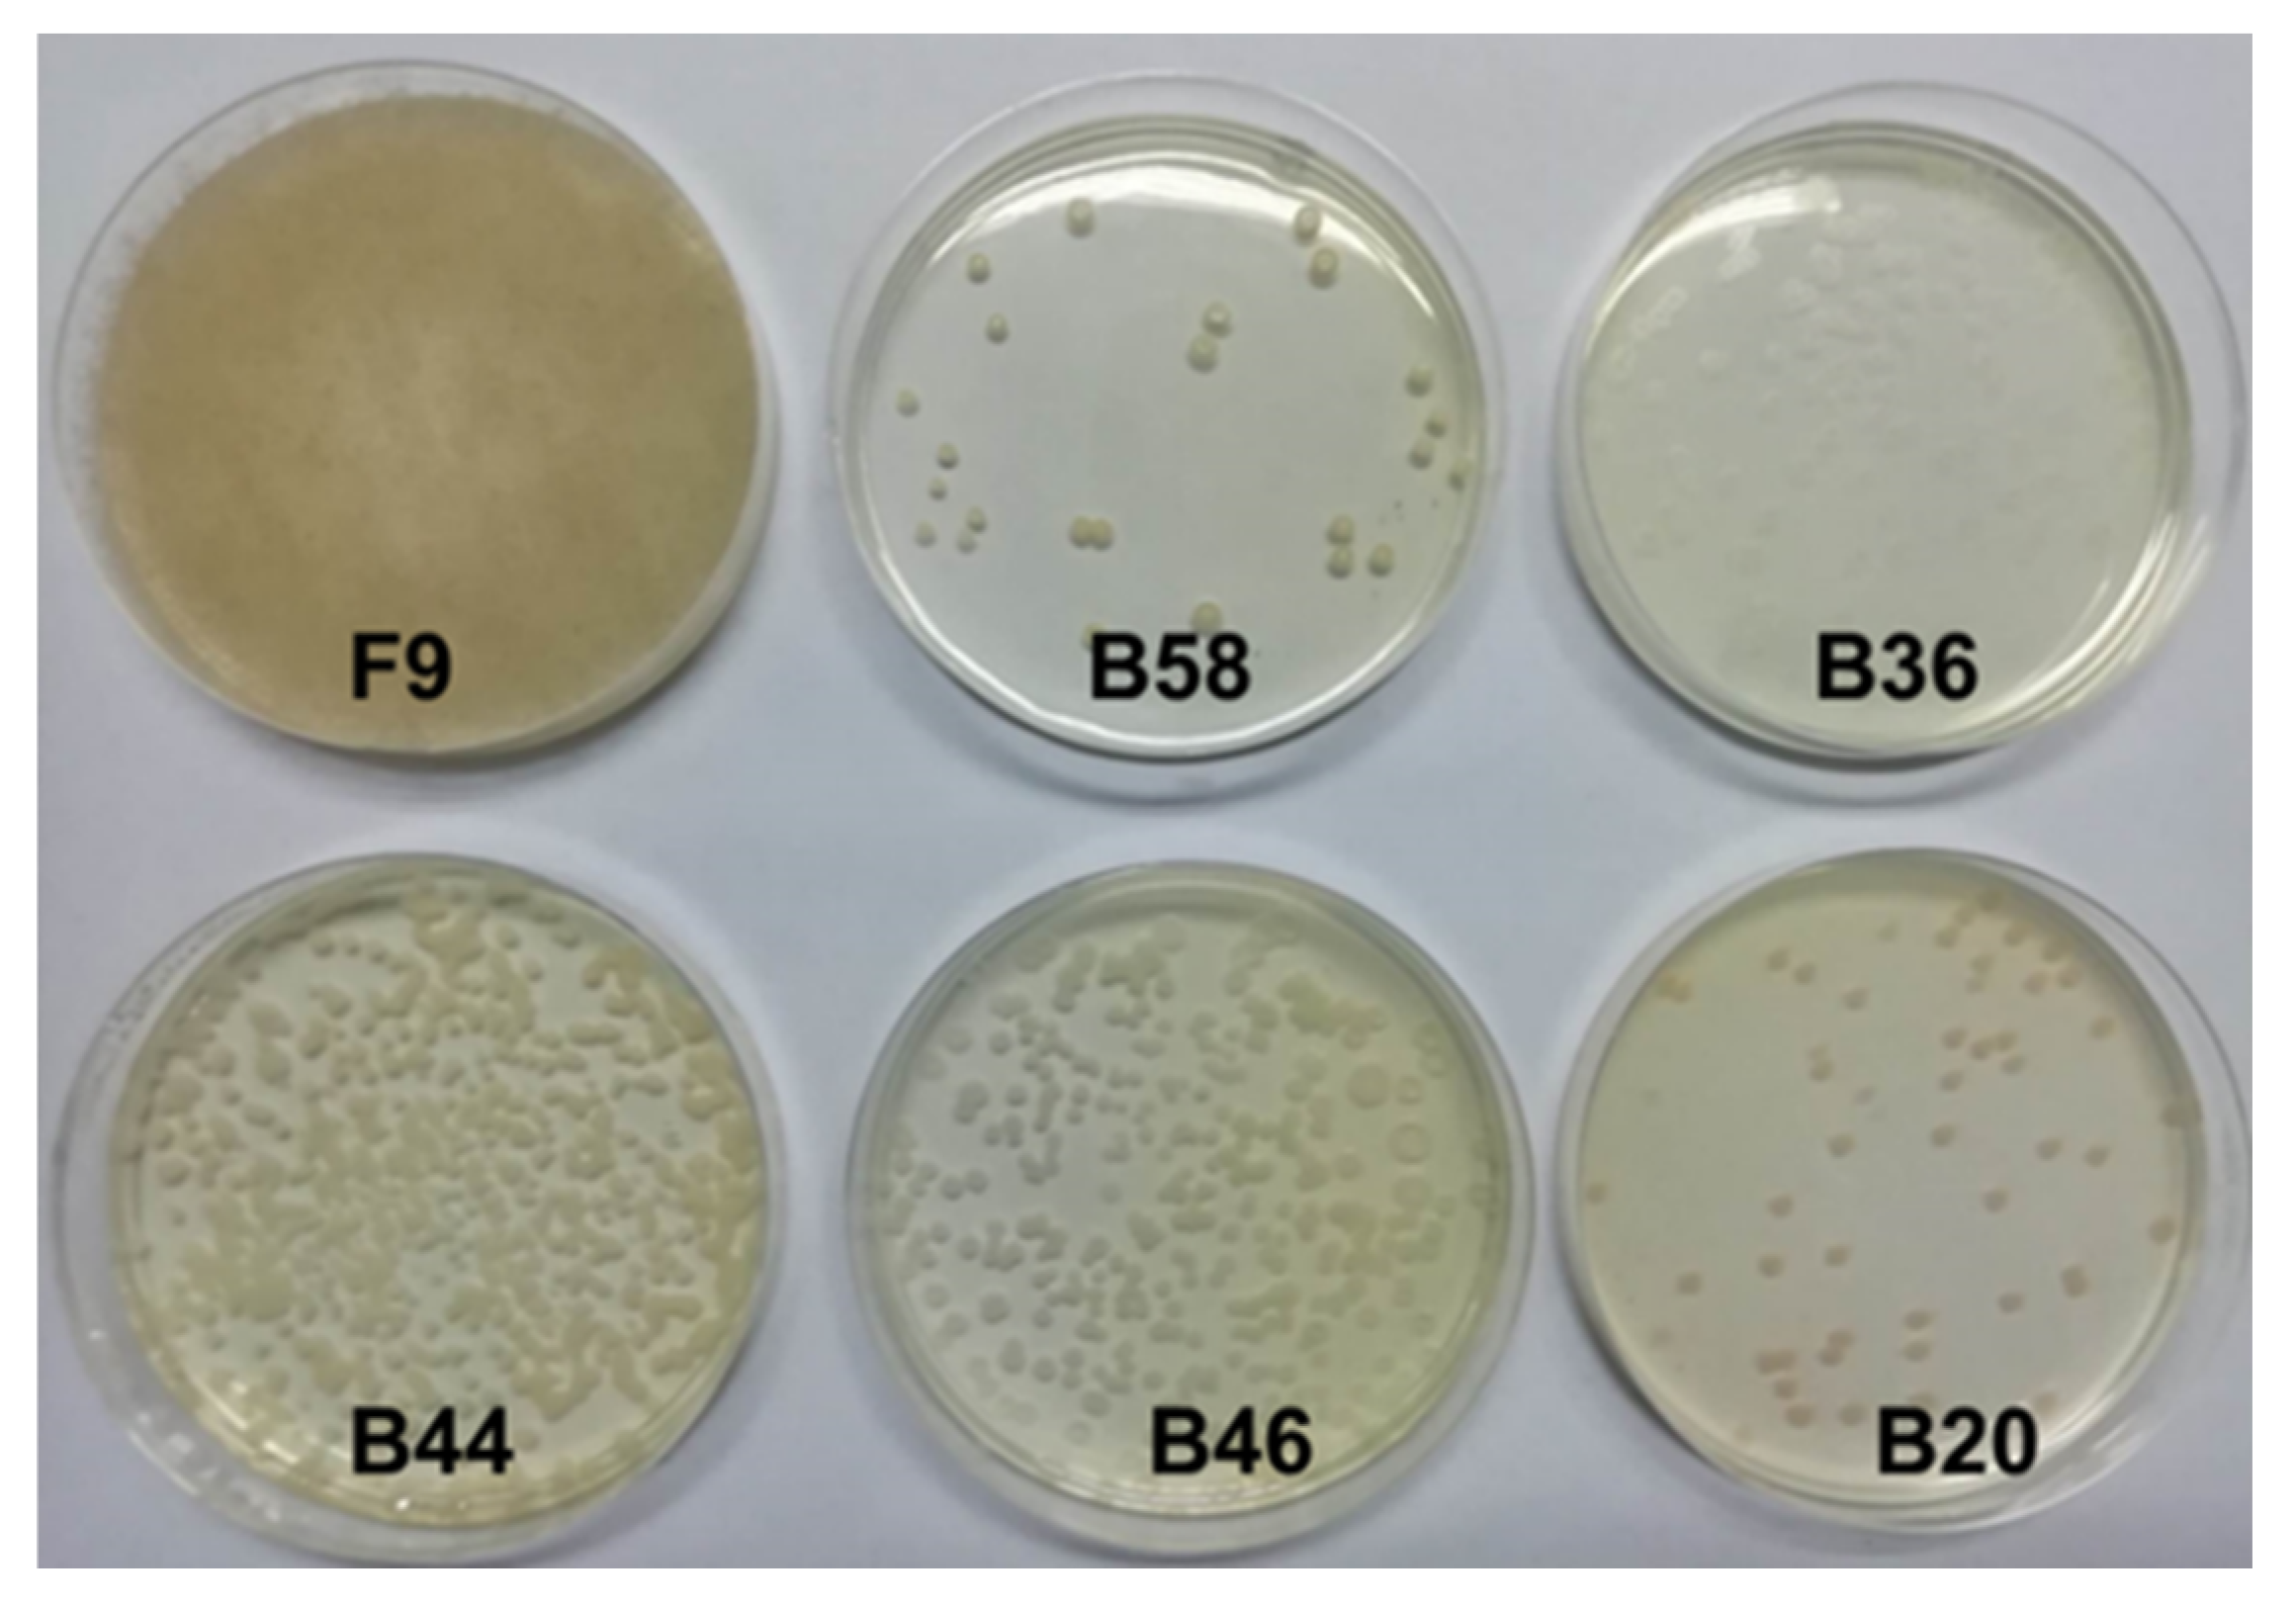
The collected rumen contents were repeatedly isolated and screened with a lignin screening medium. After purification and culture, one fungus and five bacterial strains were obtained. The results are shown in
Figure 5 and named F9, B20, B36, B44, B46 and B58, respectively. The initial growth stage of fungus F9 is white filamentous, the edge is radial and the mycelium is long. With the increase in culture days, the mycelium color gradually turns gray, the mycelium circle also expands and dark spores grow. At first, strain B20 had a small colony, white and opaque texture, regular edges, smooth and moist, slow growth and light red color after 4–5 days of growth. Strain B36 is a thin white colony with a dry surface texture that is difficult to pick up. The strain B36 center is convex, and the shape is a concentric circle. Strains B44 and B46 were white dots and grew into sticky colonies with neat edges and yellowish color. Strain B58 grew from dots to regular circular colonies, with light yellow color, smooth, moist and sticky surface; neat edges; and gradually irregular edges after 4–5 days of growth.
4. Discussion
Lignin is a significant contributor to roughage structure and the main target for examining forages digestibility improvements. Previous reports discussed the connection between lignin monomer composition and degradation rate; however, it was mainly in the biomass energy field, paper making and other fields [
18,
28]. In animal nutrition, the lignin role in depressing fiber fractions utilization in the ruminant digestive tract is usually attributed to lignin concentration. However, our findings suggested that the lignin monomer composition of different forages is another critical factor for the burden feed utilization in buffalo rumen.
Interestingly, the S-type content significantly correlated with the degradation of fiber components, affecting NDFD, ADFD and CELD. It was believed that the deposition of S-type lignin monomer content in plant cell walls promotes lignification development [
29], which affects the degradation rate of fiber fractions in the rumen. Jung and Deetz also reported that S-type lignin is more linear in structure than G-type and H-type in the lignin monomer model and that S-type can extend to the secondary wall of the plant cell wall and become a polysaccharide defender against its digestion activity [
13]. Therefore, the present findings support that the existence of S-type lignin may be a significant barrier against roughage digestibility.
Although the gel-state 2D-NMR analysis reported a phenomenon when the molar ratio of S-type to G-type lignin in the cell wall is 4:3, the degree of lignification would decrease [
30]. Another study in Arabidopsis reported that the richness of S-type lignin plays a more significant role in glucose yield than G-lignin-rich in plant tissues [
28]. Therefore, ferulate cross-linking of arabinoxylans to lignin in the cell wall could restrict structural polysaccharides enzymatic degradation, limiting the utilization of crops as feedstuffs. It has been reported that a 70% reduction in ferulate–lignin cross-linking would increase carbohydrate solubilization by 24–46% and enhance cell wall degradability [
31,
32]. Moreover, the S-type lignin can interfere with ferulate copolymerization with lignin [
33], which had minimal effects on cell wall lignification and could promote the utilization of the roughage.
Some previous studies contradict this experiment’s findings that support the effect of S-type lignin on fiber fractions degradation. This experiment was conducted in vivo using buffalo rumen; such experimental conditions did not exist before, presenting a new view on the effect of lignin composition on feed utilization.
Many factors determine the degradation rate of fiber fractions in the rumen, in addition to the widely accepted lignin concentration, lignin monomer composition, ferulic acid cross-linking, cellulose crystallinity, cellulose polymerization degree and hemicellulose composition, which also have significant roles [
34,
35,
36]. In this study, the regression degree of lignin monomer composition parameters on the degradation rate of fiber components is significant, and the interpretation rate (R
2) is about 70%. Regarding other factors, lignin monomer composition has a chief influence on the fiber fractions’ degradation rate. In this experiment, the effect of lignin on the degradation rate of fiber fraction in roughage was only considered from the aspect of lignin monomer composition; not all the influencing factors were not included in the research scope. Although the prediction model obtained did not reach a very high correlation, it still can be accepted as a reference standard for predicting the fiber fractions degradation rate for roughage.
Lignin is a structural stability polymer, and it has not been reported that mammals can degrade and utilize lignin. In addition to biodegradable fiber, the results also proved the ADL degradability in eight kinds of roughage by buffalo. The above results are consistent with Xu and Zhong’s study [
3]. They brought forward that buffalo had lignin degradation by comparing buffalo and cattle and found that the ADL degradation rate of rice straw in buffalo rumen was significantly higher than that in cattle rumen. This experiment directly verified the ability of buffalo to degrade ADL, which has not been found in other mammals. The buffalo showed stronger roughage resistance [
37]. A previous study demonstrated that there exists a unique rumen microflora in buffalo rumen. Wanapat proved that the total number of bacteria, cellulolytic, proteolytic and amylolytic bacteria of buffalo rumen was significantly higher than cattle fed with the same feedstuff of rice straw [
38]. Wanapat put forward the opinion that the unique microorganisms of buffalo rumen are the reasons for why they exhibit outstanding growth performance compared to cattle. In this study, several microorganisms with lignin degradation potential were isolated from buffalo rumen with lignin degradation ability. This result is consistent with Wang’s research which also isolated strains with lignin degradation potential in buffalo rumen [
39]. The study seems to point out that rumen microorganisms were the underlying mechanisms of lignin degradation. In this experiment, we found that Bacteroidetes and Firmicutes are the most dominant bacteria among buffalo rumen microorganisms, and their relative abundance accounts for nearly 90%. It is reported that some bacteria of Firmicutes, Proteus and actinomycetes are the main bacteria with lignin degradation function [
40]. The rumen microbial composition of Firmicutes accounts for a large proportion, and the relative abundance of Proteobacteria is 2.02%, but Actinomycetes numbered very few.
The annotation results of rumen microorganisms in the KEGG database showed that many microorganisms were enriched in the degradation pathway of aromatic compounds. Lignin is an aromatic polymer with a three-dimensional structure, and its basic unit is phenylalanine. The degradation of aromatic compounds is closely related to lignin degradation. Among them include the pathways of phenylalanine metabolism and metabolism of xenobiology by cytochrome P450. Cytochrome P450 is a verified enzyme involved in lignin degradation [
41]. In the pathway of aminobenzoate degradation, existing methyl gallate metabolic and protocatechuate metabolic processes are present, which are the vital pathways that strains follow for degrading lignin [
42]. Buffalo rumen microorganisms may degrade lignin through this series of pathways, which needs further investigation.
5. Conclusions
It was concluded that lignin monomer composition is an important factor affecting fiber fractions degradation in roughage, and the prediction models are as follows: NDFD = 0.647 − 0.071 × H/S (R2 = 0.628, p < 0.01), ADFD = 0.427 − 0.045 × H/S + 0.826 × S/G (R2 = 0.678, p < 0.01), ADLD = 0.161 − 1.918 × H + 3.152 × S (R2 = 0.758, p < 0.01), CELD = 0.724 − 0.081 × H/S (R2 = 0.620, p < 0.01) and HCD = 0.522 − 0.038 × H/S + 0.649 × S/G (R2 = 0.709, p < 0.01). This experiment fills in the blanks of relationship between lignin composition and ruminal fiber fractions degradation. The result provides a new approach for evaluating roughage feedstuffs and for improving the understanding of fiber utilization in ruminants. Moreover, we found that the lignin degradation ability of buffalo is based on its unique rumen microorganisms, but the specific degradation mechanism needs to be further studied.


 ,
, 