
Bioeconomic Modelling to Assess the Impacts of Using Native Shrubs on the Marginal Portions of the Sheep and Beef Hill Country Farms in New Zealand

 ,
,
Abstract
:1. Introduction
- (i)
- farm feed supply,
- (ii)
- flock dynamics, and
- (iii)
- farm economics of converting 10% of a North Island hill country sheep and beef farm from only pasture production to native shrubs with understory grazing.
2. Materials and Methods
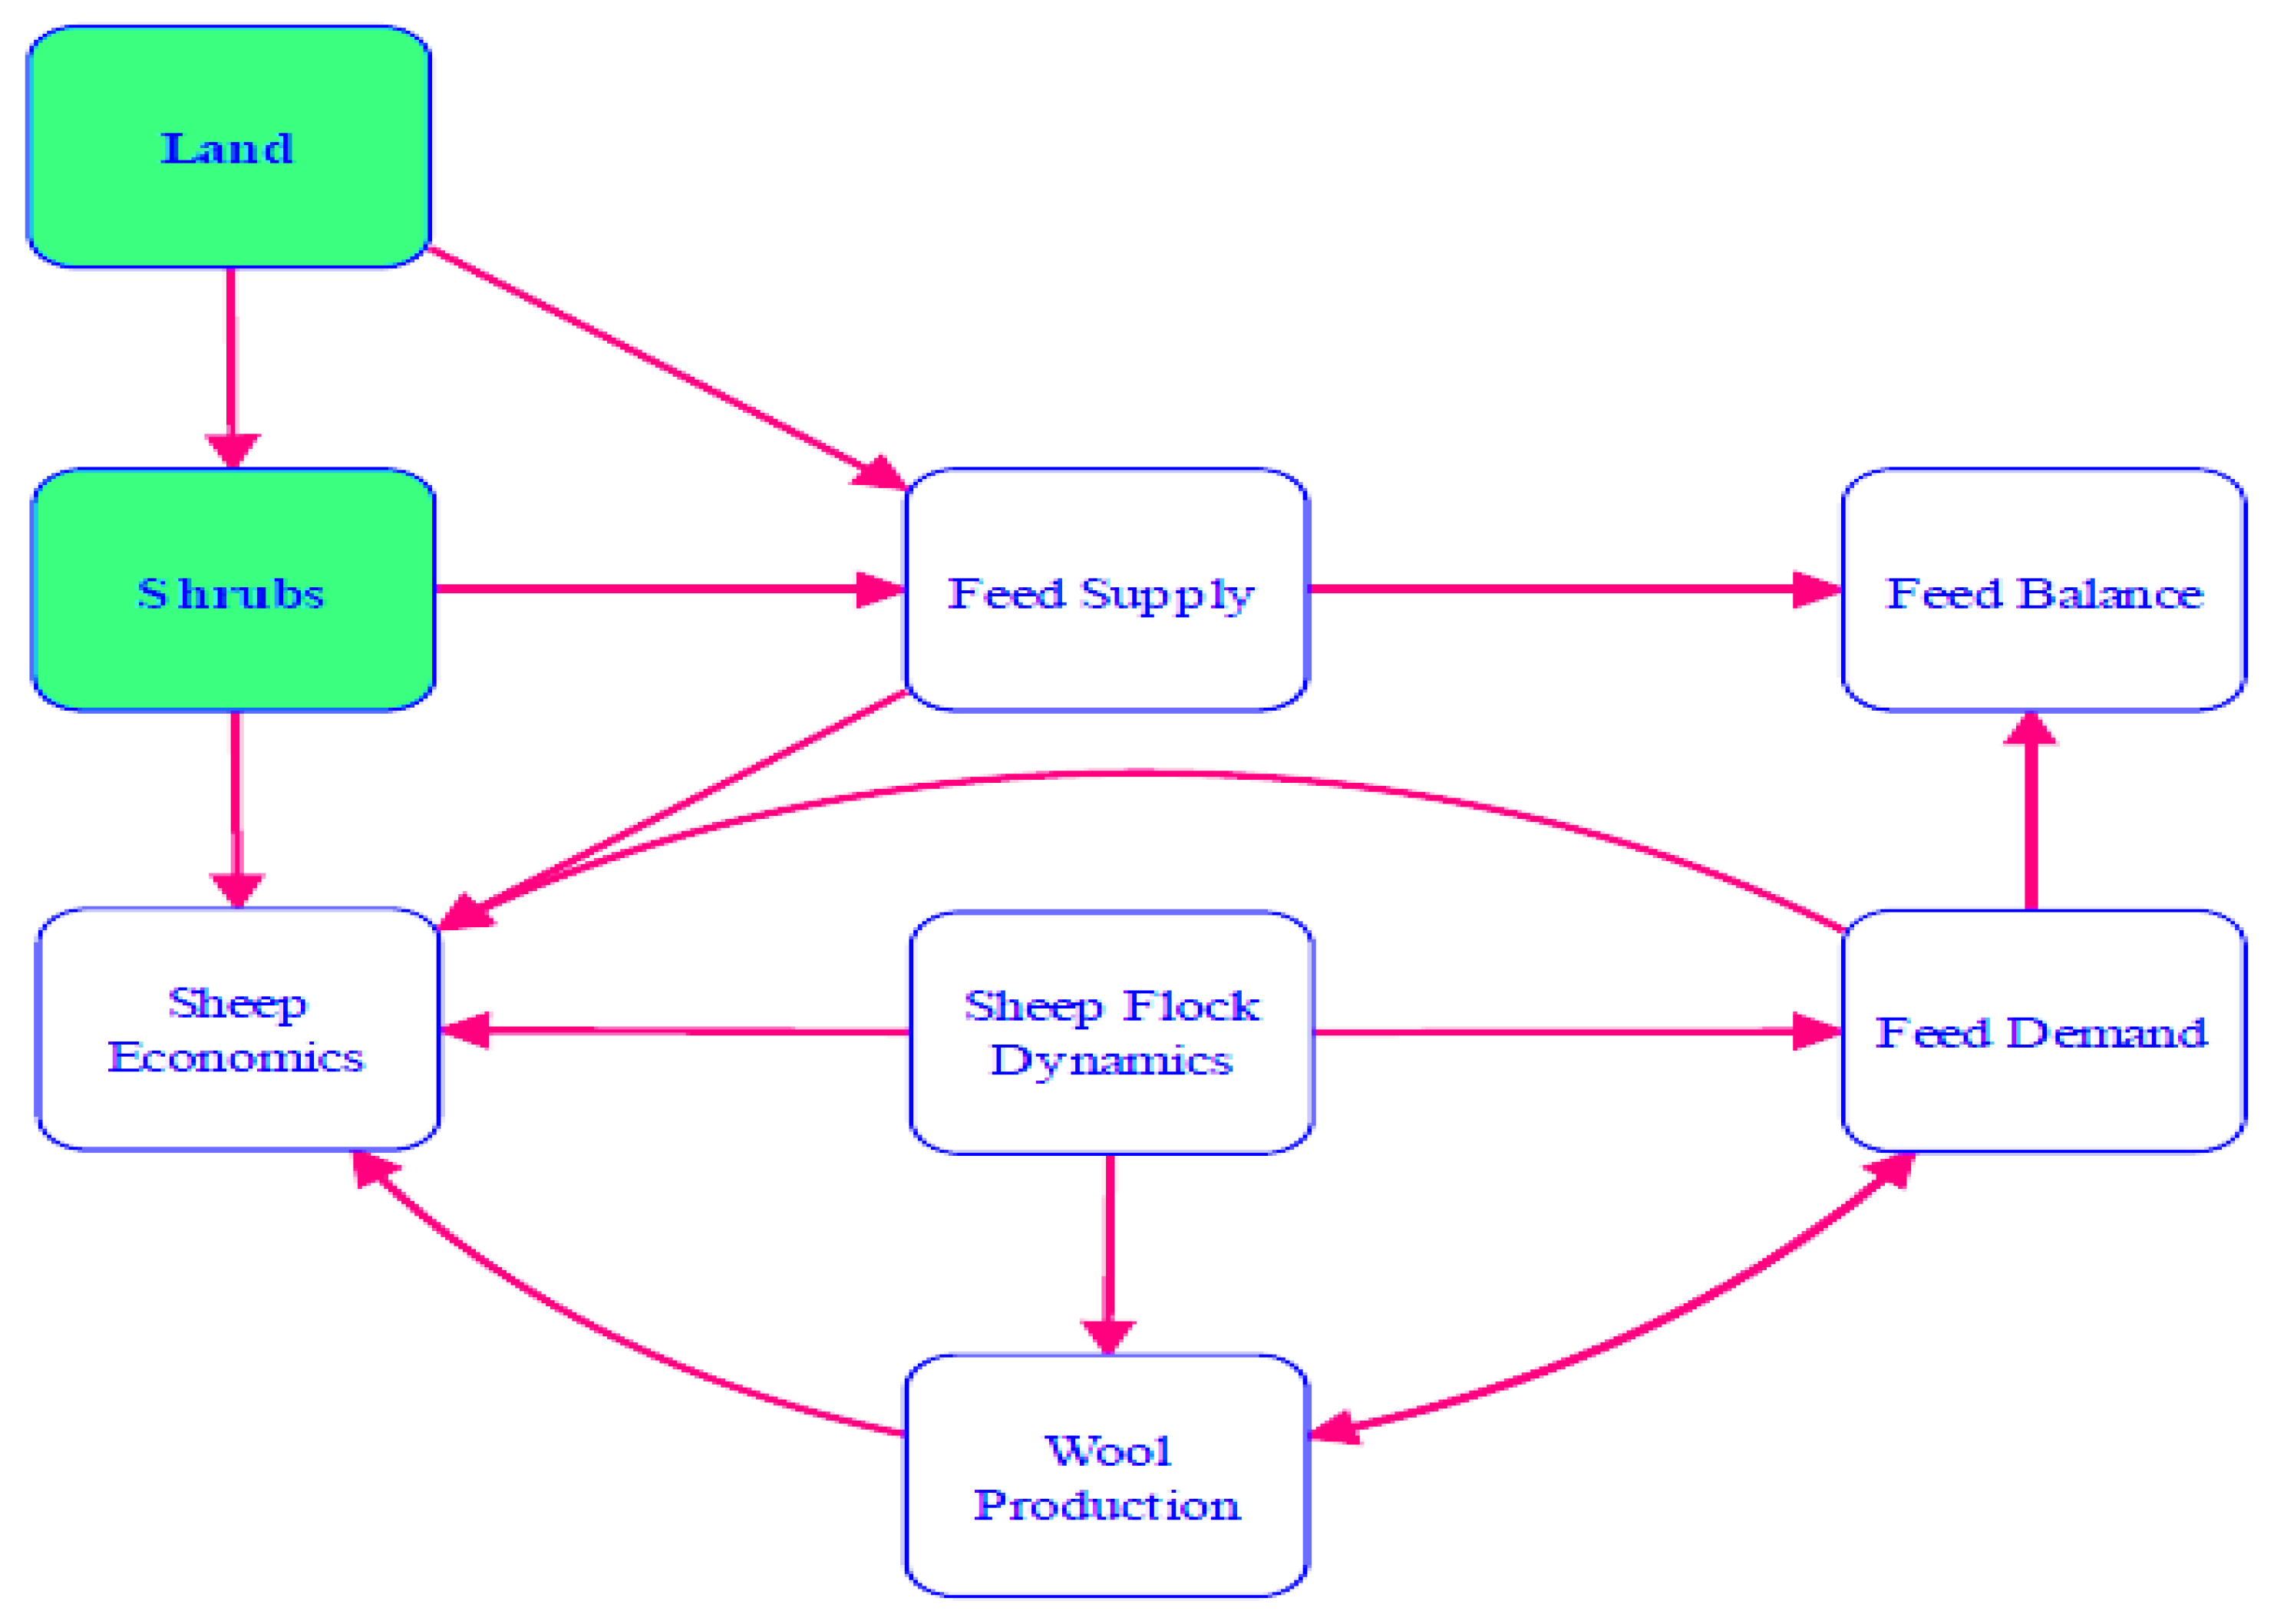
2.1. Model Development and Structure
- (i)
- partitioning of the hill country farm into various topographical land classes that vary in pasture growth and quality,
- (ii)
- use of native shrubs as a feed source,
- (iii)
- diversification of land uses to encompass native shrub land, and
- (iv)
- expansion of sources of farm income to include carbon emission trading.
2.2. Land Characteristics for Modelled Farm

| Slope Elevation (°) | Author (s) | ||
|---|---|---|---|
| Low | Medium | Steep | |
| <7 | 8 to 20 | >21 | [5] |
| <15 | 16 to 20 | >21 | [7] |
| <12 | 12 to 24 | >24 | [13,39] |
| 1 to 12 | 13 to 25 | >26 | [6,9,33,42,45] |
| 0 to 10 | 10 to 24 | 25 to 37 | [46] |
| <15 | 15 to 25 | >25 | [10] |
| 0 to 3 (A), 4 to 7 (B), 8 to 15 (C) | 16 to 20 (D), 21 to 25 (E) | 26 to 35 (F), >35 (G) | [38,42,47,48] |
| 0 to 3 (A), 4 to 7 (B), 8 to 15 (C) | 16 to 20 (D) 21 to 25 (E) | 26 to 35 (F), 35 to 42 (G), >42 (H) | [49] |
| Slope Class Proportion (%) | Scope of the Study | Author | ||
|---|---|---|---|---|
| Low | Medium | Steep | ||
| 11.0 | 32.0 | 40.0 | New Zealand | [5] |
| 19.6 | 34.5 | 45.9 | New Zealand | [39] |
| 55.0 | 13.0 | 35.0 | New Zealand | [7] |
| 30.1 | 12.8 | 57.1 | North Island | [48] |
| 10.0 | 18.0 | 60.0, 12.0 1 | East Coast (Gisborne) | [49] |
| 8.7 | 45.9 | 45.5 | East Coast | [39] |
| 14.5 | 57.9 | 27.6 | Northland-Waikato-Bay of Plenty | [39] |
| 11.2 | 27.7 | 61.1 | Taranaki-Manawatu | [39] |
| 15.6 | 15.8 | 68.5 | Marlborough-Canterbury | [39] |
| 36.6 | 29.7 | 33.7 | Otago-Southland | [39] |
| 14.1 | 15 | 70.9 | Wairarapa | [50] |
2.3. Modelled Native Shrubs Planting on the Hill Country Farm
2.4. Sheep Flock Structure and Dynamics
2.5. Pasture Growth on Hill Country Farms
2.6. Native Shrubs Growth and Herbage Yields
2.7. Native Shrub Understory Pasture Production
2.8. Native Shrubs Carbon Stock
2.9. Feed Supply, Demand, and Balance
2.10. Farm Economics
3. Results and Discussion
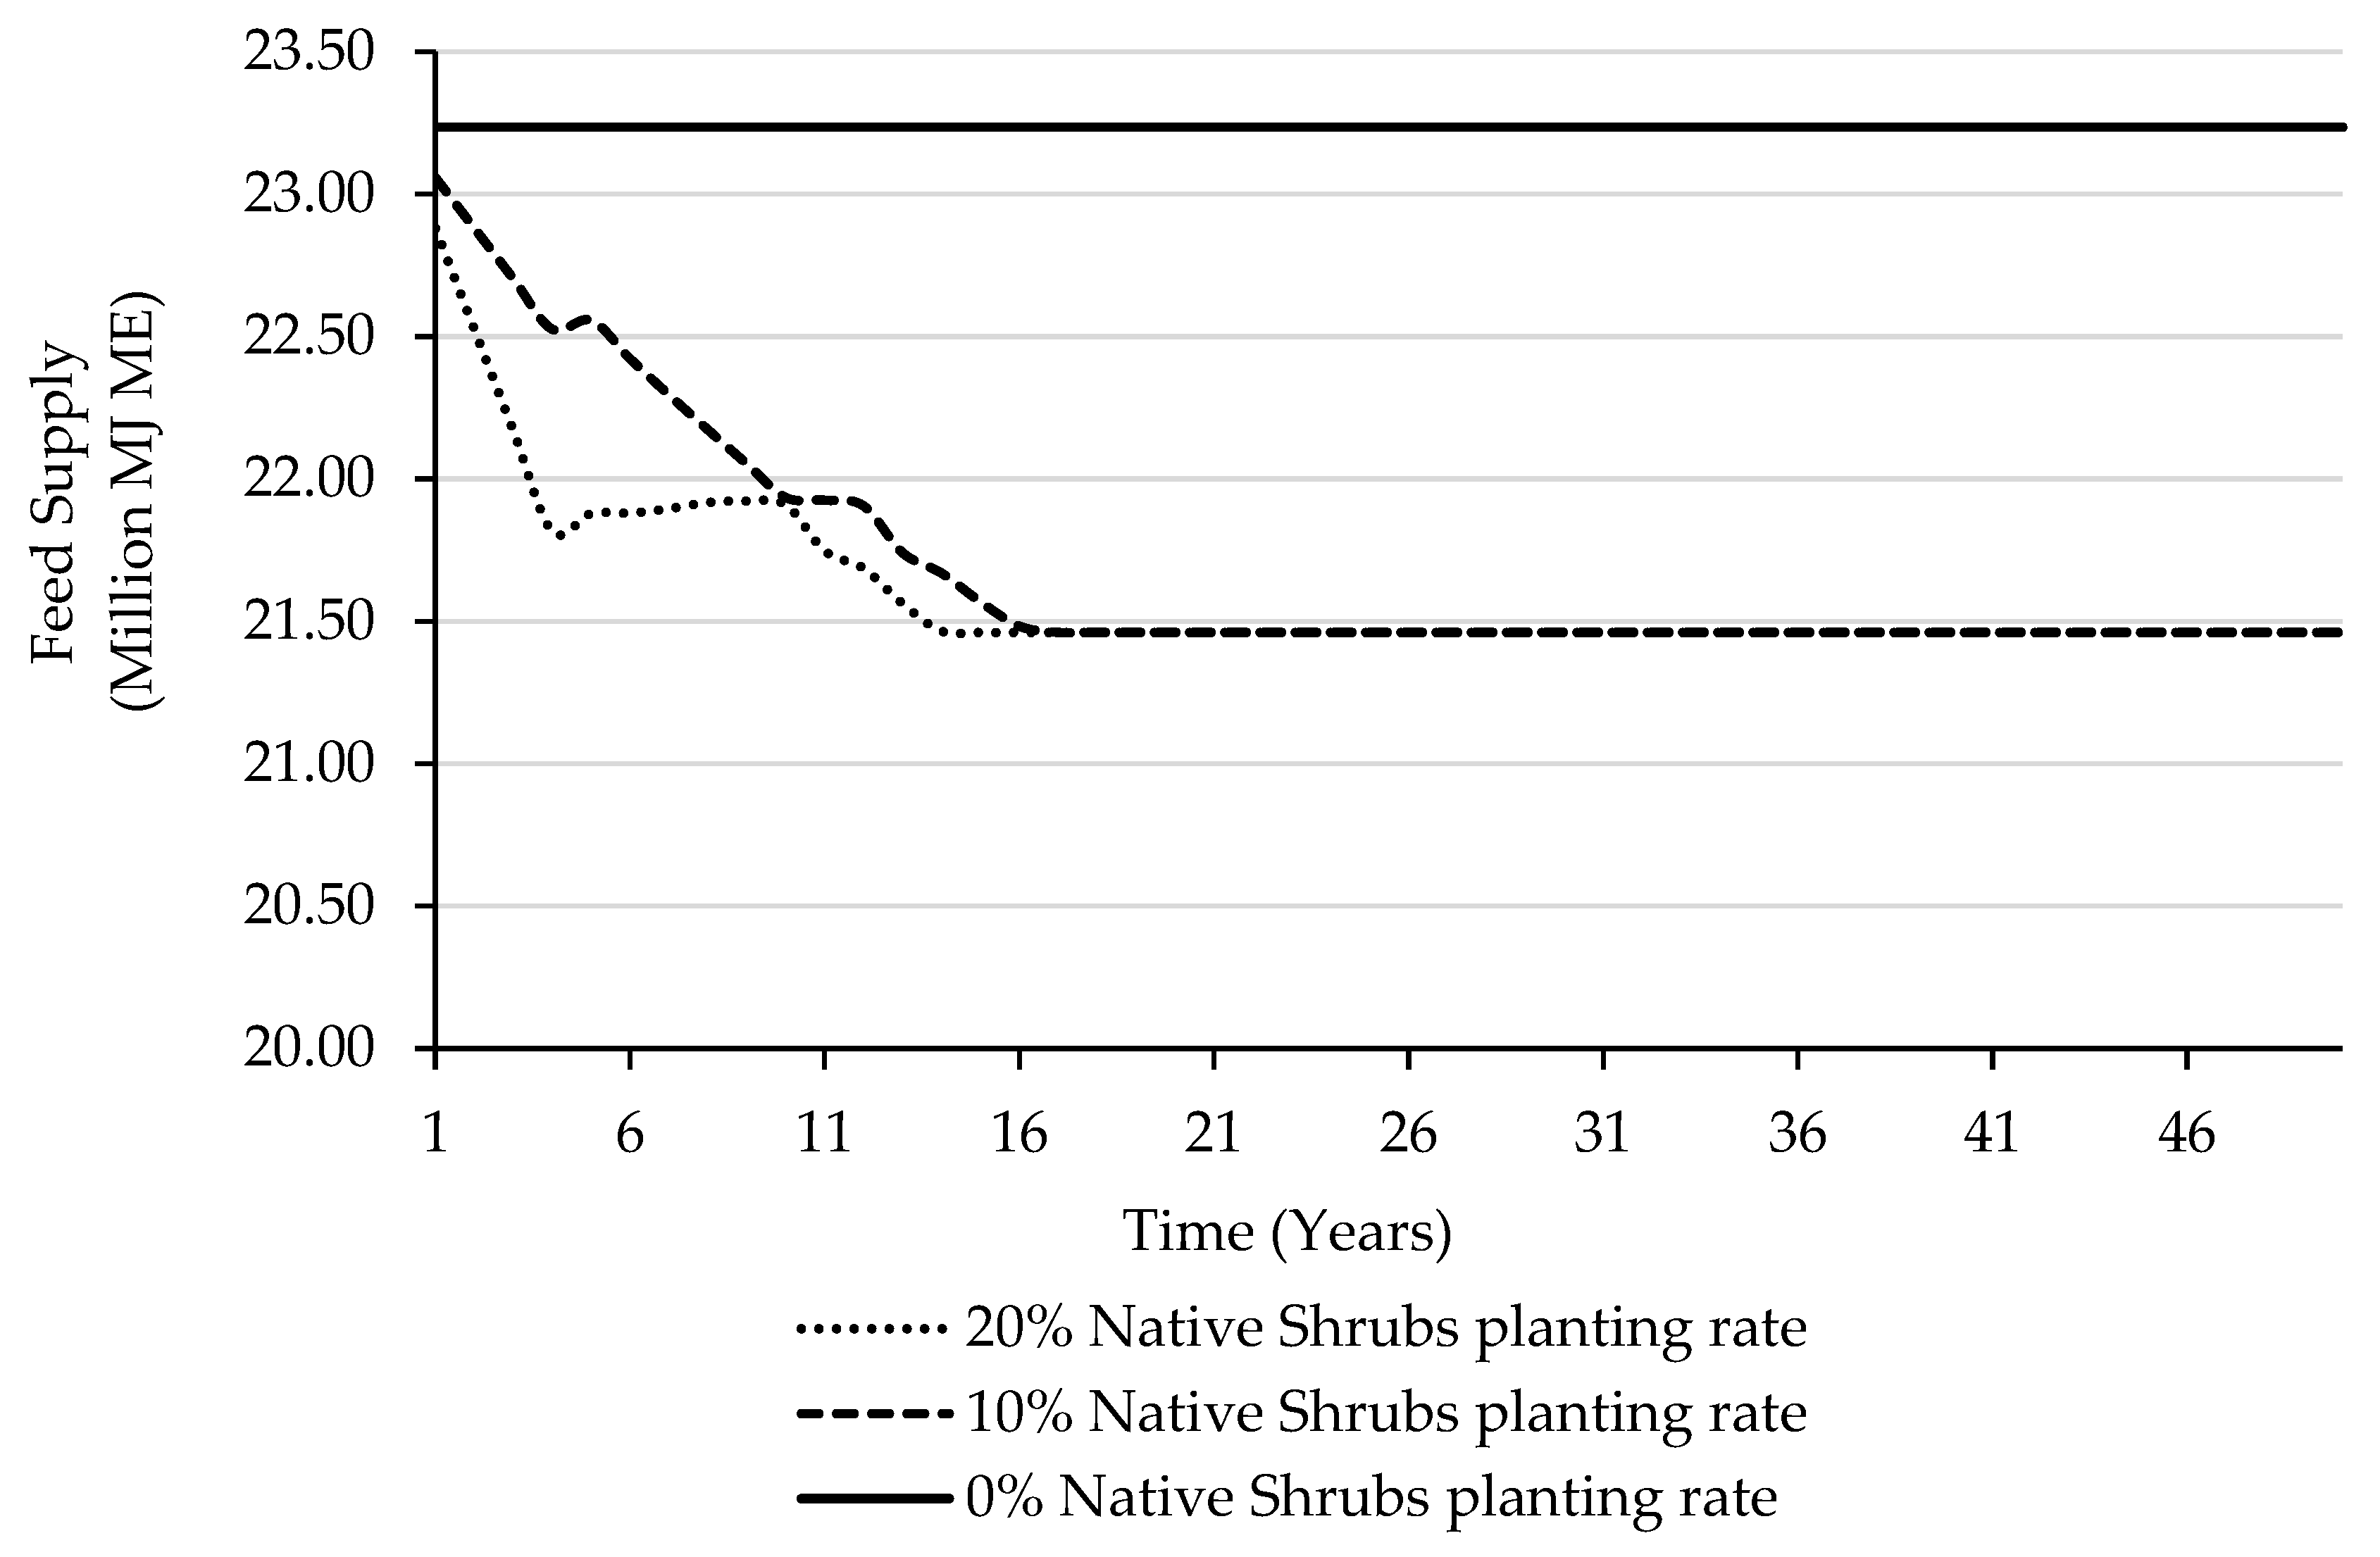
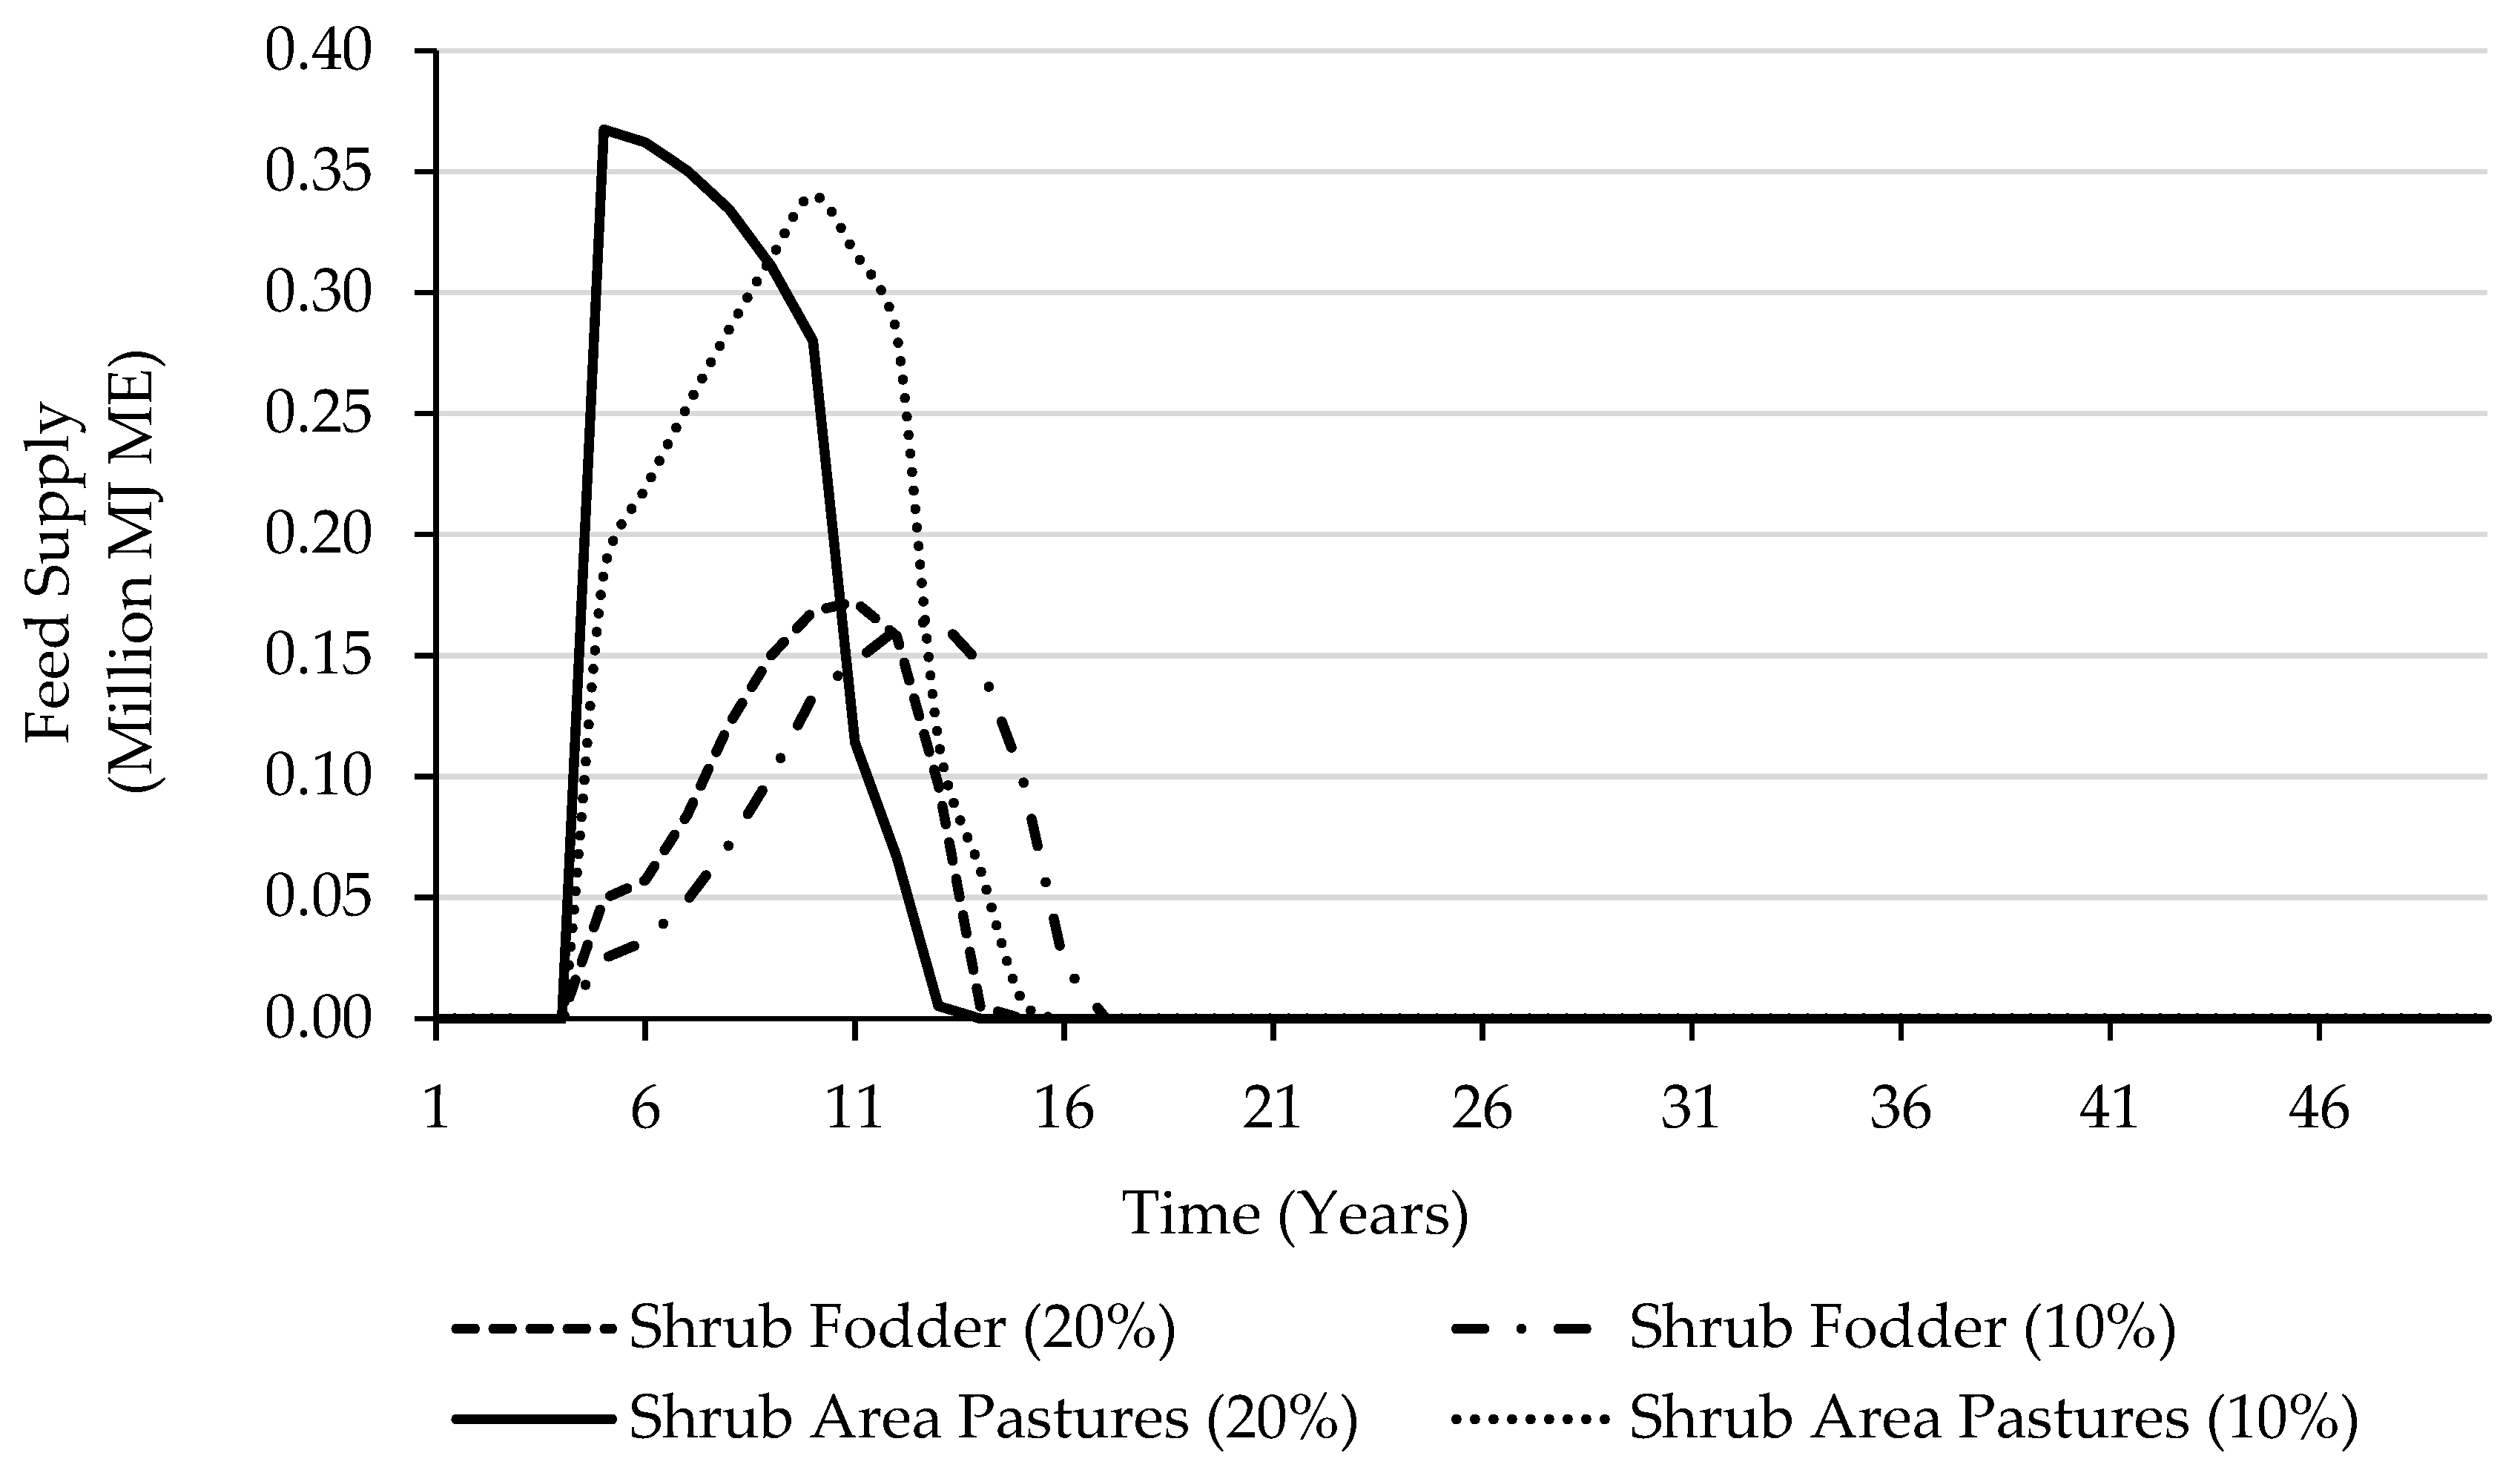
3.1. Feed Supply
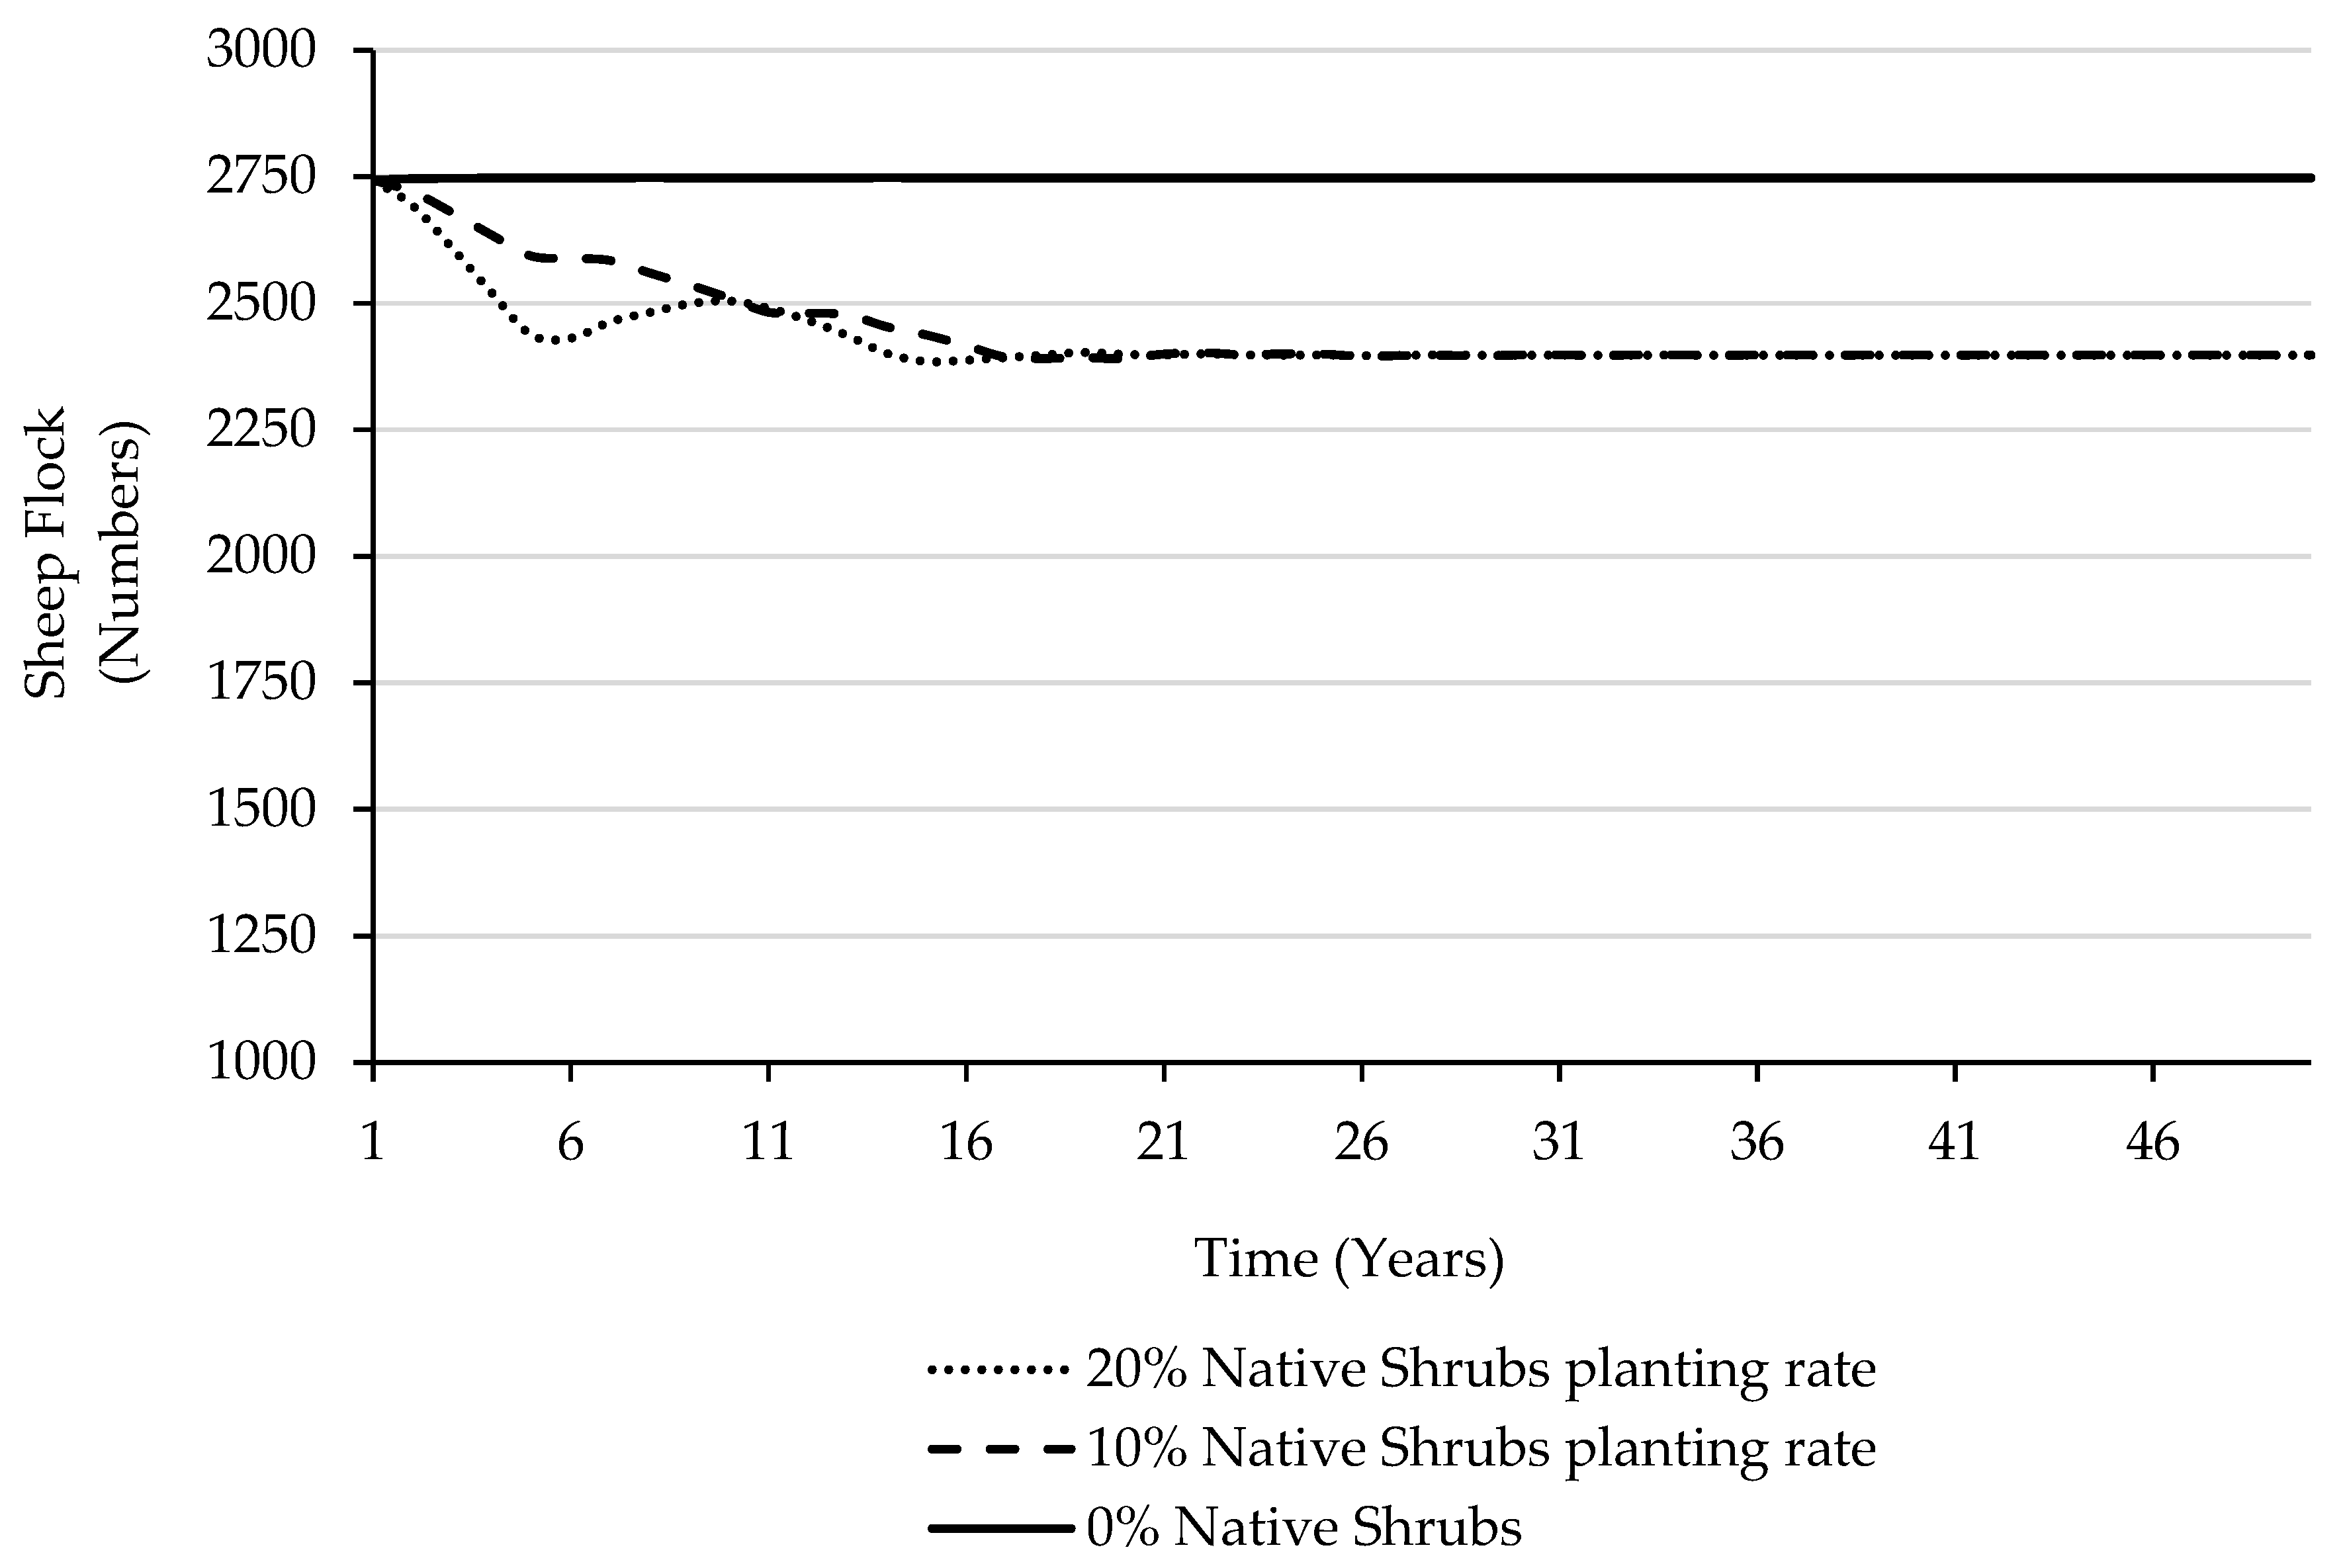
3.2. Flock Dynamics
3.3. Farm Economic Analysis of Establishing Native Shrubs
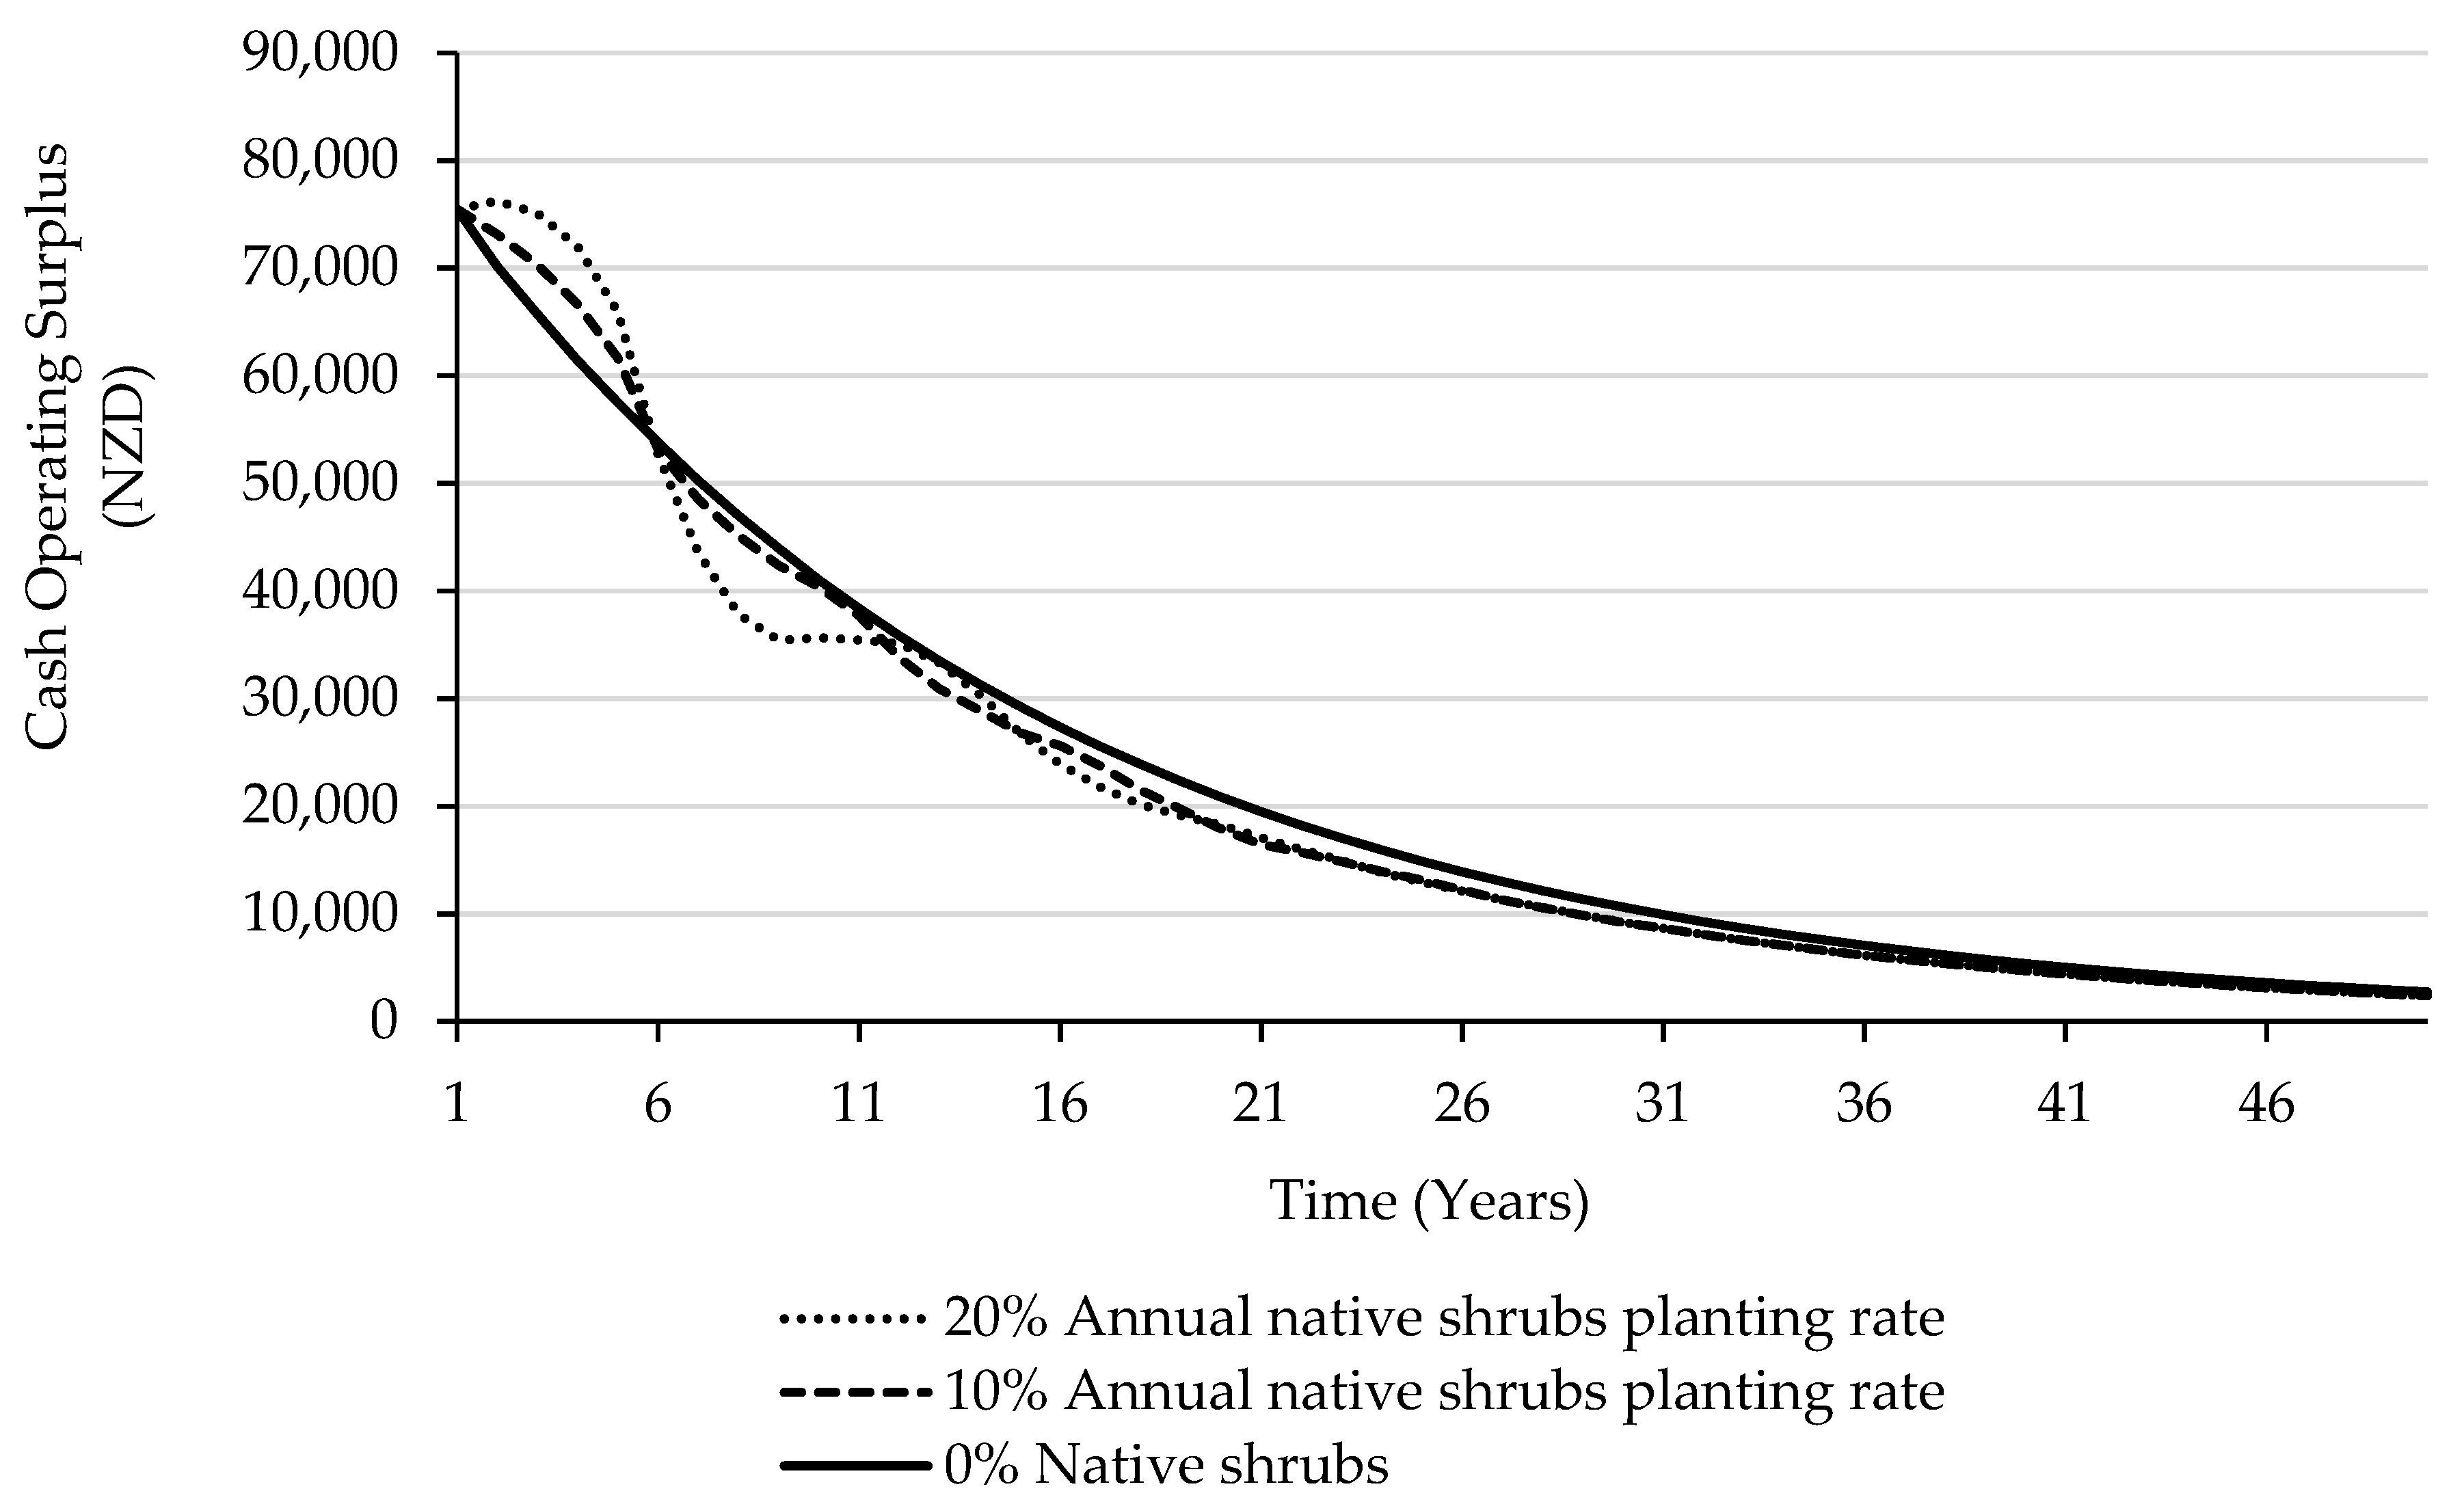
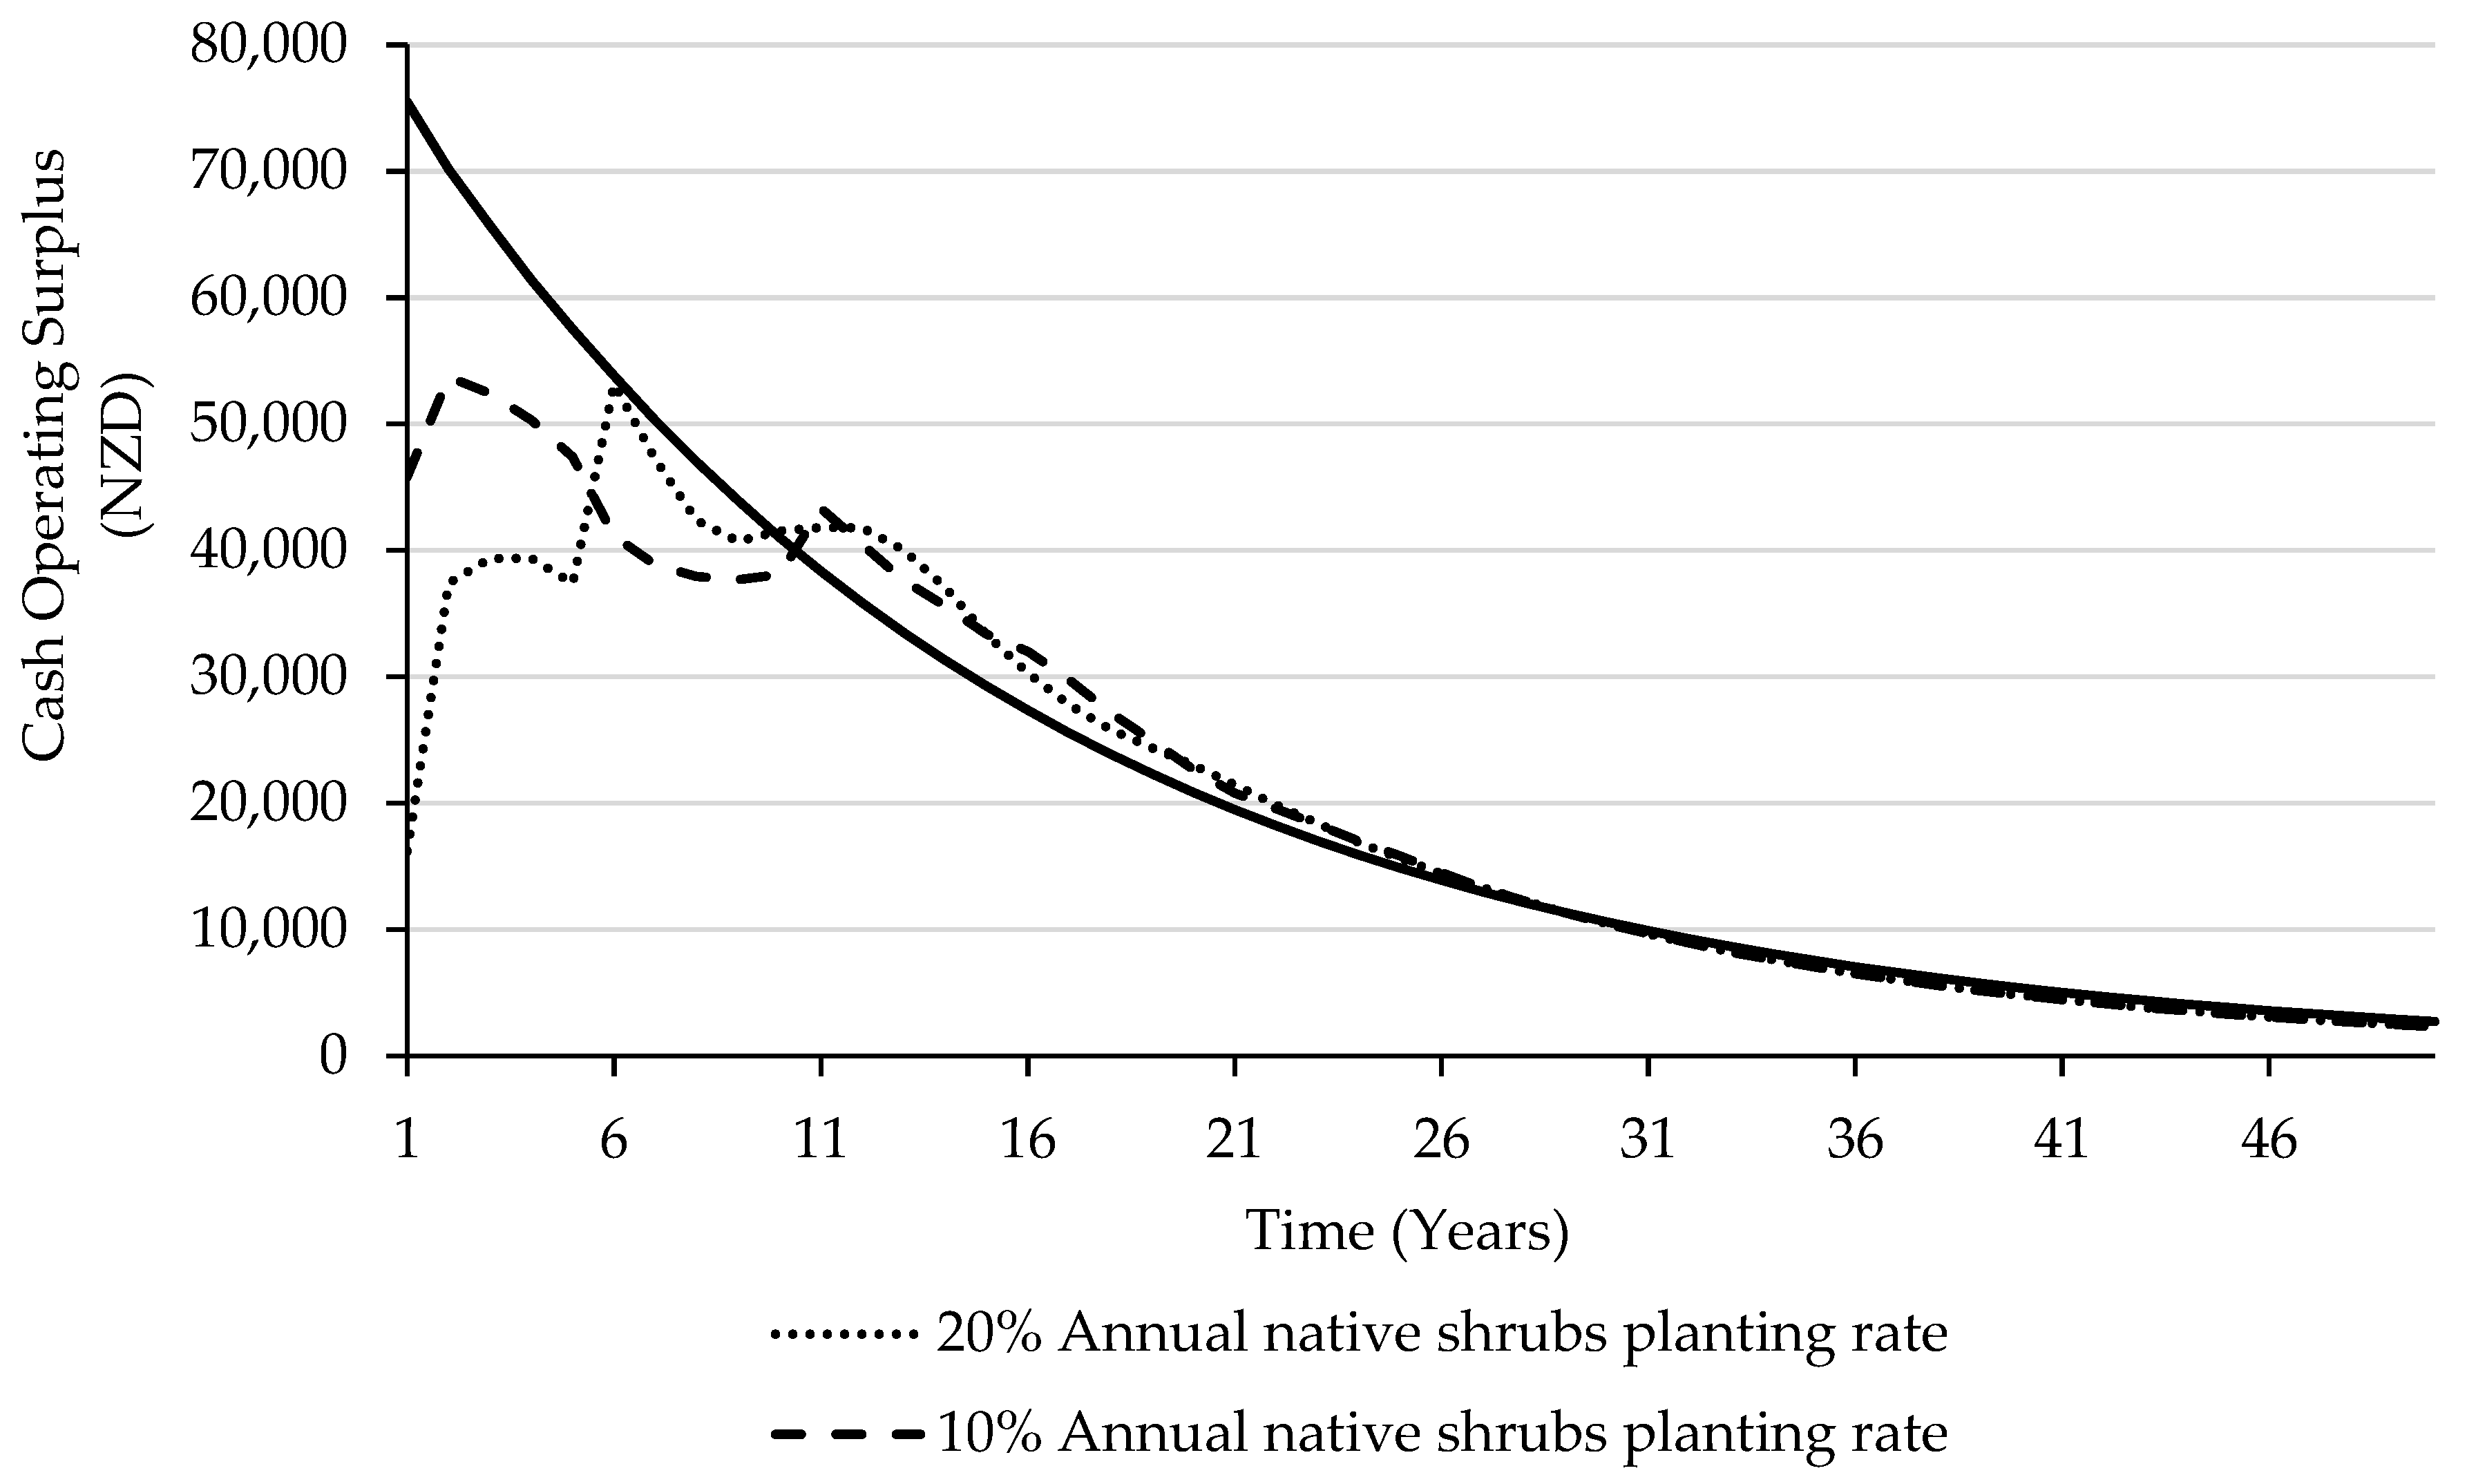
3.3.1. Sheep Enterprise Discounted Cash Operating Surplus from the Sheep Flock
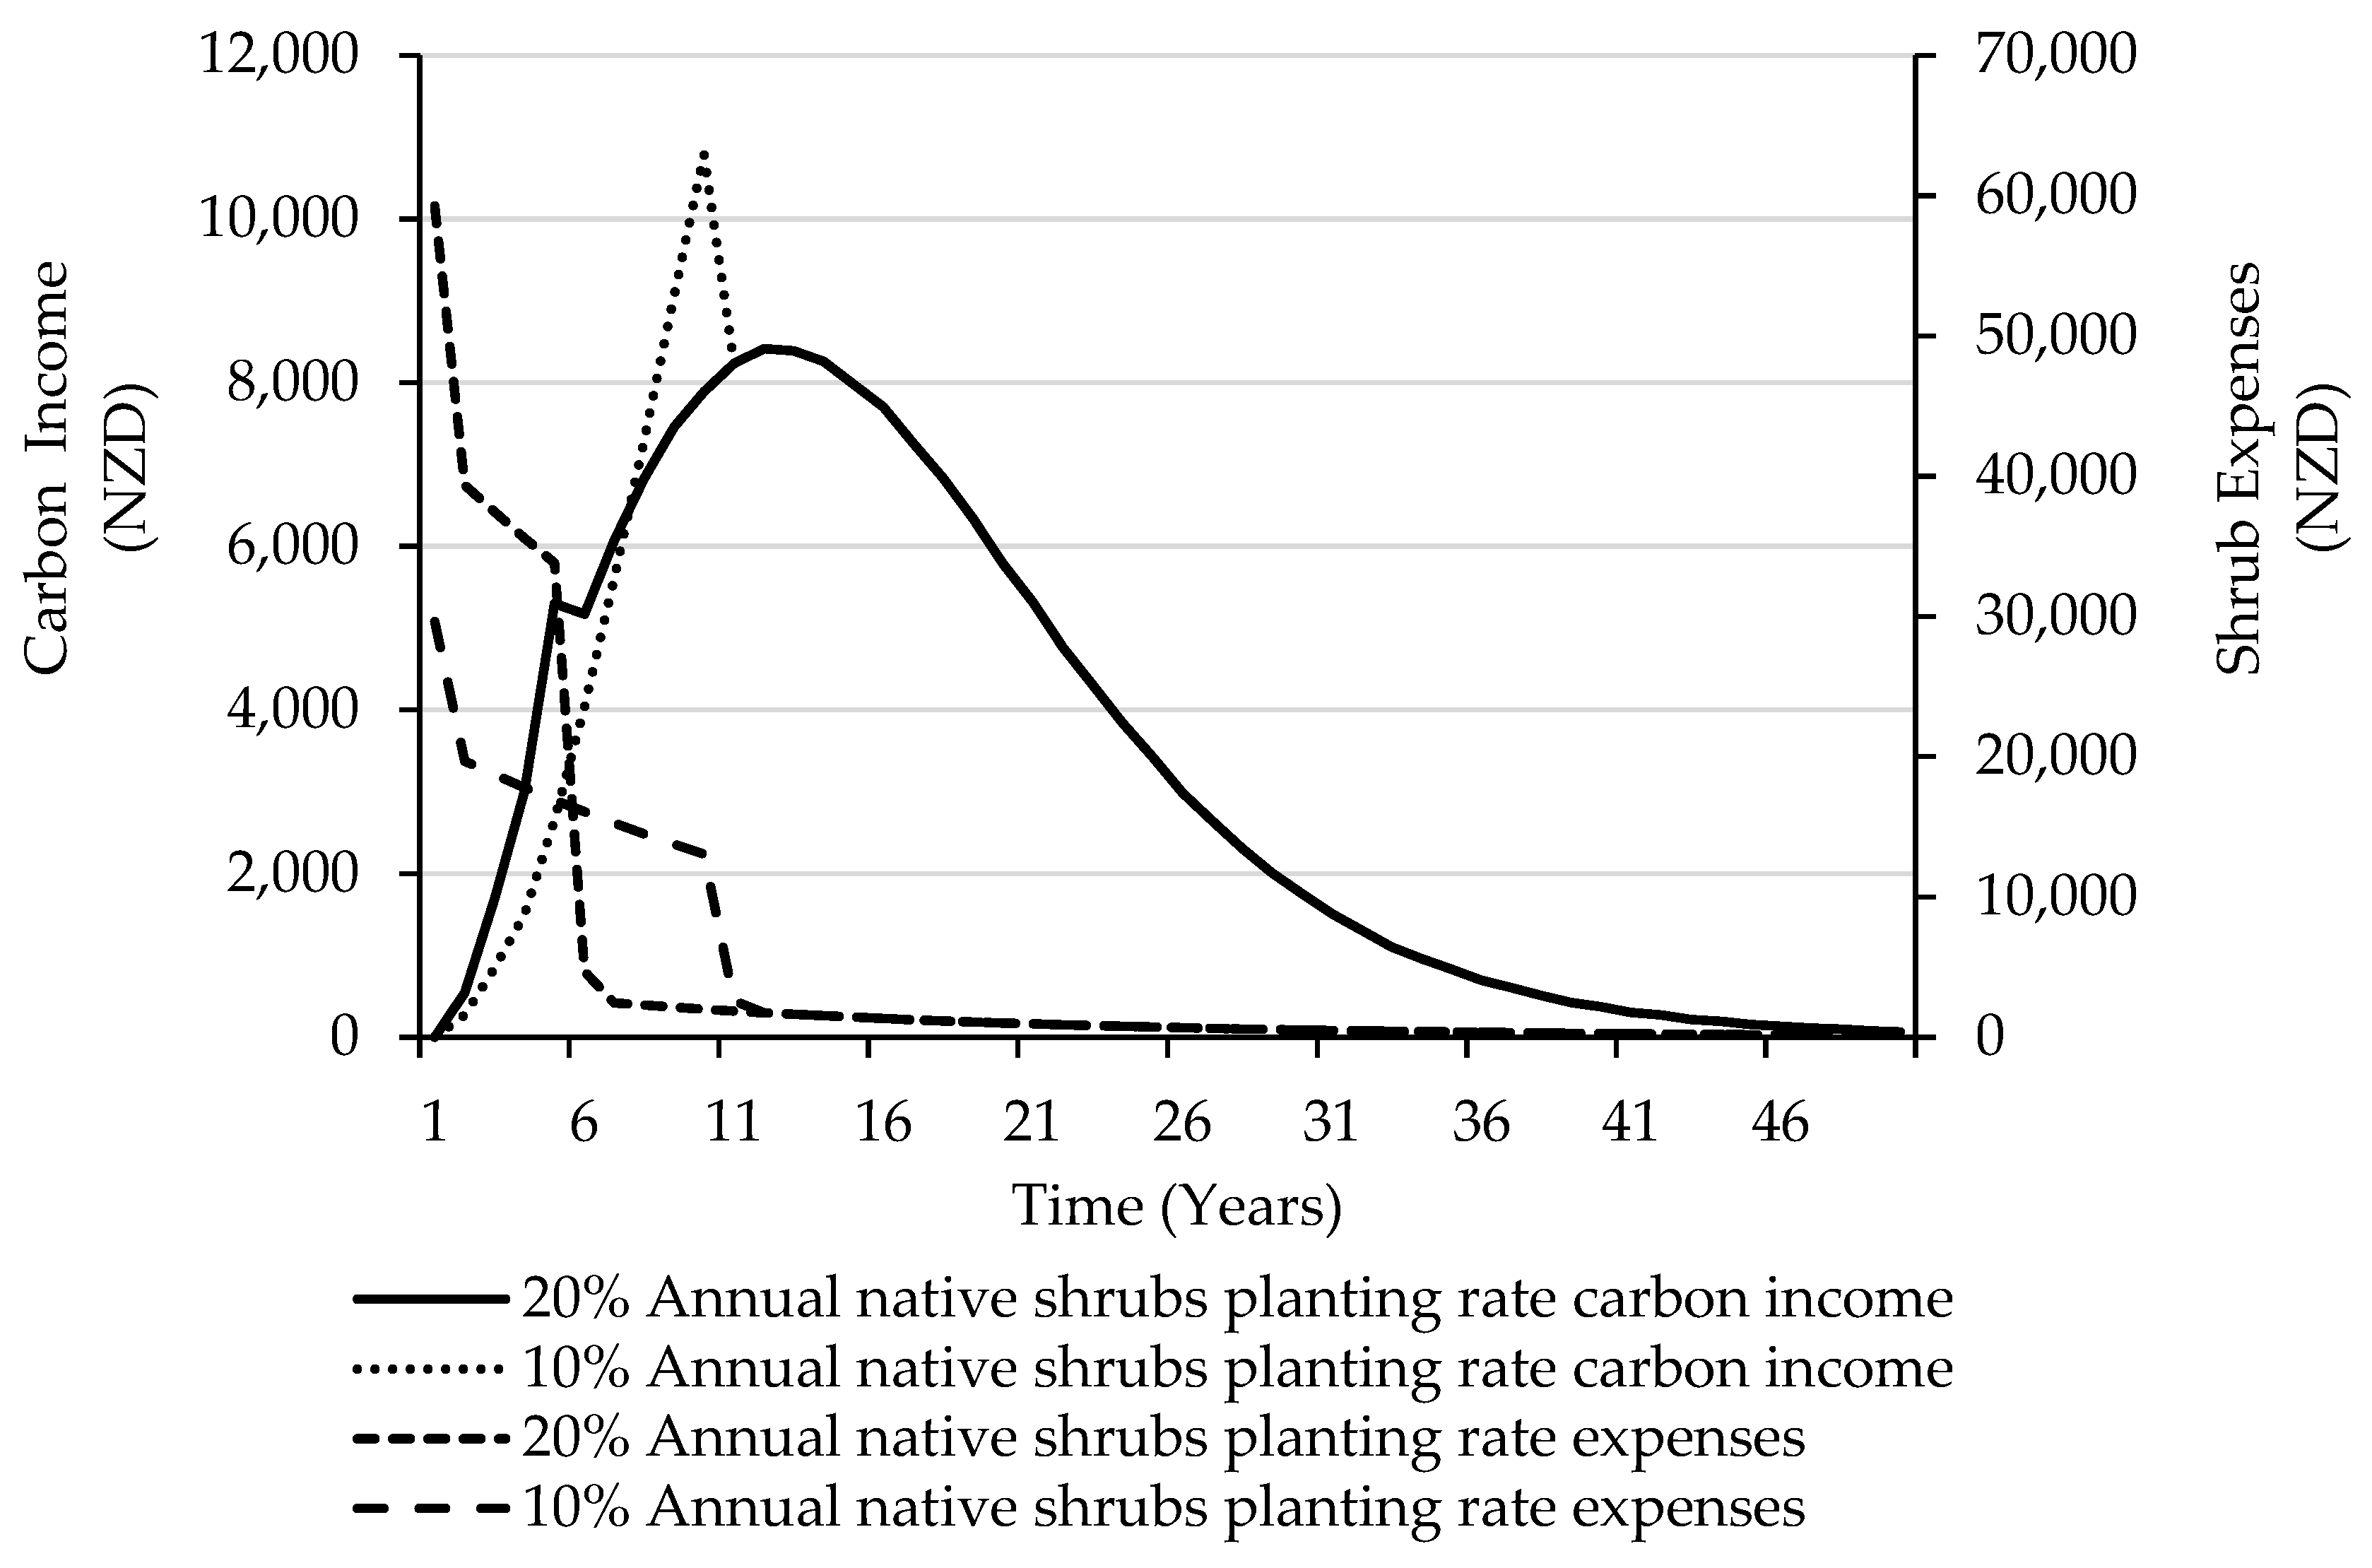
3.3.2. Carbon Income and Native Shrub Expenses
3.3.3. Combined Sheep Enterprise Discounted Cash Operating Surplus
3.3.4. Sheep Enterprise Net Present Value (NPV) and Internal Rate of Return (IRR)
3.3.5. Break Even Analysis for Native Shrub Investment on the Model Farm
4. Conclusions
Author Contributions
Funding
Institutional Review Board Statement
Acknowledgments
Conflicts of Interest
References
- Morris, S.T.; Kenyon, P.R. Intensive sheep and beef production from pasture—A New Zealand perspective of concerns, opportunities and challenges. Meat Sci. 2014, 98, 330–335. [Google Scholar] [CrossRef] [PubMed]
- Beef+Lamb NZ. Farm Facts: Compendium of New Zealand 2020, 44th ed.; Beef + Lamb New Zealand: Wellington, New Zealand, 2020. [Google Scholar]
- StatsNZ Agricultural Production Statistics: June 2020 (Final). Available online: https://www.stats.govt.nz/indicators/livestock-numbers (accessed on 9 March 2020).
- Beef+Lamb NZ. Stock Number Survey as at 30 June 2020; Beef + Lamb New Zealand: Wellington, New Zealand, 2020. [Google Scholar]
- Beef+Lamb NZ. Fact Sheet: Hill Country Sheep and Beef Farms; Beef + Lamb New Zealand: Wellington, New Zealand, 2020. [Google Scholar]
- Kemp, P.D.; Lopez, I.F. Hill Country Pastures in the Southern North Island of New Zealand: An Overview. Hill Ctry.—Grassl. Res. Pract. Ser. 2016, 16, 289–298. [Google Scholar]
- Hodgson, J.; Cameron, K.; Clark, D.; Condron, L.; Fraser, T.; Hedley, M.; Kemp, P.D.; Lucas, R.; Moot, D.; Morris, S.T.; et al. New Zealand’s Pastoral Industries: Efficient Use of Pastoral Resources. In Grasslands: Developments, Opportunities, Perspectives; Reynolds, S.G., Frame, J., Eds.; CRS Press, Tylor & Francis Group: Rome, Italy, 2005; Volume 46, p. 2304. ISBN 9781578083596. [Google Scholar] [CrossRef]
- Basher, L.; Moores, J.; McLean, G. Scientific Basis for Erosion and Sediment Control Practices in New Zealand; Landcare Research: Nelson, New Zealand, 2016. [Google Scholar]
- Lambert, M.G.; Mackay, A.D.; Ganesh, S.; Upsdell, M.P. Responses of grazed New Zealand hill pastures to rates of superphosphate application. N. Z. J. Agric. Res. 2014, 57, 149–164. [Google Scholar] [CrossRef] [Green Version]
- Praat, J.-P. Farming by Land Type: An Approach to Building Resilient Northland Sheep and Beef Farms; New Zealand Landcare Trust: Hamilton, New Zealand, 2011. [Google Scholar]
- Norton, D.; Pannell, J. Desk-top assessment of Native Vegetation on New Zealand Sheep and Beef Farms; Beef + Lamb New Zealand: Wellington, New Zealand, 2018. [Google Scholar]
- Eyles, G. Use of Poplars and Willows for Erosion Control. Available online: https://www.nzffa.org.nz/farm-forestry-model/resource-centre/tree-grower-articles/november-2010/use-of-poplars-and-willows-for-erosion-control/ (accessed on 11 October 2020).
- Basher, L. Erosion Processes and Their Control in New Zealand. In Ecosystem Services in New Zealand: Conditions and Trends; Dymond, J.R., Ed.; Manaaki Whenua Press: Lincoln, New Zealand, 2013; pp. 363–374. ISBN 978-0-478-34736-4. [Google Scholar]
- McIvor, I.R.; Douglas, G.B. Poplars and Willows in Hill Country-Stabilising Soils and Storing Carbon; The New Zealand Institute for Plant & Food Research Limited: Palmerston North, New Zealand, 2012. [Google Scholar]
- Kemp, P.D.; Barry, T.N.; Douglas, G.B. Edible forage yield and nutritive value of poplar and willow. NZGA Res. Pract. Ser. 2003, 10, 53–64. [Google Scholar] [CrossRef]
- Jones, T.; Mcivor, I. Willows and Poplars for Drought Mitigation. Available online: https://www.nzfffa.org.nz/farm-forestry-model/resource-centre/tree-grower-articles/november-2013/willows-and-poplars-for-drought-mitigation (accessed on 10 July 2020).
- Ministry for Primary Industries. A guide to Carbon Look-up Tables for Forestry in the Emissions Trading Scheme; Ministry for Primary Industries: Wellington, New Zealand, 2017.
- Charlton, D.; McIvor, I.; Gawith, P.; Douglas, G.; Deric, C.; McIvor, I.; Gawith, P.; Douglas, G. Growing Poplar and Willow Trees on Farms—Guidelines for Establishing and Managing Poplar and Willow Trees on Farms; National Poplar and Willow Users Group: Palmerston North, New Zealand, 2006. [Google Scholar]
- Farming with Native Trees: A Guide for Farmers from Northland to Waikato; Dodd, M.; Ritchie, H. (Eds.) New Zealand Forest Research Institute Limited: Rotorua, New Zealand, 2007; ISBN 9780478110180. [Google Scholar]
- Kimberley, M.; Bergin, D.; Beets, P. Carbon Sequestration by Planted Native Trees and Shrubs; Tāne’ Tree Trust: Wellington, New Zealand, 2014. [Google Scholar]
- Beets, P.N.; Kimberley, M.O.; Paul, T.S.H.; Oliver, G.R.; Pearce, S.H.; Buswell, J.M. The inventory of carbon stocks in New Zealand’s post-1989 natural forest for reporting under the Kyoto Protocol. Forests 2014, 5, 2230–2252. [Google Scholar] [CrossRef] [Green Version]
- Beef+Lamb NZ. Native Vegetation on Sheep and Beef Farms. Summary Report; Beef + Lamb New Zealand: Wellington, New Zealand, 2018. [Google Scholar]
- Bryant, J.R.; Snow, V.O. Modelling pastoral farm agro-ecosystems: A review. N. Z. J. Agric. Res. 2008, 51, 349–363. [Google Scholar] [CrossRef]
- Farrell, L.J. Bio-Economic System-Dynamics Modelling to Investigate Strategic Management Options in New Zealand Sheep Farming Enterprises. Ph.D. Thesis, Massey University, Palmerston North, New Zealand, 2020. [Google Scholar]
- Farrell, L.J.; Tozer, P.R.; Kenyon, P.R.; Ramilan, T.; Cranston, L.M. The effect of ewe wastage in New Zealand sheep and beef farms on flock productivity and farm profitability. Agric. Syst. 2019, 174, 125–132. [Google Scholar] [CrossRef]
- Farrell, L.J.; Kenyon, P.R.; Tozer, P.R.; Ramilan, T.; Cranston, L.M. Quantifying sheep enterprise profitability with varying flock replacement rates, lambing rates, and breeding strategies in New Zealand. Agric. Syst. 2020, 184, 102888. [Google Scholar] [CrossRef]
- Farrell, L.J.; Kenyon, P.R.; Tozer, P.R.; Morris, S.T. Determining the impact of hogget breeding performance on profitability under a fixed feed supply scenario in New Zealand. Animals 2021, 11, 1303. [Google Scholar] [CrossRef]
- Farrell, L.J.; Morris, S.T.; Kenyon, P.R.; Tozer, P.R. Simulating beef cattle herd productivity with varying cow liveweight and fixed feed supply. Agriculture 2021, 11, 35. [Google Scholar] [CrossRef]
- Hendy, J.; Ausseil, A.-G.; Bain, I.; Blanc, É.; Fleming, D.; Gibbs, J.; Hall, A.; Herzig, A.; Kavanagh, P.; Kerr, S.; et al. Land-Use Modelling in New Zealand: Current Practice and Future Needs. SSRN Electron. J. 2019. [Google Scholar] [CrossRef] [Green Version]
- Bicknell, K.; Edwards, P.; Trafford, G.; Dooley, L. Farm System Modelling in New Zealand Literature Review; Dairy NZ: Hamilton, New Zealand, 2015. [Google Scholar]
- Farrell, L.J.; Kenyon, P.R.; Morris, S.T.; Tozer, P.R. The impact of hogget and mature flock reproductive success on sheep farm productivity. Agriculture 2020, 10, 566. [Google Scholar] [CrossRef]
- Farrell, L.J.; Morris, S.T.; Kenyon, P.R.; Tozer, P.R. Modelling a transition from purebred Romney to fully shedding Wiltshire–Romney crossbred. Animals 2020, 10, 2066. [Google Scholar] [CrossRef]
- López, I.F.; Lambert, M.G.; Mackay, A.D.; Valentine, I. The influence of topography and pasture management on soil characteristics and herbage accumulation in hill pasture in the North Island of New Zealand. Plant Soil 2003, 255, 421–434. [Google Scholar] [CrossRef]
- Bay of Plenty Regional Council. Uses and Management of Exotic Species: Poplars and Willows for Soil Conservation; Land Management Factsheet; Bay of Plenty Regional Council: Tauranga, New Zealand, 2020.
- Moot, D.; Mills, A.; Lucas, D.; Scott, W. Country Pasture/Forage Resource Profiles: New Zealand; Food and Agriculture Organization of the United Nations (FAO): Rome, Italy, 2009. [Google Scholar]
- Cranston, L.; Ridler, A.; Greer, A.; Kenyon, P.R. Livestock production in New Zealand. In Livestock Production in New Zealand; Stafford, K., Ed.; Massey University Press: Palmerston North, New Zealand, 2017; p. 304. ISBN 0994136315. [Google Scholar]
- Beef+Lamb NZ. Economic Service Sheep & Beef Farm Survey: Gisborne/Hawkes Bay/Wairarapa 2020-21 Forecast and Quintile Analysis of Final 2018-19 Survey Data|P20018; Beef + Lamb New Zealand: Wellington, New Zealand, 2020. [Google Scholar]
- Lynn, I.; Manderson, A.; Page, M.; Harmsworth, G.; Eyles, G.; Douglas, G.; Mackay, A.; Newsome, P. Land Use Capability Survey Handbook, 3rd ed.; AgResearch Ltd.: Hamilton, New Zealand; Landcare Research New Zealand Ltd.: Lincoln, New Zealand; Institute of Geological and Nuclear Sciences Ltd., Lower Hutt: Wellington, New Zealand, 2009; ISBN 9780477100915. [Google Scholar]
- Saggar, S.; Giltrap, D.L.; Davison, R.; Gibson, R.; de Klein, C.A.M.; Rollo, M.; Ettema, P.; Rys, G. Estimating direct N2O emissions from sheep, beef, and deer grazed pastures in New Zealand hill country: Accounting for the effect of land slope on the N2O emission factors from urine and dung. Agric. Ecosyst. Environ. 2015, 205, 70–78. [Google Scholar] [CrossRef] [Green Version]
- Lambie, S.; Marden, M.; Kirschbaum, M.; Soliman, T.; Walsh, P.; Landcare, M.W. Best Options for Land Use Following Radiata Harvest in the Gisborne District under Climate Change: Literature Review; SLMACC 405415; Ministry for Primary Industries: Wellington, New Zealand, 2018; Volume 4. [Google Scholar]
- Spiekermann, R.; Marden, M. Best Options for Land Use Following Radiata Harvest in the Gisborne District under Climate Change: Spatial Analysis of Erosion Susceptibility in Plantation Forests, East Coast Region; MPI Technical Paper; Ministry for Primary Industries: Wellington, New Zealand, 2018; Volume 1. [Google Scholar]
- Hedley, C.; Manderson, A.; Mudge, P.; Roudier, P.; Fraser, S.; Parfitt, R.; Smaill, S.; Schipper, L.; Kelliher, F. Improved Measurements of Hill Country Soil Carbon—To Assist Carbon Change Studies; Ministry for Primary Industries: Wellington, New Zealand, 2015; Volume 2. [Google Scholar]
- Burggraaf, V.; Stevens, D.; Vibart, R. The Effect of Grazing State on Pasture Quality and Implications for the New Zealand Greenhouse Gas Inventory; Final Report; Ministry for Primary Industries: Wellington, New Zealand, 2018; Volume 9.
- Marden, M.; Fuller, I.C.; Herzig, A.; Betts, H.D. Badass gullies: Fluvio-mass-movement gully complexes in New Zealand’s East Coast region, and potential for remediation. Geomorphology 2018, 307, 12–23. [Google Scholar] [CrossRef]
- Lambert, M.G.; Clark, D.A.; Grant, D.A.; Costall, D.A.; Fletcher, R.H. Influence of fertiliser and grazing management on north island moist hill country: 1. Herbage accumulation. N. Z. J. Agric. Res. 1983, 26, 95–108. [Google Scholar] [CrossRef] [Green Version]
- Ledgard, S.F.; Sheath, G.W.; Gillingham, A.G. Influence of some soil and pasture components on the growth of hill country pastures 1. Winter and spring production. N. Z. J. Exp. Agric. 1982, 10, 239–244. [Google Scholar] [CrossRef] [Green Version]
- Harmsworth, G.R. Land Use Capability Classification of the Northland Region: A Report to Accompany the Second Edition New Zealand Land Resource Inventory; Manaaki Whenua Press: Canterbury, New Zealand, 1996. [Google Scholar]
- Page, M.J. Land Use Capability Classification of the Northern Hawke’s Bay Region; Ministry of Works and Development: Wellington, New Zealand, 1988.
- Murray, R.J.; Crippen, T.F.; Page, M.J.; Rijkse, W.C.; Harmsworth, G.R.; Mcleod, M. Land Use Capability Classification of the Gisborn—East Coast Region; Manaaki Whenua Press: Canterbury, New Zealand, 1999. [Google Scholar]
- Cameron, D. Sustaining the productivity of New Zealand’s hill country—A land manager’s view. NZGA Res. Pract. Ser. 2016, 16, 151–155. [Google Scholar] [CrossRef]
- Farrell, L.J.; Tozer, P.R.; Kenyon, P.R.; Ramilan, T.; Cranston, L.M. Producing higher value wool through a transition from Romney to Merino crossbred i: Flock dynamics, feed demand, and production of lambs and wool. Small Rumin. Res. 2020, 192, 106212. [Google Scholar] [CrossRef]
- Webby, R.W.; Bywater, A.C. Principles of feed planning and management. In Pasture and Supplements for Grazing Animals; Rattray, P., Brookes, I.M., Nicol, A.M., Eds.; New Zealand Society of Animal Production (Inc.): Hamilton, New Zealand, 2017; p. 339. ISBN 0473052369. [Google Scholar]
- Nicol, A.M.; Brookes, I.M. The metabolisable energy requirements of grazing livestock. In Pasture and Supplements for Grazing Animals; Rattray, P.V., Brookes, I.M., Nicol, A.M., Eds.; New Zealand Society of Animal Production (Inc.): Hamilton, New Zealand, 2017; p. 339. ISBN 0473052369. [Google Scholar]
- Beef+Lamb NZ. A Guide to Feed Planning for Sheep Farmers; Beef+Lamb NZ: Wellington, New Zealand, 2012. [Google Scholar]
- Trafford, G.; Trafford, S. (Eds.) Farm Technical Manual; Faculty of Commerce, Lincoln University: Christchurch, New Zealand, 2011; ISBN 9780864762573. [Google Scholar]
- Paine, C.E.T.; Marthews, T.R.; Vogt, D.R.; Purves, D.; Rees, M.; Hector, A.; Turnbull, L.A. How to fit nonlinear plant growth models and calculate growth rates: An update for ecologists. Methods Ecol. Evol. 2012, 3, 245–256. [Google Scholar] [CrossRef]
- Cao, L.; Shi, P.J.; Li, L.; Chen, G. A new flexible sigmoidal growth model. Symmetry 2019, 11, 204. [Google Scholar] [CrossRef] [Green Version]
- McKenzie, H.; Hay, E. Performance of Eucalyptus saligna in New Zealand; New Zealand Forest Research Institute: Rotorua, New Zealand, 1996.
- Oppong, S.K.; Kemp, P.D.; Douglas, G.B.; Foote, A.G. Browse yield and nutritive value of two Salix species and Dorycnium rectum in New Zealand. Agrofor. Syst. 2001, 51, 11–21. [Google Scholar] [CrossRef]
- Ma, S.; He, F.; Tian, D.; Zou, D.; Yan, Z.; Yang, Y.; Zhou, T.; Huang, K.; Shen, H.; Fang, J. Variations and determinants of carbon content in plants: A global synthesis. Biogeosciences 2018, 15, 693–702. [Google Scholar] [CrossRef] [Green Version]
- Marden, M.; Lambie, S.; Phillips, C. Biomass and root attributes of eight of New Zealand’s most common indigenous evergreen conifer and broadleaved forest species during the first 5 years of establishment. N. Z. J. For. Sci. 2018, 48, 1–26. [Google Scholar] [CrossRef]
- Poorter, H.; Niklas, K.J.; Reich, P.B.; Oleksyn, J.; Poot, P.; Mommer, L. Biomass allocation to leaves, stems and roots: Meta-analyses of interspecific variation and environmental control. New Phytol. 2012, 193, 30–50. [Google Scholar] [CrossRef]
- Marden, M.; Rowan, D.; Phillips, C. Stabilising characteristics of New Zealand indigenous riparian colonising plants. Plant Soil 2005, 278, 95–105. [Google Scholar] [CrossRef]
- Mason, N.W.H.; Beets, P.N.; Payton, I.; Burrows, L.; Holdaway, R.J.; Carswell, F.E. Individual-based allometric equations accurately measure carbon storage and sequestration in shrublands. Forests 2014, 5, 309–324. [Google Scholar] [CrossRef] [Green Version]
- Benavides, R.; Douglas, G.B.; Osoro, K. Silvopastoralism in New Zealand: Review of effects of evergreen and deciduous trees on pasture dynamics. Agrofor. Syst. 2009, 76, 327–350. [Google Scholar] [CrossRef]
- Devkota, N.R.; Kemp, P.D.; Hodgson, J.; Valentine, I.; Jaya, I.K.D. Relationship between tree canopy height and the production of pasture species in a silvopastoral system based on alder trees. Agrofor. Syst. 2009, 76, 363–374. [Google Scholar] [CrossRef]
- McElwee, H.F.; Knowles, R.L. Estimating canopy closure and understorey pasture production in New Zealand-grown poplar plantations. N. Z. J. For. Sci. 2000, 30, 422–435. [Google Scholar]
- Hussain, Z.; Kemp, P.D.; Horne, D.J.; Jaya, I.K.D. Pasture production under densely planted young willow and poplar in a silvopastoral system. Agrofor. Syst. 2009, 76, 351–362. [Google Scholar] [CrossRef]
- Scanlan, I.; McElhinny, C.; Turner, P. A Methodology for modelling canopy structure: An exploratory analysis in the tall wet eucalypt forests of southern Tasmania. Forests 2010, 1, 4–24. [Google Scholar] [CrossRef] [Green Version]
- Sanon, H.O.; Kaboré-Zoungrana, C.; Ledin, I. Behaviour of goats, sheep and cattle and their selection of browse species on natural pasture in a Sahelian area. Small Rumin. Res. 2007, 67, 64–74. [Google Scholar] [CrossRef]
- McEvoy, P.M.; McAdam, J.H. Sheep grazing in young oak Quercus spp. and ash Fraxinus excelsior plantations: Vegetation control, seasonality and tree damage. Agrofor. Syst. 2008, 74, 199–211. [Google Scholar] [CrossRef]
- Mäkelä, A. A Carbon Balance Model of Growth and Self-Pruning in Trees Based on Structural Relationships. For. Sci. 1997, 43, 7–24. [Google Scholar]
- Farrell, L.J.; Tozer, P.R.; Kenyon, P.R.; Ramilan, T.; Cranston, L.M. Producing higher value wool through a transition from Romney to Merino crossbred ii: Cashflow and profit. Small Rumin. Res. 2020, 192, 106236. [Google Scholar] [CrossRef]
- Mathilde, B. Long Term Carbon Price Data; Carbon Forest Services: Wellington, New Zealand, 2021. [Google Scholar]
- Beef+Lamb NZ. A Guide to Feed Planning for Sheep Farmers; Beef+Lamb NZ: Wellington, New Zealand, 2018. [Google Scholar]
- Kemp, P.D.; Mackay, A.D.; Matheson, L.A.; Timmins, M.E. The forage value of poplars and willows. Proc. N. Z. Grassl. Assoc. 2001, 63, 115–119. [Google Scholar] [CrossRef]
- Brookshire, E.N.J.; Kauffman, J.B.; Lytjen, D.; Otting, N. Cumulative effects of wild ungulate and livestock herbivory on riparian willows. Oecologia 2002, 132, 559–566. [Google Scholar] [CrossRef]
- Ouédraogo-Koné, S.; Kaboré-Zoungrana, C.Y.; Ledin, I. Behaviour of goats, sheep and cattle on natural pasture in the sub-humid zone of West Africa. Livest. Sci. 2006, 105, 244–252. [Google Scholar] [CrossRef]
- Hopkinson, M. Net Present Value and Risk Modelling for Projects; Routledge, Taylor & Francis Group: New York, NY, USA, 2016; ISBN 9781351915267. [Google Scholar] [CrossRef]
- Beef+Lamb NZ. Annual Report 2016-17; Beef+Lamb NZ: Wellington, New Zealand, 2017. [Google Scholar]
- Evison, D. A method for comparing investment returns from major rural land uses including forestry. N. Z. J. For. 2008, 53, 27–32. [Google Scholar]
- Herbohn, J.; Harrison, S. Socio-economic research methods in forestry: A training manual. In Proceedings of the International Training Workshop, Baybay, Philippines, 4–10 February 2002; Harrison, S., Herbohn, J., Mangaoang, E., Vanclay, J., Eds.; Cooperative Research Centre for Tropical Rainforest Ecology and Management: Queensland, Australia, 2002; p. 238. [Google Scholar]
- The Treasury. Public Sector Discount Rates for Cost Benefit Analysis; The Treasury: Wellington, New Zealand, 2008.
- Reserve Bank of New Zealand Retail Interest Rates on Lending and Deposits (B3). Available online: https://www.rbnz.govt.nz/statistics/b3 (accessed on 13 August 2021).
- Bergin, D. (Ed.) Planting and Managing Native Trees. In Tāne’ Tree Trust Technical Handbook; Tāne’ Tree Trust: Wellington, New Zealand, 2014; p. 243. [Google Scholar]
- Pollock, K.M. Plant Materials Handbook for Soil Conservation: Native Plants; Water and Soil Direclorate, Ministry of Works and Development: Wellington, New Zealand, 1986; Volume 3.
- Saunders, L. The Mānuka and Kānuka Plantation Guide; Boffa Miskell Limited: Wellington, New Zealand, 2017. [Google Scholar]
- Fernandez, M.A. Adoption of erosion management practices in New Zealand. Land Use Policy 2017, 63, 236–245. [Google Scholar] [CrossRef]
- Carver, T.; Kerr, S. Facilitating Carbon Offsets from Native Forests; Motu Economic and Public Policy Research: Wellington, New Zealand, 2017. [Google Scholar]
- Ministry for the Environment & Stats NZ. New Zealand’s Environmental Reporting Series: Environment Aotearoa 2019; Ministry for the Environment & Stats NZ: Wellington, New Zealand, 2019.
- Rae, A.; Nixon, C.; Lattimore, R. Adjustment to Agricultural Policy Reform—Issues and Lessons from the New Zealand Experience; NZ Trade Consortium Working Paper; New Zealand Institute of Economic Research (NZIER): Wellington, New Zealand, 2004. [Google Scholar]
- Smith, W.; Montgomery, H. Revolution or evolution? New Zealand agriculture since 1984. GeoJournal 2004, 59, 107–118. [Google Scholar] [CrossRef]
- Morris, S.T. Economics of sheep production. Small Rumin. Res. 2009, 86, 59–62. [Google Scholar] [CrossRef]
- Crean, M.J. Revealing the true meaning of the IRR via profiling the IRR and defining the ERR. J. Real Estate Portf. Manag. 2005, 11, 323–330. [Google Scholar] [CrossRef]
- Patrick, M.; French, N. The internal rate of return (IRR): Projections, benchmarks and pitfalls. J. Prop. Invest. Financ. 2016, 34, 664–669. [Google Scholar] [CrossRef] [Green Version]
- Manley, B. Impacts of Carbon Prices on Indicators of Competitiveness; MPI Technical Paper No: 2019/13; Ministry for Primary Industries: Wellington, New Zealand, 2019.
- Carver, T.; Dawson, P.; Kerr, S. Including Forestry in an Emissions Trading Scheme: Lessons from New Zealand. SSRN Electron. J. 2018. [Google Scholar] [CrossRef] [Green Version]


| Pasture % Change Relative to the Low Slope | Pasture Yield (DM kg/ha/y) | Source | ||||
|---|---|---|---|---|---|---|
| Low | Medium | Steep | Low | Medium | Steep | |
| 100 | 46.2 | 31.9 | 12,568 | 5806 | 4003 | [6] 1 |
| 100 | 73.8 | 65.6 | 13,803 | 10,188 | 9050 | [9] 2 |
| 100 | 81.6 | 61.3 | 15,773 | 12,878 | 9669 | [9] 2 |
| 100 | 77.2 | 58.0 | 14,072 | 10,857 | 8164 | [45] 2 |
| 100 | 76.9 | 46.2 | 9425 | 7250 | 4350 | [10] 3 |
| Planting Rate (%) | Slope Category Mean Annual Feed Supply | Total Farm Mean Annual Feed Supply | Feed Supply to Sheep | Feed Supply to Beef | ||||
|---|---|---|---|---|---|---|---|---|
| Low | Medium | Steep | Feed | % | Feed | % | ||
| 0 | 4.05 | 11.13 | 8.05 | 23.23 | 13.94 | 60.0 | 9.29 | 40.0 |
| 10 | 4.05 | 11.13 | 6.51 | 21.69 | 12.40 | 57.2 | 9.29 | 42.8 |
| 20 | 4.05 | 11.13 | 6.41 | 21.59 | 12.30 | 57.0 | 9.29 | 43.0 |
| Planting Rate (%) | Discount Rate (%) | |||
|---|---|---|---|---|
| 5 | 7 | 10 | 50 1 | |
| 0 | 1,546,937 | 1,191,563 | 879,919 | 241,951 |
| 10 | 1,423,384 | 1,072,865 | 764,458 | 167,786 |
| 20 | 1,342,444 | 991,635 | 683,174 | 100,157 |
| Planting Rate (%) | Discount Rate (%) | ||
|---|---|---|---|
| 5 | 7 | 10 | |
| 10 | 49.90 | 55.67 | 67.50 |
| 20 | 61.30 | 71.41 | 91.24 |
Publisher’s Note: MDPI stays neutral with regard to jurisdictional claims in published maps and institutional affiliations. |
© 2021 by the authors. Licensee MDPI, Basel, Switzerland. This article is an open access article distributed under the terms and conditions of the Creative Commons Attribution (CC BY) license (https://creativecommons.org/licenses/by/4.0/).
Share and Cite
Wangui, J.C.; Kenyon, P.R.; Tozer, P.R.; Millner, J.P.; Pain, S.J. Bioeconomic Modelling to Assess the Impacts of Using Native Shrubs on the Marginal Portions of the Sheep and Beef Hill Country Farms in New Zealand. Agriculture 2021, 11, 1019. https://0-doi-org.brum.beds.ac.uk/10.3390/agriculture11101019
Wangui JC, Kenyon PR, Tozer PR, Millner JP, Pain SJ. Bioeconomic Modelling to Assess the Impacts of Using Native Shrubs on the Marginal Portions of the Sheep and Beef Hill Country Farms in New Zealand. Agriculture. 2021; 11(10):1019. https://0-doi-org.brum.beds.ac.uk/10.3390/agriculture11101019
Chicago/Turabian StyleWangui, James Chege, Paul R. Kenyon, Peter R. Tozer, James P. Millner, and Sarah J. Pain. 2021. "Bioeconomic Modelling to Assess the Impacts of Using Native Shrubs on the Marginal Portions of the Sheep and Beef Hill Country Farms in New Zealand" Agriculture 11, no. 10: 1019. https://0-doi-org.brum.beds.ac.uk/10.3390/agriculture11101019