
Introducing Grasslands into Crop Rotations, a Way to Restore Microbiodiversity and Soil Functions

 ,
,
Abstract
:1. Introduction
2. Materials and Methods
2.1. Soil Samples
2.2. Microbial Biomass C Measurement
2.3. Phospholipid Fatty Acids (PLFAs) Analysis
2.4. Ergosterol Analysis
2.5. Total DNA Extraction and Quantification
2.6. Real-Time PCR Amplification
2.7. Enzyme Assays
2.8. Statistical Data Analysis
3. Results
3.1. Soil Physicochemical Characteristics
3.2. Microbial Communities’ Abundance
3.3. Enzyme Activities
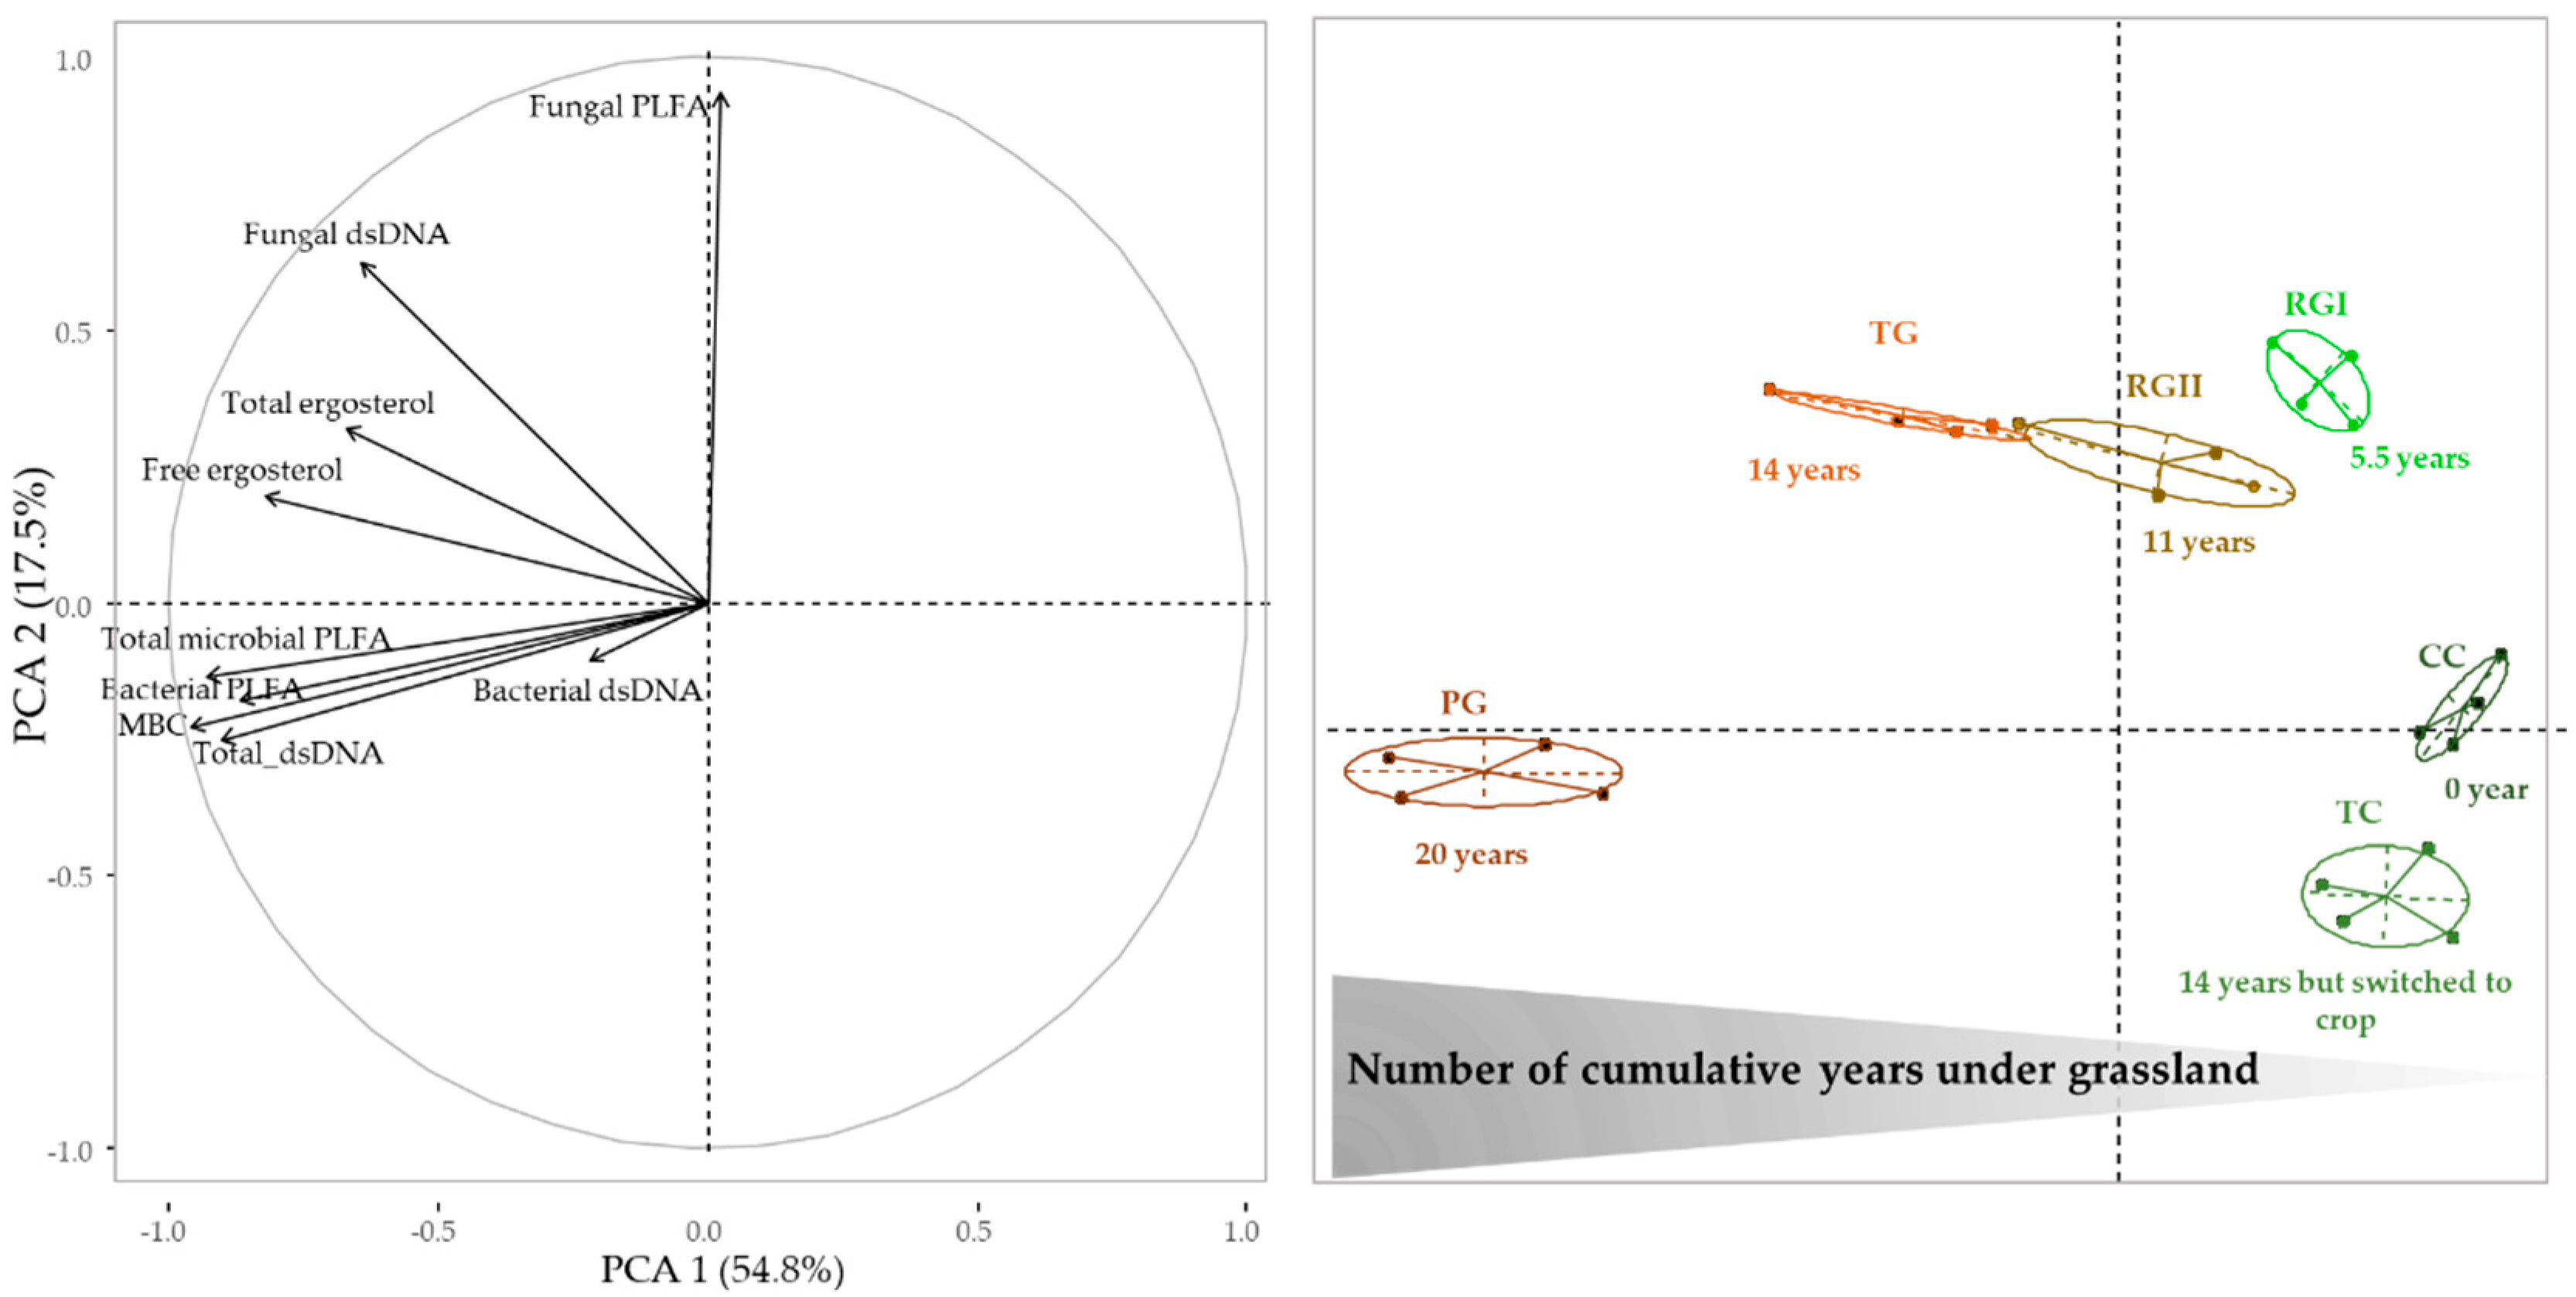
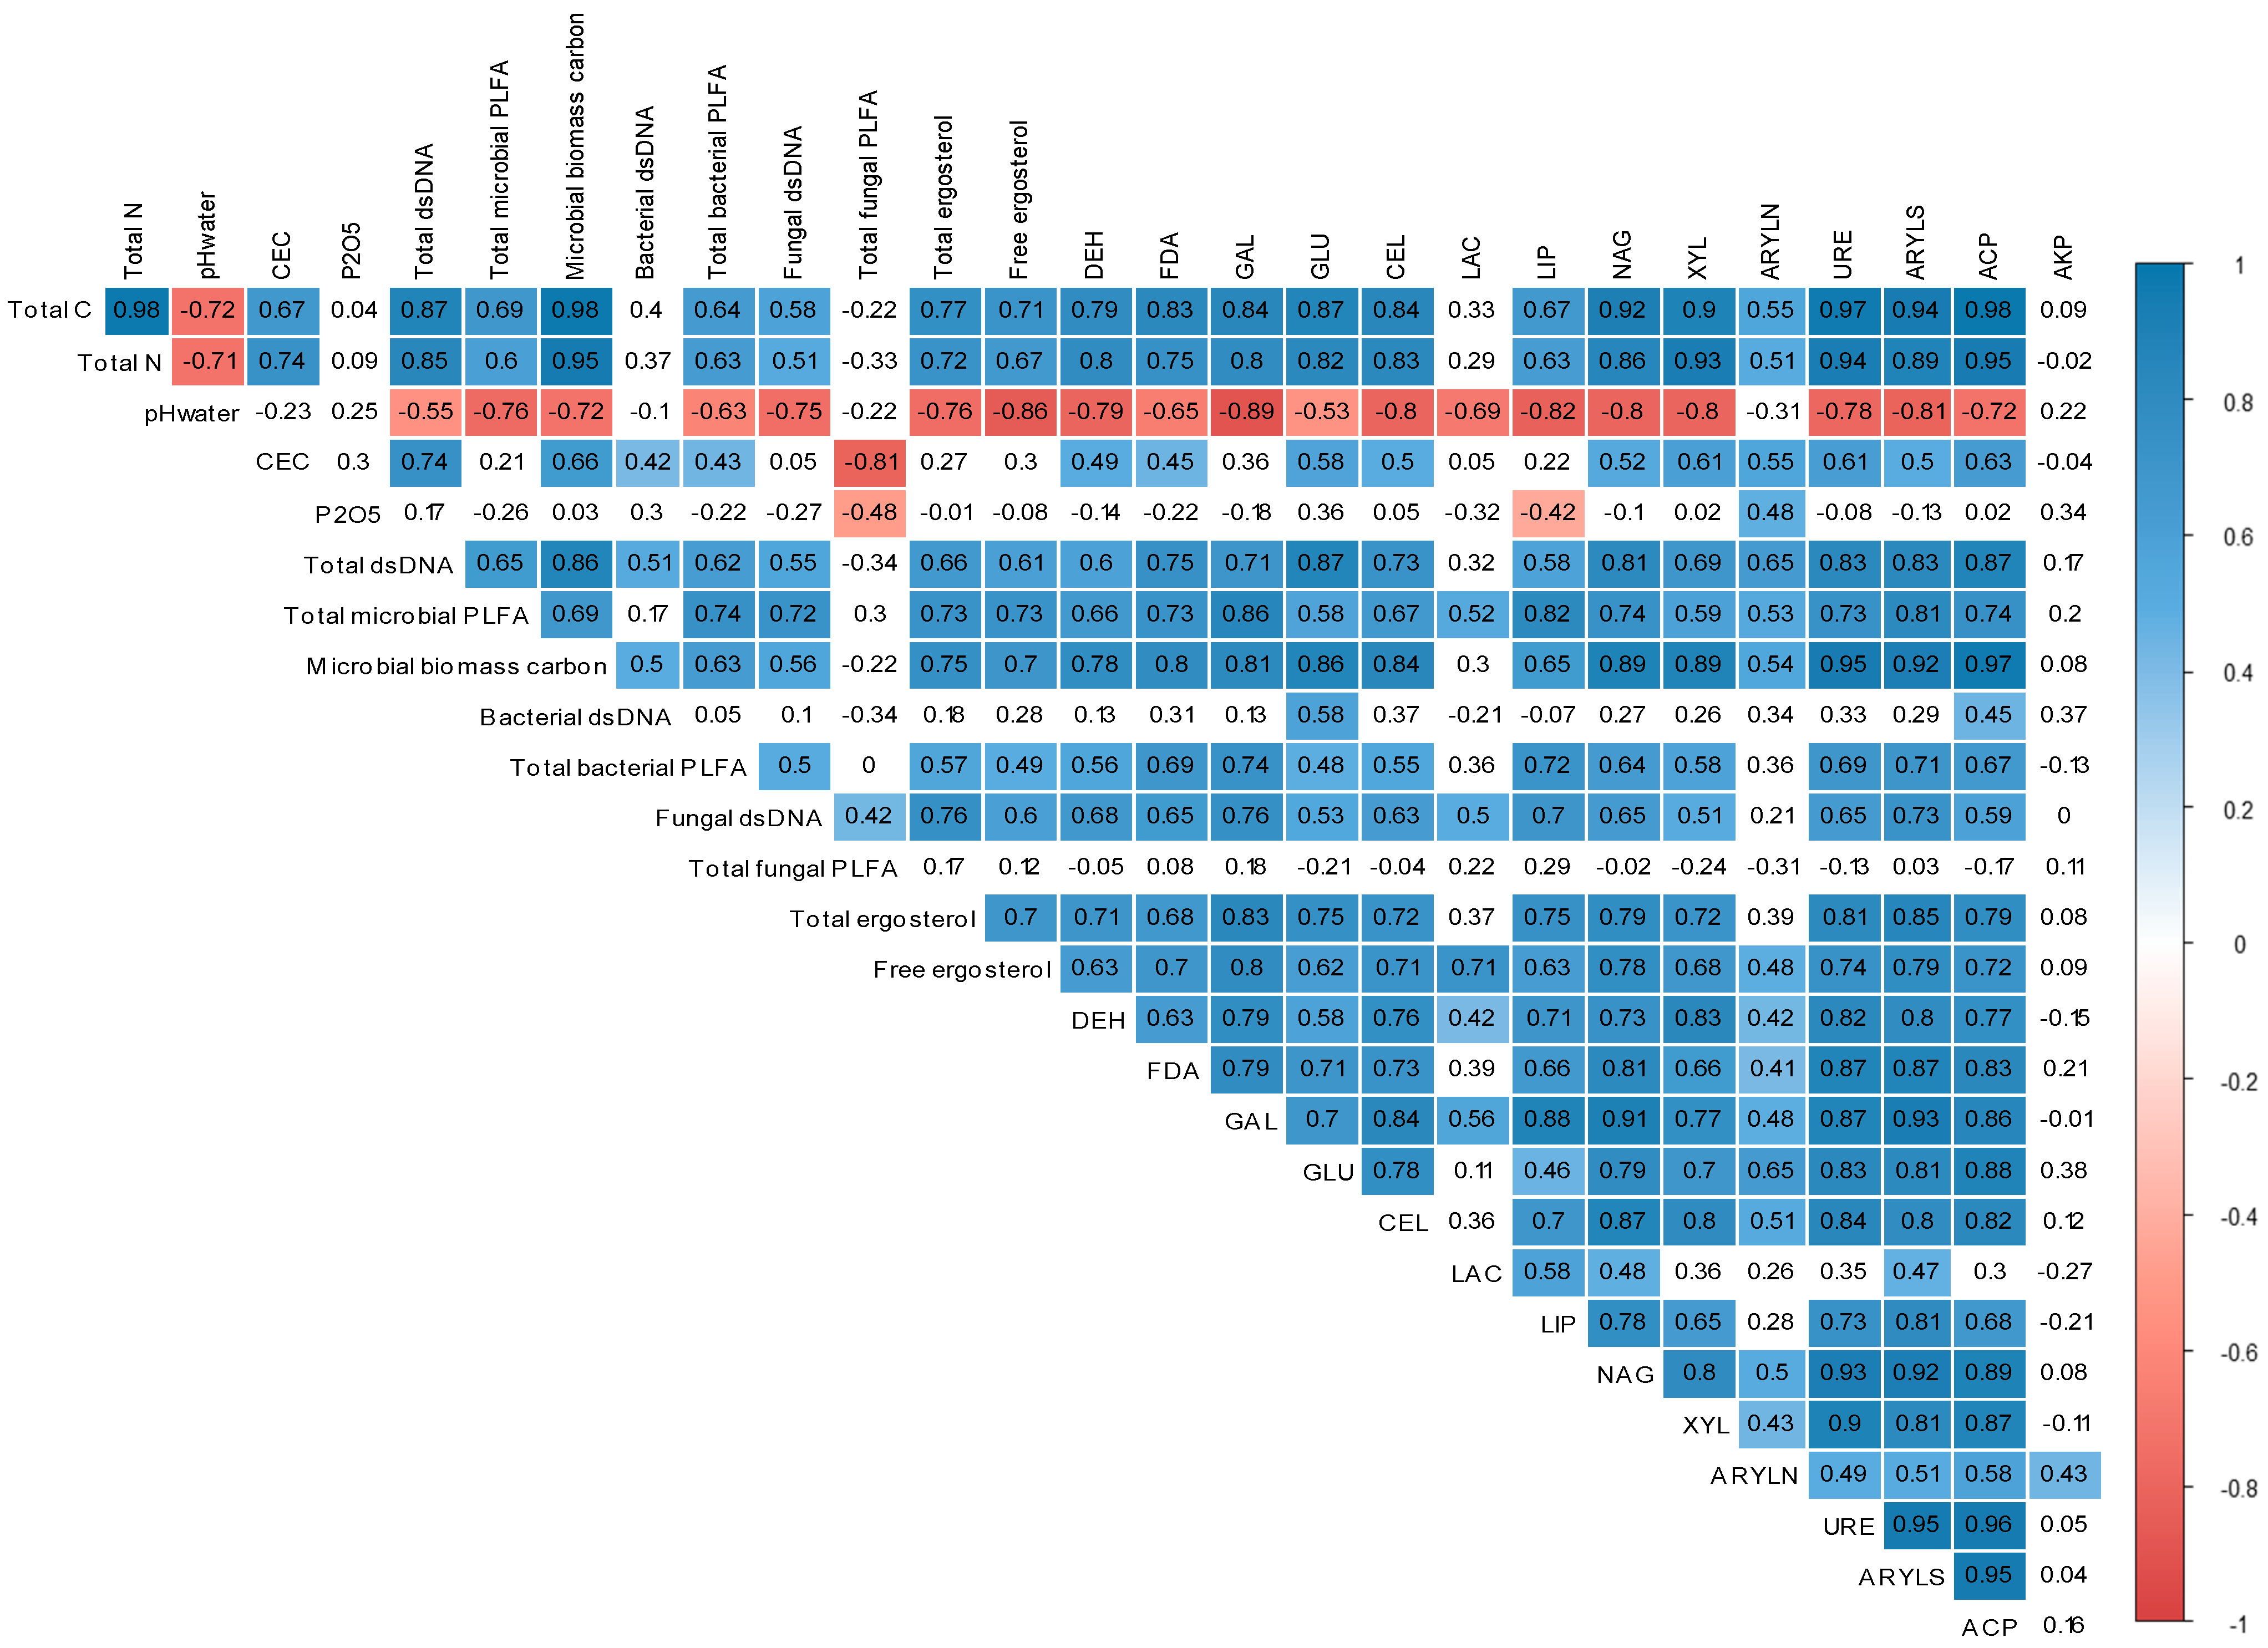
3.4. Relationship between Soil Physicochemical Characteristics, Microbial Communities, and Enzyme Activities
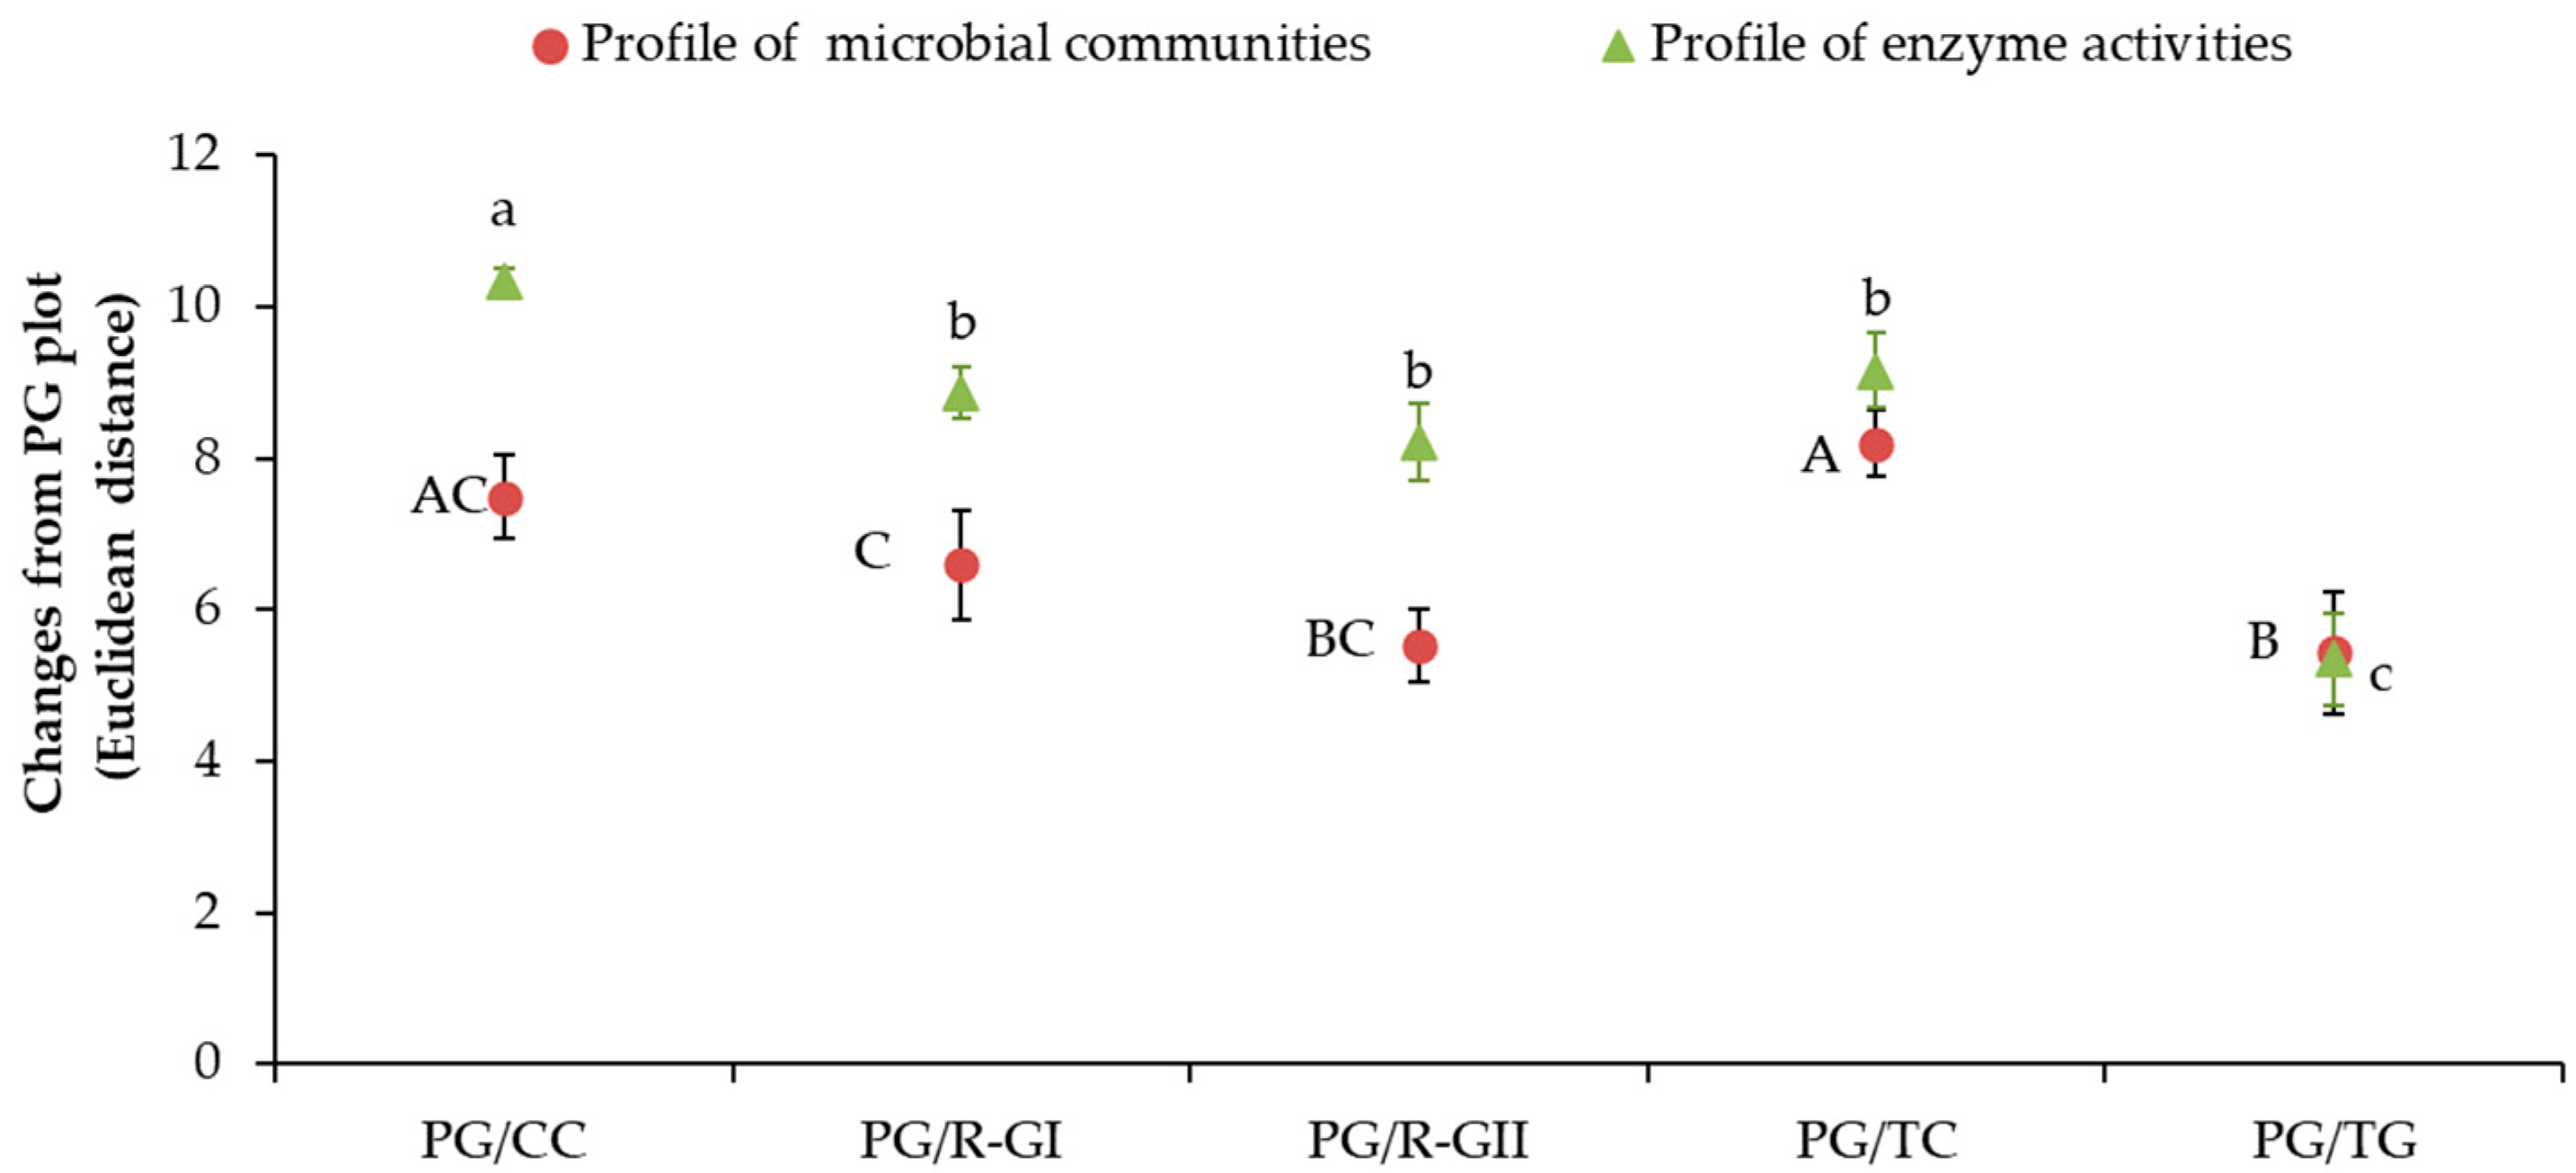
3.5. Relationships between Abundance of Microbial Communities and Enzyme Activities Levels Following the Introduction of Grassland into Crop Rotation
4. Discussion
4.1. Influence of Soil Characteristics in Shaping the Whole Microbial Community and Enzyme Activities
4.2. Relationships between Microbial Communities and Soil Enzyme Activities
4.3. Transition of Microbial Abundance and Functional States Following the Introduction of Grassland into Crop Rotation
Supplementary Materials
Author Contributions
Funding
Institutional Review Board Statement
Informed Consent Statement
Data Availability Statement
Acknowledgments
Conflicts of Interest
References
- Hamdy, A.; Aly, A. Land Degradation, Agriculture Productivity and Food Security. In Proceedings of the Fifth International Scientific Agricultural Symposium “Agrosym 2014”, Jahorina, Bosnia and Herzegovina, 23–26 October 2014; pp. 708–717. [Google Scholar]
- Eswaran, H.; Lal, R.; Reich, P.F. Land degradation: An overview. In Response to Land Degradation; CRC Press: Boca Raton, FL, USA, 2001; ISBN 978-0-429-18795-7. [Google Scholar]
- Eisenhauer, N.; Barnes, A.D.; Cesarz, S.; Craven, D.; Ferlian, O.; Gottschall, F.; Hines, J.; Sendek, A.; Siebert, J.; Thakur, M.P.; et al. Biodiversity–Ecosystem Function Experiments Reveal the Mechanisms Underlying the Consequences of Biodiversity Change in Real World Ecosystems. J. Veg. Sci. 2016, 27, 1061–1070. [Google Scholar] [CrossRef]
- Heijden, M.G.A.V.D.; Bardgett, R.D.; Straalen, N.M.V. The Unseen Majority: Soil Microbes as Drivers of Plant Diversity and Productivity in Terrestrial Ecosystems. Ecol. Lett. 2008, 11, 296–310. [Google Scholar] [CrossRef]
- Sogin, M.L.; Morrison, H.G.; Huber, J.A.; Welch, D.M.; Huse, S.M.; Neal, P.R.; Arrieta, J.M.; Herndl, G.J. Microbial Diversity in the Deep Sea and the Underexplored “Rare Biosphere”. Proc. Natl. Acad. Sci. USA 2006, 103, 12115–12120. [Google Scholar] [CrossRef] [PubMed] [Green Version]
- Kirk, J.L.; Beaudette, L.A.; Hart, M.; Moutoglis, P.; Klironomos, J.N.; Lee, H.; Trevors, J.T. Methods of Studying Soil Microbial Diversity. J. Microbiol. Methods 2004, 58, 169–188. [Google Scholar] [CrossRef]
- Gans, J.; Wolinsky, M.; Dunbar, J. Computational Improvements Reveal Great Bacterial Diversity and High Metal Toxicity in Soil. Science 2005, 309, 1387–1390. [Google Scholar] [CrossRef]
- Rusch, A.; Amend, J.P. Order-Specific 16S RRNA-Targeted Oligonucleotide Probes for (Hyper)Thermophilic Archaea and Bacteria. Extremophiles 2004, 8, 357–366. [Google Scholar] [CrossRef] [PubMed]
- Nannipieri, P.; Ascher, J.; Ceccherini, M.T.; Landi, L.; Pietramellara, G.; Renella, G. Microbial Diversity and Soil Functions. Eur. J. Soil Sci. 2003, 54, 655–670. [Google Scholar] [CrossRef]
- Coonan, E.C.; Kirkby, C.A.; Kirkegaard, J.A.; Amidy, M.R.; Strong, C.L.; Richardson, A.E. Microorganisms and Nutrient Stoichiometry as Mediators of Soil Organic Matter Dynamics. Nutr. Cycl. Agroecosyst. 2020, 117, 273–298. [Google Scholar] [CrossRef]
- Zak, D.R.; Holmes, W.E.; White, D.C.; Peacock, A.D.; Tilman, D. Plant Diversity, Soil Microbial Communities, and Ecosystem Function: Are There Any Links? Ecology 2003, 84, 2042–2050. [Google Scholar] [CrossRef] [Green Version]
- Chaparro, J.M.; Sheflin, A.M.; Manter, D.K.; Vivanco, J.M. Manipulating the Soil Microbiome to Increase Soil Health and Plant Fertility. Biol. Fertil. Soils 2012, 48, 489–499. [Google Scholar] [CrossRef]
- Salles, J.F.; van Elsas, J.D.; van Veen, J.A. Effect of Agricultural Management Regime on Burkholderia Community Structure in Soil. Microb. Ecol. 2006, 52, 267–279. [Google Scholar] [CrossRef]
- Singh, B.K.; Quince, C.; Macdonald, C.A.; Khachane, A.; Thomas, N.; Al-Soud, W.A.; Sørensen, S.J.; He, Z.; White, D.; Sinclair, A.; et al. Loss of Microbial Diversity in Soils Is Coincident with Reductions in Some Specialized Functions. Environ. Microbiol. 2014, 16, 2408–2420. [Google Scholar] [CrossRef] [PubMed]
- Guo, Y.; Luo, H.; Wang, L.; Xu, M.; Wan, Y.; Chou, M.; Shi, P.; Wei, G. Multifunctionality and Microbial Communities in Agricultural Soils Regulate the Dynamics of a Soil-Borne Pathogen. Plant Soil 2021, 461, 309–322. [Google Scholar] [CrossRef]
- Bardgett, R. The Biology of Soil: A Community and Ecosystem Approach; OUP Oxford: Oxford, UK, 2005; ISBN 978-0-19-852503-5. [Google Scholar]
- Riah-Anglet, W.; Trinsoutrot-Gattin, I.; Martin-Laurent, F.; Laroche-Ajzenberg, E.; Norini, M.-P.; Latour, X.; Laval, K. Soil Microbial Community Structure and Function Relationships: A Heat Stress Experiment. Appl. Soil Ecol. 2015, 86, 121–130. [Google Scholar] [CrossRef]
- Hooper, D.U.; Dukes, J.S. Overyielding among Plant Functional Groups in a Long-Term Experiment. Ecol. Lett. 2004, 7, 95–105. [Google Scholar] [CrossRef]
- Balvanera, P.; Pfisterer, A.B.; Buchmann, N.; He, J.-S.; Nakashizuka, T.; Raffaelli, D.; Schmid, B. Quantifying the Evidence for Biodiversity Effects on Ecosystem Functioning and Services. Ecol. Lett. 2006, 9, 1146–1156. [Google Scholar] [CrossRef] [PubMed] [Green Version]
- Skinner, C.; Gattinger, A.; Krauss, M.; Krause, H.-M.; Mayer, J.; van der Heijden, M.G.A.; Mäder, P. The Impact of Long-Term Organic Farming on Soil-Derived Greenhouse Gas Emissions. Sci. Rep. 2019, 9, 1702. [Google Scholar] [CrossRef]
- Franzluebbers, A.J.; Lemaire, G.; de Faccio Carvalho, P.C.; Sulc, R.M.; Dedieu, B. Toward Agricultural Sustainability through Integrated Crop-Livestock Systems: Environmental Outcomes. Agric. Ecosyst. Environ. 2014, 190, 1–3. [Google Scholar] [CrossRef]
- Lemaire, G.; Franzluebbers, A.; de Faccio Carvalho, P.C.; Dedieu, B. Integrated Crop–Livestock Systems: Strategies to Achieve Synergy between Agricultural Production and Environmental Quality. Agric. Ecosyst. Environ. 2014, 190, 4–8. [Google Scholar] [CrossRef]
- Russelle, M.P.; Entz, M.H.; Franzluebbers, A.J. Reconsidering Integrated Crop–Livestock Systems in North America. Agron. J. 2007, 99, 325–334. [Google Scholar] [CrossRef] [Green Version]
- Lemaire, G.; Gastal, F.; Franzluebbers, A.; Chabbi, A. Grassland–Cropping Rotations: An Avenue for Agricultural Diversification to Reconcile High Production with Environmental Quality. Environ. Manag. 2015, 56, 1065–1077. [Google Scholar] [CrossRef]
- Parras-Alcántara, L.; Díaz-Jaimes, L.; Lozano-García, B. Management Effects on Soil Organic Carbon Stock in Mediterranean Open Rangelands—Treeless Grasslands. Land Degrad. Dev. 2015, 26, 22–34. [Google Scholar] [CrossRef]
- Rumpel, C.; Crème, A.; Ngo, P.T.; Velásquez, G.; Mora, M.L.; Chabbi, A. The Impact of Grassland Management on Biogeochemical Cycles Involving Carbon, Nitrogen and Phosphorus. J. Soil Sci. Plant Nutr. 2015, 15, 353–371. [Google Scholar] [CrossRef] [Green Version]
- Lal, R. Soil Carbon Sequestration to Mitigate Climate Change. Geoderma 2004, 123, 1–22. [Google Scholar] [CrossRef]
- Ussiri, D.A.N.; Lal, R. Long-Term Tillage Effects on Soil Carbon Storage and Carbon Dioxide Emissions in Continuous Corn Cropping System from an Alfisol in Ohio. Soil Tillage Res. 2009, 104, 39–47. [Google Scholar] [CrossRef]
- Dass, P.; Houlton, B.Z.; Wang, Y.; Warlind, D. Grasslands May Be More Reliable Carbon Sinks than Forests in California. Environ. Res. Lett. 2018, 13, 074027. [Google Scholar] [CrossRef]
- Baer, S.G.; Kitchen, D.J.; Blair, J.M.; Rice, C.W. Changes in Ecosystem Structure and Function Along a Chronosequence of Restored Grasslands. Ecol. Appl. 2002, 12, 1688–1701. [Google Scholar] [CrossRef]
- Garbeva, P.; van Elsas, J.D.; van Veen, J.A. Rhizosphere Microbial Community and Its Response to Plant Species and Soil History. Plant Soil 2008, 302, 19–32. [Google Scholar] [CrossRef] [Green Version]
- van Eekeren, N.; Bommelé, L.; Bloem, J.; Schouten, T.; Rutgers, M.; de Goede, R.; Reheul, D.; Brussaard, L. Soil Biological Quality after 36 Years of Ley-Arable Cropping, Permanent Grassland and Permanent Arable Cropping. Appl. Soil Ecol. 2008, 40, 432–446. [Google Scholar] [CrossRef] [Green Version]
- Blair, J.; Nippert, J.; Briggs, J. Grassland Ecology. In Ecology and the Environment; Monson, R.K., Ed.; The Plant Sciences; Springer: New York, NY, USA, 2014; pp. 389–423. ISBN 978-1-4614-7501-9. [Google Scholar]
- Guillou, C.L.; Prévost-Bouré, N.C.; Karimi, B.; Akkal-Corfini, N.; Dequiedt, S.; Nowak, V.; Terrat, S.; Menasseri-Aubry, S.; Viaud, V.; Maron, P.-A.; et al. Tillage Intensity and Pasture in Rotation Effectively Shape Soil Microbial Communities at a Landscape Scale. MicrobiologyOpen 2019, 8, e00676. [Google Scholar] [CrossRef]
- Jangid, K.; Williams, M.A.; Franzluebbers, A.J.; Sanderlin, J.S.; Reeves, J.H.; Jenkins, M.B.; Endale, D.M.; Coleman, D.C.; Whitman, W.B. Relative Impacts of Land-Use, Management Intensity and Fertilization upon Soil Microbial Community Structure in Agricultural Systems. Soil Biol. Biochem. 2008, 40, 2843–2853. [Google Scholar] [CrossRef]
- Jangid, K.; Williams, M.A.; Franzluebbers, A.J.; Blair, J.M.; Coleman, D.C.; Whitman, W.B. Development of Soil Microbial Communities during Tallgrass Prairie Restoration. Soil Biol. Biochem. 2010, 42, 302–312. [Google Scholar] [CrossRef]
- McKinley, V.L.; Peacock, A.D.; White, D.C. Microbial Community PLFA and PHB Responses to Ecosystem Restoration in Tallgrass Prairie Soils. Soil Biol. Biochem. 2005, 37, 1946–1958. [Google Scholar] [CrossRef]
- Bach, E.M.; Baer, S.G.; Meyer, C.K.; Six, J. Soil Texture Affects Soil Microbial and Structural Recovery during Grassland Restoration. Soil Biol. Biochem. 2010, 42, 2182–2191. [Google Scholar] [CrossRef]
- Brye, K.R.; Slaton, N.A.; Savin, M.C.; Norman, R.J.; Miller, D.M. Short-Term Effects of Land Leveling on Soil Physical Properties and Microbial Biomass. Soil Sci. Soc. Am. J. 2003, 67, 1405–1417. [Google Scholar] [CrossRef]
- Bossio, D.A.; Fleck, J.A.; Scow, K.M.; Fujii, R. Alteration of Soil Microbial Communities and Water Quality in Restored Wetlands. Soil Biol. Biochem. 2006, 38, 1223–1233. [Google Scholar] [CrossRef]
- Plassart, P.; Vinceslas, M.A.; Gangneux, C.; Mercier, A.; Barray, S.; Laval, K. Molecular and Functional Responses of Soil Microbial Communities under Grassland Restoration. Agric. Ecosyst. Environ. 2008, 127, 286–293. [Google Scholar] [CrossRef]
- Attard, E.; Le Roux, X.; Charrier, X.; Delfosse, O.; Guillaumaud, N.; Lemaire, G.; Recous, S. Delayed and Asymmetric Responses of Soil C Pools and N Fluxes to Grassland/Cropland Conversions. Soil Biol. Biochem. 2016, 97, 31–39. [Google Scholar] [CrossRef]
- Wang, S.; Wilkes, A.; Zhang, Z.; Chang, X.; Lang, R.; Wang, Y.; Niu, H. Management and Land Use Change Effects on Soil Carbon in Northern China’s Grasslands: A Synthesis. Agric. Ecosyst. Environ. 2011, 142, 329–340. [Google Scholar] [CrossRef]
- Lebrun, J.D.; Trinsoutrot-Gattin, I.; Vinceslas-Akpa, M.; Bailleul, C.; Brault, A.; Mougin, C.; Laval, K. Assessing Impacts of Copper on Soil Enzyme Activities in Regard to Their Natural Spatiotemporal Variation under Long-Term Different Land Uses. Soil Biol. Biochem. 2012, 49, 150–156. [Google Scholar] [CrossRef]
- Beaumelle, L.; Lamy, I.; Cheviron, N.; Hedde, M. Is There a Relationship between Earthworm Energy Reserves and Metal Availability after Exposure to Field-Contaminated Soils? Environ. Pollut. 2014, 191, 182–189. [Google Scholar] [CrossRef]
- Torres-Leguizamon, M.; Mathieu, J.; Decaëns, T.; Dupont, L. Genetic Structure of Earthworm Populations at a Regional Scale: Inferences from Mitochondrial and Microsatellite Molecular Markers in Aporrectodea Icterica (Savigny 1826). PLoS ONE 2014, 9, e101597. [Google Scholar] [CrossRef] [Green Version]
- Coulibaly, S.F.M.; Winck, B.R.; Akpa-Vinceslas, M.; Mignot, L.; Legras, M.; Forey, E.; Chauvat, M. Functional Assemblages of Collembola Determine Soil Microbial Communities and Associated Functions. Front. Environ. Sci. 2019, 7, 52. [Google Scholar] [CrossRef] [Green Version]
- Pérès, G.; Vandenbulcke, F.; Guernion, M.; Hedde, M.; Beguiristain, T.; Douay, F.; Houot, S.; Piron, D.; Richard, A.; Bispo, A.; et al. Earthworm Indicators as Tools for Soil Monitoring, Characterization and Risk Assessment. An Example from the National Bioindicator Programme (France). Pedobiologia 2011, 54, 77–87. [Google Scholar] [CrossRef]
- Trap, J.; Riah, W.; Akpa-Vinceslas, M.; Bailleul, C.; Laval, K.; Trinsoutrot-Gattin, I. Improved Effectiveness and Efficiency in Measuring Soil Enzymes as Universal Soil Quality Indicators Using Microplate Fluorimetry. Soil Biol. Biochem. 2012, 45, 98–101. [Google Scholar] [CrossRef]
- Pauget, B.; Gimbert, F.; Coeurdassier, M.; Crini, N.; Pérès, G.; Faure, O.; Douay, F.; Hitmi, A.; Beguiristain, T.; Alaphilippe, A.; et al. Ranking Field Site Management Priorities According to Their Metal Transfer to Snails. Ecol. Indic. 2013, 29, 445–454. [Google Scholar] [CrossRef]
- Cluzeau, D.; Pérès, G.; Guernion, M.; Chaussod, R.; Cortet, J.; Fargette, M.; Martin-Laurent, F.; Mateille, T.; Pernin, C.; Ponge, J.-F.; et al. Intégration de La Biodiversité Des Sols Dans Les Réseaux de Surveillance de La Qualité Des Sols: Exemple Du Programme Pilote à l’échelle Régionale, Le RMQS BioDiv. Etude Gest. Sols 2009, 16, 187–201. [Google Scholar]
- Wu, J.; Joergensen, R.G.; Pommerening, B.; Chaussod, R.; Brookes, P.C. Measurement of Soil Microbial Biomass C by Fumigation-Extraction—an Automated Procedure. Soil Biol. Biochem. 1990, 22, 1167–1169. [Google Scholar] [CrossRef]
- Jenkinson, D.S.; Brookes, P.C.; Powlson, D.S. Measuring Soil Microbial Biomass. Soil Biol. Biochem. 2003, 36, 5–7. [Google Scholar] [CrossRef]
- Bligh, E.G.; Dyer, W.J. A Rapid Method of Total Lipid Extraction and Purification. Can. J. Biochem. Physiol. 1959, 37, 911–917. [Google Scholar] [CrossRef] [Green Version]
- Frostegård, Å.; Tunlid, A.; Bååth, E. Microbial Biomass Measured as Total Lipid Phosphate in Soils of Different Organic Content. J. Methods 1991, 14, 151–163. [Google Scholar] [CrossRef]
- Shahzad, T.; Chenu, C.; Repinçay, C.; Mougin, C.; Ollier, J.-L.; Fontaine, S. Plant Clipping Decelerates the Mineralization of Recalcitrant Soil Organic Matter under Multiple Grassland Species. Soil Biol. Biochem. 2012, 51, 73–80. [Google Scholar] [CrossRef]
- Gómez-Brandón, M.; Lores, M.; Domínguez, J. Comparison of Extraction and Derivatization Methods for Fatty Acid Analysis in Solid Environmental Matrixes. Anal. Bioanal. Chem. 2008, 392, 505–514. [Google Scholar] [CrossRef] [PubMed]
- Wu, Y.; Ma, B.; Zhou, L.; Wang, H.; Xu, J.; Kemmitt, S.; Brookes, P.C. Changes in the Soil Microbial Community Structure with Latitude in Eastern China, Based on Phospholipid Fatty Acid Analysis. Appl. Soil Ecol. 2009, 43, 234–240. [Google Scholar] [CrossRef]
- Bowles, T.M.; Acosta-Martínez, V.; Calderón, F.; Jackson, L.E. Soil Enzyme Activities, Microbial Communities, and Carbon and Nitrogen Availability in Organic Agroecosystems across an Intensively-Managed Agricultural Landscape. Soil Biol. Biochem. 2014, 68, 252–262. [Google Scholar] [CrossRef]
- Acosta-Martínez, V.; Mikha, M.M.; Vigil, M.F. Microbial Communities and Enzyme Activities in Soils under Alternative Crop Rotations Compared to Wheat–Fallow for the Central Great Plains. Appl. Soil Ecol. 2007, 37, 41–52. [Google Scholar] [CrossRef]
- Montgomery, H.J.; Monreal, C.M.; Young, J.C.; Seifert, K.A. Determinination of Soil Fungal Biomass from Soil Ergosterol Analyses. Soil Biol. Biochem. 2000, 32, 1207–1217. [Google Scholar] [CrossRef]
- Gong, P.; Guan, X.; Witter, E. A Rapid Method to Extract Ergosterol from Soil by Physical Disruption. Appl. Soil Ecol. 2001, 17, 285–289. [Google Scholar] [CrossRef]
- Gorka, S.; Canarini, A.; Imai, B.; Teischinger, G.; Darcy, S.; Kaiser, C. A unified protocol for the high-throughput measurement of PLFA, NLFA, GLFA and Sterols from Soil, 2020. In Proceedings of the EGU General Assembly 2020, EGU2020-17791, Online, 4–8 May 2020; p. 64. [Google Scholar]
- Frostegård, Å.; Tunlid, A.; Bååth, E. Use and Misuse of PLFA Measurements in Soils. Soil Biol. Biochem. 2011, 43, 1621–1625. [Google Scholar] [CrossRef]
- Borneman, J.; Hartin, R.J. PCR Primers That Amplify Fungal RRNA Genes from Environmental Samples. Appl. Environ. Microbiol 2000, 66, 4356–4360. [Google Scholar] [CrossRef] [Green Version]
- Marchesi, J.R.; Sato, T.; Weightman, A.J.; Martin, T.A.; Fry, J.C.; Hiom, S.J.; Dymock, D.; Wade, W.G. Design and Evaluation of Useful Bacterium-Specific PCR Primers That Amplify Genes Coding for Bacterial 16S RRNA. Appl. Environ. Microbiol 1998, 64, 795–799. [Google Scholar] [CrossRef] [Green Version]
- Muyzer, G.; de Waal, E.C.; Uitterlinden, A.G. Profiling of Complex Microbial Populations by Denaturing Gradient Gel Electrophoresis Analysis of Polymerase Chain Reaction-Amplified Genes Coding for 16S RRNA. Appl. Environ. Microbiol 1993, 59, 695–700. [Google Scholar] [CrossRef] [Green Version]
- Schaefer, R. DEHYDROGENASE ACTIVITY AS A MEASURE OF THE GLOBAL BIOLOGICAL ACTIVITY OF SOIL. Ann. Inst. Pasteur (Paris) 1963, 105, 326–331. [Google Scholar]
- Adam, G.; Duncan, H. Development of a Sensitive and Rapid Method for the Measurement of Total Microbial Activity Using Fluorescein Diacetate (FDA) in a Range of Soils. Soil Biol. Biochem. 2001, 33, 943–951. [Google Scholar] [CrossRef] [Green Version]
- de Santiago-Martín, A.; Cheviron, N.; Quintana, J.R.; González, C.; Lafuente, A.L.; Mougin, C. Metal Contamination Disturbs Biochemical and Microbial Properties of Calcareous Agricultural Soils of the Mediterranean Area. Arch. Environ. Contam. Toxicol. 2013, 64, 388–398. [Google Scholar] [CrossRef] [PubMed]
- Schultz, A.; Jonas, U.; Hammer, E.; Schauer, F. Dehalogenation of Chlorinated Hydroxybiphenyls by Fungal Laccase. Appl. Environ. Microbiol. 2001, 67, 4377–4381. [Google Scholar] [CrossRef] [PubMed] [Green Version]
- Gupta, R.; Gupta, N.; Rathi, P. Bacterial Lipases: An Overview of Production, Purification and Biochemical Properties. Appl. Microbiol. Biotechnol. 2004, 64, 763–781. [Google Scholar] [CrossRef]
- Schinner, F.; von Mersi, W. Xylanase-, CM-Cellulase- and Invertase Activity in Soil: An Improved Method. Soil Biol. Biochem. 1990, 22, 511–515. [Google Scholar] [CrossRef]
- Acosta-Martínez, V.; Tabatabai, M.A. Enzyme Activities in a Limed Agricultural Soil. Biol. Fertil. Soils 2000, 31, 85–91. [Google Scholar] [CrossRef]
- Ranjard, L.; Nowak, V.; Echairi, A.; Faloya, V.; Chaussod, R. The Dynamics of Soil Bacterial Community Structure in Response to Yearly Repeated Agricultural Copper Treatments. Res. Microbiol. 2008, 159, 251–254. [Google Scholar] [CrossRef]
- Constancias, F.; Saby, N.P.A.; Terrat, S.; Dequiedt, S.; Horrigue, W.; Nowak, V.; Guillemin, J.-P.; Biju-Duval, L.; Prévost-Bouré, N.C.; Ranjard, L. Contrasting Spatial Patterns and Ecological Attributes of Soil Bacterial and Archaeal Taxa across a Landscape. MicrobiologyOpen 2015, 4, 518–531. [Google Scholar] [CrossRef] [PubMed]
- Carbonetto, B.; Rascovan, N.; Álvarez, R.; Mentaberry, A.; Vázquez, M.P. Structure, Composition and Metagenomic Profile of Soil Microbiomes Associated to Agricultural Land Use and Tillage Systems in Argentine Pampas. PLoS ONE 2014, 9, e99949. [Google Scholar] [CrossRef] [PubMed]
- Riah-Anglet, W.; Trinsoutrot-Gattin, I.; Norini, M.-P.; Gauthier, A.; Latour, X.; Laval, K. Initial State of Soil Microbial Communities Determines Their Stress Response. J. Environ. Chem. Eng. 2018, 6, 5470–5480. [Google Scholar] [CrossRef]
- Ihaka, R.; Gentleman, R.R.; Development Core Team. R: A Language and Environment for Statistical Computing, 1996; R Foundation for Statistical Computing: Vienna, Austria, 2009; Available online: http://www.R-project.org (accessed on 16 October 2009).
- Lal, R. Restoring Soil Quality to Mitigate Soil Degradation. Sustainability 2015, 7, 5875–5895. [Google Scholar] [CrossRef] [Green Version]
- Griffiths, R.I.; Thomson, B.C.; James, P.; Bell, T.; Bailey, M.; Whiteley, A.S. The Bacterial Biogeography of British Soils. Environ. Microbiol. 2011, 13, 1642–1654. [Google Scholar] [CrossRef]
- Tian, Q.; Jiang, Y.; Tang, Y.; Wu, Y.; Tang, Z.; Liu, F. Soil PH and Organic Carbon Properties Drive Soil Bacterial Communities in Surface and Deep Layers Along an Elevational Gradient. Front. Microbiol. 2021, 12, 646124. [Google Scholar] [CrossRef] [PubMed]
- Panettieri, M.; Guigue, J.; Chemidlin Prevost-Bouré, N.; Thévenot, M.; Lévêque, J.; Le Guillou, C.; Maron, P.-A.; Santoni, A.-L.; Ranjard, L.; Mounier, S.; et al. Grassland-Cropland Rotation Cycles in Crop-Livestock Farming Systems Regulate Priming Effect Potential in Soils through Modulation of Microbial Communities, Composition of Soil Organic Matter and Abiotic Soil Properties. Agric. Ecosyst. Environ. 2020, 299, 106973. [Google Scholar] [CrossRef]
- Knops, J.M.H.; Tilman, D. Dynamics of Soil Nitrogen and Carbon Accumulation for 61 Years after Agricultural Abandonment. Ecology 2000, 81, 88–98. [Google Scholar] [CrossRef]
- Panettieri, M.; Rumpel, C.; Dignac, M.-F.; Chabbi, A. Does Grassland Introduction into Cropping Cycles Affect Carbon Dynamics through Changes of Allocation of Soil Organic Matter within Aggregate Fractions? Sci. Total Environ. 2017, 576, 251–263. [Google Scholar] [CrossRef] [Green Version]
- Lauber, C.L.; Strickland, M.S.; Bradford, M.A.; Fierer, N. The Influence of Soil Properties on the Structure of Bacterial and Fungal Communities across Land-Use Types. Soil Biol. Biochem. 2008, 40, 2407–2415. [Google Scholar] [CrossRef]
- Köhl, L.; Oehl, F.; van der Heijden, M.G.A. Agricultural Practices Indirectly Influence Plant Productivity and Ecosystem Services through Effects on Soil Biota. Ecol. Appl. 2014, 24, 1842–1853. [Google Scholar] [CrossRef]
- Bissett, A.; Richardson, A.E.; Baker, G.; Thrall, P.H. Long-Term Land Use Effects on Soil Microbial Community Structure and Function. Appl. Soil Ecol. 2011, 51, 66–78. [Google Scholar] [CrossRef]
- Kuramae, E.E.; Yergeau, E.; Wong, L.C.; Pijl, A.S.; van Veen, J.A.; Kowalchuk, G.A. Soil Characteristics More Strongly Influence Soil Bacterial Communities than Land-Use Type. FEMS Microbiol. Ecol. 2012, 79, 12–24. [Google Scholar] [CrossRef] [Green Version]
- Wakelin, S.A.; Macdonald, L.M.; Rogers, S.L.; Gregg, A.L.; Bolger, T.P.; Baldock, J.A. Habitat Selective Factors Influencing the Structural Composition and Functional Capacity of Microbial Communities in Agricultural Soils. Soil Biol. Biochem. 2008, 40, 803–813. [Google Scholar] [CrossRef]
- Rousk, J.; Bååth, E.; Brookes, P.C.; Lauber, C.L.; Lozupone, C.; Caporaso, J.G.; Knight, R.; Fierer, N. Soil Bacterial and Fungal Communities across a PH Gradient in an Arable Soil. ISME J. 2010, 4, 1340–1351. [Google Scholar] [CrossRef]
- Plassart, P.; Prévost-Bouré, N.C.; Uroz, S.; Dequiedt, S.; Stone, D.; Creamer, R.; Griffiths, R.I.; Bailey, M.J.; Ranjard, L.; Lemanceau, P. Soil Parameters, Land Use, and Geographical Distance Drive Soil Bacterial Communities along a European Transect. Sci. Rep. 2019, 9, 605. [Google Scholar] [CrossRef] [PubMed] [Green Version]
- Almeida, F.; Wolf, J.M.; Casadevall, A. Virulence-Associated Enzymes of Cryptococcus Neoformans. Eukaryot. Cell 2015, 14, 1173–1185. [Google Scholar] [CrossRef] [PubMed] [Green Version]
- Sinsabaugh, R.L.; Follstad Shah, J.J. Ecoenzymatic Stoichiometry and Ecological Theory. Annu. Rev. Ecol. Evol. Syst. 2012, 43, 313–343. [Google Scholar] [CrossRef] [Green Version]
- Sinsabaugh, R.L.; Gallo, M.E.; Lauber, C.; Waldrop, M.P.; Zak, D.R. Extracellular Enzyme Activities and Soil Organic Matter Dynamics for Northern Hardwood Forests Receiving Simulated Nitrogen Deposition. Biogeochemistry 2005, 75, 201–215. [Google Scholar] [CrossRef] [Green Version]
- Piotrowska, A.; Wilczewski, E. Effects of Catch Crops Cultivated for Green Manure and Mineral Nitrogen Fertilization on Soil Enzyme Activities and Chemical Properties. Geoderma 2012, 189–190, 72–80. [Google Scholar] [CrossRef]
- Cattaneo, F.; Di Gennaro, P.; Barbanti, L.; Giovannini, C.; Labra, M.; Moreno, B.; Benitez, E.; Marzadori, C. Perennial Energy Cropping Systems Affect Soil Enzyme Activities and Bacterial Community Structure in a South European Agricultural Area. Appl. Soil Ecol. 2014, 84, 213–222. [Google Scholar] [CrossRef]
- Hendriksen, N.B.; Creamer, R.E.; Stone, D.; Winding, A. Soil Exo-Enzyme Activities across Europe—The Influence of Climate, Land-Use and Soil Properties. Appl. Soil Ecol. 2016, 97, 44–48. [Google Scholar] [CrossRef]
- Ullah, S.; Ai, C.; Huang, S.; Zhang, J.; Jia, L.; Ma, J.; Zhou, W.; He, P. The Responses of Extracellular Enzyme Activities and Microbial Community Composition under Nitrogen Addition in an Upland Soil. PLoS ONE 2019, 14, e0223026. [Google Scholar] [CrossRef] [PubMed] [Green Version]
- Manzoni, S.; Jackson, R.B.; Trofymow, J.A.; Porporato, A. The Global Stoichiometry of Litter Nitrogen Mineralization. Science 2008, 321, 684–686. [Google Scholar] [CrossRef] [PubMed]
- Kuzyakov, Y. Priming Effects: Interactions between Living and Dead Organic Matter. Soil Biol. Biochem. 2010, 42, 1363–1371. [Google Scholar] [CrossRef]
- Soussana, J.-F.; Lemaire, G. Coupling Carbon and Nitrogen Cycles for Environmentally Sustainable Intensification of Grasslands and Crop-Livestock Systems. Agric. Ecosyst. Environ. 2014, 190, 9–17. [Google Scholar] [CrossRef]
- Han, G.; Tang, Y.; Liu, M.; Van Zwieten, L.; Yang, X.; Yu, C.; Wang, H.; Song, Z. Carbon-Nitrogen Isotope Coupling of Soil Organic Matter in a Karst Region under Land Use Change, Southwest China. Agric. Ecosyst. Environ. 2020, 301, 107027. [Google Scholar] [CrossRef]
- Aon, M.; Colaneri, A., II. Temporal and Spatial Evolution of Enzymatic Activities and Physico-Chemical Properties in an Agricultural Soil. Appl. Soil Ecol. 2001, 18, 255–270. [Google Scholar] [CrossRef]
- Bonmati, M.; Ceccanti, B.; Nanniperi, P. Spatial Variability of Phosphatase, Urease, Protease, Organic Carbon and Total Nitrogen in Soil. Soil Biol. Biochem. 1991, 23, 391–396. [Google Scholar] [CrossRef]
- Margalef, O.; Sardans, J.; Fernández-Martínez, M.; Molowny-Horas, R.; Janssens, I.A.; Ciais, P.; Goll, D.; Richter, A.; Obersteiner, M.; Asensio, D.; et al. Global Patterns of Phosphatase Activity in Natural Soils. Sci. Rep. 2017, 7, 1337. [Google Scholar] [CrossRef] [Green Version]
- Qasemian, L.; Guiral, D.; Farnet, A.-M. How Do Microlocal Environmental Variations Affect Microbial Activities of a Pinus Halepensis Litter in a Mediterranean Coastal Area? Sci. Total Environ. 2014, 496, 198–205. [Google Scholar] [CrossRef] [PubMed]
- Lebrun, J.D.; Demont-Caulet, N.; Cheviron, N.; Laval, K.; Trinsoutrot-Gattin, I.; Mougin, C. Oxidoreductases Provide a More Generic Response to Metallic Stressors (Cu and Cd) than Hydrolases in Soil Fungi: New Ecotoxicological Insights. Environ. Sci. Pollut. Res. 2016, 23, 3036–3041. [Google Scholar] [CrossRef] [PubMed]
- Burns, R.G.; DeForest, J.L.; Marxsen, J.; Sinsabaugh, R.L.; Stromberger, M.E.; Wallenstein, M.D.; Weintraub, M.N.; Zoppini, A. Soil Enzymes in a Changing Environment: Current Knowledge and Future Directions. Soil Biol. Biochem. 2013, 58, 216–234. [Google Scholar] [CrossRef]
- Sinsabaugh, R.L.; Belnap, J.; Findlay, S.G.; Shah, J.J.F.; Hill, B.H.; Kuehn, K.A.; Kuske, C.R.; Litvak, M.E.; Martinez, N.G.; Moorhead, D.L.; et al. Extracellular Enzyme Kinetics Scale with Resource Availability. Biogeochemistry 2014, 121, 287–304. [Google Scholar] [CrossRef]
- Kivlin, S.N.; Treseder, K.K. Soil Extracellular Enzyme Activities Correspond with Abiotic Factors More than Fungal Community Composition. Biogeochemistry 2014, 117, 23–37. [Google Scholar] [CrossRef] [Green Version]
- Talbot, J.M.; Bruns, T.D.; Taylor, J.W.; Smith, D.P.; Branco, S.; Glassman, S.I.; Erlandson, S.; Vilgalys, R.; Liao, H.-L.; Smith, M.E.; et al. Endemism and Functional Convergence across the North American Soil Mycobiome. Proc. Natl. Acad. Sci. USA 2014, 111, 6341–6346. [Google Scholar] [CrossRef] [Green Version]
- Cao, H.; Chen, R.; Wang, L.; Jiang, L.; Yang, F.; Zheng, S.; Wang, G.; Lin, X. Soil PH, Total Phosphorus, Climate and Distance Are the Major Factors Influencing Microbial Activity at a Regional Spatial Scale. Sci. Rep. 2016, 6, 25815. [Google Scholar] [CrossRef]
- Shi, B.; Zhang, J.; Wang, C.; Ma, J.; Sun, W. Responses of Hydrolytic Enzyme Activities in Saline-Alkaline Soil to Mixed Inorganic and Organic Nitrogen Addition. Sci. Rep. 2018, 8, 4543. [Google Scholar] [CrossRef] [Green Version]
- Sinsabaugh, R.L.; Lauber, C.L.; Weintraub, M.N.; Ahmed, B.; Allison, S.D.; Crenshaw, C.; Contosta, A.R.; Cusack, D.; Frey, S.; Gallo, M.E.; et al. Stoichiometry of Soil Enzyme Activity at Global Scale. Ecol. Lett. 2008, 11, 1252–1264. [Google Scholar] [CrossRef]
- Boeddinghaus, R.S.; Nunan, N.; Berner, D.; Marhan, S.; Kandeler, E. Do General Spatial Relationships for Microbial Biomass and Soil Enzyme Activities Exist in Temperate Grassland Soils? Soil Biol. Biochem. 2015, 88, 430–440. [Google Scholar] [CrossRef]
- Dai, X.; Zhou, W.; Liu, G.; Liang, G.; He, P.; Liu, Z. Soil C/N and PH Together as a Comprehensive Indicator for Evaluating the Effects of Organic Substitution Management in Subtropical Paddy Fields after Application of High-Quality Amendments. Geoderma 2019, 337, 1116–1125. [Google Scholar] [CrossRef]
- Grządziel, J. Functional Redundancy of Soil Microbiota–Does More Always Mean Better? Pol. J. Soil Sci. 2017, 50, 75. [Google Scholar] [CrossRef] [Green Version]
- Jia, Y.; Whalen, J.K. A New Perspective on Functional Redundancy and Phylogenetic Niche Conservatism in Soil Microbial Communities. Pedosphere 2020, 30, 18–24. [Google Scholar] [CrossRef]
- Shariff, A.R.; Biondini, M.E.; Grygiel, C.E. Grazing Intensity Effects on Litter Decomposition and Soil Nitrogen Mineralization. J. Range Manag. 1994, 47, 444. [Google Scholar] [CrossRef] [Green Version]
- Esch, E.H.; Hernández, D.L.; Pasari, J.R.; Kantor, R.S.G.; Selmants, P.C. Response of Soil Microbial Activity to Grazing, Nitrogen Deposition, and Exotic Cover in a Serpentine Grassland. Plant Soil 2013, 366, 671–682. [Google Scholar] [CrossRef]
- Waldrop, M.P.; Balser, T.C.; Firestone, M.K. Linking Microbial Community Composition to Function in a Tropical Soil. Soil Biol. Biochem. 2000, 32, 1837–1846. [Google Scholar] [CrossRef]
- Zhen, Z.; Wang, S.; Luo, S.; Ren, L.; Liang, Y.; Yang, R.; Li, Y.; Zhang, Y.; Deng, S.; Zou, L.; et al. Significant Impacts of Both Total Amount and Availability of Heavy Metals on the Functions and Assembly of Soil Microbial Communities in Different Land Use Patterns. Front. Microbiol. 2019, 10, 2293. [Google Scholar] [CrossRef] [PubMed]
- Postma-Blaauw, M.B.; de Goede, R.G.M.; Bloem, J.; Faber, J.H.; Brussaard, L. Soil Biota Community Structure and Abundance under Agricultural Intensification and Extensification. Ecology 2010, 91, 460–473. [Google Scholar] [CrossRef] [PubMed]
- Crotty, F.V.; Fychan, R.; Sanderson, R.; Rhymes, J.R.; Bourdin, F.; Scullion, J.; Marley, C.L. Understanding the Legacy Effect of Previous Forage Crop and Tillage Management on Soil Biology, after Conversion to an Arable Crop Rotation. Soil Biol. Biochem. 2016, 103, 241–252. [Google Scholar] [CrossRef] [Green Version]
- Crème, A.; Rumpel, C.; Le Roux, X.; Romian, A.; Lan, T.; Chabbi, A. Ley Grassland under Temperate Climate Had a Legacy Effect on Soil Organic Matter Quantity, Biogeochemical Signature and Microbial Activities. Soil Biol. Biochem. 2018, 122, 203–210. [Google Scholar] [CrossRef]
- Sirimarco, X.; Barral, M.P.; Villarino, S.H.; Laterra, P. Water Regulation by Grasslands: A Global Meta-Analysis. Ecohydrology 2018, 11, 1934. [Google Scholar] [CrossRef]
- Christensen, B.T.; Rasmussen, J.; Eriksen, J.; Hansen, E.M. Soil Carbon Storage and Yields of Spring Barley Following Grass Leys of Different Age. Eur. J. Agron. 2009, 31, 29–35. [Google Scholar] [CrossRef]
- Carter, D.L.; Blair, J.M. High Richness and Dense Seeding Enhance Grassland Restoration Establishment but Have Little Effect on Drought Response. Ecol. Appl. 2012, 22, 1308–1319. [Google Scholar] [CrossRef] [PubMed]
- Martin, G.; Durand, J.-L.; Duru, M.; Gastal, F.; Julier, B.; Litrico, I.; Louarn, G.; Médiène, S.; Moreau, D.; Valentin-Morison, M.; et al. Role of Ley Pastures in Tomorrow’s Cropping Systems. A Review. Agron. Sustain. Dev. 2020, 40, 17. [Google Scholar] [CrossRef]
- Hoeffner, K.; Hotte, H.; Cluzeau, D.; Charrier, X.; Gastal, F.; Pérès, G. Effects of Temporary Grassland Introduction into Annual Crop Rotations and Nitrogen Fertilisation on Earthworm Communities and Forage Production. Appl. Soil Ecol. 2021, 162, 103893. [Google Scholar] [CrossRef]


| Plots | Abbreviations | Clay (g/kg) | Silt (g/kg) | Sand (g/kg) | Agricultural Practices | Land Use at the Sampling Time | Plots Area (ha) | Cumulative Years under Grassland since 20 Years |
|---|---|---|---|---|---|---|---|---|
| Permanent grassland | PG 1 | 163 | 633 | 204 | Permanent grassland no tillage | Grassland | 3 | 20 years |
| Restored grasslands | RGI 2 | 141 | 665 | 194 | Restored grassland | Grassland | 2 | 5.5 years |
| RGII 3 | 126 | 665 | 210 | Restored grassland | Grassland | 3 | 11 years | |
| Temporary grasslands | TC 4 | 141 | 656 | 203 | Temporary grassland, switched to crop in 2010 | Wheat crop | 3 | 14 years |
| TG 5 | 147 | 651 | 202 | Temporary grassland | Grassland | 3 | 14 years | |
| Continuous crop | CC 6 | 133 | 671 | 196 | Continuous crop and fertilization | Wheat crop | 4 | 0 year |
| Plots | Permanent Grassland | Restored Grasslands | Temporary Grasslands | Continuous Crop | ||
|---|---|---|---|---|---|---|
| Years | PG | RGI | RGII | TC | TG | CC |
| 2010 | grassland | grassland | grassland | Triticum aestivum | grassland | Triticum aestivum |
| 2009 | grassland | grassland | grassland | Zea mays | grassland | Zea mays |
| 2008 | grassland | Triticum aestivum | Triticum aestivum | grassland | grassland | Triticum aestivum |
| 2007 | grassland | Zea mays | Vicia faba | grassland | grassland | Zea mays |
| 2006 | grassland | Triticum aestivum | Linum usitatissimum | grassland | grassland | Triticum aestivum |
| 2005 | grassland | Zea mays | Triticum aestivum | grassland | Triticum aestivum | Linum usitatissimum |
| 2004 | grassland | Triticum aestivum | Zea mays | grassland | Zea mays | Triticum aestivum |
| 2003 | grassland | Zea mays | grassland | Triticum aestivum | grassland | Beta vulgaris |
| 2002 | grassland | grassland | grassland | Zea mays | grassland | Triticum aestivum |
| 2001 | grassland | grassland | grassland | grassland | grassland | Zea mays |
| 2000 | grassland | grassland | grassland | grassland | Triticum aestivum | Triticum aestivum |
| 1999 | grassland | Pisum sativum | grassland | grassland | Zea mays | Beta vulgaris |
| 1998 | grassland | Triticum aestivum | grassland | grassland | grassland | Triticum aestivum |
| 1997 | grassland | Zea mays | grassland | grassland | grassland | Linum usitatissimum |
| 1996 | grassland | Triticum aestivum | grassland | grassland | grassland | - |
| 1995 | grassland | Zea mays | grassland | grassland | grassland | - |
| 1994 | grassland | Linum usitatissimum | Triticum aestivum | grassland | grassland | - |
| 1993 | grassland | Zea mays | Zea mays | Triticum aestivum | grassland | - |
| 1992 | grassland | Triticum aestivum | Triticum aestivum | Zea mays | Triticum aestivum | - |
| 1991 | grassland | Zea mays | Pisum sativum | grassland | Zea mays | - |
| Enzymes | Abbreviations | E.C. Numbers | Substrates (Buffer pH and Concentration) |
|---|---|---|---|
| Global enzymatic activities | |||
| Dehydrogenase | DEH | 1.1.1.1 | 2,3,5 triphenyltetrazolium chloride (pH 7; 0.12 M) |
| Fluorescein diacetate hydrolase | FDA | Fluorescein diacetate (pH 7.6; 1000 µg mL−1) | |
| C cycle enzymatic activities | |||
| β-galactosidase | GAL | 3.2.1.23 | p-NP-β-D-galactopyranoside (pH 7; 0.02 M) |
| β-glucosidase | GLU | 3.2.1.21 | p-NP-β-D-glucopyranoside (pH 6; 50 mM) |
| Cellulase | CEL | 3.2.1.4 | p-NP-β-D-cellobioside (pH 6; 10 mM) |
| Laccase | LAC | 1.10.3.2 | 2,2′-azino-bis-(3 ethylbenzothiazoline-6-sulfonate) (pH 5; 0.5 mM) |
| Lipase | LIP | 3.1.1.3 | p-NP-palmitate (pH 6.5; 1 mM) |
| N-acetylglucosaminidase | NAG | 3.2.1.30 | p-NP-N-acetylglucosaminide (pH 6; 10 mM) |
| Xylanase | XYL | 3.2.1.8 | Xylan (pH 5.5, 12 g L−1) |
| N cycle enzymatic activities | |||
| Arylamidase | ARYLN | 3.4.11.2 | L-leucine b-naphtylamide (pH 8; 2 mM) |
| Urease | URE | 3.5.1.5 | Urea (pH 7; 0.05 mM) |
| S cycle enzymatic activities | |||
| Arylsulfatase | ARYLS | 3.1.6.1 | p-NP-sulfate (pH7; 25 mM) |
| P cycle enzymatic activities | |||
| Acid phosphatase | ACP | 3.1.3.2 | p-NP-phosphate (pH 5; 50 mM) |
| Alkaline phosphatase | AKP | 3.1.3.1 | p-NP-phosphate (pH 9; 50 mM) |
| Plots | Permanent Grassland | Restored Grasslands | Temporary Grasslands | Continuous Crop | ||
|---|---|---|---|---|---|---|
| PG | RGI | RGII | TC | TG | CC | |
| Total C (g kg−1) | 25.74 ± (0.96) a | 11.11 ± (0.34) d | 14.30 ± (0.22) c | 13.89 ± (0.53) c | 18.60 ± (0.81) b | 10.67 ± (0.34) d |
| Total N (g kg−1) | 2.46 ± (0.07) a | 1.14 ± (0.03) d | 1.41 ± (0.02) c | 1.44 ± (0.06) c | 1.81 ± (0.06) b | 1.08 ± (0.04) d |
| C/N ratio | 10.47 ± (0.18) a | 9.76 ± (0.06) b | 10.15 ± (0.11) a | 9.61 ± (0.18) b | 10.25 ± (0.09) a | 9.85 ± (0.13) b |
| Moisture (%) | 13.83 ± (0.55) a | 10.53 ± (0.29) c | 9.58 ± (0.19) d | 10.45 ± (0.25) b | 11.78 ± (0.56) b | 9.35 ± (0.25) d |
| pHwater | 5.46 ± (0.05) b | 5.57 ± (0.05) b | 6.04 ± (0.05) c | 6.27 ± (0.05) a | 5.51 ± (0.05) b | 6.43 ± (0.05) a |
| CEC (cmol+ kg−1) | 8.08 ± (0.26) a | 5.46 ± (0.37) d | 6.92 ± (0.31) b | 7.76 ± (0.05) c | 7.29 ± (0.20) b | 7.04 ± (0.30) b |
| P2O5 (g kg−1) | 0.13 ± (0.03) bc | 0.09 ± (0.01) d | 0.13 ± (0.01) c | 0.15 ± (0.01) ab | 0.19 ± (0.02) ab | 0.20 ± (0.02) a |
| Plots | Permanent Grassland | Restored Grasslands | Temporary Grasslands | Continuous Crop | ||
|---|---|---|---|---|---|---|
| Abundance of Microbial Communities | PG | RGI | RGII | TC | TG | CC |
| Total microbial biomass | ||||||
| Total dsDNA (µg g−1) | 25.82 ± (4.37) a | 12.22 ± (3.24) c | 16.49 ± (0.28) b | 9.76 ± (1.79) b | 15.70 ± (3.62) bc | 13.24 ± (3.11) b |
| Total microbial PLFA (nmol g−1) | 717.05 ± (70.2) a | 184.26 ± (4.00) c | 259.41 ± (29.1) b | 102.66 ± (31.3) d | 262.33 ± (84.5) bcd | 141.33 ± (26.8) d |
| Microbial biomass carbon (mg C kg−1) | 987.78 ± (88.4) a | 250.52 ± (13.4) d | 348.50 ± (6.03) c | 339.32 ± (23.3) c | 570.32 ± (63.1) b | 234.39 ± (16.8) d |
| Bacterial biomass | ||||||
| Bacterial dsDNA (µg g−1) | 6.91 ± (1.70) a | 3.30 ± (1.12) bc | 3.96 ± (0.50) b | 2.91 ± (0.39) c | 3.28 ± (1.7) abc | 2.93 ± (1.20) bc |
| Total bacterial PLFA (nmol g−1) | 348.88 ± (29.7) a | 72.66 ± (0.82) c | 105.34 ± (13.4) b | 41.62 ± (17.0) d | 110.76 ± (41.7) bcd | 53.78 ± (9.79) d |
| Fungal biomass | ||||||
| Fungal dsDNA (µg g−1) | 1.78 ± (0.25) a | 1.55 ± (0.84) abc | 1.34 ± (0.19) ab | 0.65 ± (0.12) c | 1.13 ± (0.58) abc | 0.84 ± (0.29) bc |
| Total fungal PLFA (nmol g−1) | 22.68 ± (5.21) a | 9.95 ± (0.33) c | 13.10 ± (1.57) b | 1.95 ± (0.72) e | 12.04 ± (4.44) bc | 5.12 ± (1.10) d |
| Total ergosterol (µg g−1) | 2.08 ± (0.60) a | 0.99 ± (0.22) b | 1.21 ± (0.21) b | 0.82 ± (0.06) b | 3.12 ± (0.68) a | 0.65 ± (0.22) b |
| Free ergosterol (µg g−1) | 1.28 ± (0.23) a | 0.77 ± (0.08) b | 0.75 ± (0.45) abc | 0.48 ± (0.04) c | 1.06 ± (0.10) a | 0.51 ± (0.04) c |
| Plots | Permanent Grassland | Restored Grasslands | Temporary Grasslands | Continuous Crop | ||
|---|---|---|---|---|---|---|
| Enzyme Activities (nmole min−1 g dry soil−1) | PG | RGI | RGII | TC | TG | CC |
| Global enzyme | ||||||
| DEH | 0.20 ± (0.10) a | 0.04 ± (0.02) b | 0.04 ± (0.03) bc | 0.04 ± (0.03) bc | 0.08 ± (0.04) ab | 0.00 ± (0.01) c |
| FDA | 3.00 ± (0.30) a | 1.56 ± (0.04) b | 2.56 ± (0.54) a | 1.30 ± (0.84) b | 2.12 ± (0.46) a | 1.08 ± (0.25) b |
| C cycle enzymes | ||||||
| GAL | 4.65 ± (0.28) a | 2.07 ± (0.28) b | 2.20 ± (0.36) b | 1.48 ± (0.12) c | 3.42 ± (0.36) d | 1.35 ± (0.16) e |
| GLU | 9.65 ± (0.81) b | 3.36 ± (0.52) e | 7.97 ± (0.44) c | 5.94 ± (0.67) d | 12.10 ± (0.94) a | 5.36 ± (0.65) d |
| CEL | 1.96 ± (0.24) a | 0.77 ± (0.23) b | 0.94 ± (0.14) b | 0.81 ± (0.16) b | 1.75 ± (0.26) a | 0.65 ± (0.09) b |
| LAC | 8.03 ± (1.35) a | 5.80 ± (1.47) ab | 2.57 ± (1.30) c | 1.41 ± (0.58) c | 3.53 ± (1.88) bc | 2.73 ± (0.63) c |
| LIP | 2.82 ± (0.26) a | 1.68 ± (0.16) b | 1.46 ± (0.32) b | 1.06 ± (0.16) c | 1.72 ± (0.17) b | 0.74 ± (0.19) c |
| XYL | 0.08 ± (0.01) a | 0.01 ± (0.01) c | 0.01 ± (0.00) c | 0.02 ± (0.01) bc | 0.04 ± (0.01) b | 0.00 ± (0.01) c |
| N cycle enzymes | ||||||
| ARYLN | 3.94 ± (0.39) a | 1.32 ± (0.09) c | 1.66 ± (0.08) b | 1.49 ± (0.11) c | 1.90 ± (0.32) b | 2.04 ± (0.24) b |
| NAG | 5.78 ± (0.72) a | 2.03 ± (0.41) cd | 2.70 ± (0.20) d | 1.97 ± (0.64) cd | 4.20 ± (0.46) b | 1.36 ± (0.31) c |
| URE | 79.43 ± (10.03) a | 25.84 ± (2.46) d | 34.63 ± (2.01) c | 30.01 ± (3.57) cd | 54.71 ± (3.32) b | 21.18 ± (0.36) e |
| S cycle enzyme | ||||||
| ARYLS | 7.27 ± (0.23) a | 2.70 ± (0.11) b | 3.32 ± (0.22) c | 2.70 ± (0.10) b | 5.48 ± (0.33) d | 1.83 ± (0.24) e |
| P cycle enzymes | ||||||
| ACP | 42.72 ± (1.25) a | 10.73 ± (7.23) e | 20.86 ± (1.92) c | 17.74 ± (0.91) d | 30.60 ± (2.29) b | 10.81 ± (0.90) e |
| AKP | 4.30 ± (1.13) c | 2.65 ± (0.39) d | 7.90 ± (0.56) a | 3.52 ± (1.11) cd | 5.24 ± (1.17) cb | 6.15 ± (0.48) b |
Publisher’s Note: MDPI stays neutral with regard to jurisdictional claims in published maps and institutional affiliations. |
© 2021 by the authors. Licensee MDPI, Basel, Switzerland. This article is an open access article distributed under the terms and conditions of the Creative Commons Attribution (CC BY) license (https://creativecommons.org/licenses/by/4.0/).
Share and Cite
Riah-Anglet, W.; Cusset, E.; Chaussod, R.; Criquet, S.; Norini, M.-P.; Cheviron, N.; Mougin, C.; Laval, K.; Latour, X.; Legras, M.; et al. Introducing Grasslands into Crop Rotations, a Way to Restore Microbiodiversity and Soil Functions. Agriculture 2021, 11, 909. https://0-doi-org.brum.beds.ac.uk/10.3390/agriculture11100909
Riah-Anglet W, Cusset E, Chaussod R, Criquet S, Norini M-P, Cheviron N, Mougin C, Laval K, Latour X, Legras M, et al. Introducing Grasslands into Crop Rotations, a Way to Restore Microbiodiversity and Soil Functions. Agriculture. 2021; 11(10):909. https://0-doi-org.brum.beds.ac.uk/10.3390/agriculture11100909
Chicago/Turabian StyleRiah-Anglet, Wassila, Elodie Cusset, Rémi Chaussod, Stéven Criquet, Marie-Paule Norini, Nathalie Cheviron, Christian Mougin, Karine Laval, Xavier Latour, Marc Legras, and et al. 2021. "Introducing Grasslands into Crop Rotations, a Way to Restore Microbiodiversity and Soil Functions" Agriculture 11, no. 10: 909. https://0-doi-org.brum.beds.ac.uk/10.3390/agriculture11100909