Article

Magnitude, Causes and Scope for Reducing Food Losses in the Baking and Confectionery Industry—A Multi-Method Approach

by
Elżbieta Goryńska-Goldmann
1,*,
Michał Gazdecki
1,
Krystyna Rejman
2,*,
Sylwia Łaba
3,
Joanna Kobus-Cisowska
4 and
Krystian Szczepański
3
1
Department of Economics and Economy Policy in Agribusiness, Faculty of Economics, Poznan University of Life Sciences (PULS), Wojska Polskiego Str. 28, 60-637 Poznań, Poland
2
Department of Food Market and Consumer Research, Institute of Human Nutrition Sciences, Warsaw University of Life Sciences (WULS-SGGW), Nowoursynowska Str. 159 C, 02-776 Warsaw, Poland
3
Institute of Environmental Protection—National Research Institute (IEP-NRI), Krucza Str. 5/11D, 00-548 Warsaw, Poland
4
Department of Gastronomy Sciences and Functional Foods, Faculty of Food Science and Nutrition, Poznan University of Life Sciences (PULS), Wojska Polskiego Str. 28, 60-637 Poznań, Poland
*
Authors to whom correspondence should be addressed.
Submission received: 3 September 2021 / Revised: 23 September 2021 / Accepted: 23 September 2021 / Published: 28 September 2021
(This article belongs to the Special Issue Agricultural Food Marketing, Economics and Policies)

Abstract

:
Reducing food wastage is one of the challenges in achieving global food security and transforming current food systems. Since human nutrition is closely dependent on cereal production, research was undertaken aimed at understanding the food losses in the baking and confectionery industry (BCI) in Poland, in particular at determining the volume, reasons and ways of reducing losses, identifying possibly all of the reasons for losses in BCI using the Ishikawa 5M + 1E diagram and determining the level of significance and probability of risk of food losses in the analysed sector. Two research methods were used. Quantitative data were collected using the mass balance method from five businesses that served as case studies. Qualitative data were collected through individual in-depth interviews with 17 industry experts. The companies’ average daily losses ranged from 0.8 to 6.4 tons, representing 9.7 to 14.4% of production volume, including 10.4–13.4% of bread losses and 6.8–24.4% of fresh pastry losses. The highest losses were generated by transport departments and these were exclusively retail returns. Following the Ishikawa concept, 31 primary and 94 secondary reasons for food losses were identified. Using the probability of loss risk, a toolkit for loss prevention and mitigation across all departments within businesses (raw materials magazine, production section, final product magazine and final product transport) and a set of horizontal tools were identified, including specialised training for employees and activities in several areas, e.g., technical status and production technology, organisation and planning, logistics and sales and cooperation with retail. This study, conducted in Poland, offers valuable results for developing programmes and strategies to prevent and manage food losses in BCI. Many of the solutions proposed in both toolkits can bring economic benefits without involving additional high costs.

1. Introduction

It was only at the beginning of the second decade of the 21st c. that the problem of food wastage gained due prominence in public discussion. This was due to a report published in 2011 by the Food and Agriculture Organization of the United Nations (FAO), which, for the first time, presented a comprehensive approach to food loss and waste (FLW) on a global scale [1]. At the same time, the European Commission published a report presenting FLW across 27 member states [2]. As a result, there has been a substantial increase in the number of FLW studies between 2011 and 2015, accounting for almost 70% of all publications on the topic over a 75-year period [3].
It has become clear that FLW is one of the greatest sources of food systems inefficiencies and a relevant global problem due to its implications for the environmental, economic and social dimensions of sustainability. The need to eliminate FLW has been identified among the most important directions for action in the Zero Hunger Challenge, the global commitment launched during the United Nations Conference on Sustainable Development Rio + 20 [4]. FLW is widely identified as a key barrier to ending hunger and achieving global food security [3,5,6,7]. The reduction of FLW is of particular importance for increasing the sustainability of food systems by preventing the loss of the cropland, water, energy and other resources used for food production [8,9,10], addressing environmental sustainability through the reduction of greenhouse gas emissions and the amount of fertilizers and pesticides used for crop production [11,12], and enhancing human health (e.g., by reducing toxic emissions from incineration) [3,13]. In particular, the demand for processed and convenience food and un-sustainable consumer behaviour in developed countries have resulted in excessive use of water and greenhouse gas emissions, soil degradation and food wastage [14].
There is no universal definition of FLW and it can be grouped into five categories, taking as reference: the stages of the food supply chain (FSC), the dimensions of edibility and the intention of food production, the dimension of quality understood as nutrition, aesthetics and shelf life, the nature of food use and the destination of surplus food [15]. FAO analyses adopted a distinction between the concepts of food loss (FL) and food waste (FW). This approach is presented widely by scholars [8,9,16,17,18] and has also been adopted in the first governmental project regarding FLW in Poland [19]. FL refers to the deterioration in food quantity or quality prior to the consumer level, while FW refers to food being discarded or left to spoil at the consumer level, i.e., at the retail, food service and household phases [20].
FAO’s pioneering studies on FLW covered only the edible parts of food [1,8,20]. However, in recent estimates, it was decided to measure FLW by two separate indicators, considering the two components of SDG target 12.3, namely the Food Loss Index (FLI), measured by FAO, and the Food Waste Index, measured by the United Nations Environment Programme (UNEP) [21]. In addition, the scope of FL and FW have been fundamentally changed to include inedible parts of commodities. This change implies methodological consistency with the European Union’s FUSIONS [22] project, the results of which provide a starting point for analysing food wastage in the member states [23].
FLI’s first estimate showed that 13.8% of food produced globally is lost in the phases from post-harvest to distribution. At the regional level, the smallest losses of 5.8% occurred in the Australia and New Zealand region, the largest in Central and Southern Asia, amounting to 20.7%, and in the most developed and urbanised regions of North America and Europe, the losses amounted to 15.7% [24]. The percentage of losses for cereals and pulses was the lowest among five food groups at 8.5% of global production volume [21]. According to UNEP’s first estimate, food waste amounted to 931 million tons, including 61% in households (570 million tons), 26% in food service and 13% in retail; this means that 17% of global food production could be wasted [25].
It is essential to address the causes of FLW in each stage of the food supply chain and the determinants behind them [21]. While there is a large and constantly growing number of studies on FW from the demand side of the food chain, there is much less data and information on losses on the supply side [5], especially at the processing level [26,27]. Therefore, filling this research gap was included in the objectives of the first comprehensive study of food wastage in Poland under the PROM project “Developing a system for monitoring wasted food and an effective programme to rationalise food losses and reduce food waste”. In this article, we present the research on food losses in the Polish baking and confectionery industry (BCI), included in this project [28].
The aims of this study were: 1—accurate identification of the size, causes and ways of reducing losses in all operational activities in five bakeries—case studies, 2—to indicate in details all potential causes of food losses in bakery and confectionery companies, using the Ishikawa 5M + 1E diagram, 3—to determine the significance level and probability of risk of food losses in this industry.

Food Losses in the Food Processing and Baking Sector

The interpretation of FLW data, policy setting and research agenda setting are hampered by: 1—the lack of a clear scientific position and widely accepted definition of FLW terms, 2—the enormous complexity and diversity of food systems and supply chains, covering many stages and processes from farm to fork, 3—the failure to develop universal measurement methods for each stage of the FSC.
In particular, the estimates for manufacturing sectors are affected by definitional issues, as evidenced, for example, by the disparities in estimates made by WRAP in the UK in different years and with different definitional assumptions [29]. Also, the relatively high estimates in the first report on FLW in EU member states [2] have caused a lot of controversy, as food processing contributes rather minimally to edible food waste, as it accounts for only 1–2% of total production [30]. Contrary to these results, the model calculations [31] showed losses in numerous countries that were several times lower, e.g., 4.5 times lower in Poland, yet 3.4 times higher in France. In the second EU project, FUSIONS [22], a 19% share of the processing sector in total FLW was shown, including edible and non-edible waste and the entire FSC. It was emphasised that investigating food losses in the processing phase requires a separate approach in each industry.
This approach has been used in the PROM project. It has been estimated that FLW in the entire FSC amounted to 4.8 million tons, of which the processing sector generated 15.6% (749 thousand tons) [19]. A similar percentage of losses, 16.5%, is generated by the manufacturing industry in the total FSC in the UK [29], and according to the WRAP programme—16% (primary production was not included) [32]. The same order of magnitude, 18%, was specified in estimates for Canada [33]. The estimates from other countries point to a much lower share of industrial FL in total food wastage. In Finland, food industry losses were estimated at around 3% of the total volume of production (75–140 thousand tons) [34], and in Italy, at 2.6% (1860 thousand tons) [35].
In the case of losses in bread processing, large disparities exist between European countries, ranging from 1.00% (Norway) to 8.5% (Finland) of this sector’s production (Table 1). On a per capita basis, losses in BCI in Poland were 8.1 and 6.9 kg in two consecutive years (2017 and 2018), 4.5 kg in Finland and 4.1 kg in Italy. These data should be treated as illustrative and not comparable, as different research assumptions and estimation methods were used, and the number of companies participating in the research varied.
In Jordan, the total loss in wheat processing (including bran fed to animals and milling loss) in national mills was 13.68% [41]. In South Africa, losses in the processing of cereals and cereal products were estimated at 288 thousand tons (in 2007) and averaged 398 thousand tons between 2007 and 2009, or 15.9% of the total volume of cereal wastage [42]. In China, the average loss of grains in processing was 2.2–3.3% [43] or 1.00–4.70% [44], but it should be noted that only small fractions of wheat and rice in China are industrially processed [43]. In the United States, the manufacturing sector generated 13.1% (10.6 million tons) of surplus food, including 2.1% (1.68 million tons) of bread and bakery products in 2019 [45]. Over two-thirds of the bread supplied to the market is consumed, while 20% is wasted in the kitchen, and the remaining 12% is wasted in retail [46], which means that losses in bread processing are higher.

2. Materials and Methods

2.1. Data Collection

The research was conducted in two stages and two approaches for data collection were used: 1—quantitative method (case studies)—for estimating the volume of food losses, 2—qualitative method—to identify all causes of bread losses in bakeries and to find out how companies prevent bread losses and what additional solutions/tools can be implemented.
A triangular approach was applied, knowing the barriers and difficulties in studying the various aspects of food losses from our own experience and as highlighted by many authors [47,48,49]. Such an approach is used to obtain multiple measures in order to achieve richer information on the research questions under discussion [50,51].

2.1.1. Quantitative Stage

The quantitative studies were conducted as a part of expertise for the Institute of Environmental Protection—National Research Institute. To estimate the amount of food losses in bakeries, the method of monitoring the mass balance was chosen. According to the EU guidelines on common methodology for the uniform measurement of FLW levels [52], the mass balance is defined as the calculation of the amount of food waste on the basis of the mass of inputs and outputs of food into and out of the measured system, and processing and consumption of food within the system.
The subject of the survey were companies from the Polish baking and confectionery industry (sector name according to NACE—the Statistical Classification of Economic Activities in the EU), i.e., entities of the secondary food processing sections which produce bakery and/or confectionery products, offering food products made from cereal milling to the market. The survey concerns only one processing plant in a given entity (i.e., not all processing units in the entire group). There are more than 11,000 entities of different economic classes in the bakery and confectionery sector in Poland. There is strong competition in the market and as a result, products from bakeries of different sizes are quite homogenous. Therefore, a convenient choice was used for the selection of study participants. We invited 96 entities of bakers and pastry-makers to take part in the research. The recruitment of enterprises was a 3-stage process: (1) sending e-mails with a request to join the survey, and its description, (2) conducting telephone interviews (establishing contact, presenting the aims and course of the survey, setting dates) and (3) requesting industry associations to promote the study among potential participants. The recruitment was supported by the trade union for bakers and pastry-makers, and finally, 9 businesses agreed to participate in the monitoring of the mass balance. Companies do not want to disclose their data on any sensitive issue, so in the process of sampling, every effort has been made to assure companies that their data and information will be kept anonymous and confidential. The second reason for refusal were organisational issues (e.g., added responsibilities, lack of time and excessive workload). Following an initial analysis of the study material, the data from 5 businesses were qualified for analysis: 2 micro-businesses (1–9 employees), 1 mid-sized business (50–249 employees) and 2 large businesses (250 and more employees).
Please note that care was taken to ensure that the businesses accepted for the study represent a cross-section of the sector and produce an assortment reflecting the market offer, belonging to different economic size classes in terms of, e.g., employment and production volume.
Participants in the quantitative survey were not remunerated in any way, but the survey report was sent to them.

2.1.2. Qualitative Stage

The method used was that of individual in-depth interviews, which were conducted with the managers/owners of the 5 bakeries participating in the quantitative examination and with 12 experts on BCI, including the industry’s external and internal auditors. The participants in the study had at least 15 years of experience in the bakery and confectionery industry and were still dealing with it on a daily basis. Participation in the study was completely voluntary. Participants did not receive any incentives. The participants were informed that the interviews were recorded. The interviews lasted 1–4 h and were conducted using a standardised guide consisting of two parts: first—6 question on bread losses and why and where they occur; second—3 complex questions on solutions implemented in businesses to reduce and manage losses. The concept of the interview was prepared by the authors based on the literature and their experience [1,20,21,28,52,53,54,55].
The participation of experts allowed the gathering of in-depth knowledge on the causes of losses, making it possible to develop the Ishikawa cause and effect diagram, for which the participation of numerous specialists is necessary [56,57]. The collected data were transcribed and coded using QDA Miner software, LITE v2.0.8, a software dedicate to analysing qualitative data which was used to create the database and to code the responses. Frequency analysis was prepared using pivot tables.

2.2. Measures and Data Analysis

2.2.1. Monitoring of the Mass Balance

The authors’ own solution was used, given the lack of similar papers for BCI and the lack of tools for measuring food losses in individual departments of production plants. Each entity received a “Monitoring Diary”, i.e., forms (in computer files) for monitoring the mass balance for seven consecutive day: form 1—business characteristic features; form 2 —mass of daily use of raw materials; form 3 —mass of finished goods and losses in the three departments of the bakery: A—production and preparation for distribution: volume of production, rejects, i.e., products not complying with the company’s quality standards, and other losses; B—finished products warehouse/forwarding: mass of incoming goods, rejects, mass of goods for trade, mass of goods issued to employees as in-kind benefits, mass of goods left in the warehouse, other losses; C—transport of finished good: mass of accepted goods, mass of retail returns, other losses.
The measurements were conducted separately for the individual bread and pastry products product lines: total bread, fresh dessert pastry, durable confectionery and pastries and other products. The manager responsible for the monitoring and data registering had been trained before measurements commenced on how to fill in the form and questionnaires. During training, it was stressed that not only the types of losses needed to be reported, but that additionally, the weight of loss and its reason and description should be stated. Two micro-businesses did not show any losses, so the mass balance monitoring results from three bakeries served as case studies. Additionally, the Hazard Analysis and Critical Control Points (HACCP) system documentation from the examined bakeries was analysed and the observations were also used in the process of determining the causes of food losses.

2.2.2. Qualitative Data—In-Depth Individual Interviews

The analysis of in-depth interviews covered 5 stages suggested by Yin [51]: 1—Compiling database; making transcription of interviews, 2—Disassembling; coding respondents’ responses, 3—Reassembling; rearrangements and recombinations of the data into tabular form, 4—Interpreting; the frequency at which individual causes of losses were named during interviews was determined, 5—Concluding.

2.3. Interpretation of the Results

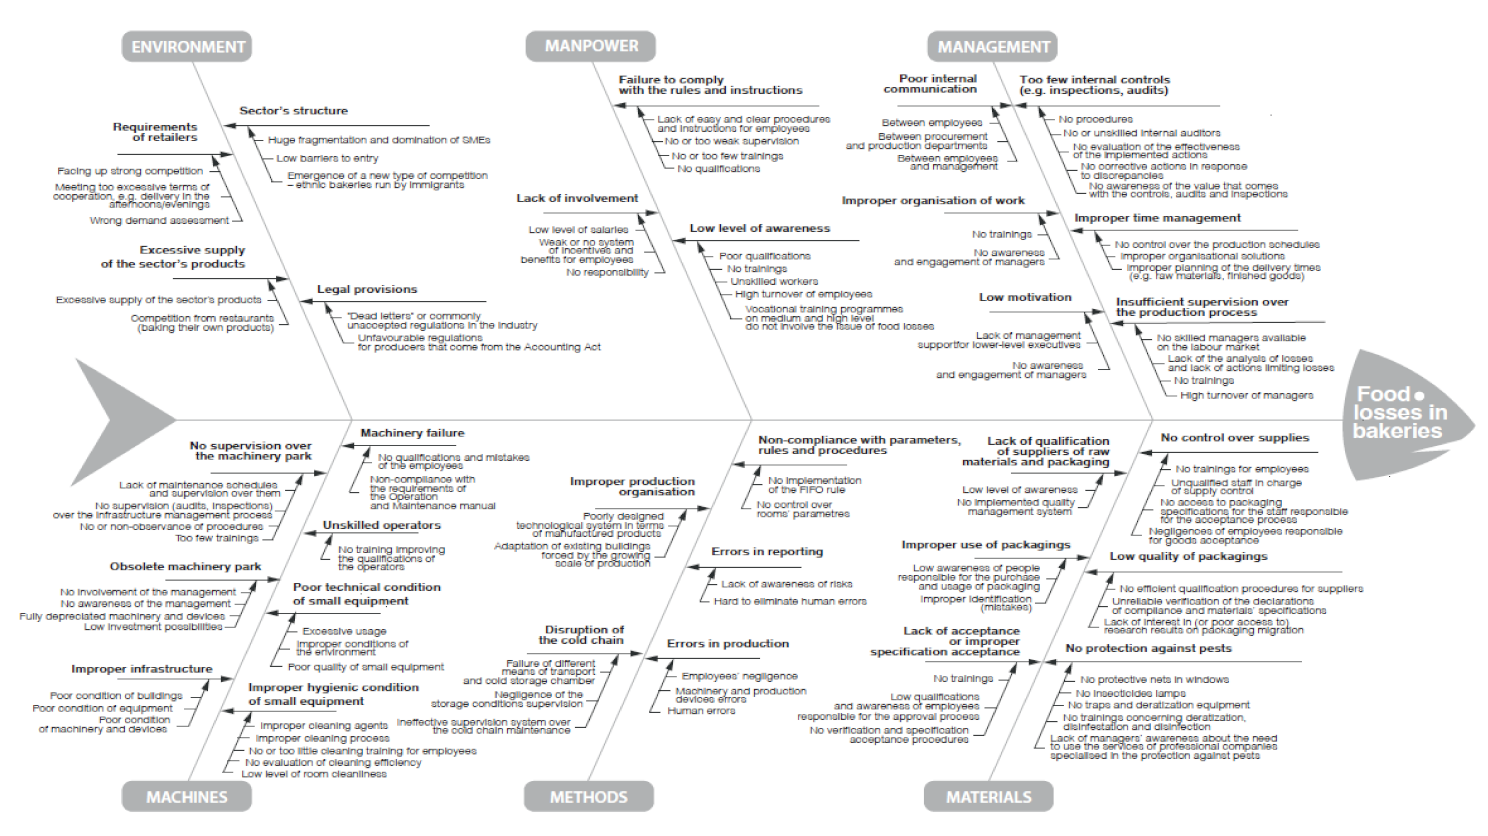
2.3.1. Ishikawa Diagram 5M + 1E

The causes of losses of BCI products were analysed using the Ishikawa diagram [58]. The diagram, created by Kaoru Ishikawa, and published in 1989 [59], is a common tool used for a cause-and-effect analysis to identify a complex interplay of causes for a specific problem or event [60]. Five categories of causes were listed in the original diagram—5M. Currently, the diagram includes 6 categories 5M + 1E: Man, Machinery, Materials, Methods, Management and Environment, and may even go up to 7 categories, where the additional M stands for Measurement [61].

2.3.2. Risk Assessment of Food Losses

The term risk has been assumed to mean an event or circumstance in which there is a potential for losses or waste. The types of losses and their probability of occurrence have been determined for individual stages of operational activity of BCI enterprises. The level of significance of each risk has been determined, with hazard to consumer health and magnitude of losses assumed as criteria. Determining the level of risk significance [57] allowed for a categorisation of the risk (Table 2).

3. Results

3.1. Size of Food Losses (Mass Balance Monitoring)

Two micro-businesses that monitored their mass balance did not show any losses. Each day, production and sales reached the same values and were of the same range of products, allowing the optimisation of all stages of operations, and avoiding losses. The sale of bread products took place in the bakery, translating into no transport losses and no retail returns. No losses in these types of entities were the effect of efficiency, good organisation (e.g., storage management and production process) and the adjustment of production volume to the demand reported by local communities. Moreover, as losses were perceived as a problem and a reason for unnecessary costs, these entities did not allow for overproduction and kept high quality standards. It happened occasionally that these enterprises did not sell a small amount of bread; in such a case it was always used for a human consumption. Therefore, the analysis covers the results of mass balance measurements from 3 enterprises: bakery A (465 employees), bakery B (550 employees) and bakery C (195 employees). The average daily production of finished goods for the bakeries was, respectively, 36.7 tons, 44.9 tons and 8.4 tons. The average daily losses were, respectively, 3.7 tons, 6.4 tons and 0.8 tons. The data show that bakery B (the largest one) produced 22% more than bakery A, but their mass of losses was higher by 73%. The distribution of losses into individual departments of the production facility, expressed as the percentage of production volume, is presented in Table 3.
Bakeries B and C did not show any losses in the raw materials warehouse. Monitoring in this department was impossible for bakery A, due to an IT investment project taking place in that department. Only bakery B recorded losses in each of the three consecutive departments and in each product range. The second large bakery (A) reported losses in the processing and finished products transport departments for the two assortments monitored, namely bread and fresh pastries. The medium-sized bakery C recorded losses only in the finished products transport department and only for two out of four types of goods covered in the monitoring, namely for bread and fresh pastries. Both large enterprises considered their production losses rejects, which are goods that fail to satisfy quality standards. The losses in the finished goods warehouse included the products remaining in the warehouse, whereas the transport losses only covered the retail returns.
To sum up, food losses in particular assortment groups in bakeries carrying out mass balance monitoring amounted as a percentage of production volume: total products 9.7–14.4%, fresh bread 10.4–13.4% and fresh pastries 6.8–24.4%.

3.2. Causes of FLW Including Returns from Retail Outlets (In-Depth Individual Interviews)

3.2.1. Technological Operations with the Highest Risk of Losses and Their Causes

It is the opinion of the interview participants that FL is a natural element of each process of production and distribution of finished goods. The forming and baking of the products were most often listed as technological process stages that are most susceptible to the occurrence losses, with human errors most often cited as the category of causes (Table 4).

3.2.2. Characteristics of Causes of Losses

With regard to human errors, most of them were emphasised as having been of an unintentional nature, stemming from routine operations and behaviours. It was found that the errors consisted in failing to observe recipes and the course of the technological process, e.g., failing to observe specific baking or cooling parameters. The verification of errors in production takes place during forwarding operations, quality control and rejection of products failing to satisfy the in-house standards (Table 5).
Breakdowns of machinery and devices may result from the deterioration of parts, improper supervision of the machinery, failure to adhere to the schedule of inspections and overhauls, excessive use and random situations. The number of failures may come from insufficient employee qualifications or their errors. Defects make it impossible to observe the technological process conditions and lead to improper quality of the finished goods.
Losses also occur as a natural element of conditions and methods of conducting processes (e.g., losses during the fermentation of sourdough or the baking and cooling of the finished products). Attention was drawn to the occurrence of losses that are difficult to avoid, such as sedimentation of pieces of dough on the technological line, flour residues in collective packaging, spilled raw materials, etc.
The losses stemming from ineffective communication with retailers, as indicated by the respondents, are both of a qualitative and quantitative nature. Quantitative inconsistencies may result from improper planning of the volume of production and from difficulties in estimating retail demand due to delayed orders. Qualitative inconsistencies mean that the finished goods fail to satisfy the parameters expected by retailers. In the respondents’ opinion, large retailers do not put much attention into having a rational policy of ordering, because it is common practice to burden the producers with the cost of unsold products.
The causes of losses identified in the qualitative research in the mass balance monitoring bakeries and among experts have been assigned to six 5M + 1E categories in the Ishikawa diagram and then categorised as 1st tier causes and 2nd tier causes (Figure 1).

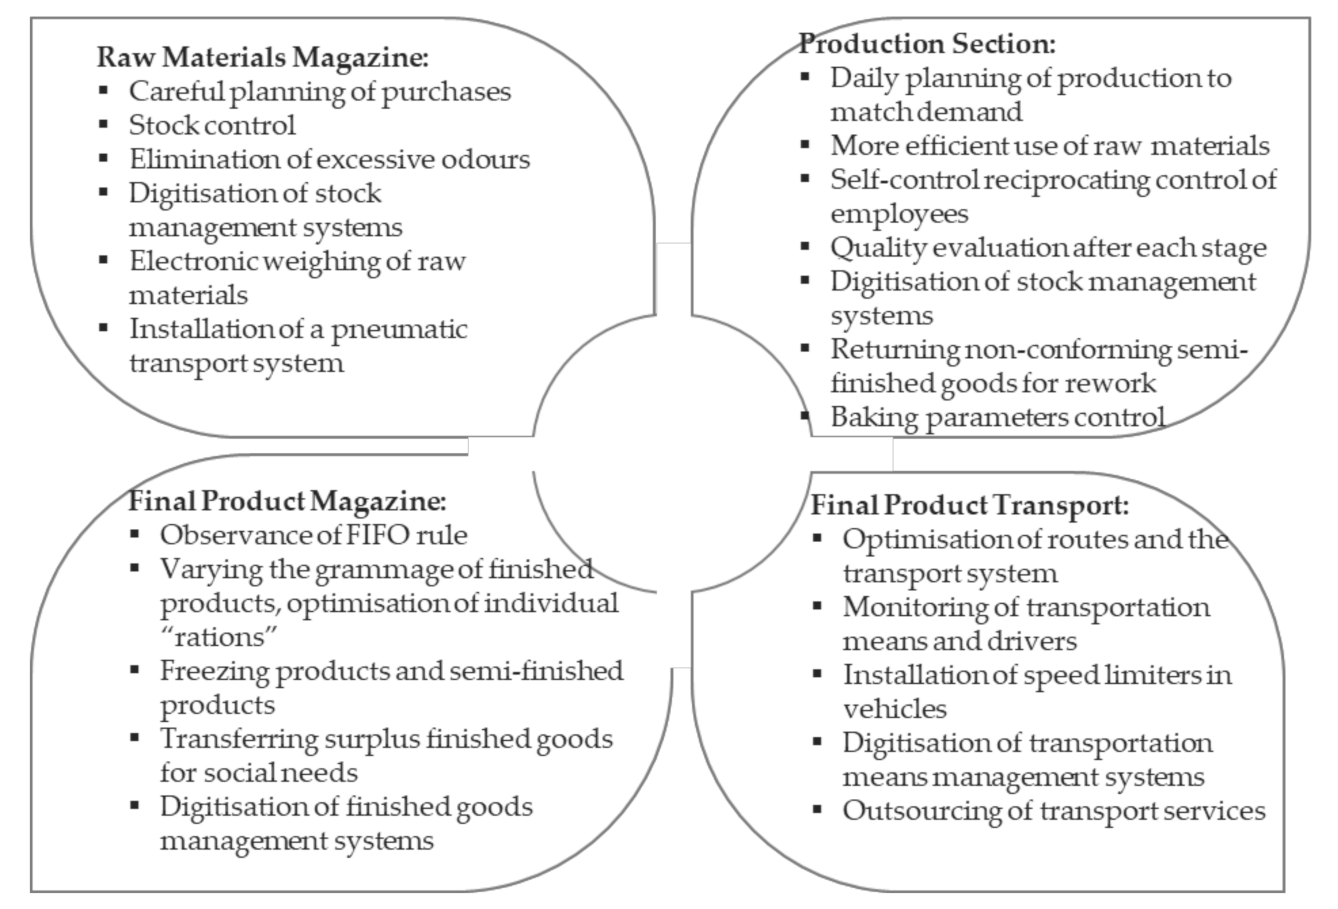
3.3. Scope for Reduction (In-Depth Individual Interviews)

It can be deduced from the replies of the respondents that preventing food losses is done by self-control and mutual control of employees, development or improvement of internal procedures and their observation, increasing the automation of operations and providing training and hiring staff with higher seniority and more experience.
EMPLOYEE LEVEL. The respondents concluded that human errors can be limited by strictly following the procedures, controlling the baking parameters and evaluating the quality of goods at every stage of production. Production facilities should supervise the packaging process and ensure control before putting the products up for sale. It was noted that products failing to meet the company’s quality standards (e.g., wrong net weight) were sold to employees at reduced prices, or to retailers as second-grade products. According to interview participants, control, and making employees aware of the consequences of errors during production play an important role in reducing losses.
PROCESSING LEVEL. In the opinion of the interview participants, production losses may be limited by using clean dough or defective goods according to the in-house procedures. Using them as fodder or delivering to biogas plants were most frequently indicated. De facto, this is not a reduction of losses in terms of food mass, but in the context of a circular economy, these are ways of managing losses in financial and environmental terms and avoiding their disposal (which is recommended as a method in the commonly accepted food recovery hierarchy). It can be deducted from the responses of the interview participants that losses can be also limited by employing experts to introduce innovative approaches to work organisation, scheduling machinery and equipment inspections, and following these approaches in order to prevent defects. It is worth noting that the examined bakeries had procedures for periodic inspections and ongoing control of the technical condition of machinery and equipment, which contributed to reducing the risk of losses due to these causes. The respondents also confirmed that tightening the technological regime (among other factors, in relation to moving the dough and measuring its temperature and acidity) significantly reduced production losses. It was underlined that employee training on the correct organisation and physical control of the production environment plays an important role. The losses in BCI businesses may be limited by carefully studying the specifics of the technological process.
RAW MATERIAL LEVEL. To limit losses, it is necessary to control raw material storage conditions (e.g., warehouse temperature and humidity control, cooling system control), secure warehouses against pests, periodically gas flour silos and follow the FIFO principle. The respondents believe that working with trusted suppliers who offer raw materials of adequate, reliable quality fosters the reduction of losses. Suppliers of raw materials should be closely controlled and evaluated (e.g., supplier qualification, selection of suppliers on the basis of reliable certificates, audits at suppliers), qualified employees should check each delivery (and complain to the supplier in case of any discrepancies) and employees responsible for purchasing and accepting raw materials should be well-trained. The requirement to control the conditions of raw materials and to establish principles to eliminate cross-contamination with allergens have been deemed important. It was found that the system of integrated silo tanks allows raw materials to be stored under conditions that guarantee food safety, and that automated logistics of raw materials by means of electronically controlled pneumatic transport allow the dosing and weighing of raw materials directly in the production area, thereby significantly limiting the losses of raw materials. Losses of raw materials in warehouses are also limited by maintaining minimal stock and ongoing restocking. The representatives of the examined bakeries noted that some raw materials are restocked daily, while for others, it is enough to ensure continued production for a week or two weeks. Losses due to materials breaking (spillage of flour and other raw materials) were assessed at 1–2% of raw materials per annum. Using thermally insulated containers to transport pastry products to shops reduces transport losses.
RETAIL LEVEL. Good communication between BCI companies and retailers plays a significant role in preventing the waste of finished products, according to the interview participants. Efforts should be made to introduce a more rational policy of returns and create a system of demand planning and managing returns of finished goods. The solution adopted by the bakeries surveyed is gaining complete (for micro-businesses) or partial independence from retailers by creating a network of their own patron shops.

3.4. Risk Assessment of Food Losses and Waste in Baking and Confectionery Industry Enterprises

A detailed summary of the identified types of losses and places of occurrence in the operational activity of BCI businesses, as well as an evaluation of the significance level and the probability of the risk of such losses are presented in Table 6. It is worth noting that unpredictable and moderately significant losses (running production processes) occurred in only one case, meaning that it was possible to reduce the risk of such losses.

4. Discussion

The measurements of mass balance in BCI businesses showed a food loss level of around 10% (9.7–14.4%) of the volume of production. This is five times more in comparison to the estimates made on the basis of the survey (Computer-Assisted Web Interview method—CAWI) for the BCI in Poland [28]. The second important difference is the department with the highest losses—which was the production department in the survey and the transport department in the presented one, where all losses were retail returns. These discrepancies surely stem from the size of the examined entities. Large and medium-sized businesses conducted mass balance monitoring, while micro and small businesses dominated the survey study (together they amounted to 79% of the sample). This is also a confirmation that in-depth reviews conducted with the managers of large and medium-sized businesses and with the experts from industry allowed the identification of possibly all potential causes of food losses in the BCI.
According to the FAO [21], food losses occur in the food processing sector due to indirect drivers, which are more systemic and refer to the economic, cultural and political environment of the food system, and direct causes associated with the actions (or a lack thereof) of individual companies, e.g., technical malfunctions, lack of proper process management or excessive trimming to attain a certain aesthetic. In the case of highly developed countries, such as Poland, and in relation to the specific nature of the analysed sector, food losses are predominantly the effect of direct drivers.
Following the Ishikawa concept, a total of 31 one-tier causes and 94 two-tier causes have been identified in our study: Manpower—respectively 3 and 12, Management—6 and 19, Machines—7 and 22, Methods—5 and 12, Materials—6 and 19, and Environment—4 and 10.
Excessive supply, the sector’s structure, legislation and the retailers’ requirements have been identified as one-tier causes in the Environment category. Nearly 12,000 businesses operate in the sector, but only around 400 employ more than 10 employees [62]. A strong rivalry was observed, especially between Short Messaging Service (SMS) enterprises, where fragmentation means a low entry barrier. The threat comes from the growing number of catering establishments making their own craft bakery products, and bakeries (including network bakeries) baking original Armenian or Georgian bread. The studies proved the existence of “dead letters” and regulations unfavourable to producers, such as the accounting act. The emergence of losses due to market surplus, improper ordering and erroneous demand forecasts have been underscored by the FAO [8], Lewis et al. [63] and Pawlak and Krysztofiak [64]. This leads to accumulation of stock that cannot be sold before the best-before date and natural deterioration of quality [65,66]. Stocks are necessary to satisfy the high requirements of retail in the face of uncertain demand, further raising the risk of losses [63,67]. This is why bakeries do not keep large stocks of raw materials, especially as today’s distribution solutions make it possible to restock with adequate frequency. Other potential reasons include the rotation of individual types of goods in retail establishments, the size of wholesale packaging [66,68,69], eating habits (freshness being the most coveted preference) and buying behaviours [53,55,64,70,71,72,73,74,75,76,77,78]. Losses may result from contracts binding the processing entity and the retailer, which include clauses giving the right to return unsold goods to the supplier [65], which has confirmed by our studies. The reasons for precluding the products from sale may be the retailers’ standards with regard to aesthetic requirements and packaging defects. In today’s FSCs, retail is the most concentrated link, allowing retailers to pursue top-down policies and dictate how the market is played, shifting risks and costs upwards in the supply chain [79,80].
Within the Manpower category, the reasons for losses are connected to low awareness, failure to observe procedures and instructions and a lack of commitment. For example, in baking technology, losses may come from inadequate production processes (e.g., holes inside products), lack of supervision and improper process regulation, lack of knowledge of baking instruction or failure to conduct the bread cooling process correctly and missing records from the baking process. In the case of products with delayed baking time, losses may result from erroneous labels (e.g., containing no baking instruction) or failure to observe the First In, First Out (FIFO) rule. Delayed baking technology allows companies to make products for later use, thus limiting losses. On the other hand, retail networks order such products more and more often, because they allow them to satisfy the needs of consumers, who wish to be able to buy fresh-baked products at any time of day. The waste of finished products attributed to communication between producers and retailers may result from poor management, natural causes (such as climatic condition) and market trends [26,67,81]. Our studies confirm that obtaining goods of adequate quality depends, among other things, on employees’ personal responsibility and their adherence to production and hygiene standards, e.g., with regard to occupational hygiene and cleaning and disinfection throughout the entire production process. Failure to observe these requirements may lead to the production of goods that fail to satisfy requirements and have to be removed from the supply chain [82].
Insufficient numbers of internal controls, poor time management, insufficient supervision over the production process, poor work organisation, poor internal communication and low management commitment are cause of losses identified in the Management category. Work organisation requires situational plans, schematics and schedules [54], because there is an interdependence between the quality of production, production management and factors such as the complexity of organisation and production processes and the range of products. The complex process of managing food quality has been indicated by van der Spiegel et al. [83] and Garske et al. [84]. At the same time, the awareness of the added value contributed by controls, audits and inspections is low. The producers must decide for themselves which quality management activities are most adequate and how they should be implemented in order to reduce losses, taking into account their size, the applicable markets, the enterprise’s nature and the work and production organisation method. Mena et al. [67] and Ribeiro et al. [26] noted that the lack of flexible approaches to preventing and limiting losses is the result of ineffective management, lack of strategy and lack of perspective beyond the profit.
The Machines category contained the highest number of one-tier causes (7): no supervision over the machinery, using obsolete machinery and devices, improper infrastructure, breakdowns, unqualified operators and bad technical and hygienic condition of minor equipment. Differences between the mass of dough promptly after mixing and putting into the oven are seen during the processes of fermentation, forming and rising of the portioned product. Losses of such kind result, among other things, from untight portioning machines, and low accuracy of operation of the forming machinery and devices, dough rising chambers and slicing equipment, as confirmed by Joardder & Masud [70]. Negligence with regard to the technical condition of machinery and devices, including transport equipment (inspections of chiller units, technical controls) [65,68] may lead to defects and losses of raw materials, semi-finished products or finished products.
The improper organisation of production, failure to observe parameters, rules and procedures, breaking the cooling chain, errors in records and errors in production are causes identified in the Methods category. The lack of activities optimising production, such as determining a specific sequence for the baking of individual products, adaptation to the length of consumption periods [54], improperly designed technological layouts and organisation of routes, technological or logistics deficiencies and a lack of awareness of the need to develop, implement and verify procedures [65,84] are causes that increase the volume of losses. Even if product defects have no impact on food safety or nutritional value, such products are rejected. Recalling some products from the market is justified if they do not satisfy specific quality and safety standards [26,63,65]. Breaking the cooling chain due to defects of transportation means, chillers, negligence with regard to the control of storage conditions or inefficient supervision systems have also been identified [63,85]. The importance of causes of a biological and environmental nature (respiration, water stress, temperature, humidity and atmospheric composition) was showed by Williams and Wikström [86]. The transfer of information and education might help improve how consumers see food from the perspective of quality and safety, as well as help reduce wastage [87].
In the Materials category, six groups of causes of losses were identified: a lack of qualified suppliers of raw materials and packaging, no delivery control, using packaging outside of its intended purpose, low quality of packaging, unaccepted specifications or improper acceptance and a lack of protection against pests. Purchasing packaging from suppliers who do not satisfy legal regulations (no declarations of conformity, missing packaging purpose specifications and no results from studies of specific and global migration) may contribute to the wastage of finished goods. Low packaging quality may lead to damaging products during transport and storage, rendering them unsuitable for sale [65,70], similarly for inconsistencies in labelling and specification [63,84]. Failure to secure warehouses from pests, no prophylactic DDD (disinfection, disinfestation and deratisation) actions or periodic gassing of flour silos and the management’s lack of awareness as to the necessity of using the services of professional pest control companies translate into losses, as also noted by Bilska et al. [82].
Limiting food losses in the processing stage poses a challenge from the perspective of social and economic policy, food safety and achieving sustainable development. Production companies are aware of this challenge, as the participants in our survey pointed to specific solutions. Having these in mind, along with the evaluation of the significance level and probability of occurrence of the risk of losses in BCI businesses, a toolkit was presented for individual departments of baking and confectionery businesses, which are worth implementing in order to prevent and limit food losses (Figure 2).
A horizontal toolbox could also be identified, including specialised training for employees and activities in the following areas: 1—technical status and production technology: introducing/maintaining building safety and control systems, maintaining high production hygiene standards, ensuring correct parameters in storage rooms, business modernisation, using frozen bakery product technology; 2—organisation and planning: market monitoring and planning of long-term production, outsourcing of specialised services, visual monitoring; 3—logistics and sales: creating key account manager positions, systems for automatic identification of products in logistics; 4—cooperation with retail: developing a model based on shelf management by the supplier (the supplier monitors the shelf in real time), marketing focused on maintaining clients’ loyalty towards the producer’s brand and the retailer (which reduces production fluctuations in BCI and retail sales).
Solving the problem of bread (and food in general) losses is of great importance from the environmental sustainability perspective. In a closed-loop economy, opportunities are being sought to fortify bread with by-products from other sectors of the food industry. The addition of by-products from fruit processing (e.g., peels and pulp from apples, mangoes, dates and oranges) and vegetables (e.g., peels and pomace from pumpkin, carrots and tomatoes) or from brewing (brewer’s spent grain) [88] and winery (grape pomace and seeds) [88,89] can improve the nutritional value and health-promoting properties of bakery products [88,90]. It is therefore necessary to develop the optimal addition of these functional ingredients in recipes or to increase consumer awareness and gain acceptance of the altered tastes [91]. On the other hand, ways are being sought to utilise wasted bread that can no longer be used for human consumption or as animal feed. Anaerobic digestion and incineration are commonly employed methods for the valorisation of bread waste, generating limited amounts of green energy, but with little other environmental or economic benefit. The presence of clean and high-quality fermentable sugars, proteins and other nutrients in bread make it an ideal substrate for generating chemicals, fuels, bioplastics, pharmaceuticals and other renewable products through microbial fermentations [92].

5. Conclusions

The presented paper belongs to a group of new studies and broadens knowledge about food losses in the operation of Polish baking and confectionery businesses. The result of the quantitative data was the mass balance monitoring carried out, which showed the scale of losses in large and medium-sized BCI companies at the level of 10% of the mass of production volume, with the highest share of bread returns coming from retail outlets. In order to successfully limit the risk of losses, it is necessary to know what causes them. The nature of the analysed sector, according to the result of qualitative data from industry experts, shows that food losses are, to a high extent, an effect of direct causes. The presented study identified a total of 12 plus 94 causes of losses (one-tier ones and two-tier ones, respectively) within six main categories, according to the Ishikawa diagram. The identified causes mostly depend on people and may be averted by using preventative actions and by developing procedures and following them.
The analysis showed that the participating companies are aware of the causes of losses and that there is a need to run complex actions to reduce losses. Based on the assessment of the level of significance and the probability of occurrence of the risk of losses in BCI businesses, a toolkit for individual departments of bakery and confectionery businesses (raw materials magazine, production section, final product magazine and final product transport) was presented, which would be worth implementing in order to prevent and reduce food losses. Additionally, a horizontal toolbox was identified, including specialised training for employees and activities in areas such as technical status and production technology, organisation and planning, logistics and sales and cooperation with retail. Many of the solutions proposed in both toolkits can bring economic benefits without involving additional high costs.
The challenge, however, is how to act on environmental causes, including demand-side determinants, due to a lack of controllability and a long-term tendency of declining bread consumption in Poland. Management possibilities are harder in this area, especially in relation to the force wielded by retail, which holds all the cards, throughout the food supply chain.
Implementing a policy of reducing food losses will allow more efficient management of production resources accumulated in enterprises, improve the level of food availability (especially for those with lower incomes) and reduce the negative impact on the environment (e.g., in terms of pollution emissions and water consumption).
The presented research results should prove useful when developing programmes and recommendations for combating food losses in the bakery and confectionery industry, and in managing them (both at the level of the sector and different classes of enterprises), necessitated by environmental, economic and socio-ethical issues. Food loss prevention concepts, for example, should focus on avoiding returns, the transfer of best practices, information and education of lower-level staff, managers and customers and strengthening donations to social services. This study has highlighted that this is a multi-faceted problem, requiring more and consistent attention, research, action and awareness, in which producers from bigger economic classes of businesses in the sector should be involved.

Strengths and Limitations

The main limitations of quantitative examinations in food processing are the difficulties in finding businesses willing to measure their losses, which can be an additional burden and surely disrupts their operations. Additionally, business mistakenly believe that by providing data about losses, they are disclosing business secrets. The difficulties in obtaining data are methodological, technical, organisational and legal. This is why efforts should be made at the level of industrial or governmental organisations to foster a climate for enterprises to engage in food loss studies. In the future, studies on food losses in the BCI should include the issue of cooperation with retailers in order to look for opportunities to change their “return policies” and focus on monitoring progress in reducing losses.

Author Contributions

Conceptualization: E.G.-G., K.R., M.G. and J.K.-C.; methodology: E.G.-G., K.R., M.G., S.Ł. and K.S.; formal analysis: E.G.-G., M.G. and K.R.; investigation: E.G.-G., K.R. and M.G.; writing—original draft preparation: E.G.-G., K.R. and M.G.; writing—review and editing: E.G.-G., K.R., M.G. and J.K.-C.; visualization: E.G.-G., M.G. and K.R.; supervision, E.G.-G., K.R. and M.G.; funding acquisition, E.G.-G., M.G., K.S. and S.Ł. All authors have read and agreed to the published version of the manuscript.

Funding

This publication has been developed under a contract with the National Centre for Research and Development No. Gospostrateg1/385753/1/NCBR/2018 for carrying out and funding a project implemented as part of the “The social and economic development of Poland in the conditions of globalizing markets—GOSPOSTRATEG”, in a programme called “Developing a system for monitoring wasted food and an effective program to rationalize losses and reduce food wastage” (acronym PROM).

Institutional Review Board Statement

Not applicable.

Informed Consent Statement

Not applicable.

Data Availability Statement

Not applicable.

Acknowledgments

Not applicable.

Conflicts of Interest

The authors declare no conflict of interest.

References

  1. Gustavsson, J.; Cederberg, C.; Sonesson, U. Global Food Losses and Food Waste: Extent, Causes and Prevention;Study Conducted for the International Congress Save Food! At Interpack; Food and Agriculture Organization of the United Nations: Rome, Italy, 2011; ISBN 978-92-5-107205-9. [Google Scholar]
  2. Bio Intelligence Service Preparatory Study on Food Waste across EU 27. In Technical Report-2010-054. European Commission (DG ENV-Directorate C); Publications Office: Brussels, Belgium, 2011.
  3. Xue, L.; Liu, G.; Parfitt, J.; Liu, X.; Van Herpen, E.; Stenmarck, Å.; O’Connor, C.; Östergren, K.; Cheng, S. Missing Food, Missing Data? A Critical Review of Global Food Losses and Food Waste Data. Environ. Sci. Technol. 2017, 51, 6618–6633. [Google Scholar] [CrossRef] [PubMed]
  4. United Nations. Peace, Dignity and Equality on a Healthy Planet. Available online: https://www.un.org/en/ (accessed on 25 November 2020).
  5. Dora, M.; Wesana, J.; Gellynck, X.; Seth, N.; Dey, B.; De Steur, H. Importance of Sustainable Operations in Food Loss: Evidence from the Belgian Food Processing Industry. Ann. Oper. Res. 2020, 290, 47–72. [Google Scholar] [CrossRef] [Green Version]
  6. Fan, S. Reducing Food Loss Is Key to End Hunger and Undernutrition by 2025; IFPRI International Food Policy Research Institute: Washington, DC, USA, 2017. [Google Scholar]
  7. The Economist Intelligence Unit. Global Food Security Index 2014: An Annual Measure of the State of Global Food Security; Special Report: Food Loss and Its Intersection with Food Security; The Economist Intelligence Unit: London, UK, 2014. [Google Scholar]
  8. FAO. Food Wastage Footprint: Impacts on Natural Resources: Summary Report; FAO: Rome, Italy, 2013. [Google Scholar]
  9. Kummu, M.; de Moel, H.; Porkka, M.; Siebert, S.; Varis, O.; Ward, P.J. Lost Food, Wasted Resources: Global Food Supply Chain Losses and Their Impacts on Freshwater, Cropland, and Fertiliser Use. Sci. Total Environ. 2012, 438, 477–489. [Google Scholar] [CrossRef]
  10. Muth, M.K.; Birney, C.; Cuéllar, A.; Finn, S.M.; Freeman, M.; Galloway, J.N.; Gee, I.; Gephart, J.; Jones, K.; Low, L.; et al. A Systems Approach to Assessing Environmental and Economic Effects of Food Loss and Waste Interventions in the United States. Sci. Total Environ. 2019, 685, 1240–1254. [Google Scholar] [CrossRef]
  11. Katajajuuri, J.M.; Silvennoinen, K.; Hartikainen, H.; Jalkanen, L.; Koivupuro, H.K.; Reinikainen, A. Food waste in the food chain and related climate impacts. In Proceedings of the 8th International Conference on Life Cycle Assessment in the Agri-Food Sector (LCA Food 2012), Saint-Malo, France, 2–4 October 2012; Corson, M.S., van der Werf, H.M.G., Eds.; INRA: Rennes, France, 2012. [Google Scholar]
  12. Shafiee-Jood, M.; Cai, X. Reducing Food Loss and Waste to Enhance Food Security and Environmental Sustainability. Environ. Sci. Technol. 2016, 50, 8432–8443. [Google Scholar] [CrossRef] [PubMed]
  13. Pham, T.P.T.; Kaushik, R.; Parshetti, G.K.; Mahmood, R.; Balasubramanian, R. Food Waste-to-Energy Conversion Technologies: Current Status and Future Directions. Waste Manag. 2015, 38, 399–408. [Google Scholar] [CrossRef]
  14. Rejman, K.; Kaczorowska, J.; Halicka, E.; Laskowski, W. Do Europeans Consider Sustainability When Making Food Choices? A Survey of Polish City-Dwellers. Public Health Nutr. 2019, 22, 1330–1339. [Google Scholar] [CrossRef] [Green Version]
  15. Chauhan, C.; Dhir, A.; Akram, M.U.; Salo, J. Food Loss and Waste in Food Supply Chains. A Systematic Literature Review and Framework Development Approach. J. Clean. Prod. 2021, 295, 126438. [Google Scholar] [CrossRef]
  16. Aragie, E.; Balié, J.; MoralesOpazo, C. Does Reducing Food Losses and Wastes in Sub-Saharan Africa Make Economic Sense? Waste Manag. Res. J. Sustain. Circ. Econ. 2018, 36, 483–494. [Google Scholar] [CrossRef]
  17. FoodDrink Europe. Every Crumb Counts. Joint Food Waste Declaration: Brussels, Belgium. 2013. Available online: https://everycrumbcounts.eu/ (accessed on 23 March 2021).
  18. Ishangulyyev, R.; Kim, S.; Lee, S.H. Understanding Food Loss and Waste—Why Are We Losing and Wasting Food? Foods 2019, 8, 297. [Google Scholar] [CrossRef] [Green Version]
  19. Łaba, S.; Łaba, R.; Szczepański, K.; Bilska, B.; Tomaszewska, M.; Tul-Krzyszczuk, A.; Kosicka-Gębska, M.; Kołożyn-Krajewska, D. Próba oszacowania strat i marnotrawstwa żywności w Polsce Attempt to estimate food losses and wastage. Food Ind. 2020, 74, 10–18. [Google Scholar] [CrossRef]
  20. HLPE. Food Losses and Waste in the Context of Sustainable Food Systems. A Report by the High Level Panel of Experts on Food Security and Nutrition of the Committee on World Food Security; HLPE: Rome, Italy, 2014; p. 117. [Google Scholar]
  21. FAO. The State of Food and Agriculture 2019. Moving Forward on Food Loss and Waste Reduction; FAO: Rome, Italy, 2019; ISBN 978-92-5-131789-1. [Google Scholar]
  22. FUSIONS. Reducing Food Waste through Social Innovation; IVL Swedish Environmental Research Institute: Stockholm, Sweden, 2016; ISBN 978-91-88319-01-2. [Google Scholar]
  23. Fabi, C.; English, A. Methodological Proposal for Monitoring SDG 12.3. The Global Food Loss Index Design, Data Collection Methods and Challenges; FAO: Rome, Italy, 2018. [Google Scholar]
  24. FAO. Percentage of Food Loss by Region. Available online: http://www.fao.org/sustainable-development-goals/indicators/1231/en/ (accessed on 29 April 2021).
  25. United Nations Environment Programme. Food Waste Index Report 2021; UNEP: Nairobi, Kenya, 2021. [Google Scholar]
  26. Ribeiro, A.P.; Rok, J.; Harmsen, R.; Rosales Carreón, J.; Worrell, E. Food Waste in an Alternative Food Network—A Case-Study. Resour. Conserv. Recycl. 2019, 149, 210–219. [Google Scholar] [CrossRef]
  27. Sheahan, M.; Barrett, C.B. Review: Food Loss and Waste in Sub-Saharan Africa. Food Policy 2017, 70, 1–12. [Google Scholar] [CrossRef]
  28. Goryńska-Goldmann, E.; Gazdecki, M.; Rejman, K.; Kobus-Cisowska, J.; Łaba, S.; Łaba, R. How to Prevent Bread Losses in the Baking and Confectionery Industry?—Measurement, Causes, Management and Prevention. Agriculture 2021, 11, 19. [Google Scholar] [CrossRef]
  29. Jeswani, H.K.; Figueroa-Torres, G.; Azapagic, A. The Extent of Food Waste Generation in the UK and Its Environmental Impacts. Sustain. Prod. Consum. 2021, 26, 532–547. [Google Scholar] [CrossRef]
  30. Mogensen, L.; Hermansen, J.; Knudsen, M.T. Madspild i fødevareproduktionen –fra primærproduktion til detailled; Aarhus Universitet: Aaarhus, Denmark, 2011. [Google Scholar]
  31. Bräutigam, K.-R.; Jörissen, J.; Priefer, C. The Extent of Food Waste Generation across EU-27: Different Calculation Methods and the Reliability of Their Results. Waste Manag. Res. J. Int. Solid Wastes Public Clean. Assoc. 2014, 32, 683–694. [Google Scholar] [CrossRef] [PubMed]
  32. WRAP. Food Surplus and Waste in the UK—Key Facts. Available online: https://wrap.org.uk/resources/report/food-surplus-and-waste-uk-key-facts (accessed on 29 April 2021).
  33. Gooch, M.; Felfel, A.; Marenick, N. Food Waste in Canada; George Morris Centre: Guelph, Canada, 2010. [Google Scholar]
  34. Katajajuuri, J.-M.; Silvennoinen, K.; Hartikainen, H.; Heikkilä, L.; Reinikainen, A. Food Waste in the Finnish Food Chain. J. Clean. Prod. 2014, 73, 322–329. [Google Scholar] [CrossRef]
  35. Segrè, A.; Falasconi, L. Il Libro Nero Dello Spreco in Italia: Il Cibo; Edizioni Ambiente: Milano, Italy, 2011; ISBN 978-88-6627-000-3. [Google Scholar]
  36. Polarbröd. Polarbröds Hållbarhetsredovisning 2016. Available online: https://sverigesmiljomal.se/contentassets/700d6251720644afa32622b419f0e4bd/polarbrod-hallbarhetsredovisning.pdf (accessed on 23 March 2021).
  37. Brancolia, P.; Lundina, L.M.; Boltona, K. Eriksson Mattias Bread Loss Rates at the Supplier-Retailer Interface—Analysis of Risk Factors to Support Waste Prevention Measures. Resour. Conserv. Recycl. 2019, 147, 128–136. [Google Scholar] [CrossRef]
  38. Beretta, C.; Stoessel, F.; Baier, U.; Hellweg, S. Quantifying Food Losses and the Potential for Reduction in Switzerland. Waste Manag. 2013, 33, 764–773. [Google Scholar] [CrossRef] [Green Version]
  39. Berkhout, P.; Silvis, H.J.; Terluin, I.J. Landbouw-Economisch Bericht 2014; LEI-Rapport 2014-013; LEI WUR: De Haag, The Netherlands, 2014. [Google Scholar]
  40. Stensgård, A.E.; Hanssen, O.J. Food Waste in Norway 2010–2015: Final Report from the ForMat Project; OR.17.16; NORSUS: Fredrikstad, Norway, 2016; ISBN 978-82-7520-750-8. [Google Scholar]
  41. Khader, B.F.Y.; Yigezu, Y.A.; Duwayri, M.A.; Niane, A.A.; Shideed, K. Where in the Value Chain Are We Losing the Most Food? The Case of Wheat in Jordan. Food Secur. 2019, 11, 1009–1027. [Google Scholar] [CrossRef] [Green Version]
  42. Oelofse, S.H.; Nahman, A. Estimating the Magnitude of Food Waste Generated in South Africa. Waste Manag. Res. 2013, 31, 80–86. [Google Scholar] [CrossRef] [PubMed]
  43. Liu, G. Food Losses and Food Waste in China: A First Estimate; OECD Food, Agriculture and Fisheries Papers, No. 66; OECD Publishing: Paris, France, 2014. [Google Scholar] [CrossRef]
  44. Liu, J.; Lundqvist, J.; Weinberg, J.; Gustafsson, J. Food Losses and Waste in China and Their Implication for Water and Land. Environ. Sci. Technol. 2013, 47, 10137–10144. [Google Scholar] [CrossRef] [PubMed]
  45. ReFED. ReFED Insights Engine. Available online: https://insights-engine.refed.com/food-waste-monitor?break_by=food_type&indicator=tons-surplus&view=detail&year=2019 (accessed on 29 April 2021).
  46. Statista Research Department. Distribution of Consumed and Wasted Bread in the U.S. 2016. Available online: https://0-www-statista-com.brum.beds.ac.uk/statistics/630324/distribution-of-bread-consumed-and-wasted-in-the-united-states/ (accessed on 29 April 2021).
  47. Ali, I.; Nagalingam, S.; Gurd, B. Building Resilience in SMEs of Perishable Product Supply Chains: Enablers, Barriers and Risks. Prod. Plan. Control 2017, 28, 1236–1250. [Google Scholar] [CrossRef]
  48. Dora, M.; Kumar, M.; Gellynck, X. Determinants and Barriers to Lean Implementation in Food-Processing SMEs—A Multiple Case Analysis. Prod. Plan. Control 2016, 27, 1–23. [Google Scholar] [CrossRef]
  49. Redlingshofer, B.; Soyeux, A. Food Losses and Wastage as a Sustainability Indicator of Food and Farming Systems. In Proceedings of the 10th European IFSA Symposium—Producing and Reproducing Farming Systems: New Modes of Organization for Sustainable Food Systems of Tomorrow, Aarhus, Denmark, 1–4 July 2012; p. 15. [Google Scholar]
  50. Brender, J. Handbook of Evaluation Methods for Health Informatics; Academic Press: Cambridge, MA, USA, 2006; ISBN 978-0-12-370464-1. [Google Scholar]
  51. Yin, R.K. Qualitative Research from Start to Finish, 2nd ed.; The Guilford Press: New York, NY, USA; London, UK, 2015; ISBN 978-1-4625-1797-8. [Google Scholar]
  52. European Commission (EC). Commission Delegated Decision (EU) 2019/1597 of 3 May 2019 supplementing Directive 2008/98/EC of the European Parliament and of the Council as regards a common methodology and minimum quality requirements for the uniform measurement of levels of food waste. Off. J. Eur. Union 2019, 62, 77–85. [Google Scholar]
  53. Goryńska-Goldmann, E.; Sznajder, M. Wybrane Zachowania i Zwyczaje Konsumentów Na Rynku Pieczywa w Polsce Selected Consumer Behaviour and Habits on the Bakery Market in Poland, 1st ed.; Poznan Univeersity of Life Science: Poznan, Poland, 2012; ISBN 978-83-7160-613-7. [Google Scholar]
  54. Goryńska-Goldmann, E.; Ratajczak, P. Organizacja Produkcji Piekarskiej a Czas Zaopatrzenia Konsumentów w Pieczywo Organisation of Bakery Products Production vs. Time of Consumers Supply with Bakery Products; Handel Wewnętrzny IBRKK: Warsaw, Poland, 2013; pp. 302–310. [Google Scholar]
  55. Borowska, A.; Rejman, K. Spożycie Pieczywa i Preferencje Konsumentów Wobec Innowacyjności Produktowej Branży Piekarskiej (Bread Consumption and Consumer Preferences Considering Product Innovation of Bakery Sector). Studia Mater. Pol. Stowarzyszenia Zarządzania Wiedzą 2011, 52, 309–322. [Google Scholar]
  56. Ismyrlis, V. The Contribution of Quality Tools and Integration of Quality Management Systems to the Organization. TQM J. 2017, 29, 677–689. [Google Scholar] [CrossRef]
  57. Zielińska-Chmielewska, A.; Mruk-Tomczak, D.; Wielicka-Regulska, A. Qualitative Research on Solving Difficulties in Maintaining Continuity of Food Supply Chain on the Meat Market during the COVID-19 Pandemic. Energies 2021, 14, 5634. [Google Scholar] [CrossRef]
  58. Blokdyk, G. Ishikawa Diagram A Complete Guide—2019; 5STARCooks: Plano, TX, USA, 2019. [Google Scholar]
  59. Ishikawa, K. Introduction to Quality Control; Chapman and Hall: London, UK, 1990; ISBN 13: 978-94-011-7690-3. [Google Scholar]
  60. Coccia, M. The Fishbone Diagram to Identify, Systematize and Analyze the Sources of General Purpose Technologies. J. Soc. Adm. Sci. 2017, 4, 291–303. [Google Scholar] [CrossRef]
  61. Gwiazda, A. Quality Tools in a Process of Technical Project Management. J. Achiev. Mater. Manuf. Eng. 2006, 18, 439–442. [Google Scholar]
  62. Szczepańska, M. Chleb jest dla...gigantów i średniaków. Available online: https://www.pb.pl/chleb-jest-dla-gigantow-i-sredniakow-943331 (accessed on 12 May 2021).
  63. Lewis, H.; Downes, J.; Verghese, K.; Young, G. Food Waste Opportunities within the Food Wholesale and Retail Sectors; Prepared for the NSW Environment Protection Authority by the Institute for Sustainable Futures at the University of Technology Sydney; Institute for Sustainable Futures, University of Technology Sydney: Sydney, Australia, 2017. [Google Scholar]
  64. Pawlak, K.; Krysztofiak, J. Food losses and food waste throughout the supply chain: Estimates across the regions. In Agrarian Perspectives XXVII. Food Safety—Food Security, Proceedings of the 27th International Scientific Conference, Prague, Czech Republic, 19–20 September 2018; Czech University of Life Sciences Prague, Faculty of Economics and Management: Prague, Czech Republic, 2018; pp. 229–235. [Google Scholar]
  65. Buchner, B.; Fischler, C.; Gustafson, E.; Reilly, J.; Riccardi, G.; Ricordi, C.; Verones, U. Food Waste: Caudses, Impact and Proposals; Barilla Center for Food and Nutrition: Parma, Italy, 2012; p. 71. [Google Scholar]
  66. Eriksson, M.; Strid, I.; Hansson, P.-A. Waste of Organic and Conventional Meat and Dairy Products—A Case Study from Swedish Retail. Resour. Conserv. Recycl. 2014, 83, 44–52. [Google Scholar] [CrossRef]
  67. Mena, C.; Adenso-Diaz, B.; Yurt, O. The Causes of Food Waste in the Supplier–Retailer Interface: Evidences from the UK and Spain. Resour. Conserv. Recycl. 2011, 55, 648–658. [Google Scholar] [CrossRef]
  68. Caldeira, C.; Corrado, S.; Goodwin, L.; Sala, S. Global Food Waste. Responsible Consum. Prod. 2019, 1–12. [Google Scholar] [CrossRef]
  69. Eriksson, M. Retail Food Wastage: A Case Study Approach to Quantities and Causes. Licentiate Thesis, Swedish University of Agricultural Science, Uppsala, Sweden, 2012. [Google Scholar]
  70. Joardder, M.U.H.; Masud, M.H. Food Preservation in Developing Countries: Challenges and Solutions; Springer: Berlin/Heidelberg, Germany, 2019; ISBN 978-3-030-11529-6. [Google Scholar]
  71. Kalinowski, S. Poziom Życia Ludności Wiejskiej o Niepewnych Dochodach (Standards of Living of the Rural Population with Uncertain Incomes), 1st ed.; PWN: Warsaw, Poland, 2015; ISBN 978-83-01-18220-5. [Google Scholar]
  72. Borowski, M.; Kowalewska, M.; Kwasek, M.; Obiedzińska, A. Z Badań nad Rolnictwem Społecznie Zrównoważonym. Analiza Strat i Marnotrawstwa Żywności na Świecie i w Polsce; Instytut Ekonomiki Rolnictwa i Gospodarki Żywnościowej—Pastwowy Instytut Badawczy: Warsaw, Poland, 2016. [Google Scholar]
  73. Liu, B. Case study methodology to find the causes of food loss and develop solutions. In Sustainable Value Chains for Sustainable Food Systems; Meybeck, A., Redfern, S., Eds.; FAO: Rome, Italy, 2016. [Google Scholar]
  74. Marek-Andrzejewska, E.M.; Wielicka-Regulska, A. Targeting Youths’ Intentions to Avoid Food Waste: Segmenting for Better Policymaking. Agriculture 2021, 11, 284. [Google Scholar] [CrossRef]
  75. Wojcieszak, M. Goryńska-Goldmann, Elżbieta Support of Quality Systems for Agricultural Products and Foodstuffs from European Funds. In Proceedings of the International Scientific Days 2018: Towards Productive, Sustainable and Resilient Global Agriculture and Food Systems, Nitra, Slovakia, 16–17 May 2018; Wolters Kluwer ČR: Prague, Czech Republic, 2018. [Google Scholar]
  76. Śmiglak-Krajewska, M.; Wojciechowska-Solis, J.; Viti, D. Consumers’ Purchasing Intentions on the Legume Market as Evidence of Sustainable Behaviour. Agriculture 2020, 10, 424. [Google Scholar] [CrossRef]
  77. Wojciechowska-Solis, J.; Śmiglak-Krajewska, M.S. Consumer Education and Food Waste: An Example of the Bakery Market-the Case of Young Consumer. Eur. Res. Stud. J. 2020, XXIII, 89–96. [Google Scholar] [CrossRef]
  78. Gazdecki, M.; Goryńska-Goldmann, E.; Kiss, M.; Szakály, Z. Segmentation of Food Consumers based on Their Sustainable Attitude. Energies 2021, 14, 3179. [Google Scholar] [CrossRef]
  79. Von Braun, J. Agriculture for Sustainable Economic Development: A Global R&D Initiative to Avoid a Deep and Complex Crisis; USDA, ERS, and National Agricultural Library: Washington, DC, USA, 2009; p. 17. [Google Scholar]
  80. Feedback. Causes of Food Waste in International Supply Chain. Available online: https://feedbackglobal.org/wp-content/uploads/2017/05/Causes-of-food-waste-in-international-supply-chains_Feedback.pdf (accessed on 20 March 2021).
  81. Jablońska-Porzuczek, L.; Smoluk-Sikorska, J.; Kalinowski, S. The Conditions of Competitiveness in the Confectionary and Bakery Industry. Intercathedra 2016, 32, 78–85. [Google Scholar]
  82. Bilska, B.; Wrzosek, M.; Kołożyn-Krajewska, D.; Krajewski, K. Risk of Food Losses and Potential of Food Recovery for Social Purposes. Waste Manag. 2016, 52, 269–277. [Google Scholar] [CrossRef] [PubMed]
  83. Spiegel, M.V.D.; Luning, P.A.; Boer, W.J.D.; Ziggers, G.W.; Jongen, W.M.F. Measuring Effectiveness of Food Quality Management in the Bakery Sector. Total Qual. Manag. Bus. Excell. 2006, 17, 691–708. [Google Scholar] [CrossRef] [Green Version]
  84. Garske, B.; Heyl, K.; Ekardt, F.; Weber, L.M.; Gradzka, W. Challenges of Food Waste Governance: An Assessment of European Legislation on Food Waste and Recommendations for Improvement by Economic Instruments. Land 2020, 9, 231. [Google Scholar] [CrossRef]
  85. Capone, R.; Bilali, H.E.; Debs, P.; Bottalico, F.; Cardone, G.; Berjan, S.; Elmenofi, G.A.G.; Abouabdillah, A.; Charbel, L.; Arous, S.A.; et al. Bread and Bakery Products Waste in Selected Mediterranean Arab Countries. Am. J. Food Nutr. 2016, 4, 40–50. [Google Scholar] [CrossRef]
  86. Williams, H.; Wikström, F. Environmental Impact of Packaging and Food Losses in a Life Cycle Perspective: A Comparative Analysis of Five Food Items. J. Clean. Prod. 2011, 19, 43–48. [Google Scholar] [CrossRef]
  87. Raak, N.; Symmank, C.; Zahn, S.; Aschemann-Witzel, J. Food Losses in The German Food Industry: Insight From Expert Interviews. In Proceedings of the Material form 4th International ISEKI Food Conference, Vienna, Austria, 6–8 July 2016. [Google Scholar]
  88. Martins, Z.E.; Pinho, O.; Ferreira, I.M.P.L.V.O. Food Industry By-Products Used as Functional Ingredients of Bakery Products. Trends Food Sci. Technol. 2017, 67, 106–128. [Google Scholar] [CrossRef]
  89. Antonić, B.; Jančíková, S.; Dordević, D.; Tremlová, B. Grape Pomace Valorization: A Systematic Review and Meta-Analysis. Foods 2020, 9, 1627. [Google Scholar] [CrossRef] [PubMed]
  90. Królak, M.; Jeżewska-Zychowicz, M.; Sajdakowska, M. Impact of Consumer Eating Habits and Fiber Content on Acceptance of Plain Wheat Rolls. Cereal Foods World 2017. [Google Scholar] [CrossRef] [Green Version]
  91. Sajdakowska, M.; Gębski, J.; Żakowska-Biemans, S.; Jeżewska-Zychowicz, M. Willingness to Eat Bread with Health Benefits: Habits, Taste and Health in Bread Choice. Public Health 2019, 167, 78–87. [Google Scholar] [CrossRef] [PubMed]
  92. Narisetty, V.; Cox, R.; Willoughby, N.; Aktas, E.; Tiwari, B.; Matharu, A.S.; Salonitis, K.; Kumar, V. Recycling Bread Waste into Chemical Building Blocks Using a Circular Biorefining Approach. Sustain. Energy Fuels 2021. [Google Scholar] [CrossRef]
Figure 1. Cause-and-effect Ishikawa diagram of food losses in the baking and confectionery industry—results of own study.
Agriculture 11 00936 g001
Figure 2. Toolkit to prevent and reduce food losses in bakeries and confectioneries.
Agriculture 11 00936 g002
Table 1. Food losses in the baking industry in European countries, in descending order (based on available literature).
ReferencesCountryEstimation; Products/Industry Characteristic
Katajajuuri et al. [34]Finland6.5–8% of the volume of production, i.e., 21–25 thousand tons; bakery
products
Polarbröd, [36] Sweden6.9%—losses in bread processing
Brancoli et al. [37] Sweden5.2%—losses in bread processing
Beretta et al. [38] Switzerland5.1%—losses in bakeries (almost half of the volume could be
avoidable)
Berkhout et al. [39] Netherlands5% of the volume of production; bread products
Dora et al. [5] Belgium3.93% of the volume of production; bakery (data from 9 companies)
Goryńska-Goldmann et al. [27] Poland2.39% in 2017 and 2.63% in 2018 of the volume of production, i.e., 307
and 263 thousand tons respectively; baking and confectionery
industry
Segrè and Falasconi, [35] Italy1.5% of the volume of production, i.e., 245 thousand tons; production
of grain and starch products,
Stensgård and Hanssen, [40] Norway1.2% in 2015 and 1.00% in 2016—losses of the volume of processing
of fresh baked goods (calculated as a percentage of fresh bread)
Table 2. Significance level matrix and probability of occurrence of food losses risk in baking and confectionery industry.
ProbabilityRisk Significance Level
Insignificant;
Causes Minor Losses, Difficult to
Eliminate, Resulting from
Production Technology
Moderately
Significant; It Is
Possible to Limit the
Risk
Highly Significant;
Hard to Eliminate, Hazardous
for Consumers’ Health or
Causing Major Losses
Predictable (P)1 P2 P3 P
Unpredictable (N)1 N2 N3 N
Table 3. The food losses in total and in individual departments of bakeries that monitored mass balance, as a % of production volume.
Enterprise Name and
Size
Losses (%) in Production Volume per DepartmentTotal Losses
(%)
Processing and Preparation for
Distribution
Packed Finished Products
Warehouse/Forwarding
Transport of
Finished Products
Total products
A large0.74609.27710.023
B large1.6691.25711.42614.352
C medium009.7199.719
Bread
A large0.401010.17510.576
B large1.5290.42611.44513.401
C medium0010.41410.414
Pastry product, fresh
A large2.15205.7537.905
B large6.8637.5379.95024.353
C medium006.7926.792
Durable pastries
A large *x xxx
B large1.5173.5217.56612.645
C medium0000
Confectionery
A large *xxxx
B large1.5917.85713.46722.917
C medium0000
* Bakery A showed losses of these goods together with fresh pastries, therefore it was not possible to identify losses for Durable pastries and Confectionery (marked with x).
Table 4. Technological operations with the highest risk of food losses in baking and confectionery industry and their causes.
Processing StageNumber of IndicationsCategories of Causes of LossesNumber of Indications
Forming and baking15Human errors13
Raw material storage9Technological process errors10
Raw materials preparation9Breakdowns8
Forwarding and transport8Technological process specification6
Packaging and customizing3Quality of technical equipment4
Quality of raw materials4
Table 5. Selected comments of interview participants concerning the causes of losses.
Causes of LossesComments of Interview Participants
Human errorsIndividual operations within the technological process must be subject to self-control.
An employee may pick or issue the goods incorrectly; nobody wants goods which they did
not order.
There may be errors while preparing raw material mixes.
The human factor may contribute to raw material loss in the operations of storage, weighing,
issuing for production or dosing.
Quality of raw materialsDefective parts of deliveries are rejected upon identification of the defect during delivery of
raw materials.
The market offers unlimited access to raw materials, making it possible to select them by
quality parameters.
We always make sure that the packaging is sealed. We monitor raw material storage
conditions to make sure the ingredients are stored in their original condition.
Errors in technological
process
The key locations where losses occur are the oven and baking of bread and other products.
Losses occur during baking and products that not meet factory requirements are rejected.
The volume of production losses is up to 0.5% and they most often take place in the oven,
e.g., deformations or damage, burned or insufficiently baked products, etc.
Technical equipment
and defects
The company’s policy is to replace the equipment often—otherwise, defects occur.
Systems for monitoring the number of working hours help identify service needs.
Technical conditions and the modernising of machinery and equipment are very important.
Technological process
specification
Natural production losses are later used as animal fodder.
An efficient system of ventilation is an important element of production, as it allows the
hardening of bread products to improve theor quality.
Losses that are often identified as difficult to avoid can be limited by conducting the
technological process carefully.
Inconsistencies between
processing and retail
While preparing orders, we take into account the exact volume of sales from previous
periods. Thanks to this planning, the returns from some retail points are at zero, however,
they still happen on rare occasions.
Retailers are reluctant to have contractual stipulations on the volume of returns. It is the
bakeries that are responsible for analysing the volume of losses.
Some retailers have been introducing no-return sales, yet they expect significantly lower
purchasing prices.
Table 6. Assessment of the significance and likelihood of food loss risks and their nature in the subsequent operational activities in bakeries/confectioneries.
Stages in Operational Activities
and Categories of FL
Level of
Significance and
Probability of the
Risk of FL *
Type of FL
Acceptance of raw materials—materials2 P *raw material
Storing raw materials in warehouse (parameters)—
materials
2 Praw material
Raw materials warehouse—materials3 Praw material; including raw material left
from the batch used for producing goods
that had to be withdrawn from the market
after receiving information from retail
Preparing and mixing raw materials—materials2 Praw material
Collecting raw materials—materials2 Praw material
Production (mixing, fermentation, proofing,
punching)—environment organisation, secondary impurities, human factor
2 Pproduction,
complaints from clients/buyers
Production (mixing, fermentation, proofing,
punching)—conducting production processes
2 N *production,
complaints from clients/buyers
Production (mixing, fermentation, proofing,
punching)—machinery and devices
2 Pproduction
Dividing, shaping, panning, final proofing,
scoring/topping—environment, secondary impurities,
people
2 Pproduction,
complaints from clients/buyers
Dividing, shaping, panning, slicing, forming,
topping—conducting production processes
2 Pproduction
Dividing, shaping, panning, slicing, forming,
topping—machinery and devices
2 Pproduction
Baking2 Pproduction
Depanning, cooling—secondary impurities3 Pproduction
complaints from buyers—mildewing of
products improperly cooled down before
packing
Depanning, cooling—environment, people3 Pproduction
complaints from buyers—mildewing of
products improperly cooled down before
packaging
Slicing, bagging—environment, secondary impurities,
people
2 Pproduction
complaints from buyers—mildewing of
products improperly cooled down before
packing
Slicing, bagging—machinery and devices2 Pfinished goods at slicing
Slicing, bagging—marking, damaging finished goods3 Pfinished goods in the final goods
warehouse or in retail
Slicing, bagging—people2 Pfinished goods in the final goods
warehouse or in retail
Slicing, bagging—materials (packaging)2 Pfinished goods in the final goods
warehouse or in retail
Storing—materials2 Pproduction losses in the final goods
warehouse
Storing—over-production3 Pproduction losses in the final goods
warehouse
Forwarding—damage2 Pfinished goods in transport
Forwarding—environment, people3 Pfinished goods, unsuitability for
consumption—utilisation/disposal
* Food loss (FL), Predictable (P), Unpredictable (N).
Publisher’s Note: MDPI stays neutral with regard to jurisdictional claims in published maps and institutional affiliations.

