
Research on Loading Method of Tractor PTO Based on Dynamic Load Spectrum


Beijing Key Laboratory of Optimized Design for Modern Agricultural Equipment, College of Engineering, China Agricultural University (East Campus), Beijing 100083, China
*
Author to whom correspondence should be addressed.
Agriculture 2021, 11(10), 982; https://0-doi-org.brum.beds.ac.uk/10.3390/agriculture11100982
Submission received: 6 September 2021
/
Revised: 1 October 2021
/
Accepted: 4 October 2021
/
Published: 9 October 2021
(This article belongs to the Special Issue Agricultural Structures and Mechanization)
Abstract
:The torque load spectrum is an important basis for the strength design and durability test verification of tractor power take-off (PTO), and the performance and reliability of tractor PTO directly affect the quality and efficiency of agricultural operations. In this paper, taking the PTO torque load as the object, a PTO loading method based on the dynamic load spectrum acquired in the actual field work was proposed in this paper. Based on the Peak Over Threshold model, the extrapolation of the PTO load spectrum was realized, and the load spectrum throughout the whole life cycle was obtained. On the basis of this, the mobile tractor PTO loading test bench and Fuzzy-Proportional-Integral-Derivative (Fuzzy-PID) controller were developed to achieve the dynamic loading of the PTO load spectrum, and the dynamic characteristics were analyzed and verified by the simulation and laboratory test. The results showed that with the time domain extrapolation method, the load extreme value was expanded from (63.24, 469.50) to (60.88, 475.18), and the coverage was expanded by 1.98%. By comparing with the fitting results, statistical characteristics and rain flow counting results, the load spectrum extrapolation method was effective. In addition, the response time of simulation and laboratory test were 0.05s and 0.75s, respectively; the maximum error was 1.77% and 4.03%, respectively; and the goodness of fit was 16.78 N·m, which indicated that the PTO loading test bench, can accurately restore the dynamic loading of the tractor and the Fuzzy-PID controller had better accuracy and stability. It would provide a reference for the practical application of PTO load spectrum of the tractors.
1. Introduction
Tractor power take-off (PTO) is an important component for driving agricultural implement such as rotary tillage and harrowing [1,2], and its performance and reliability directly affect the quality and efficiency of agricultural operations [3,4]. Nowadays, the tractor PTO loading test bench is a commonly used piece of equipment for PTO performance test, sensor device calibration, and reliability test. Wang Jiankang [5] and Sumer et al. [6] built a PTO loading test-bed with alternating current (AC) dynamometer and eddy current dynamometer, respectively, which was mainly used to test the performance of tractor PTO and determine its load characteristics. Siddique et al. [7] used PTO dynamometer to analyze the fuel consumption level of tractor under different loads in order to optimize the load characteristics. Roeber et al. [8] used a PTO loading test bench dynameter of Nebraska tracker test lab to calibrate the tractor torque measurement system. In addition, some companies such as HORIBA group (Kyoto, Japan) and Powerlink Company (Bangkok, Thailand) have also developed PTO loading systems, which could realize the detection of speed and torque performance of tractors. Until recently, these loading test benches are performed in a fixed load mode, which is different from the load borne by the tractor in actual field operation, resulting in errors in the detection results [9]. Moreover, there are few studies on dynamic loading methods for tractor PTO.
The PTO load spectrum can reflect the time history of the torque load borne by tractor PTO in actual operation [9], which is an important way to explore the relationship between the operating load and the performance and reliability of tractor PTO. However, due to the limitation of time and cost, it is impossible to obtain the load time-history during its whole life cycle in the load spectrum collection process. Therefore, it is necessary to extend the load coverage by extrapolating the load spectrum. The commonly used load spectrum extrapolation methods can be divided into frequency domain extrapolation method (FDE), rain-flow domain extrapolation method (RDE) and time domain extrapolation method (TDE) [10]. The main approach of the FDE method is to use normal distribution and Weibull distribution to fit the mean value and the amplitude value of the load spectrum, and then the extrapolation can be realized based on the load joint distribution function [11]. Jixin Wang et al. achieved the extrapolation of transmission load of wheel loader based on FDE method [10]. For the RDE method, it uses nonparametric estimation to achieve data fitting based on the distribution characteristics of rain flow matrix [12,13]. However, there is a common problem with both approaches, that is, the load signal in the time domain should be converted to the frequency domain in the process of extrapolation, which will break the time sequence of the original load and bring inconvenience to the application of the load spectrum. The TDE method was proposed by Johannesson and Thomas [14] and Johannesson [15], and the extrapolation can be actualized on the basis of the extreme value distribution characteristics of the original load based on the extreme value theory [11]. This approach offers a way to retain the time-domain order and reduce the conversion error. Yang Zihan et al. [9] extrapolated the load of tractor drive shaft based on the Peak Over Threshold model. The optimal thresholds of the upper and lower limits in the time-domain load data were determined by comparing with the values of grey correlation degree corresponding to different threshold, and the extrapolation model was built to realize the extrapolation of the load spectrum of the tractor drive shaft. Yan Xianghai et al. [16] studied the compilation method of the PTO dynamic torque load spectrum in time domain under multiple working conditions and the durability test was carried out on PTO torque loading test bench by using the load spectrum. The test results showed that the actual failure time of tractor PTO was basically consistent with the theoretical, which verified the effectiveness of the load spectrum.
At present, although there are many studies on the extrapolation and compilation methods of the load spectrum, there are relatively few studies on the application in actual field load test. Therefore, in this paper, taking the tractor PTO torque load as the object, the load spectrum compilation and loading method of tractor were studied. Firstly, the extrapolating method of the torque load spectrum of tractor PTO was studied based on the Peak Over Threshold model. The threshold was selected by using the ForwardStop sequential test method, and the extrapolation of tractor PTO torque load spectrum was realized. Secondly, a movable tractor PTO loading test bench was developed. The torque control of the eddy current dynamometer was realized by using Fuzzy-Proportional-Integral-Derivative (Fuzzy-PID) controller and the dynamic response characteristics of the system were simulated and analyzed. On this basis, the load spectrum loading test was carried out. The test results showed that the tractor PTO loading test bench can realize the dynamic control of torque. It can provide reference for the compilation and practical application of PTO torque load spectrum of tractors.
2. Materials and Methods
2.1. Extrapolation Method of Tractor PTO Torque Load Spectrum
In this paper, the TDE method of the tractor PTO torque load based on Peak Over Threshold model is realized. Under such approach, the extreme value obtained from the actual operation conditions can further extrapolate the possible theoretical extreme load [17], as well as the bidirectional extrapolation of the maximum and minimum values, expand the load coverage range, and improve the effectiveness of load spectrum loading. The extrapolation process is shown in Figure 1.
The generalized pareto distribution (GPD) is the basis for the extrapolation of excess. The cumulative distribution function (CDF) of GPD is as follows:
The probability density function (PDF) of GPD is as follows:
where, means the threshold, means the excess, means shape parameter, and means scale parameter.
The GPD shape parameters and scale parameters can be calculated by the maximum likelihood estimation [18], and it is necessary to select an appropriate threshold value to establish an accurate Peak Over Threshold model [19]. In this paper, the ForwardStop rule is used to calculate the threshold value. Based on the multiple test method, the p-value of the hypothesis test of the threshold fitting results is corrected. The accuracy of the threshold selection can be improved by controlling the false discovery rate (FDR) of the fitting results [20]. The specific process is as follows:
Considering the torque load data and the candidate threshold sequence , for each candidate threshold , the excess sequence is . For each peak over sequence , the corresponding null hypothesisH0i is proposed as:
: The distribution of the excess sequence follows the GPD.
Therefore, for the candidate threshold sequence , there are null hypotheses in total: . To perform the hypothesis testing on sequentially, the corresponding sequence of p-values: are obtained.
The p-value of a single hypothesis test is calculated by using Anderson–Darling test (AD test) in this paper. The weight coefficient is introduced in the AD test, which makes it possible to pay more attention to the tail-distributed data in the calculation process and is more sensitive for the detecting data that deviates from the sample [21,22].
For the threshold , when the corresponding AD test statistic does not meet the expected threshold value, the null hypothesis is rejected. Additionally, according to the distribution properties of GPD, for , will be rejected because the hypothesis test is performed in a monotonic order of the threshold value. On this basis, the ForwardStop rule is applied. Firstly, in the monotonically increasing order, the null hypothesis with each threshold value is inspected by the AD test, and the corresponding AD test statistic can be obtained to construct the p-value sequence; then, the Equation (3) is used to correct the p-value sequentially, and the new p-value sequence is constructed at the same time; finally, the minimum that meets the expected threshold is found, and the threshold value corresponding to the sequence is the optimal threshold value.
When the threshold value is selected, the maximum likelihood estimation is used to fit the GPD of the excess. The extrapolated data can be generated randomly based on this GPD function. Then, the 1-time extrapolated load spectrum can be obtained by replacing the extreme value data of the original load.
2.2. Data Acquisition and Preprocessing of Tractor PTO Torque Load Spectrum
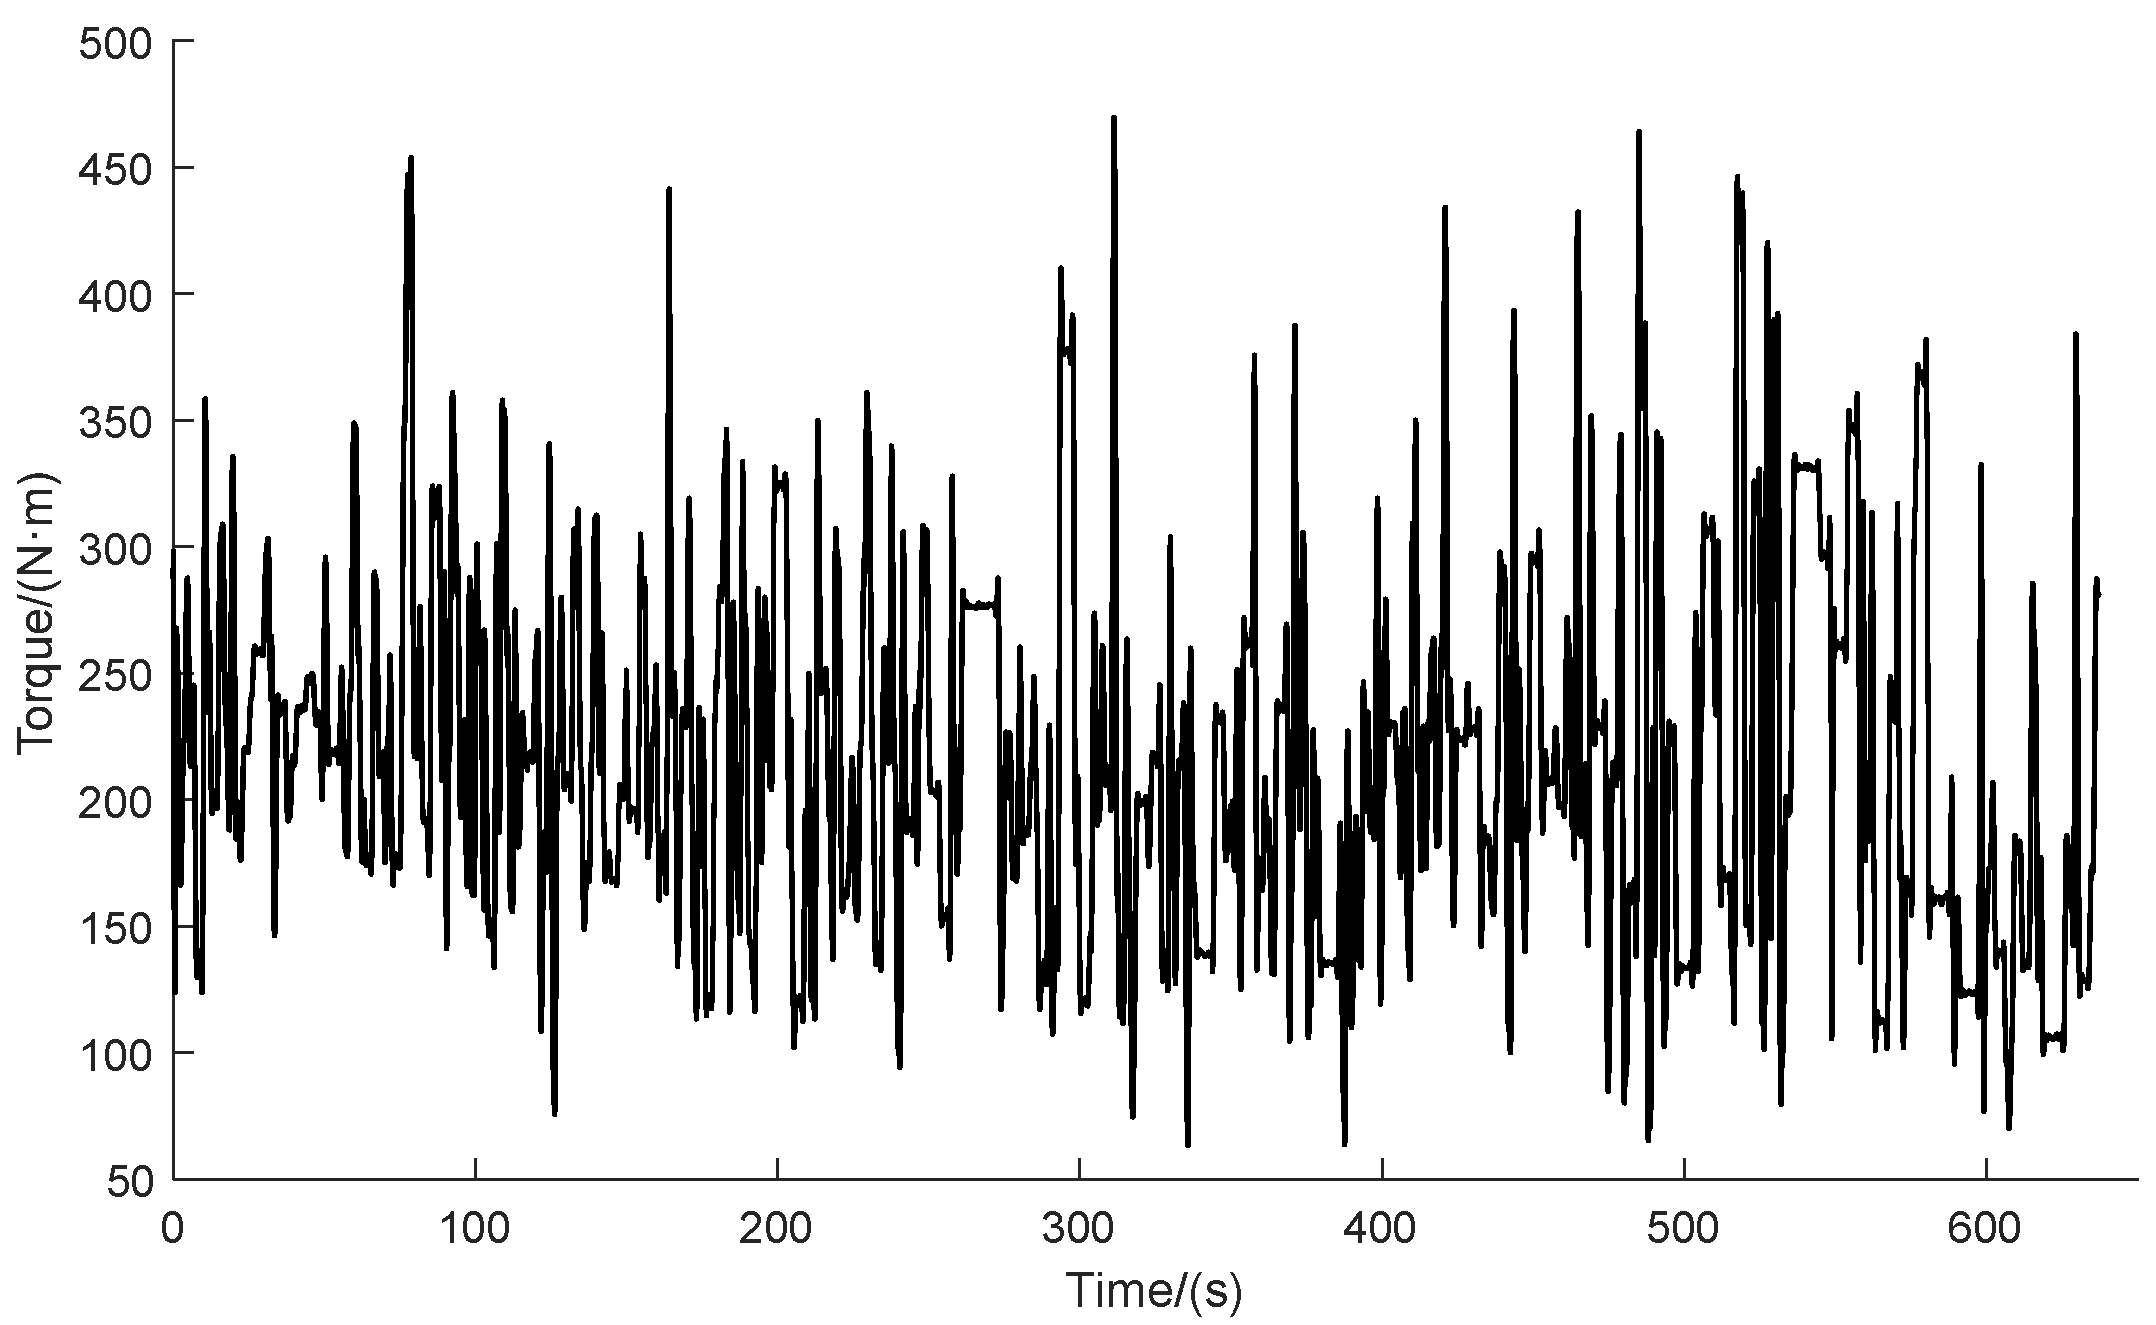
On 7 November 2018, the load spectrum collection test was carried out at Shangzhuang Experimental Station of China Agricultural University (Haidian District, Beijing, China). The detailed parameters are described in Table 1. The tractor PTO torque is measured in real time by using the torque wireless monitoring system, and the trend term and abnormal data are removed by preprocessing. The load cycle, being less than 10 % of the maximum amplitude of the load cycle, is omitted to simplify the load time history. The time history of tractor PTO torque load after preprocessing is showed in Figure 2.
2.3. Extrapolation Model Establishment of Tractor PTO Torque Load Spectrum
The ForwardStop rule is used to select the threshold value of the processed data; afterwards, the load spectrum extrapolation is realized. For the maximum value in the load sample, the candidate threshold interval is selected as (63.00, 469.00), increasing by 0.5. Similarly, for the minimum value, the candidate threshold interval is (469.00, 63.00), decreasing by 0.5. Finally, the calculated upper threshold is 419, and the number of excess data is 125; the lower threshold is 97.50, and the number of excess data is 170.
According to the threshold selection results, the GPD parameters is estimated by using maximum likelihood estimation method in Matlab. The GPD fitting result is shown in Table 2.
Therefore, the GPD functions of the PTO load sample for the maximum and minimum value are shown in Equations (4) and (5).
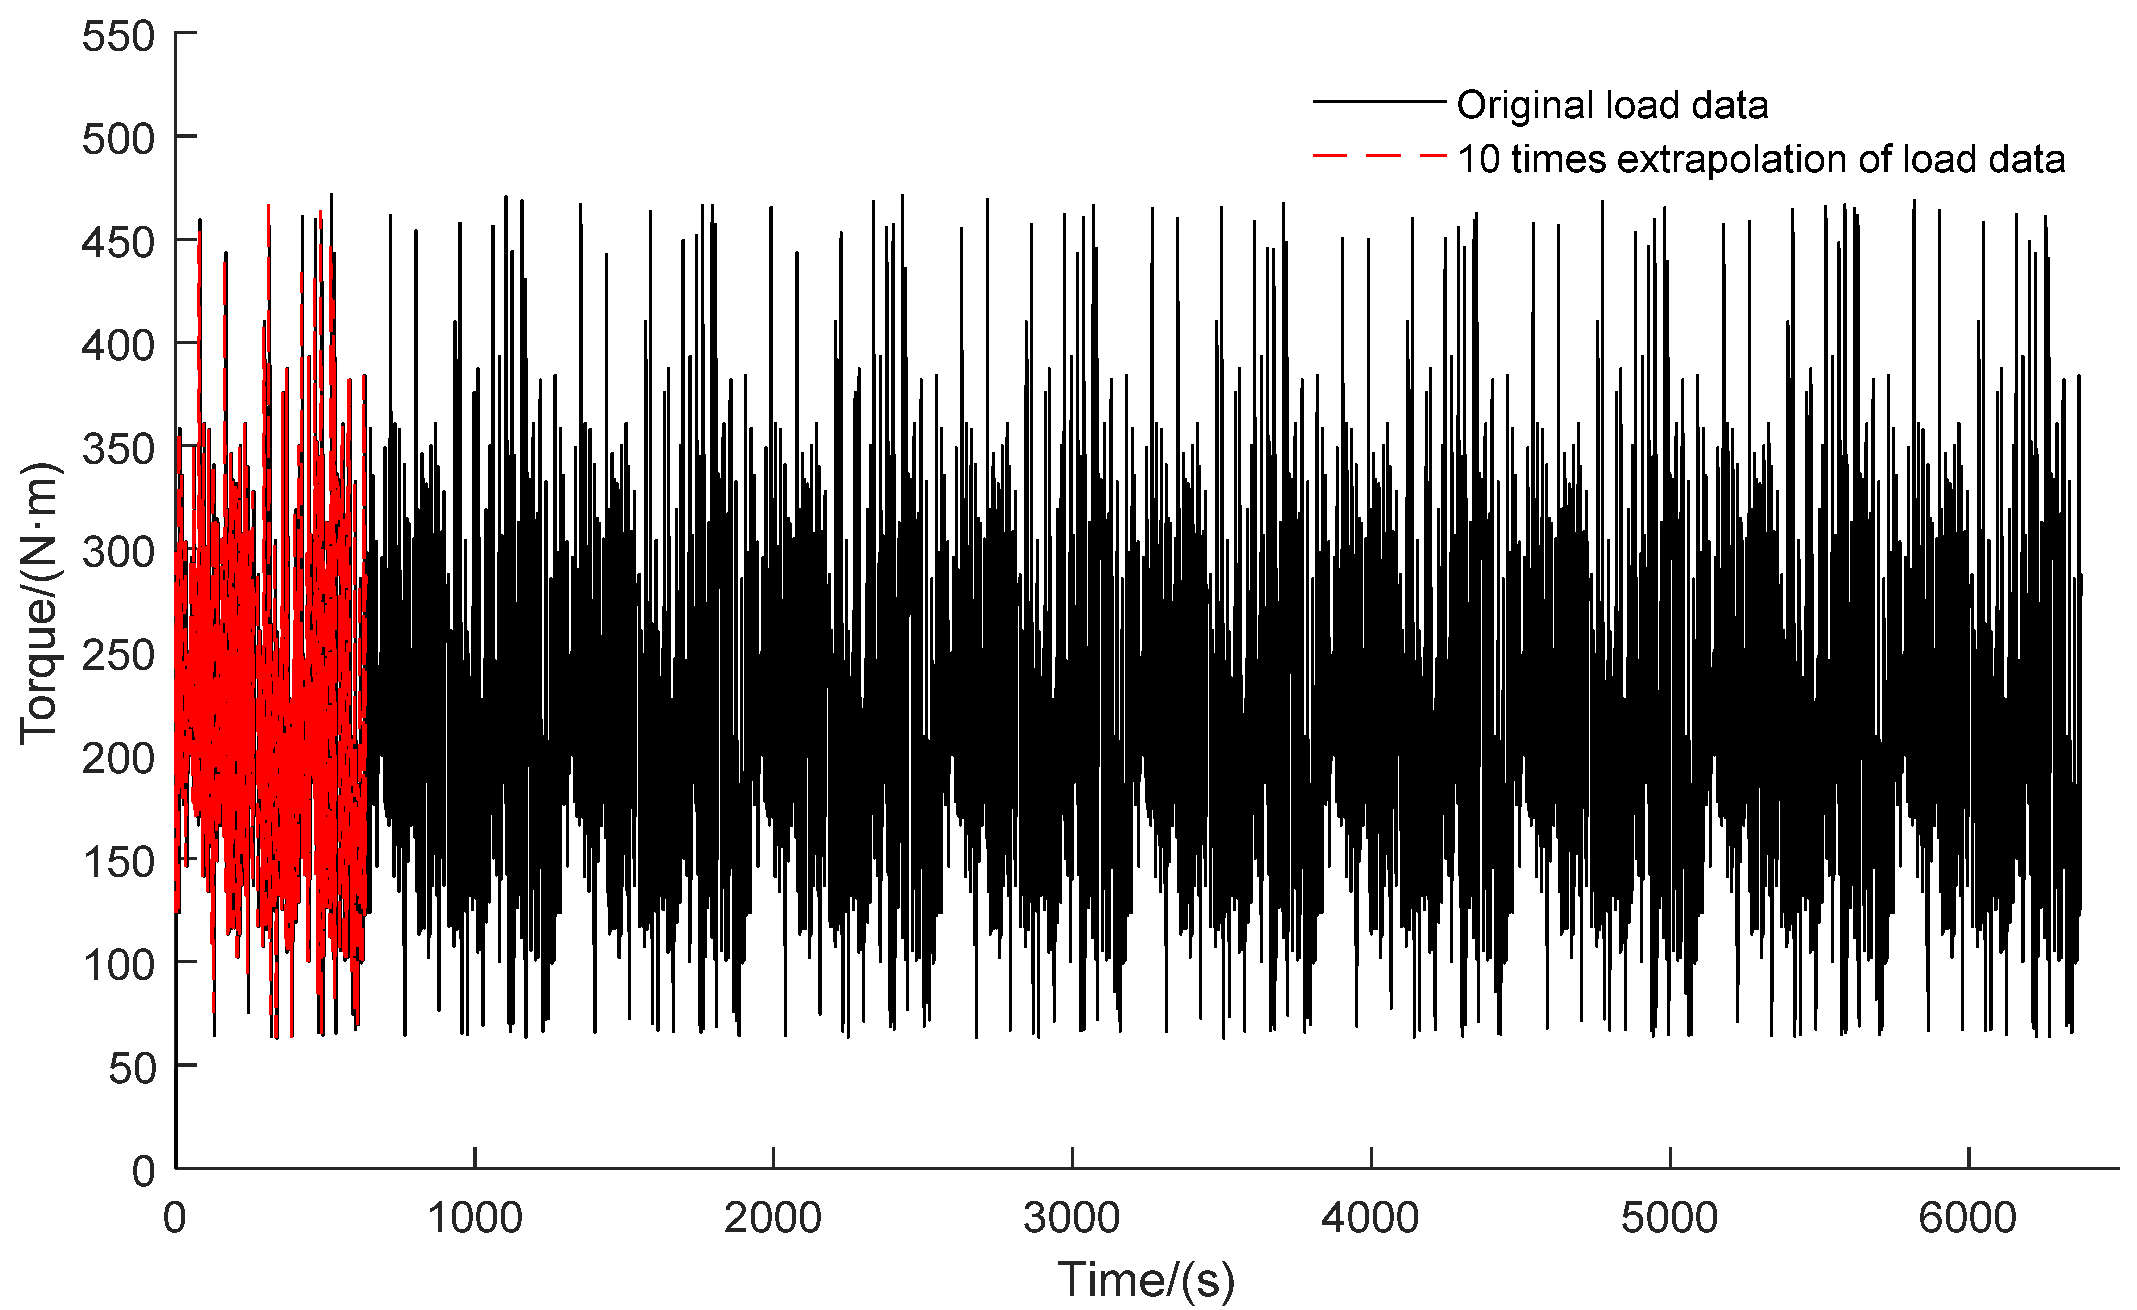
Furthermore, the load spectrum with extrapolation factor of 1 is obtained by replacing the excess of the original load with the random data from Equations (4) and (5). The load spectrum with the extrapolation factor of 10 and 131 can be obtained by repeating the above steps. When the extrapolation factor is 131, the cumulative frequency of the load spectrum is extrapolated to 106, and it represents that the load spectrum contains the load data throughout the whole life cycle of the PTO torque. The comparison of original load time history and 10 times extrapolated load time history is shown in Figure 3. The sinusoidal curve is used to be a smooth transition at the starting point of the PTO torque in order to avoid the sudden change of load.
2.4. Development of Tractor PTO Loading Test Bench
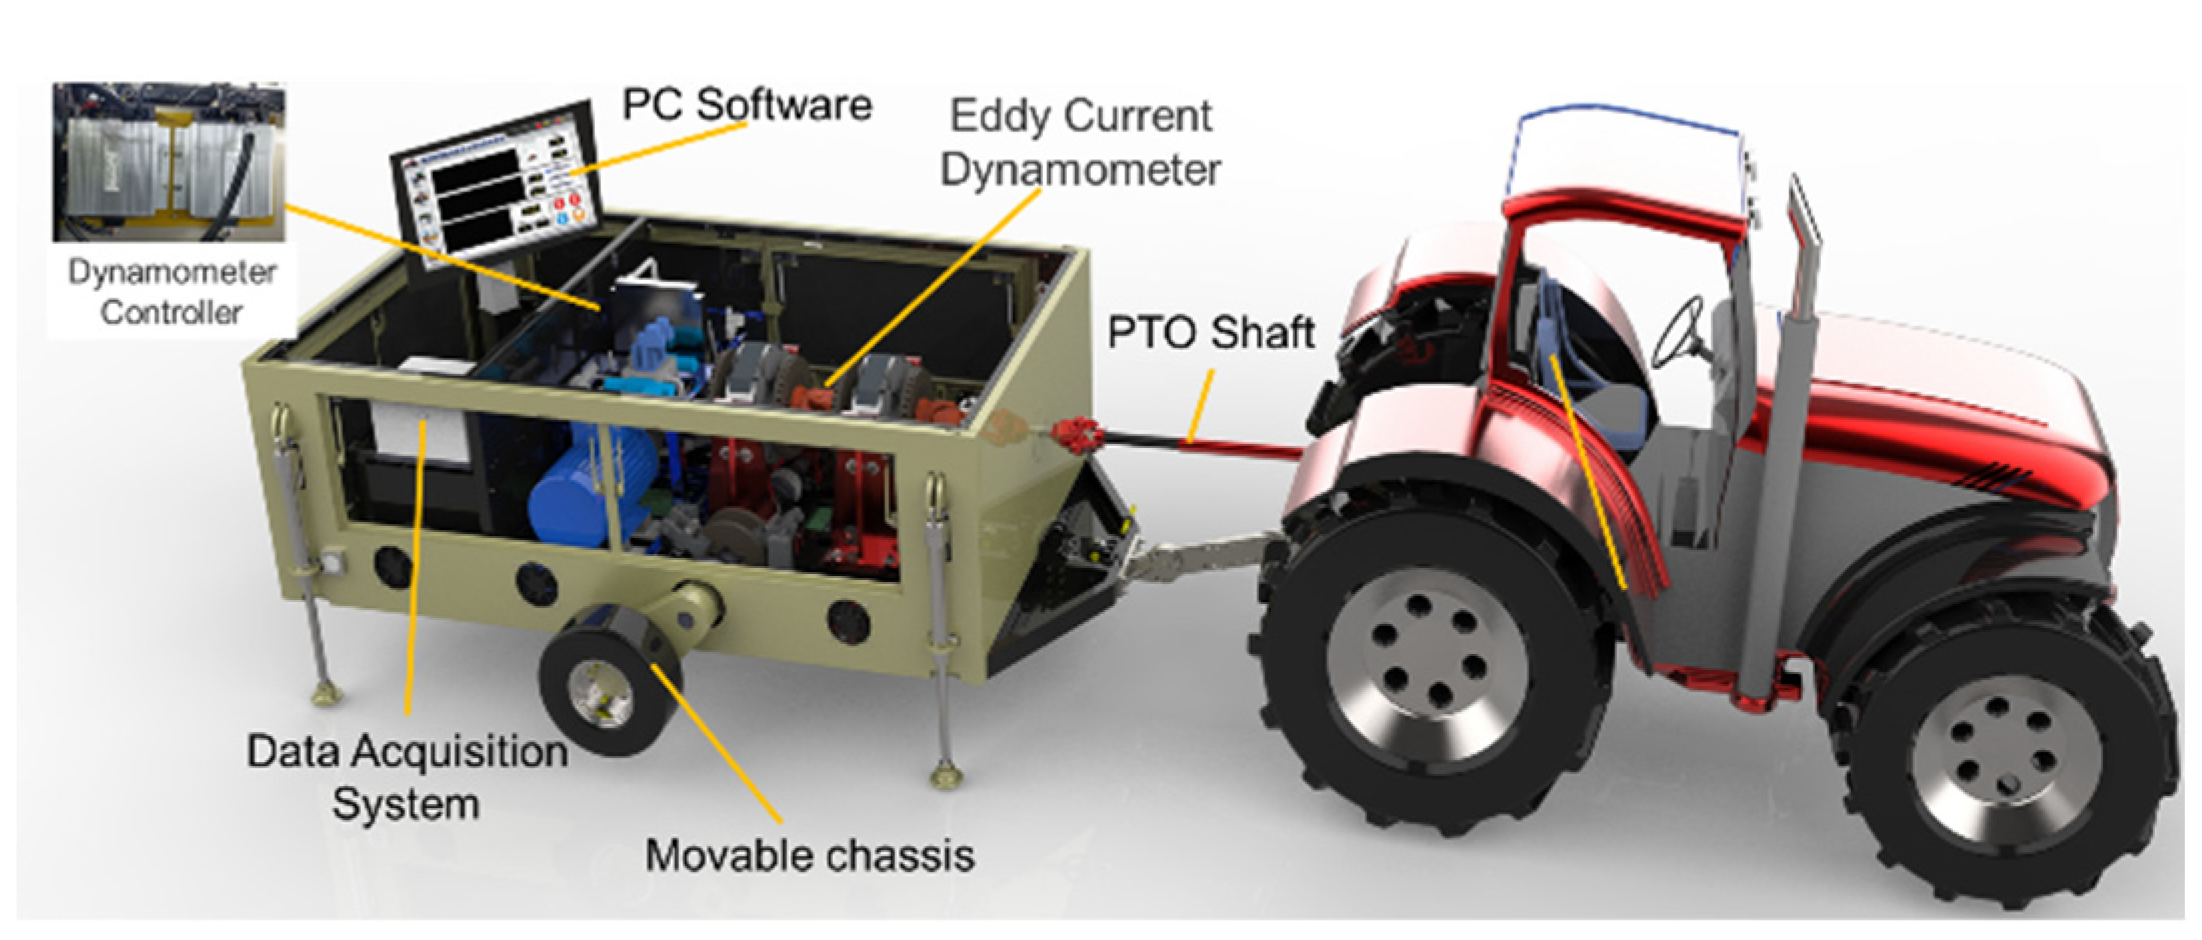
The structure principal diagram of the tractor PTO loading test bench is shown in Figure 4, which is developed for the load spectrum loading under indoor conditions to simulate the loads in actual field operations. The loading test bench is mainly composed of the movable chassis, PTO loading system, data acquisition system (DAQ) and personal computer (PC) software.
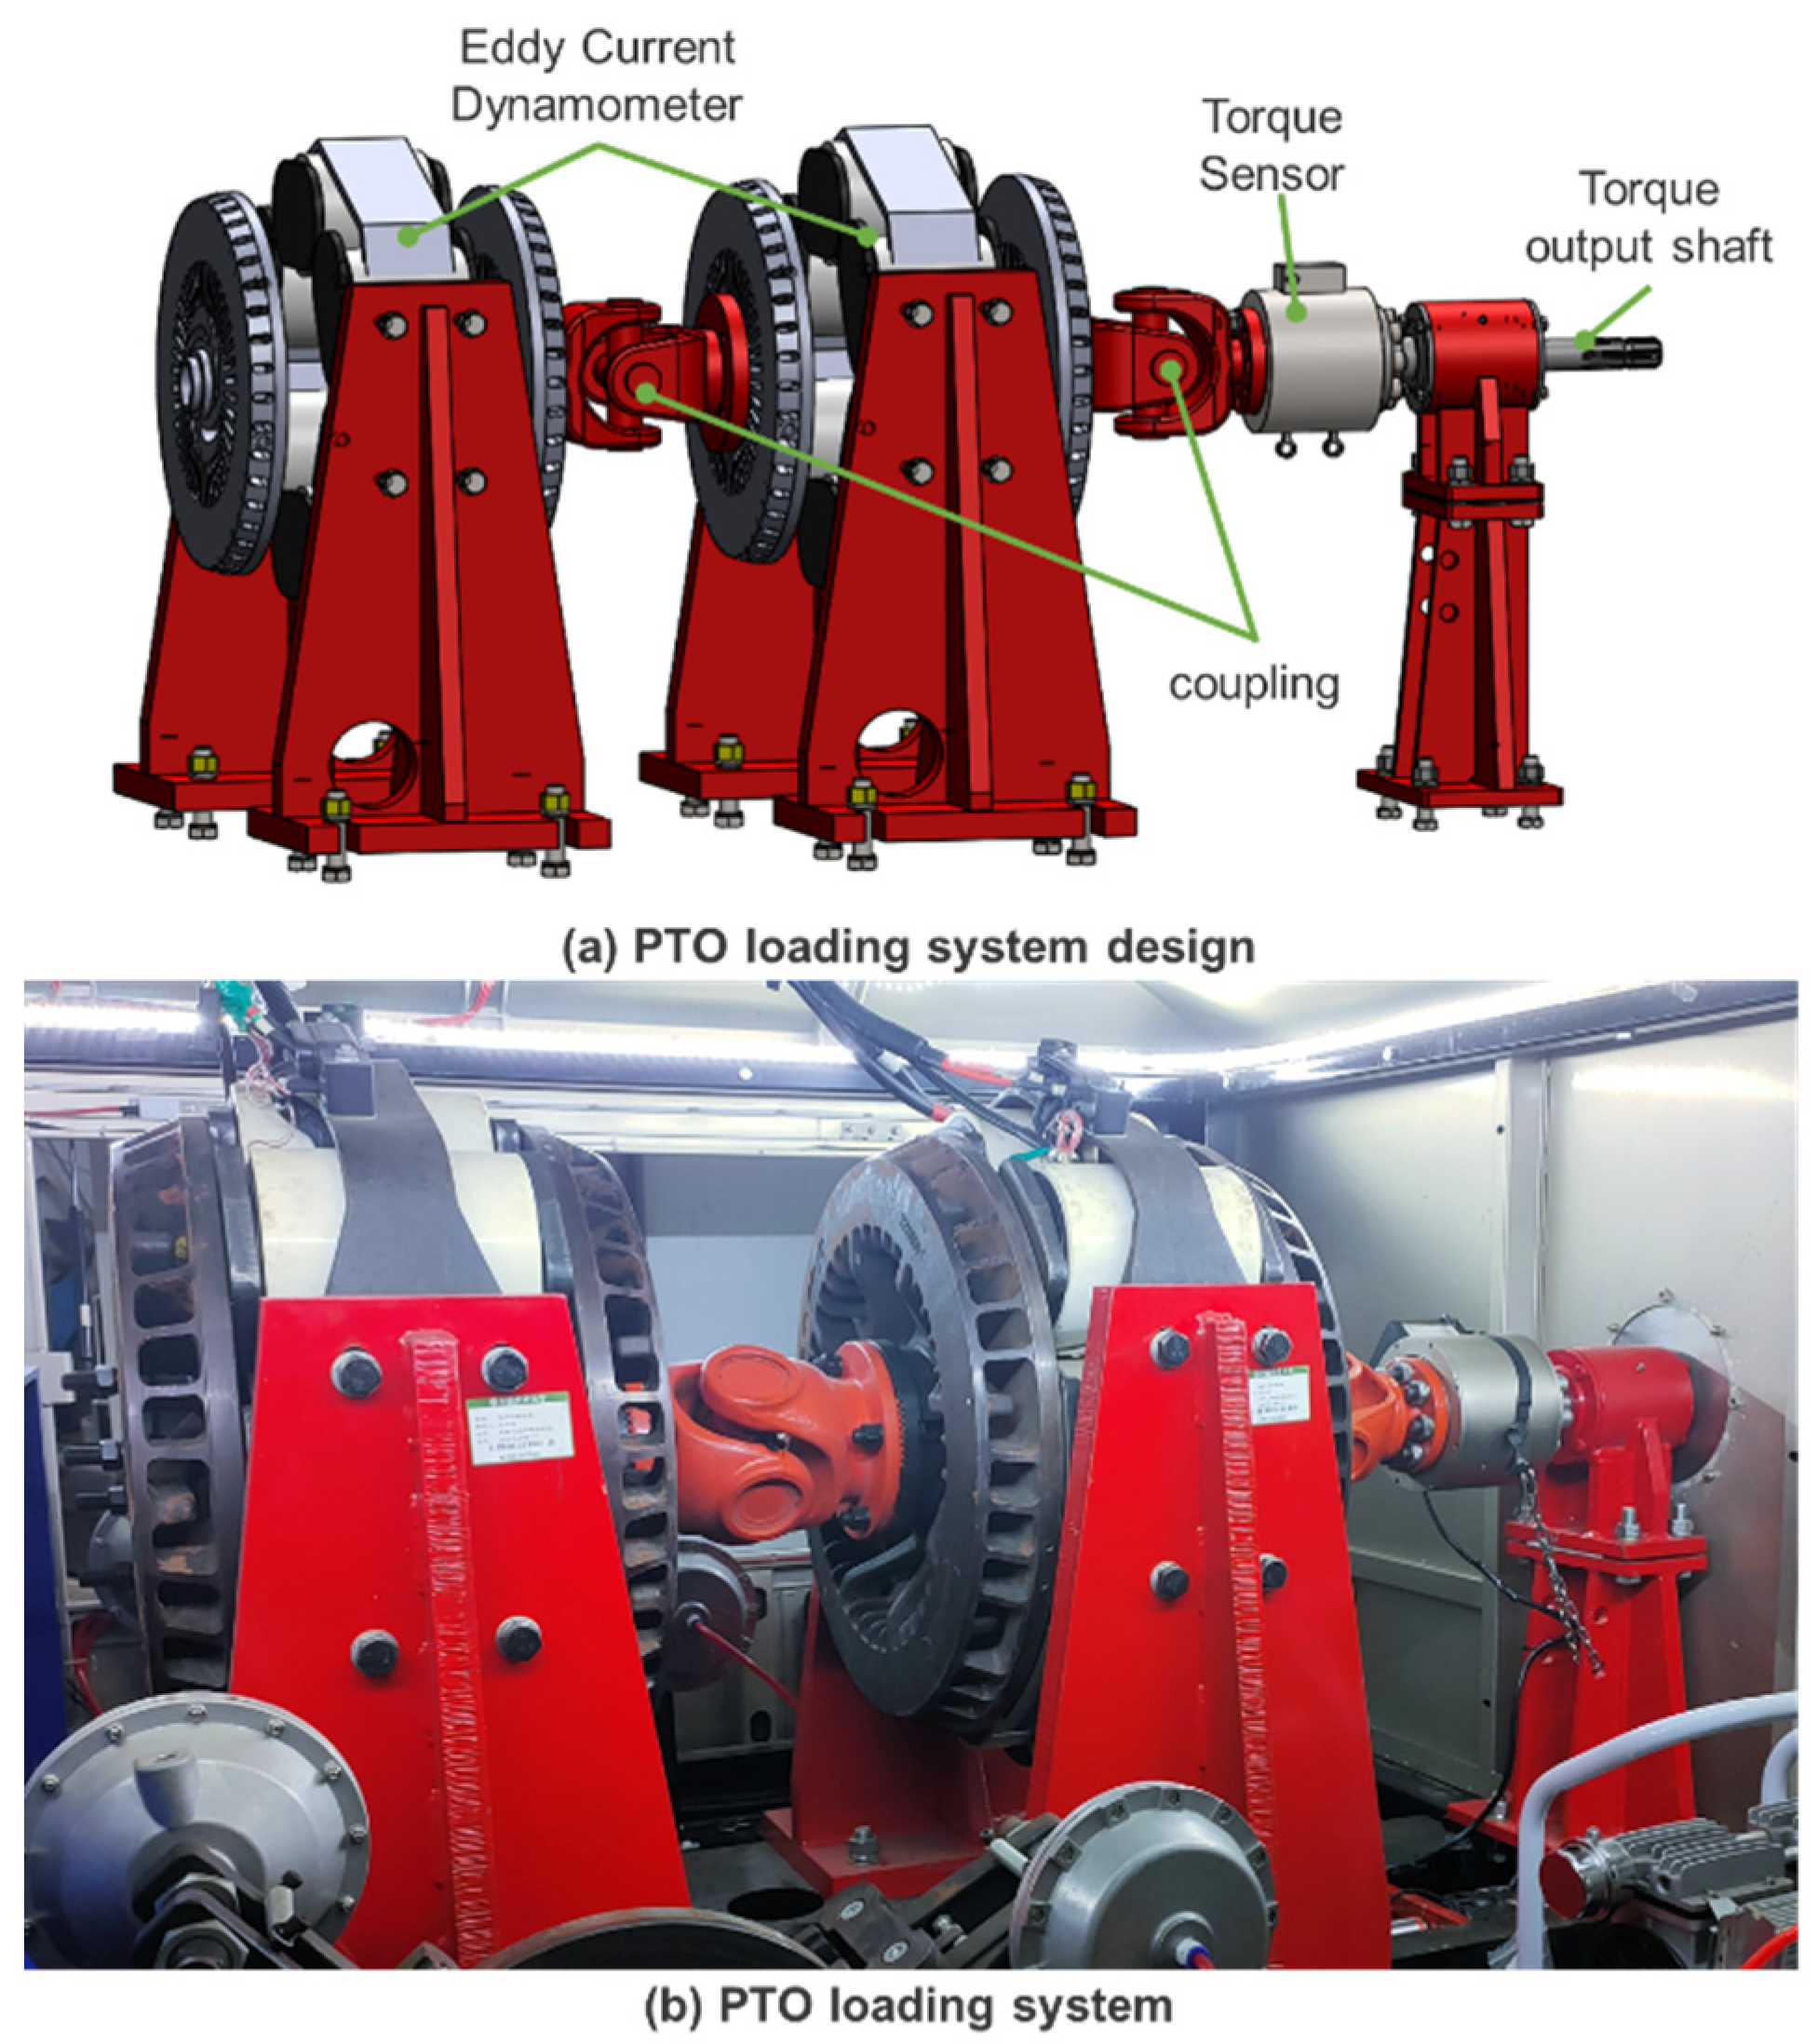
The PTO loading system consists of two eddy current dynamometers, eddy current dynamometer controller, torque sensor, coupling, and torque output shaft. The PTO torque loading is implemented by the two eddy current dynamometers in series, and the maximum torque loading range is up to 3000 N·m. The torque sensor is used to measure the real-time loading torque and speed, and through the feedback adjustment of the dynamometer controller, the dynamic control of PTO torque is achieved. The measurement and control signals are obtained and output by the DAQ, which adopts NI-CompactRIO embedded system based on NI-FPGA (National Instrument Co., Ltd, Austin, Texas, USA). The structure of PTO loading system is shown in Figure 5.
2.5. Development of Fuzzy-PID Controller
The dynamic loading response characteristics and accuracy of the eddy current dynamometer determine the reproducibility of the load spectrum. The loading torque of the eddy current dynamometer is related to its structure, material, speed, temperature, and other factors, and it is dynamic in the running state of the eddy current dynamometer. The Fuzzy-PID controller has better robustness and dynamic characteristics than PID controller by the online correction of the PID parameters according to the error changes and deviations on the basis of fuzzy rules [23].
2.5.1. Determination of Input and Output Variables
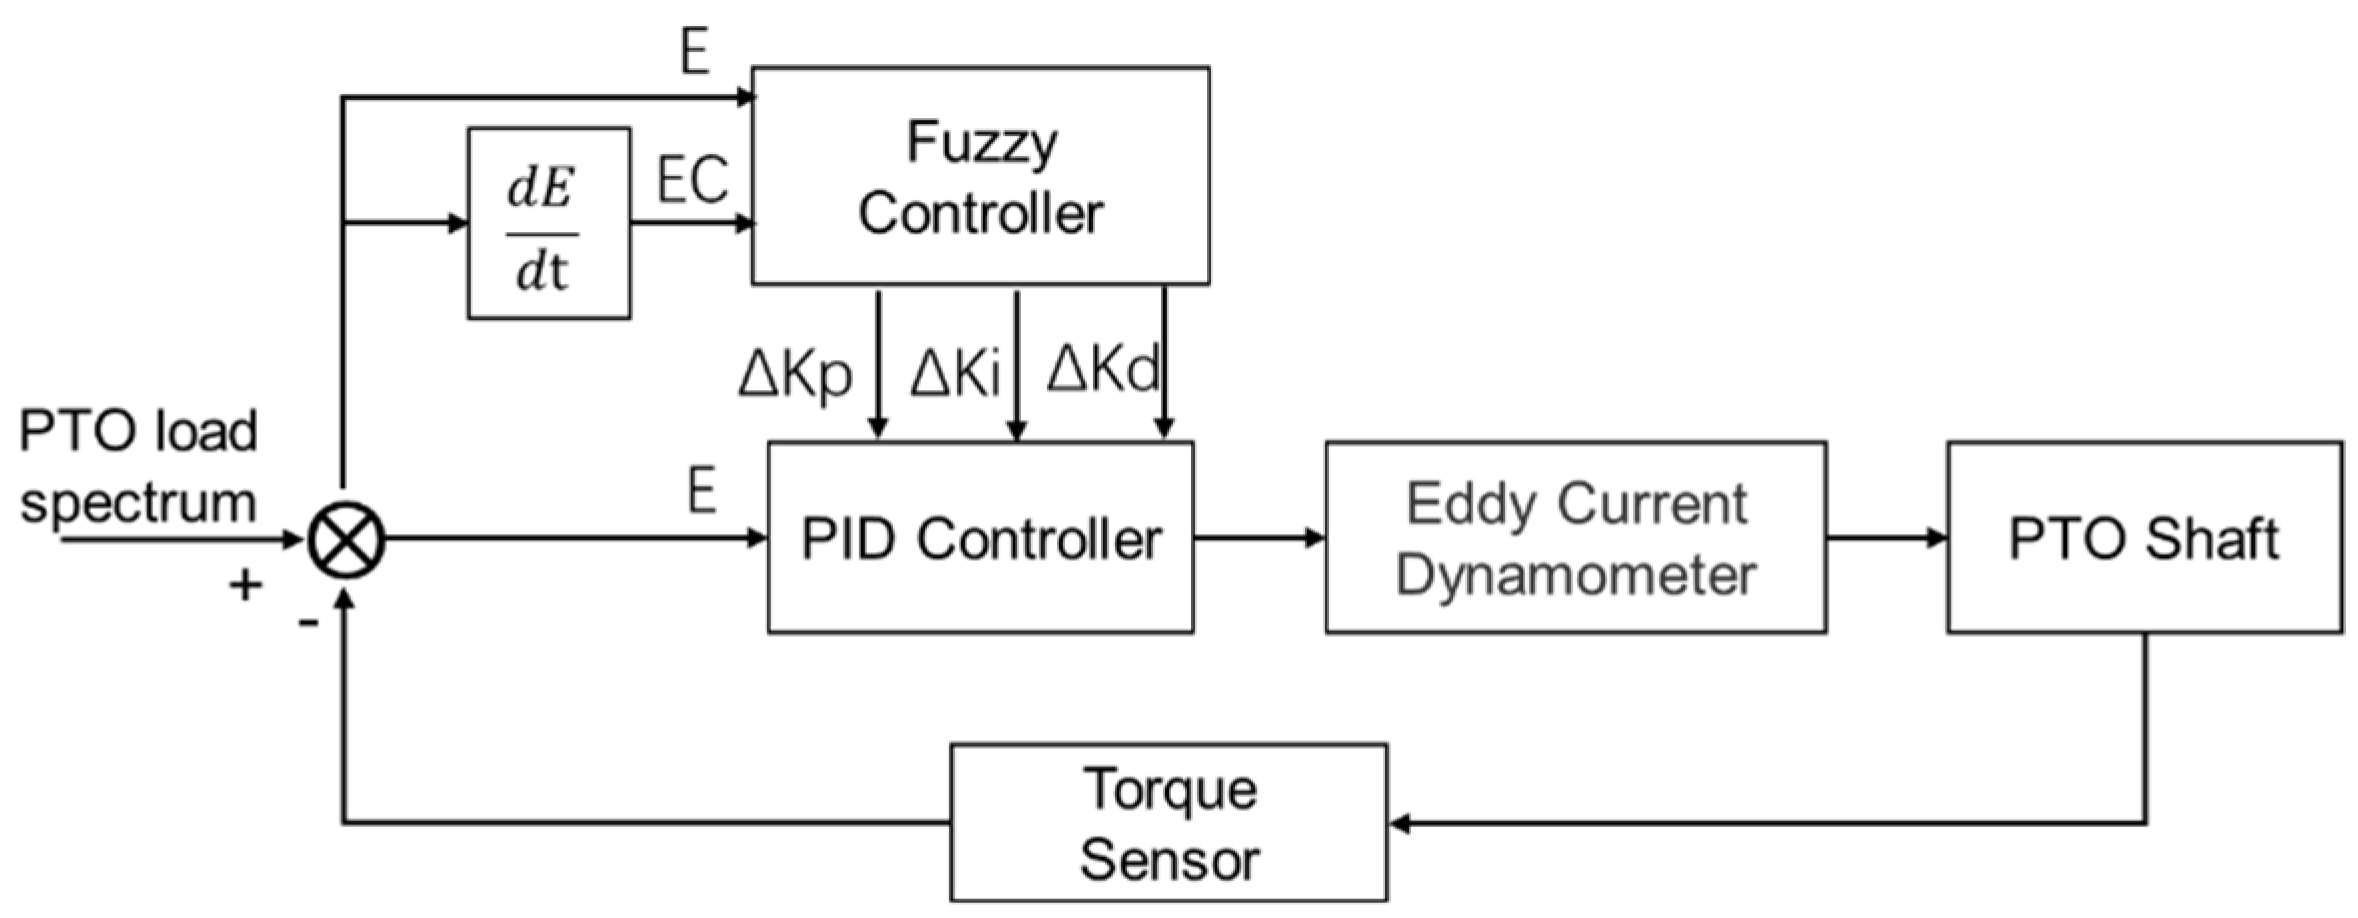
The Fuzzy-PID control includes two parts: the fuzzy controller and PID controller. The input of fuzzy controller is torque deviation (E) and deviation change rate (EC), and the output are the correction values of PID three parameters ΔKp, ΔKi, and ΔKd. The input of PID controller are torque deviation (E) and parameter correction value, and the output is the eddy current dynamometer control signal. The principle of Fuzzy-PID controller is shown in Figure 6.
2.5.2. Determination of the Membership Function and Fuzzy Subset
According to the torque loading range, the universes of input variables E and EC of the fuzzy controller are determined as (−600 600), and the universes of output variables ΔKp, ΔKi, and ΔKd are determined as (−2 2), (−0.5 0.5), and (−0.1 0.1), respectively. The quantization levels of input and output variables are divided into 7 levels, and the corresponding fuzzy subset is {NB, NM, NS, ZO, PS, PM, PB}, which represents negative big, negative middle, negative small, zero, positive small, positive middle, positive big, respectively. The Gaussian function is selected as the membership function of each fuzzy subset.
2.5.3. Determination of the Fuzzy Rules
The fuzzy control rule is determined based on the influence of PID parameters on the torque control of eddy current dynamometer and the actual operation experience. The fuzzy control rules are shown in Table 3. The Fuzzy controller adopts two-dimensional Mamdani reasoning method, in which, the max–min method is used for control decision, and the defuzzification is realized by the Centriod method.
2.5.4. Simulation Model of Fuzzy-PID Controller
The mathematical model of the eddy current torque loading system is established by using the step response identification method. Based on that, the simulation model is built in Simulink, which is shown in Figure 7. The initial parameters of the PID controller are 0.785, 0.2117, and 0.0148.
3. Results
3.1. The Results of Load Spectrum Extrapolation
3.1.1. Validation of GPD Fitting Results
In order to verify the GPD fitting results, the fitting test, standard deviation of parameter estimation, correlation coefficient, and goodness of fit are analyzed. The results are shown in Table 4. It can be seen that the GPD fitting results of the maximum and minimum values both pass the Kolmogorov–Smirnov test (K-S test) and Chi-square test at the confidence level of 95%; that is, the fitting results are acceptable. The correlation coefficient between the fitted GPD and the original data is greater than 0.99, and the fitting results have a high coincidence with the excess data; the goodness of fit is 2.8676 N·m and 1.9804 N·m, respectively, indicating that the overall error of the fitting results is small. Therefore, the GPD fitting results are effective and accurate.
3.1.2. Comparison of Statistical Characteristics of Extrapolated Load Spectrum
By comparing the statistical characteristics of the original load spectrum and the extrapolated load spectrum, the effectiveness of the extrapolated load spectrum is verified. It can be seen from Table 5 that with the increase of the data volume, the range of load extreme value expanded from (63.24, 469.50) to (60.88, 475.18), and the load coverage expanded by 1.98%; in addition, the mean value, standard deviation, and variance of the extrapolated load spectrum are basically consistent with the statistical characteristics of the original load data, and the extrapolated load spectrum is effective.
3.1.3. Comparison of Rain Flow Counting
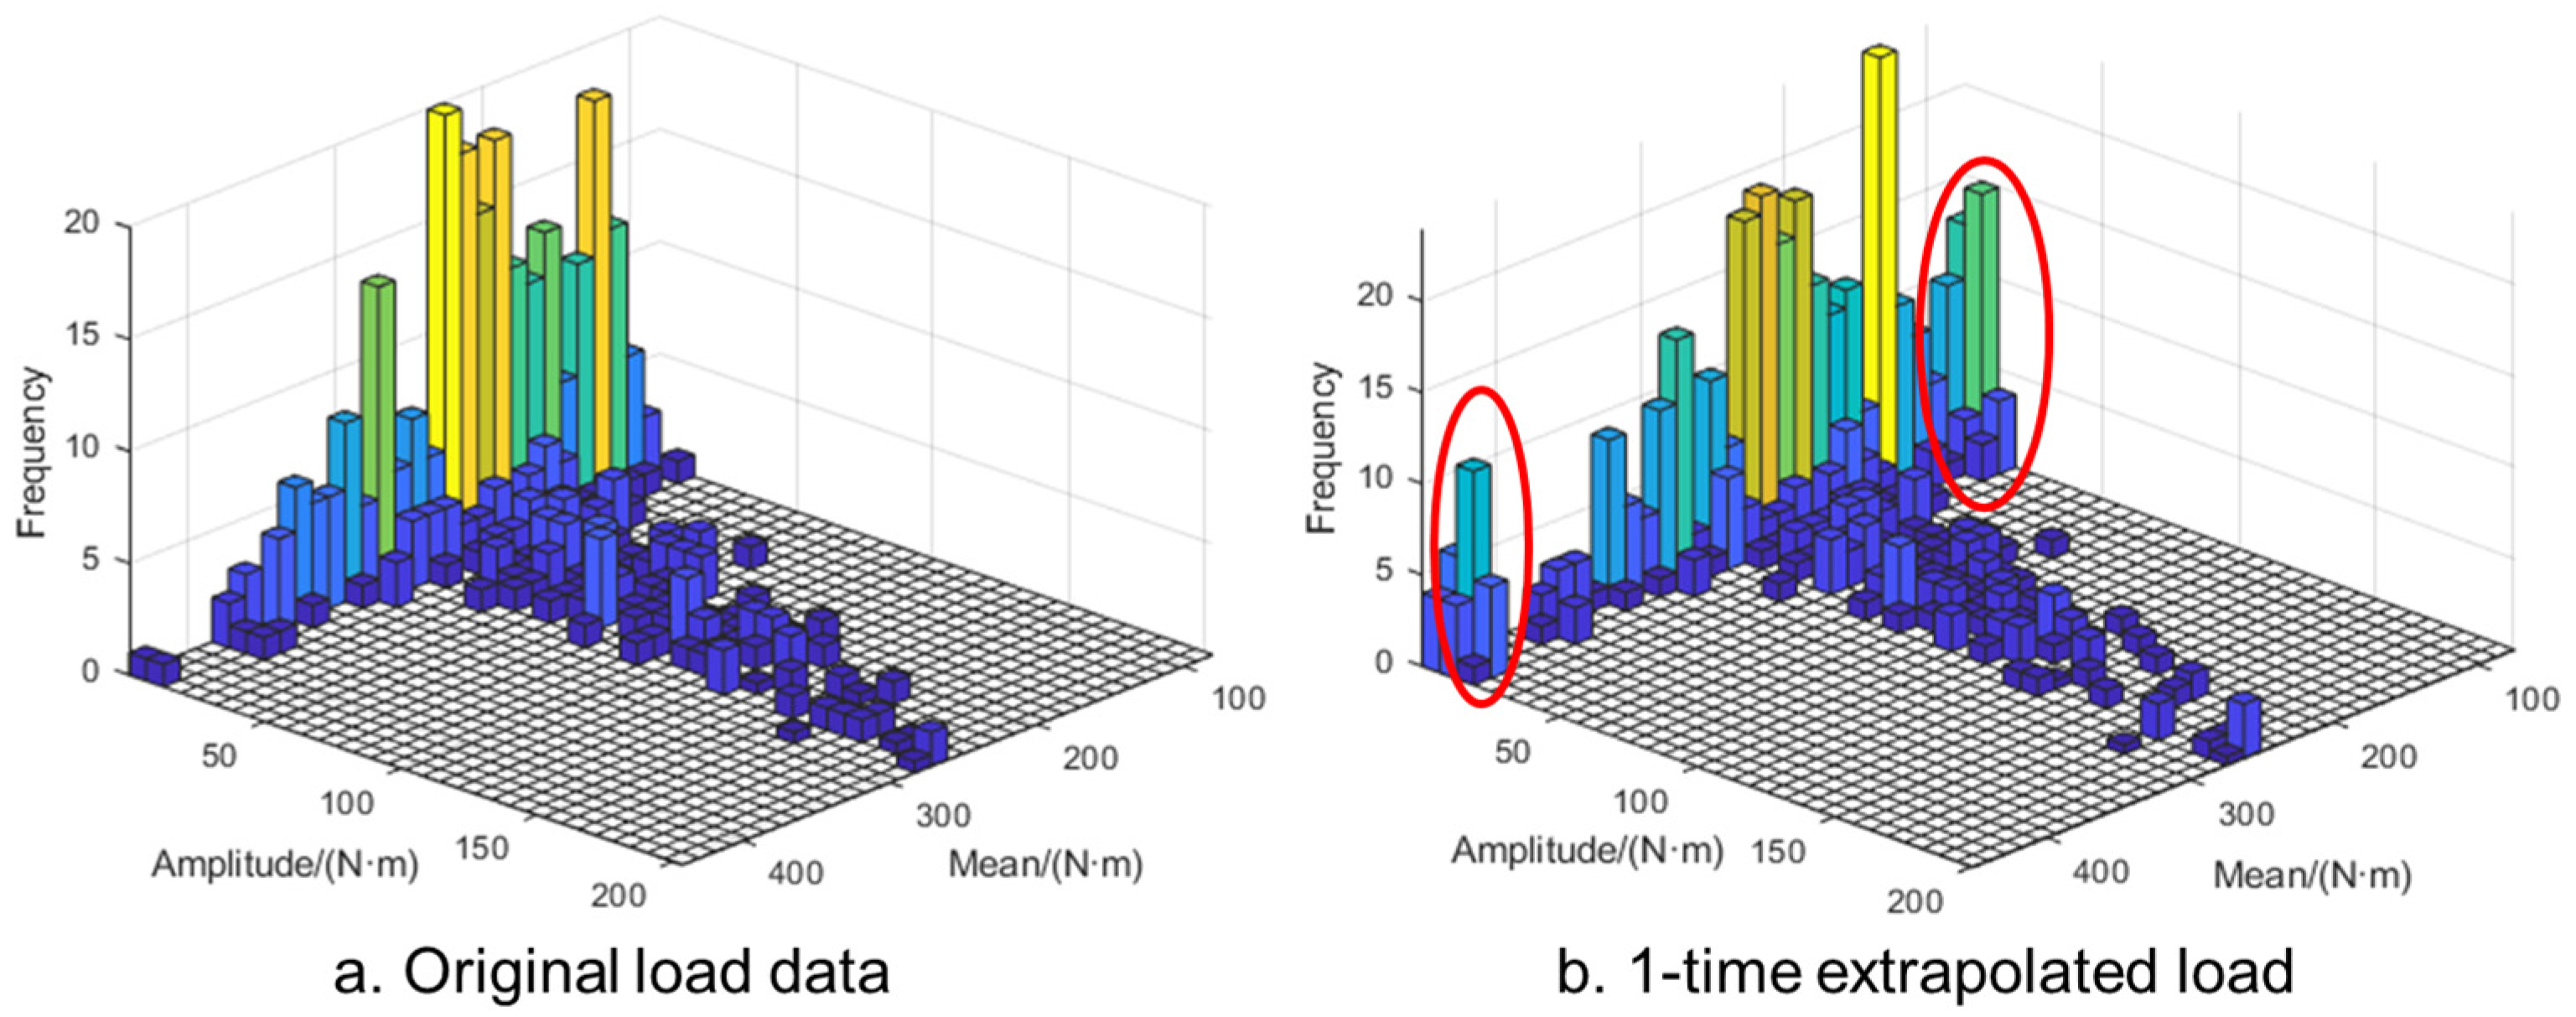
The rain flow matrixes of the original load data and 1-time extrapolation load data are shown in Figure 8. From the overall distribution of the rain flow matrix, the extrapolated load spectrum has the same distribution law as the original load data, which proves that the extrapolation method is feasible and reasonable. Moreover, the essential function of the time domain extrapolation method is to reconstruct the data above the threshold value, while the data below the threshold value remains unchanged. It can be seen from Figure 8b that the extrapolated load spectrum has two peaks marked by red circles in the distribution area of the maximum and minimum values, and they are distributed at both ends of the graph, which mean that the extreme value has been successfully extrapolated. The frequency in Figure 8 represents the concentration degree of the load cycle; the higher it is, the higher the cumulative frequency is. Compared with the original data, the frequency corresponding to the extrapolated extreme value is higher. Therefore, it can be considered that the extrapolation effect with this approach is obvious.
3.2. Simulation Test of Fuzzy-PID Controller
3.2.1. Simulation of Step Response
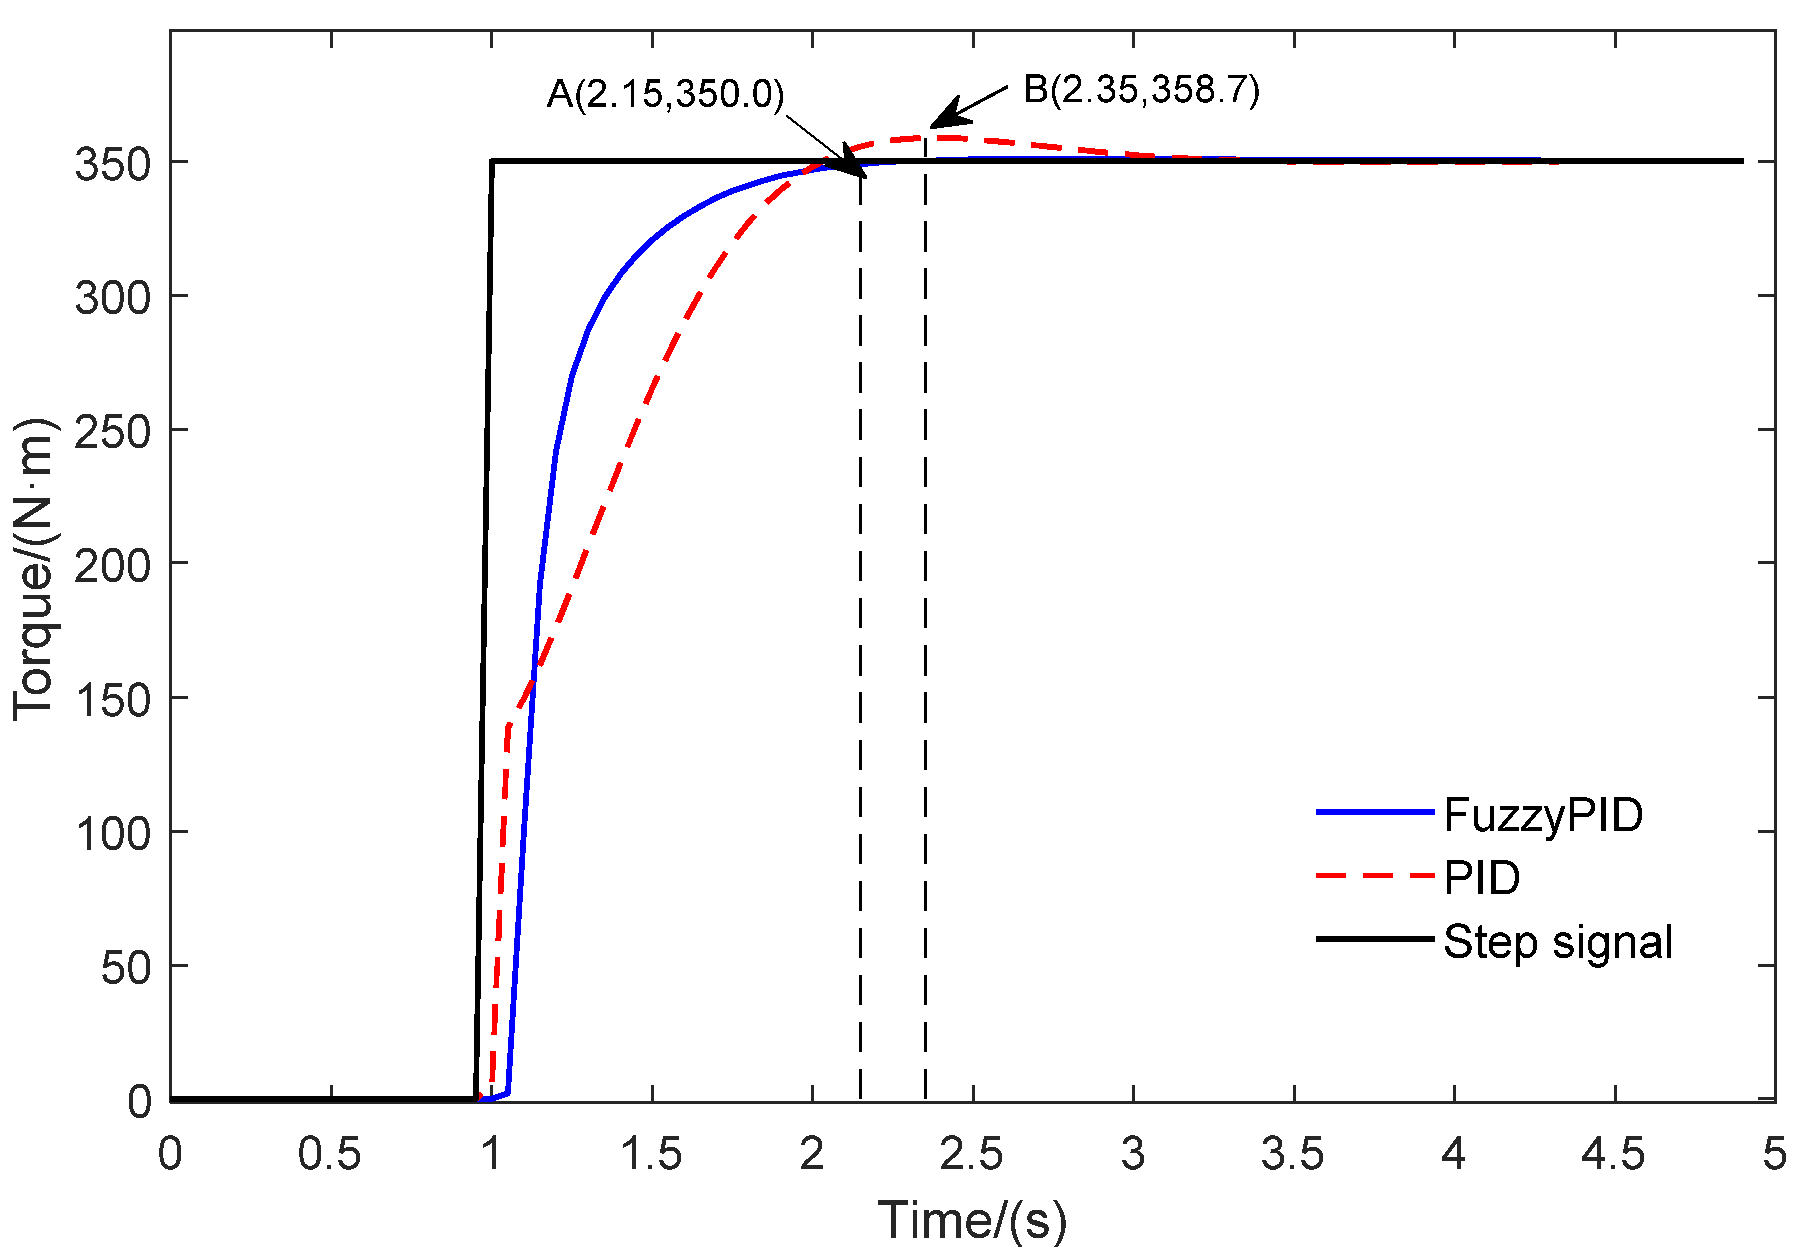
The step response is used to simulate the Fuzzy-PID controller and PID controller, respectively, in Simulink; the result is shown in Figure 9.
It can be seen that the response characteristics of both controllers are fast and accurate. The signal tends to be stable after 2.15 s of the Fuzzy-PID controller, while it is 3.25 s of the PID controller, which has a maximum overshoot of 358.7 at 2.35 s. The steady-state errors are 0 of both controllers.
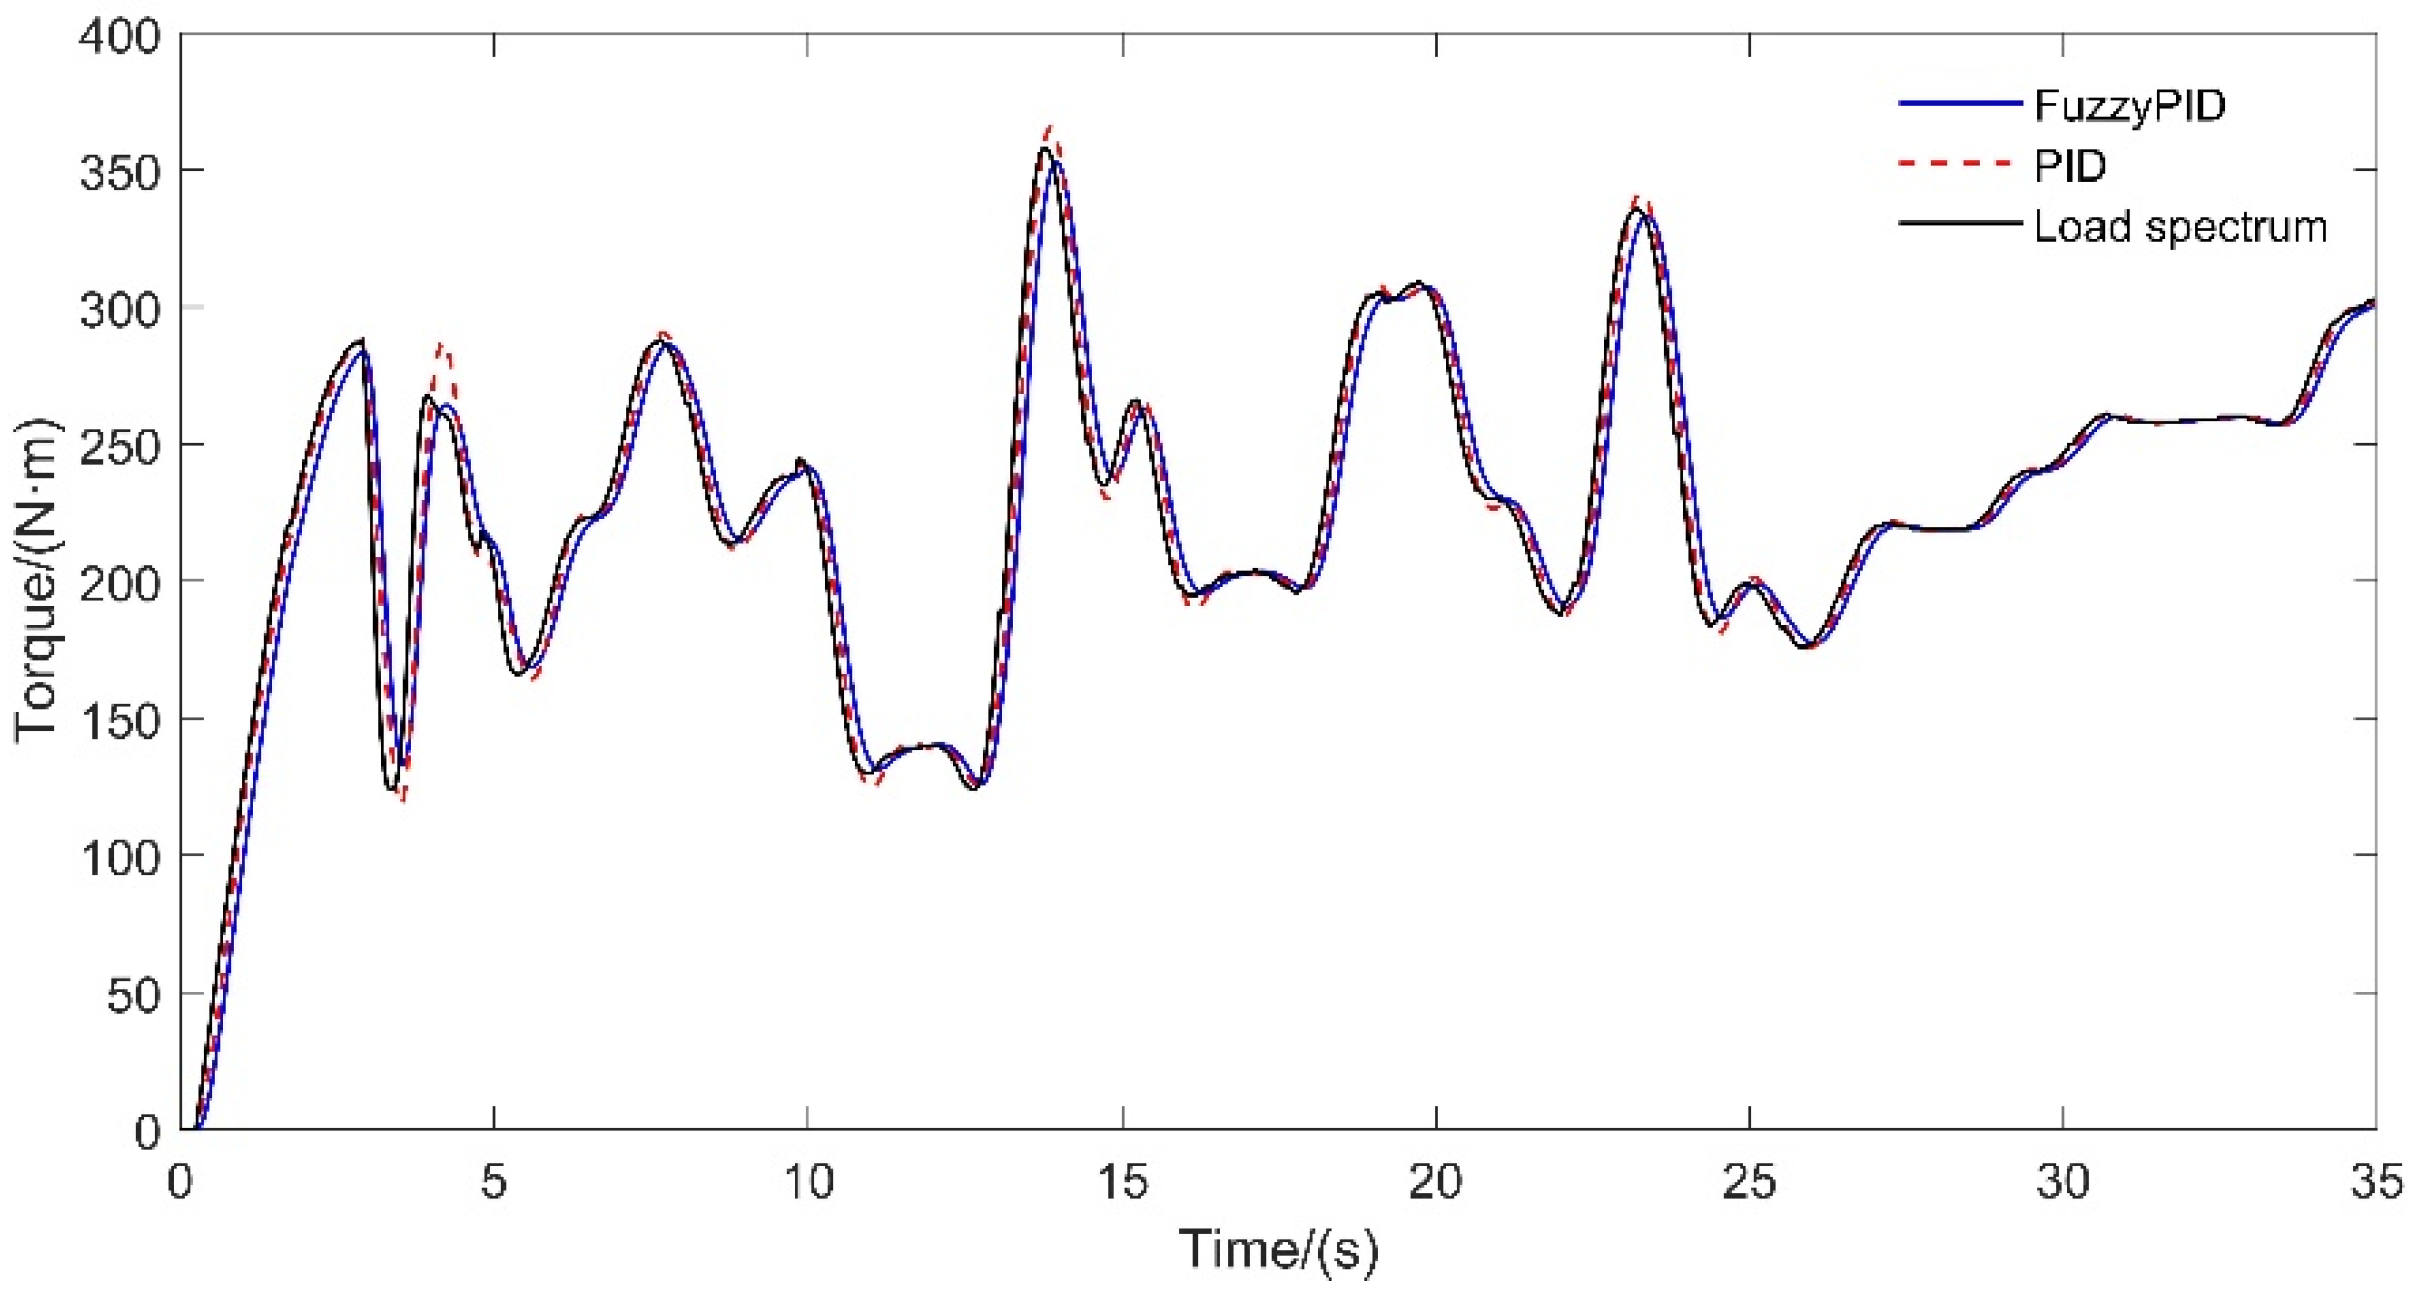
3.2.2. Simulation of the Load Spectrum
The load spectrum is used to verify the dynamic response characteristics of the two controllers. The simulation results in the first 35 s are shown in Figure 10. The response time of Fuzzy-PID controller and PID controller are 0.05 s and 0.02 s, respectively, and the maximum error are 1.77% and 7.27%, respectively. The simulation results show that the dynamic response characteristics are fast, and the PID controller has a larger overshoot. The response time is long for the Fuzzy-PID controller; however, the stability and accuracy are better to simulate the load spectrum loading.
3.2.3. Test Verification
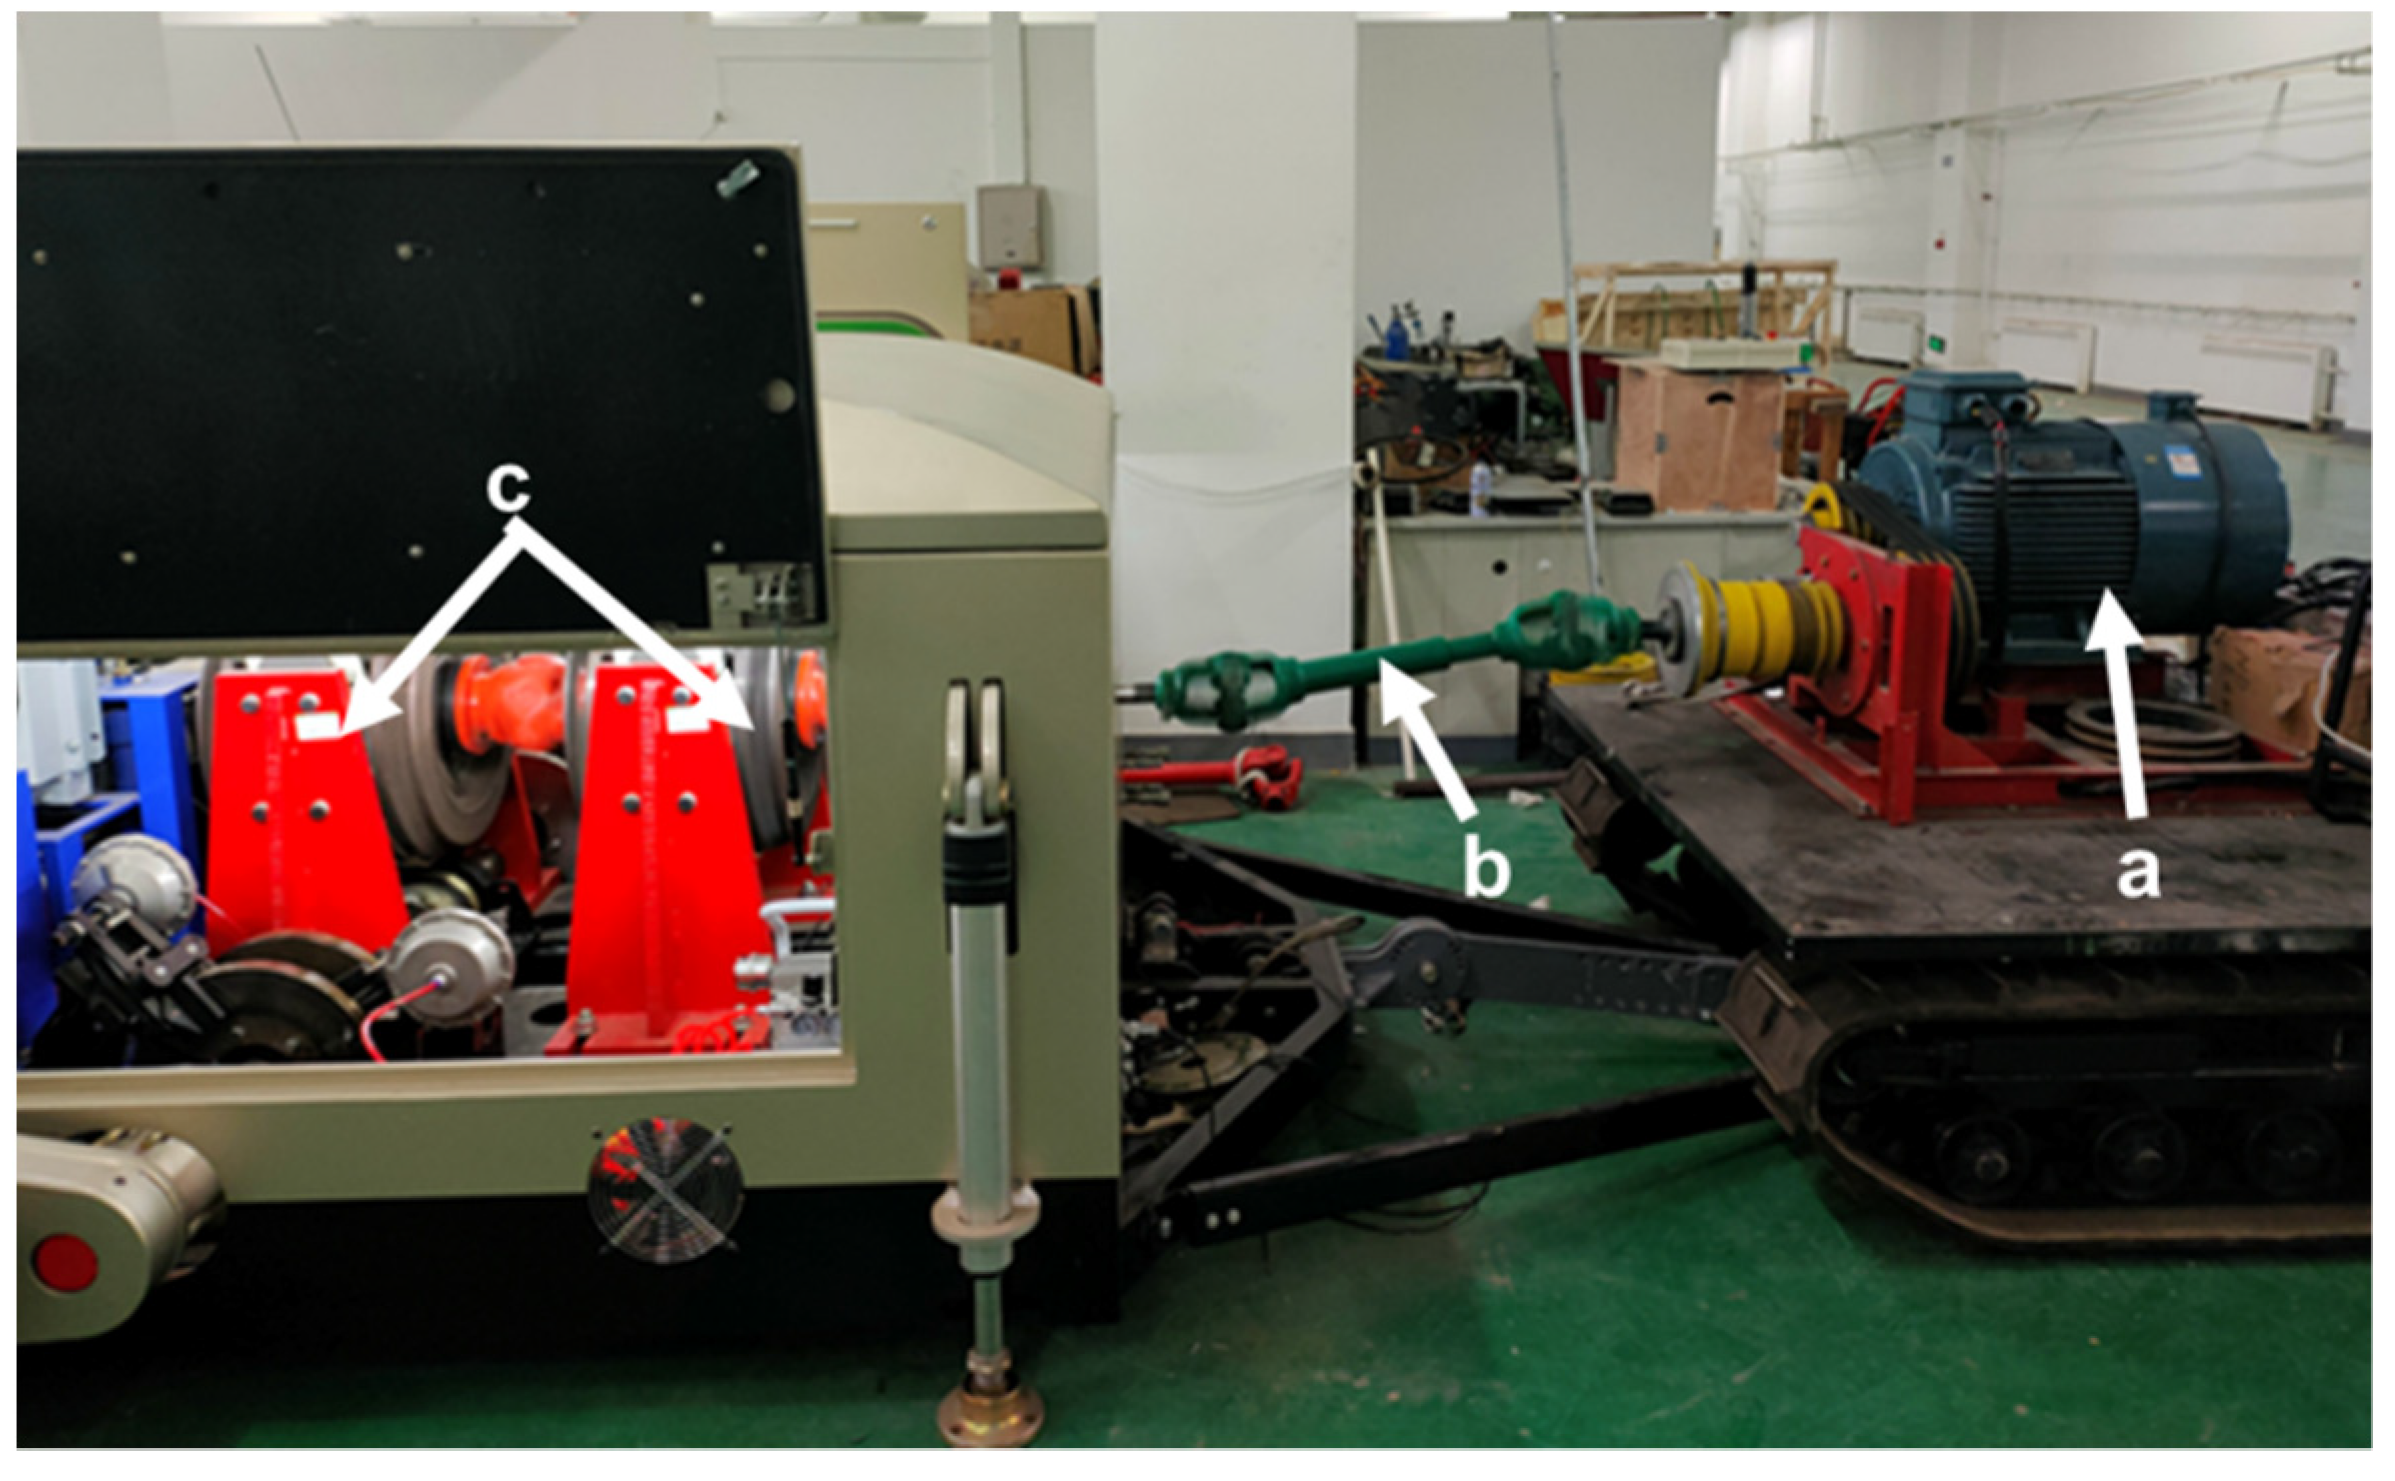
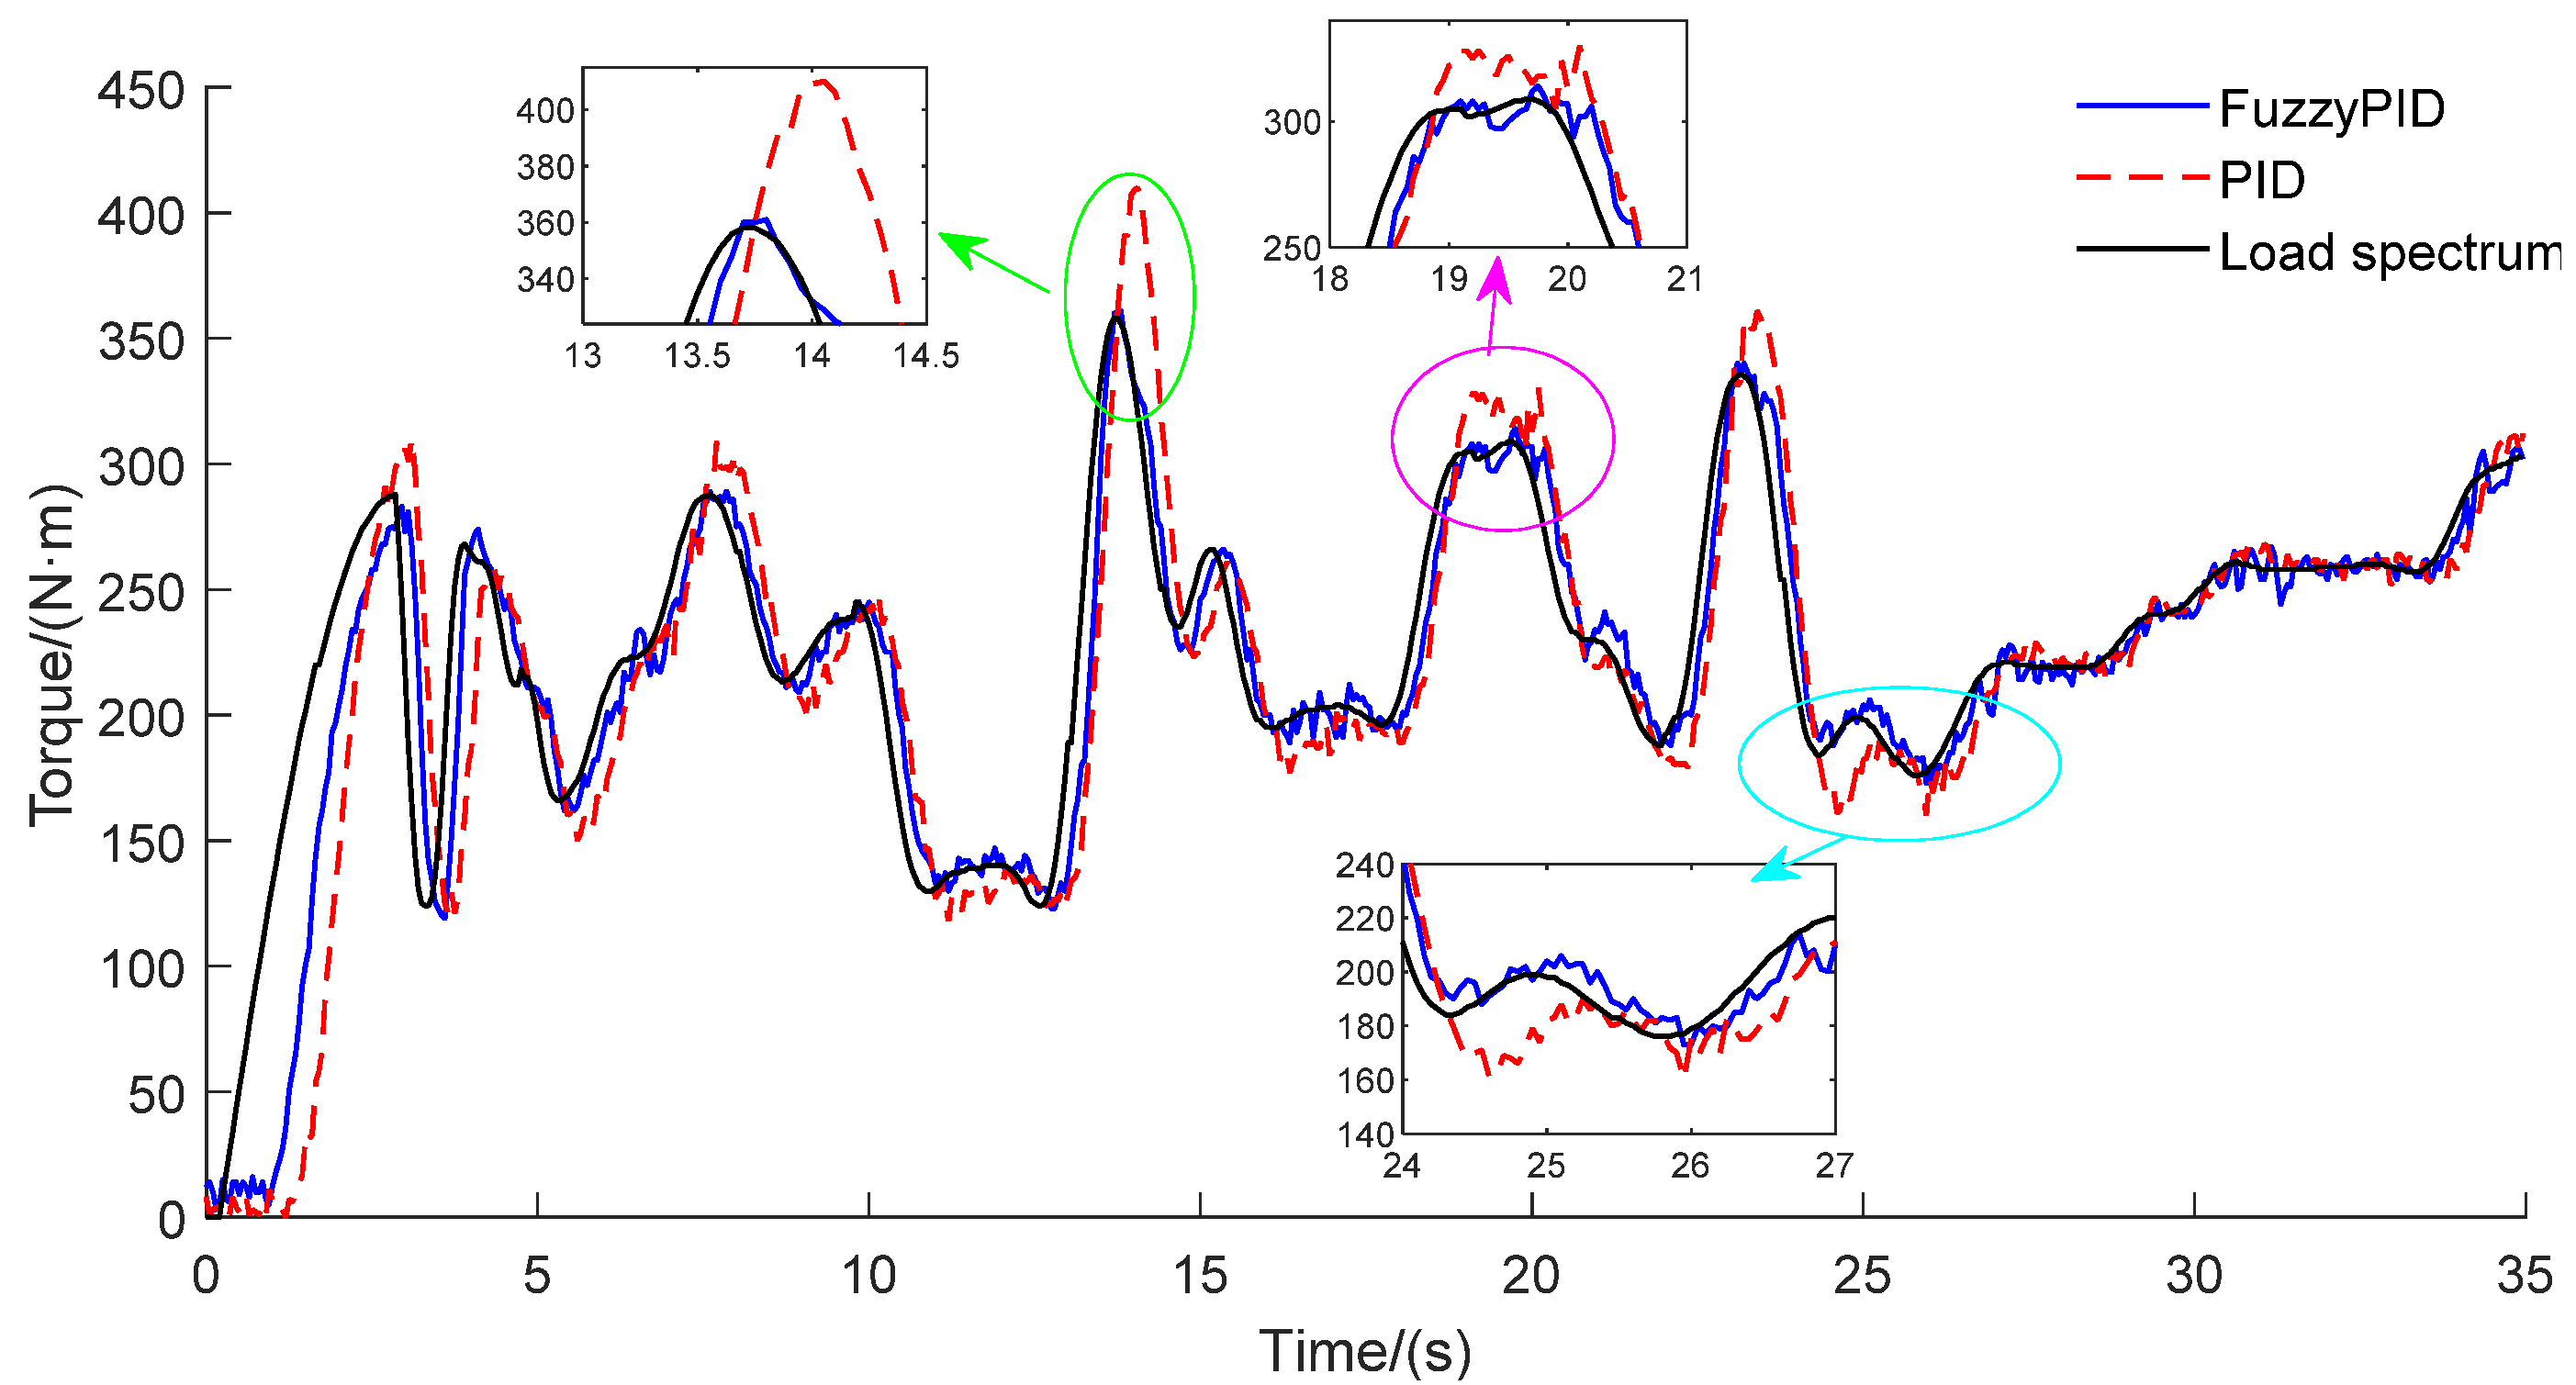
The load spectrum loading test is carried out to verify the actual performance of the PTO loading test bench and the Fuzzy-PID controller. The loading test site is shown in Figure 11, and the parameters of the test equipment are shown in Table 6. The three-phase motor is used to simulate the tractor PTO for the loading test, and the motor rotational speed is 540 r·min−1. The actual loading load spectrum is consistent with the load spectrum used in the simulation, and the loading frequency of the load spectrum is 20 Hz. The test results of the two controllers are shown in Figure 12.
It can be seen that the dynamic loading of the load spectrum can be realized based on both the Fuzzy-PID controller and the PID controller. The change trend and results are similar with the simulation. The response time of the two controllers is 0.75 s and 1.05 s, respectively, and due to the mechanical lag of the PTO loading test bench, the response time is a little slower compared to the load change at the initial stage. In terms of the loading accuracy, the maximum overshoot is 15 N·m, the maximum error is 4.03%, and the goodness of fit is 16.78 N·m for the Fuzzy-PID controller. In comparison, there is a large overshoot when the load changes greatly for the PID controller, the maximum overshoot is 52 N·m, the maximum error is 14.53%, and the goodness of fit is 29.46 N·m.
The results show that it has high accuracy and stability for the dynamic loading control of the load spectrum of the Fuzzy-PID controller proposed in this paper, and the PTO loading test bench is available for the loading of the dynamic load spectrum, which can provide the reference for the tractor performance test.
4. Discussion
The tractor PTO is the key power transmission component when used in the rotary tillage and driven harrow operations, and the main loading part of the bench test for the tractor drive train. In the current tractor performance test, the torque loading of tractor PTO is mainly based on static loading or static step-by-step loading, and the dynamic characteristics of PTO load output by this mode is different from that of PTO load in the actual field operation, which leads to the difference in test results between the bench test and the actual field operation. To solve this problem, in this paper, the dynamic loading method of the tractor PTO torque based on load spectrum is studied.
First, an accurate PTO torque load spectrum using the extrapolating method of tractor PTO is studied based on the Peak Over Threshold model, and in order to obtain a more accurate Peak Over Threshold model, an automatic threshold selection method based on FDR control is proposed. Compared with the traditional method [9,16], the method proposed in this paper has a simple process and higher GPD fitting accuracy which is more suitable for the extrapolation of tractor PTO torque load. In addition, a novel movable tractor PTO loading test bench is developed which has a more compact structure and in which it is convenient to carry out various PTO loading tests compared with the test bench proposed in references [5,6,7]. More importantly, on this basis, the loading test method of the tractor PTO load spectrum is studied by using the PTO torque load spectrum as the input signal; the load change in actual operations can be fully reflected and the load characteristics are closer to the reality. Theoretically, the test results based on the load spectrum will be more real and reliable, which can provide new ideas and reference for the tractor PTO test.
5. Conclusions
There is relatively little research on the loading test of tractor PTO based on the load spectrum acquired in the actual field work; thus, the performance and reliability of tractor PTO is difficult to evaluate and test. In this study, the time domain extrapolation method based on a Peak Over Threshold model is proposed for extrapolating the tractor PTO torque load spectrum throughout the whole life cycle. The tractor PTO loading test bench with two eddy current dynamometers and control system are developed based on the Fuzzy-PID control algorithm, and the test bench and the control algorithm are evaluated for the step signal and dynamic load spectrum. The results are as follows:
1. With the approach of the time domain extrapolation method based on a Peak Over Threshold model, the extrapolation of the tractor PTO torque load spectrum is realized. The results show that the load extreme value is expanded from (63.24, 469.50) to (60.88, 475.18), and the coverage is expanded by 1.98%. In the GPD fitting part, the correlation coefficient between the fitting model obtained by the ForwardStop rule and the original data is greater than 0.99, and the goodness of fit is 2.8676 N·m and 1.9804 N·m, respectively, indicating that the fitting results are highly accurate.
2. The tractor PTO loading test bench and control system is developed, which adopts Fuzzy-PID controller to realize the torque loading control. The simulation results show that the response time of the Fuzzy-PID controller is 0.05 s, and the maximum error is 1.77%. Compared with the PID controller, it has a better follow effect on the loading control of the load spectrum of the Fuzzy-PID controller.
3. The loading test method of the tractor PTO load spectrum is explored. The actual test results show that the output torque of the loading system has a good response to the input load spectrum. The response time is 0.75 s, the maximum overshoot is 15 N·m, the maximum error is 4.03%, and the goodness of fit was 16.78 N·m, which indicate that the PTO loading test bench can meet the dynamic loading test demand of the tractor.
The limitation of this study is that only the preliminary research on the laboratory test of the loading method and effect based on the PTO load spectrum has been carried out and has not been applied in the field operation for the tractor PTO test. For future directions, we intend to take the actual tractor PTO as the object to explore the impact of PTO load spectrum on the fatigue damage and reliability of PTO, and compare it with the traditional test method. It is hoped that the research results can be used to guide the actual tractor test and provide a reference for the optimization method of agricultural machinery and equipment. We look forward to using the research results to conduct the actual tractor test and provide reference for the optimization method of agricultural machinery and equipment.
6. Patents
A patent has been applied for in China for the PTO test bench reported in this manuscript (Patent No. CN201910661680 and Application No. CN201921117795).
Author Contributions
Conceptualization, L.W.; data curation, Y.W.; funding acquisition, L.W.; methodology, Y.W.; software, J.Z. and D.L.; supervision, L.W. and S.W.; writing—original draft, Y.W.; Writing—review and editing, L.W. and S.W. All authors have read and agreed to the published version of the manuscript.
Funding
This research was funded by the National Natural Science Foundation of China (Grant No. 31801783).
Institutional Review Board Statement
Not applicable.
Informed Consent Statement
Not applicable.
Acknowledgments
The authors thank the National Science Foundation of China (Grant No. 31801783).
Conflicts of Interest
The authors declare no conflict of interest.
References
- Lips, M. Length of Operational Life and Its Impact on Life-Cycle Costs of a Tractor in Switzerland. Agriculture 2017, 7, 68. [Google Scholar] [CrossRef] [Green Version]
- Bulgakov, V.; Aboltins, A.; Beloev, H.; Nadykto, V.; Kyurchev, V.; Adamchuk, V.; Kaminskiy, V. Experimental Investigation of Plow-Chopping Unit. Agriculture 2021, 11, 30. [Google Scholar] [CrossRef]
- Vigneault, C.; Amour, G..S.; Buckley, D.J.; Masse, D.I.; Savoie, P.; Tremblay, D. A trailer-mounted PTO torquemeter system. Can. Agric. Eng. 1989, 31, 89–91. [Google Scholar]
- Kornecki, T.S.; Reyes, M.R. Equipment Development for Small and Urban Conservation Farming Systems. Agriculture 2020, 10, 595. [Google Scholar] [CrossRef]
- Jiankang, W.; Mingliang, W.; Ping, J.; Songlin, S.; Fangping, X. Application of DC Electric Dynamometer in the PTO Power Test of Tractors. Int. Conf. Intell. Comput. Technol. Automation. IEEE 2011, 89–91. [Google Scholar] [CrossRef]
- Sumer, S.K.; Kocabiyik, H.; Say, S.M.; Cicek, G. Comparisons of 540 and 540E PTO operations in tractors through laboratory tests. lgarian J. Agric. Sci. 2010, 16, 526–533. [Google Scholar]
- Siddique, M.A.A.; Baek, S.; Baek, S.; Kim, W.; Kim, Y.; Kim, Y.; Lee, D.; Lee, K.; Hwang, J. Simulation of Fuel Consumption Based on Engine Load Level of a 95 kW Partial Power-Shift Transmission Tractor. Agriculture 2021, 11, 276. [Google Scholar] [CrossRef]
- Roeber, J.B.; Pitla, S.K.; Hoy, R.M.; Luck, J.D.; Kocher, M.F. Tractor Power Take-Off Torque Measurement and Data Acquisition System. Appl. Eng. Agric. 2017, 33, 679–686. [Google Scholar] [CrossRef] [Green Version]
- Yang, Z.H.; Song, Z.H.; Yin, Y.Y.; Zhao, X.Y.; Liu, J.H.; Han, J.G. Time domain extrapolation method for load of drive shaft of high-power tractor based on POT model. Trans. Chin. Soc. Agric. Eng. 2019, 35, 40–47. (In Chinese) [Google Scholar] [CrossRef]
- Wang, J.; Wang, N.; Wang, Z.; Zhang, Y.; Liu, L. Determination of the minimum sample size for the transmission load of a wheel loader based on multi-criteria decision-making technology. J. Terramech. 2012, 49, 147–160. [Google Scholar] [CrossRef]
- Wang, J.; Chen, H.; Li, Y.; Wu, Y.; Zhang, Y. A Review of the Extrapolation Method in Load Spectrum Compiling. Strojniški Vestnik-J. Mech. Eng. 2016, 62, 60–75. [Google Scholar] [CrossRef]
- Downing, S.D.; Socie, D.F. Simple rainflow counting algorithms. Int. J. Fatigue 1982, 4, 31–40. [Google Scholar] [CrossRef]
- Hong, N. A modified rainflow counting method. Int. J. Fatigue 1991, 13, 465–469. [Google Scholar] [CrossRef]
- Johannesson, P.; Thomas, J. Extrapolation of Rainflow Matrices. Extremes 2001, 4, 241–262. [Google Scholar] [CrossRef]
- Johannesson, P. Extrapolation of load histories and spectra. Fatigue Fract. Eng. Mater. Structures 2006, 29, 209–217. [Google Scholar] [CrossRef] [Green Version]
- Yan, X.H.; Zhou, Z.L.; Jia, F. Compilation and verification of dynamic torque load spectrum of tractor power take-off. Trans. Chin. Soc. Agric. Eng. 2019, 35, 74–81. (In Chinese) [Google Scholar] [CrossRef]
- Kiriliouk, A.; Rootzén, H.; Segers, J.; Wadsworth, J.L. Peaks over Thresholds Modeling with Multivariate Generalized Pareto Distributions. Technometrics 2019, 61, 123–135. [Google Scholar] [CrossRef] [Green Version]
- Zhao, X.; Zhang, Z.; Cheng, W.; Zhang, P. A New Parameter Estimator for the Generalized Pareto Distribution under the Peaks over Threshold Framework. Mathematics 2019, 7, 406. [Google Scholar] [CrossRef] [Green Version]
- Thompson, P.; Cai, Y.; Reeve, D.; Stander, J. Automated threshold selection methods for extreme wave analysis. Coast Eng. 2009, 56, 1013–1021. [Google Scholar] [CrossRef]
- G’Sell, M.G.; Wager, S.; Chouldechova, A.; Tibshirani, R. Sequential selection procedures and false discovery rate control. J. R. Stat. Soc. 2016, 78, 423–444. [Google Scholar] [CrossRef] [Green Version]
- Choulakian, V.; Stephens, M.A. Goodness-of-Fit for the Generalized Pareto Distribution. Technometrics 2001, 43, 478–484. [Google Scholar] [CrossRef]
- Langousis, A.; Mamalakis, A.; Puliga, M.; Deidda, R. Threshold detection for the generalized Pareto distribution: Review of representative methods and application to the NOAA NCDC daily rainfall database. Water Resour. Res. 2016, 52, 2659–2681. [Google Scholar] [CrossRef] [Green Version]
- Siddique, M.A.A.; Kim, W.; Kim, Y.; Kim, T.; Choi, C.; Lee, H.; Chung, S.; Kim, Y. Effects of Temperatures and Viscosity of the Hydraulic Oils on the Proportional Valve for a Rice Transplanter Based on PID Control Algorithm. Agriculture 2020, 10, 73. [Google Scholar] [CrossRef] [Green Version]
Figure 1.
Extrapolation process based on Peak Over Threshold theory.

Figure 2.
The time history of tractor power take-off (PTO) torque load after preprocessing.

Figure 3.
The comparison of original load time history and 10-times-extrapolated load time history.

Figure 4.
The structure principal diagram of tractor PTO loading test bench.

Figure 5.
The structure of PTO loading system.

Figure 6.
The principle of Fuzzy-Proportional-Integral-Derivative (Fuzzy-PID) controller.

Figure 7.
System simulation model.

Figure 8.
Comparison of rain flow matrixes: (a) original load; (b) 1-time extrapolated load.

Figure 9.
Simulation results of step response.

Figure 10.
Simulation results of load spectrum loading.

Figure 11.
The loading test site. (a) 37.5 kW motor; (b) universal joint connection shafts; (c) eddy current dynamometer.
Figure 11.
The loading test site. (a) 37.5 kW motor; (b) universal joint connection shafts; (c) eddy current dynamometer.

Figure 12.
Test results of the first 35s loading data.


Table 1.
Parameters of load spectrum acquisition test.
| Item | Parameter |
|---|---|
| Tractor type | TS404 |
| Manufacturer | Shandong Wuzheng Group Co., Ltd. (Rizhao, Shandong, China) |
| Test condition | Rotary tillage |
| Implement type | 1GLN-0145 |
| Tillage depth | 200 mm |
| Tillage width | 1800 mm |
| Average operating speed | 7.3 km/h |
| Torque sampling frequency | 20 Hz |
| Torque sampling duration | 900 s |
Table 2.
Generalized Pareto Distribution (GPD) fitting result.
| Threshold | Shape Parameters | Scale Parameters |
|---|---|---|
| 419.00 | −0.4737 | 25.858 |
| 97.50 | −0.6776 | 23.486 |
Table 3.
The fuzzy rules of ΔKp, ΔKi, and ΔKd.
| ΔKp/ΔKi/ΔKd | EC | |||||||
|---|---|---|---|---|---|---|---|---|
| NB | NM | NS | ZO | PS | PM | PB | ||
| E | NB | PB/NB/PS | PB/NB/NS | PM/NM/NB | PM/NM/NB | PS/NS/NB | ZO/ZO/ZO | ZO/ZO/PS |
| NM | PB/NB/PS | PB/NB/NS | PM/NM/NB | PS/NS/NM | PS/NS/NM | ZO/ZO/NS | NS/ZO/ZO | |
| NS | PM/NB/ZO | PM/NM/NS | PM/NS/NM | PS/NS/NM | ZO/ZO/NS | NS/PS/PS | NS/PS/ZO | |
| ZO | PM/NM/ZO | PM/NM/NS | PS/NS/NS | ZO/ZO/NS | NS/PS/NS | NM/PM/NS | NM/PM/ZO | |
| PS | PS/NM/ZO | PS/NS/ZO | ZO/ZO/ZO | NS/PS/ZO | NS/PS/ZO | NM/PM/ZO | NM/PS/ZO | |
| PM | PS/ZO/PB | ZO/ZO/NS | NS/PS/PS | NM/PS/PS | NM/PM/PS | NM/PB/PS | NB/PB/PB | |
| PB | ZO/ZO/PB | ZO/ZO/PM | NM/PS/PM | NM/PM/PM | NM/PM/PS | NB/PB/PS | NB/PB/PB | |
Table 4.
Analysis of GPD fitting results.
| Item | Upper Threshold | Lower Threshold |
|---|---|---|
| Threshold | 419.00 | 97.50 |
| Shape parameter | −0.4737 | −0.6776 |
| Scale parameter | 25.858 | 23.486 |
| Standard deviation of Shape parameter | 0.0781 | 0.0626 |
| Standard deviation of Scale parameter | 2.8676 | 1.9804 |
| K-S statistic value | 0.9762 | 0.7082 |
| Chi-square statistic | 0.4427 | 0.6818 |
| Correlation coefficient | 0.9913 | 0.9971 |
| Goodness of fit | 2.8676 | 1.9804 |
Table 5.
Statistical characteristics of power take-off (PTO) load spectrum after extrapolation.
| Extrapolation Factor | Data Volume | Maximum Value/(N·m) | Minimum Value/(N·m) | Mean Value/(N·m) | Standard Deviation/(N·m) | Variance /(N·m)2 |
|---|---|---|---|---|---|---|
| Load sample | 17892 | 469.50 | 63.24 | 211.78 | 70.73 | 5050.22 |
| After pre-processing | 12743 | 469.50 | 63.24 | 222.18 | 70.74 | 5003.93 |
| 1 time | 12743 | 464.26 | 63.02 | 215.79 | 70.76 | 5006.91 |
| 10 times | 127430 | 471.78 | 61.89 | 215.81 | 70.74 | 5004.35 |
| 131 times | 1669333 | 475.18 | 60.88 | 216.54 | 70.73 | 5003.33 |
Table 6.
The parameters of the test equipment.
| Item | Parameter |
|---|---|
| Manufacturer | Lu’an Yisheng Motor Co., Ltd. (Wenling, Zhejiang, China) |
| Model | YVP-225S-8 |
| Power | 37.5 kW |
| Rated voltage | 380 V |
| Rated speed | 1000 r·min−1 |
| Rated torque | 356 N·m |
| Maximum torque | 523 N·m |
| Transmission ratio | 1:2.78 |
Publisher’s Note: MDPI stays neutral with regard to jurisdictional claims in published maps and institutional affiliations. |
© 2021 by the authors. Licensee MDPI, Basel, Switzerland. This article is an open access article distributed under the terms and conditions of the Creative Commons Attribution (CC BY) license (https://creativecommons.org/licenses/by/4.0/).
Share and Cite
MDPI and ACS Style
Wang, Y.; Wang, L.; Zong, J.; Lv, D.; Wang, S. Research on Loading Method of Tractor PTO Based on Dynamic Load Spectrum. Agriculture 2021, 11, 982. https://0-doi-org.brum.beds.ac.uk/10.3390/agriculture11100982
AMA Style
Wang Y, Wang L, Zong J, Lv D, Wang S. Research on Loading Method of Tractor PTO Based on Dynamic Load Spectrum. Agriculture. 2021; 11(10):982. https://0-doi-org.brum.beds.ac.uk/10.3390/agriculture11100982
Chicago/Turabian StyleWang, Yu, Ling Wang, Jianhua Zong, Dongxiao Lv, and Shumao Wang. 2021. "Research on Loading Method of Tractor PTO Based on Dynamic Load Spectrum" Agriculture 11, no. 10: 982. https://0-doi-org.brum.beds.ac.uk/10.3390/agriculture11100982
Note that from the first issue of 2016, this journal uses article numbers instead of page numbers. See further details here.