Article

Physiological Screening for Drought Tolerance Traits in Vegetable Amaranth (Amaranthus tricolor) Germplasm

1
Future Food Beacon, School of Biosciences, University of Nottingham Malaysia, Jalan Broga, Semenyih 43500, Selangor, Malaysia
2
Plant and Crop Sciences, Biosciences, University of Nottingham, Sutton Bonington Campus, Loughborough LE12 5RD, UK
3
Crops for the Future (UK) CIC, NIAB, 93 Lawrence Weaver Road, Cambridge CB3 0LE, UK
4
School of Biological and Environmental Sciences, Liverpool John Moores University, Byrom St, Liverpool L3 3AF, UK
*
Author to whom correspondence should be addressed.
Submission received: 8 September 2021 / Revised: 7 October 2021 / Accepted: 9 October 2021 / Published: 13 October 2021

Abstract

:
Amaranth (Amaranthus tricolor), an underutilized climate smart crop, is highly nutritious and possesses diverse drought tolerance traits, making it an ideal crop to thrive in a rapidly changing climate. Despite considerable studies on the growth and physiology of plants subjected to drought stress, a precise trait phenotyping strategy for drought tolerance in vegetable amaranth is still not well documented. In this study, two drought screening trials were carried out on 44 A. tricolor accessions in order to identify potential drought-tolerant A. tricolor germplasm and to discern their physiological responses to drought stress. The findings revealed that a change in stem biomass was most likely the main mechanism of drought adaptation for stress recovery, and dark-adapted quantum yield (Fv/Fm) could be a useful parameter for identifying drought tolerance in amaranth. Three drought tolerance indices: geometric mean productivity (GMP), mean productivity (MP) and stress tolerance index (STI) identified eight drought-tolerant accessions with stable performance across the two screening trials. The highly significant genotypic differences observed in several physiological traits among the amaranth accessions indicate that the amaranth panel used in this study could be a rich source of genetic diversity for breeding purposes for drought tolerance traits.

1. Introduction

Drought is a major abiotic stress that hampers crop yields worldwide [1,2]. This affects the food and nutrition security of more than 1.1 billion people in South Asia and Sub-Sharan Africa who are largely dependent on the agricultural sector for income generation [3,4,5]. Recently, a paradigm shift in agriculture systems toward greater sustainability has offered utilization of a wider range of crop species that match prevailing climates [6,7]. In this context, amaranth, an ancient climatic smart crop, offers an alternative cheap source of nutrition for future food and nutrition security. Amaranth belongs to the Amaranthaceae family and is composed of 60–70 diverse species ranging from cultivated pseudo-cereal and vegetable crops to the world’s worst weeds [8]. The leafy vegetable amaranth species, Amaranthus tricolor, is widely cultivated in Southeast Asia and Africa, providing an excellent source of macro- and micronutrients such as protein, lysine vitamin C and iron, greater than other leafy vegetables such as lettuce and spinach [9].
A. tricolor possesses important traits such as resistance to drought, is highly nutritional and is very genetically diverse [10,11,12]. Partly because of its C4 photosynthetic pathway, which is more common in grasses but rare in dicots [13], amaranth can maintain CO2 fixation and water use efficiency during drought stress [12,14,15,16]. Amaranth is phenotypically plastic and has the capacity to change its phenotype in response to drought stress, for example increasing chlorophyll and betacyanin content [17], exhibiting an indeterminate flowering habit and growing an extensive lateral root system [18]. Other studies have reported increasing proline content that activates antioxidizing enzymes to scavenge reactive oxygen species in amaranth under water stress [16,19,20]. Several studies have generated valuable data on the growth and physiology of the plants upon drought stress [14,15,21,22,23,24,25,26,27], nevertheless, suitable rapid screening protocols for drought tolerance in amaranth germplasm are still not well documented.
Understanding the genetic basis of phenotypic differences in vegetable amaranth in response to water deficit is crucial if new cultivars are to be developed. It is important to explore multiple factors that are involved in drought stress before establishing a reliable screening method for a large-scale selection or for breeding stock. This is due to the requirement for large space, time-consuming selection, and expensive and inadequate seed availability of certain genotypes in early generations [28]. The key criteria for the development of rapid screening methods are that the technique used must be capable of evaluating plant performance at critical stages of development, must use a small amount of plant material and must be able to screen large number of plant varieties in as short a time as possible [29]. It is well known that development of tolerant cultivars is difficult, primarily due to environmental variations which make stress highly variable to observe [30]. Several studies have suggested a complementary strategy for selection of tolerant genotypes through correlations between yield and yield-related traits as a surrogate measure [31]. Drought tolerance indices are used to quantify the level of drought tolerance of a genotype based on yield loss under drought condition compared to normal conditions [32,33,34]. Typically, selection should target genotypes with relatively high yield under normal and drought stress conditions [32].
The principal approach for identifying A. tricolor with superior drought tolerance traits is to exploit the diverse genetic resources available within the amaranth germplasm. Although ex-situ conservation of A. tricolor has been improved and genetic variability in agronomical traits has been characterized [35,36,37,38,39,40], the utilization mainly depends on resources available in the selected germplasm. Therefore, this study aimed to identify potential drought-tolerant A. tricolor germplasm from diverse geographical origins and to discern their physiological attributes to drought stress. Forty-four A. tricolor accessions were screened in two screening trials to discern a rapid screening protocol for drought stress. From this, suitable drought tolerance indices and possible surrogate traits were elucidated. Furthermore, eight A. tricolor accessions were identified with superior drought tolerance traits.

2. Materials and Methods

2.1. Plant Materials

In total, 44 A. tricolor accessions were selected for trait phenotyping (Table 1). Twenty-one accessions were obtained from World Vegetable Center Genebank, Taiwan (AVRDC), nineteen accessions from the United State Department of Agriculture Genebank (USDA) and four commercial varieties were included as checks, of which two local varieties were from Malaysia and two African varieties were from East-West Seed, Thailand. Two accessions entries, 22 and 23, were excluded from the analysis as the plants died at an early stage of drought stress.

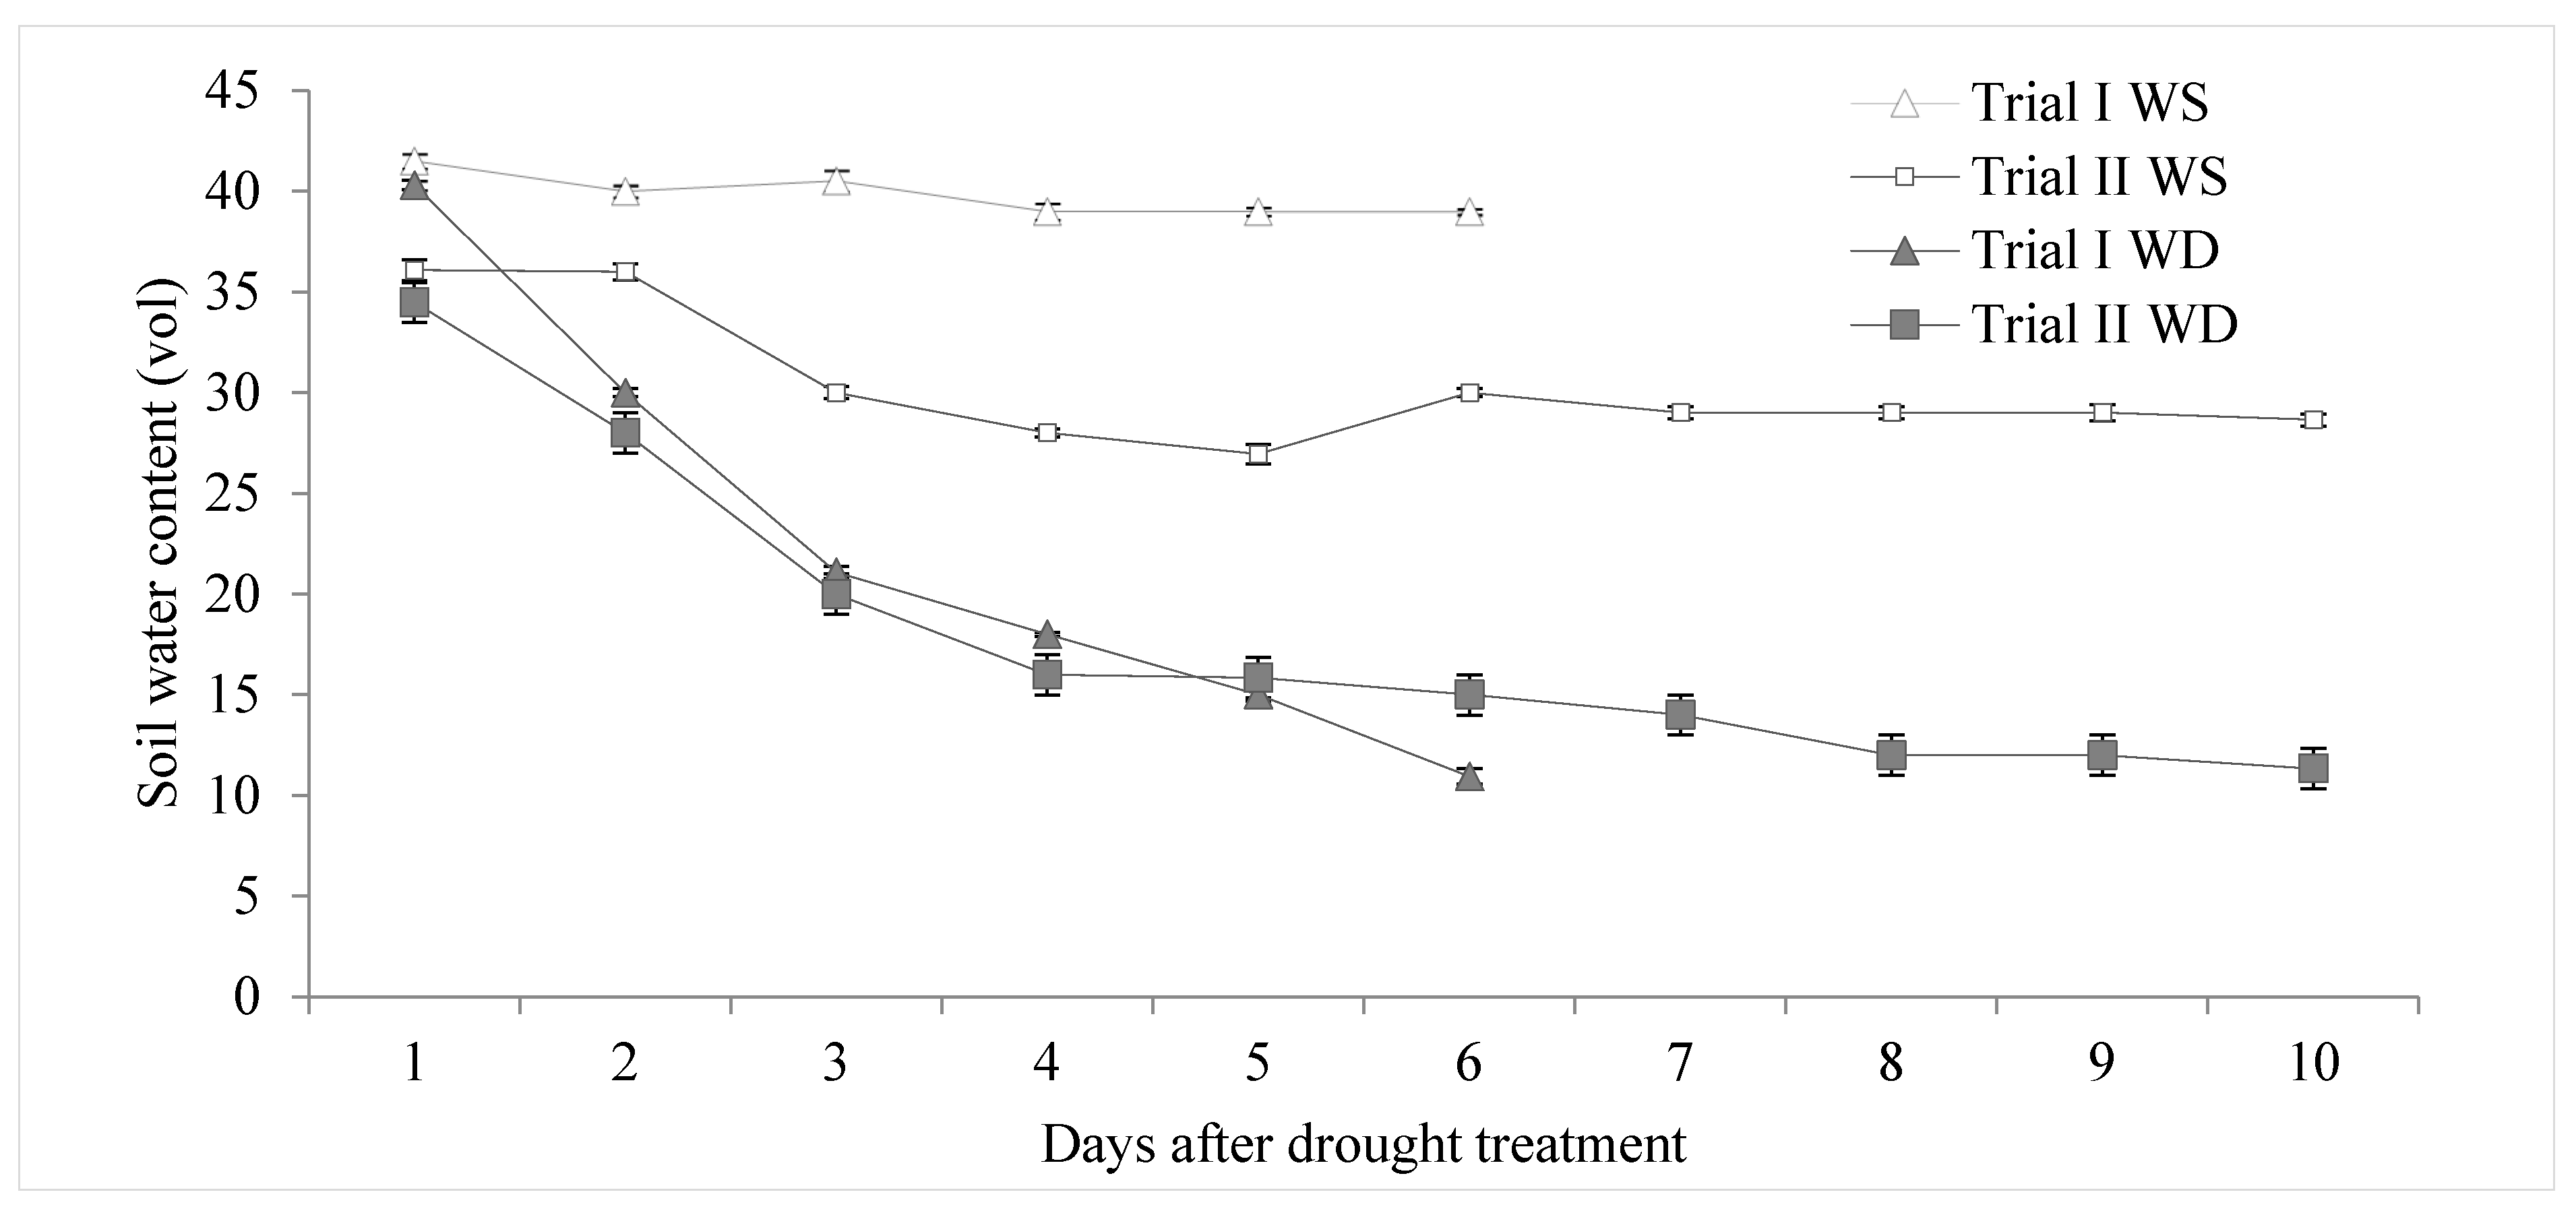
2.2. Water Treatments, Experimental Design and Growing Conditions

Single-seed descent of 44 A. tricolor accessions were grown in two separate trials: Trial I and Trial II under shade-house conditions at University of Nottingham Malaysia (latitude 2.940° N, longitude 101.8740° E). Seedlings were sown in black peat moss (Holland, Malaysia) in 14 × 10 cell trays (54 cm × 36 cm), and after 14 days of emergence plants were transplanted into plastic pots (16 cm × 12.5 cm × 14.5 cm), with one plant per pot. The soil used was a mixture of 40% clay, 50% sand and 10% silt, and was first dried out and sieved (0.5 cm × 1 cm) to obtain a 2 kg uniform soil bulk density. The plants were watered daily and five days after transplanting, 5 g of fertilizer (15N:15P:15K) was applied once during the establishment period.
Two water treatments, controlled (water-sufficient, WS) and drought stress (water-deficient, WD), were imposed at the vegetative growth phase once the plant had 5–7 mature leaves, in a split-plot randomized design with three replications in Trial I and four replications in Trial II. Each replicate (block) consisted of two whole-plots (WS and WD treatments) and within the whole-plot there were sub-plots (44 A. tricolor accessions). The drought treatments were imposed at 25 days post emergence in Trial I and 28 days after emergence in Trial II. The WS plants were watered daily throughout the experimental period to maintain maximum water holding capacity (100% WHC), while WD plants were subjected to progressive soil drying with an additional 100mL watered at a one-day interval to maintain consistent soil moisture. Soil moisture content was measured at the beginning of the water treatment (0 DAT) and every 3 days in Trial I and every 5 days in Trial II until the soil water reduced to terminal drought stress at 20% WHC. The volumetric soil water content was determined using a portable soil moisture sensor (ML3-ThetaProbe, Delta-T Device, Cambridge, England) (Figure 1). The minimum and maximum temperature, humidity and photosynthetic active radiation during drought treatment were recorded from 7 a.m. to 7 p.m. using a data logger (HOBO ® U30 Weather Station, MA, USA). The averaged PAR and temperature were PAR: 309.8–616.9 µM/m2s; temperature: 30.3–33.1 °C, and RH: 61.0–74.8% for Trial 1 and PAR: 147.8–531.09 µM/m2s; temperature: 26.6–32.7 °C; and RH: 62.2–88.5% for Trial 2. The onset of drought and the rate of soil depletion were more rapid in Trial I (6 days) compared to Trial II (10 days).
An additional three biological replicates from each accession were arranged in a completely randomized design and subjected to rewatering assessment. These plants were subjected to progressive soil drying without irrigation until they reached terminal wilting point (10% WHC) before being rewatered to full soil water capacity for five days.

2.3. Plant Physiological Parameters

The water status of the plants was evaluated by measuring relative water content (RWC) at 100% WHC and 20% WHC in Trial I (n = 3) and 100% WHC, 50% WHC and 20% WHC in Trial II (n = 4). Two fully expanded leaflets were excised (2 cm × 2 cm sections) and fresh weight (FW) was recorded immediately. The leaf sample was then immersed in distilled water for 24 h in the dark at room temperature to obtain turgid weight (TW). The leaf sample was then oven dried for 24 h at 80 °C and weighed to determine the dry weight (DW). RWC was calculated using formula as described in [41]:
RWC (%) = [(FW-DW)/(TW-DW)] × 100
Chlorophyll a fluorescence parameters, dark-adapted Fv/Fm (maximum quantum efficiency of PSII photochemistry), and Fv’/Fm’ (the maximum efficiency of PSII photochemistry, in the light, if all centers are open) were recorded using a handheld fluorometer FluorPen FP100 (Photon Systems Instruments, Czech Republic). The leaves were dark acclimated for 20 min using blackout paper before Fv/Fm measurements were taken on the third most fully expanded leaflet, avoiding the midrib section (Trial II: 100%, 50%, 20% WHC) at pre-dawn (7 a.m.). Fv’/Fm’ measurement was determined on the same leaf forTrial I: 100%, 20% WHC (n = 3) and Trial II: 100%, 50%, 20% WHC (n = 4) between 10 a.m. and 11 a.m. in sunny conditions (average PAR 450–500 nm. Two readings were taken per leaf, with two leaves per plant averaged to give a final reading. The equation for quantum yield under light and dark adaptations were calculated based on [42] as follows:
Fv’/Fm’ = (Fm’ − Fo’)/Fm’
Fv/Fm = (Fm − Fo)/Fm
where Fv’ is variable fluorescence, Fm’ is maximal fluorescence and Fo’ is minimal fluorescence under light adaptation. Fv is variable fluorescence, Fm is maximal fluorescence and Fo is minimal fluorescence under dark adaptation.
Photosynthetic leaf gas exchange was only measured in Trial II (100% and 50% WHC, n = 4), using a portable photosynthetic system (LI-6400, LI-COR, Inc., Logan, NE, USA) coupled with a standard red/blue LED broadleaf cuvette (6400-02B, LI-COR, Inc., Logan, NE, USA) and a CO2 mixer (6400-01, LI-COR, Inc., Logan, NE, USA). Readings were taken on the third most fully expanded leaf with the leaf chamber (2 cm × 3 cm) set to 400 μmolmol–1CO2 concentration, 1500 µmolphotonm−2s−1 photosynthetically active radiation (PAR), 35 °C leaf block temperature, 400 μmolmol–1 flow rate and 50–70% relative humidity to keep the vapor pressure deficit (VPD) in the leaf chamber at approximately 1–1.5 kPa. Photosynthetic rate (Pn), stomatal conductance (Gs), intercellular CO2 concentration (Ci) and transpiration rate (E) were recorded once a steady state was obtained (around 2 to 4 min). The measurements were used to calculate instantaneous water use efficiency (WUE) [43], intrinsic water use efficiency (WUEi) and stomatal limitation value (Ls) [44] as follows:
WUE (μmolmol−1) = Pn (µmolCO2m−2s−1)/E (mmolH2Om−2s−1)
WUEi (μmolmmol−1) = Pn (µmolCO2m−2s−1)/(Gs molH2Om−2s−1)
Stomatal limitation = 1 – [Ci (µmolCO2mol−1)/Ca (µmolCO2mol−1)]
where Ca is ambient CO2 concentration.

2.4. Total Yield and Leaf and Stem Biomass Partitioning

Plant yield was obtained once the soil water status of WD plants fell to 20% WHC, at 6 DAT in Trial I (n = 3) and 10 DAT in Trial II (n = 4). Plants were harvested and separated into leaves and stems, and leaf and (LFW) stem fresh weights (SFW) were recorded. Total leaf area (TLA) was measured using a LI-3100 Area Meter (LICOR, Lincoln, Nebraska, USA). Dry weights were determined after drying at 80 °C in an oven for 72 h, and dry weight of leaf (LDW) and stem (SDW) were recorded. Yield and specific leaf area (SLA) were then calculated using the following formula:
SLA = TLA (cm2)/Leaf dry weight (g)
Yield = Leaf fresh weight (g) + Stem fresh weight (g)

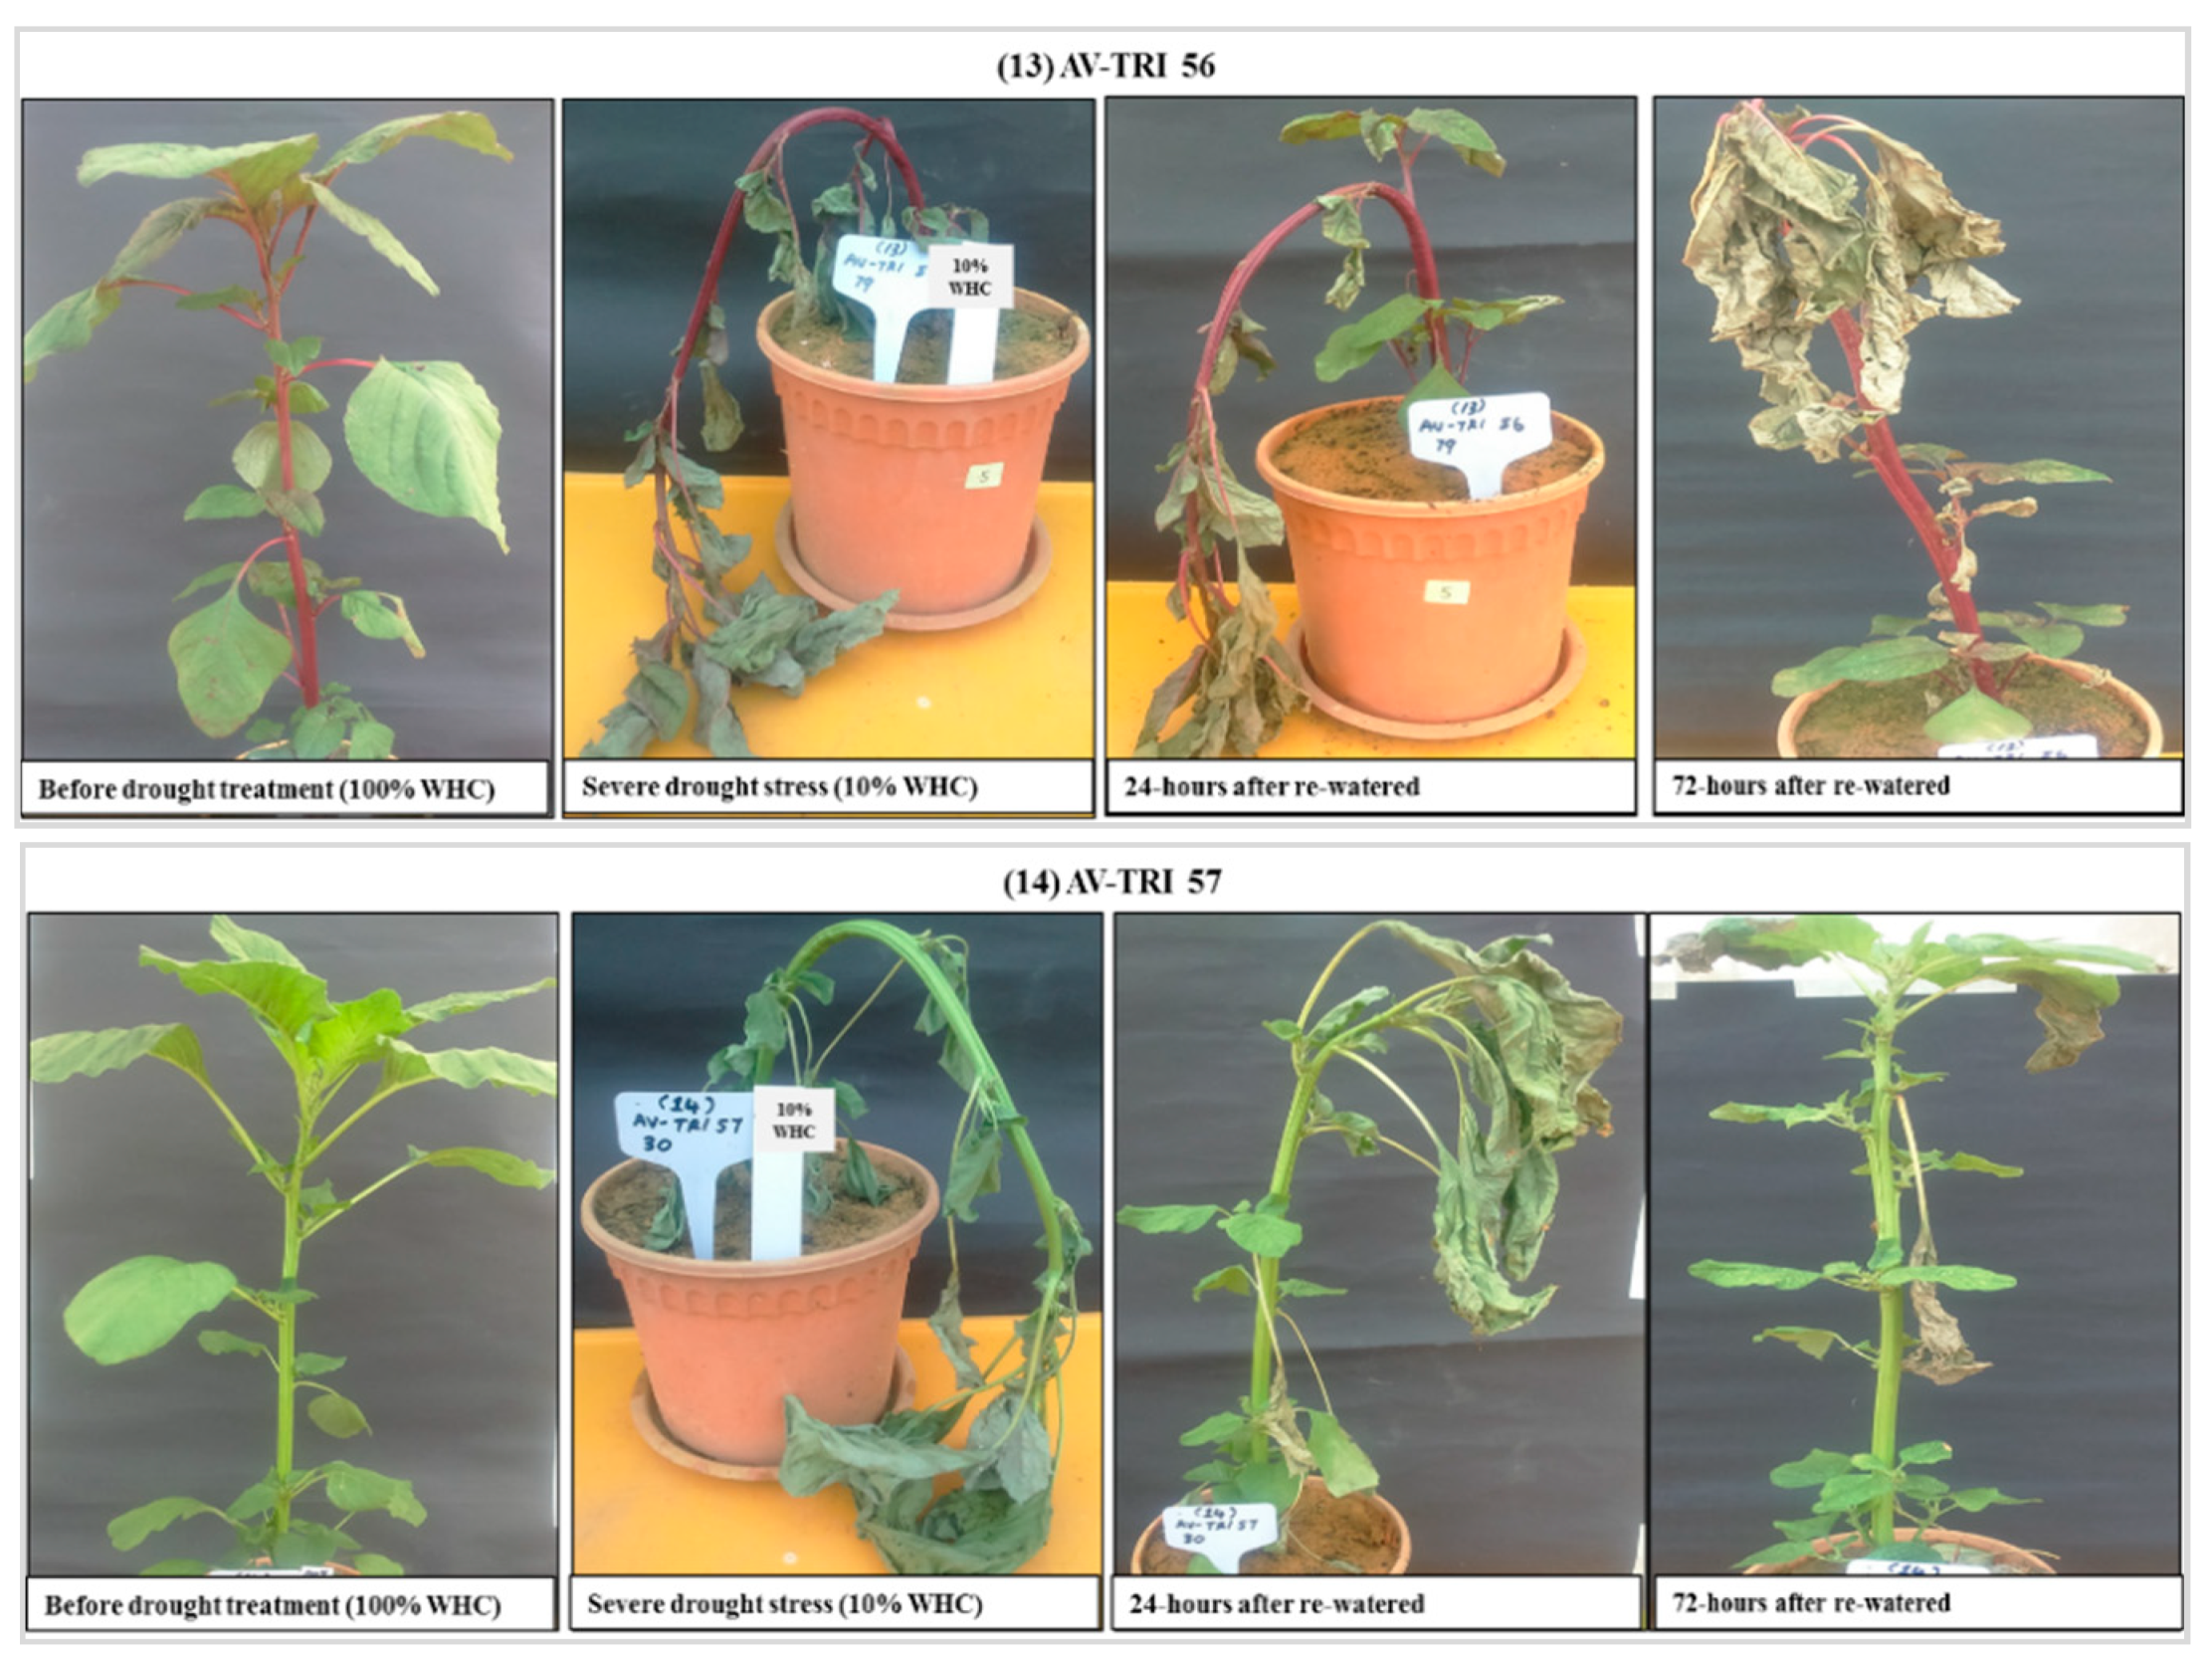
2.5. Rewatering Assessments

Days to flowering (DTF) and days to wilting (DTW) were recorded, pre-dawn from day 1 of soil drying (n = 3). All the plants were rated for leaf wilting scoring (LWS) and drought tolerance symptoms (DS) (Supplementary Figure S1) at the same time as DTW was recorded. The LWS and DS scoring on a scale of 0–5 and 0–6, respectively, with 0 = healthy and higher score being more severe. Days to recovery (DTR) were obtained after the plants were rewatered at 10% WHC for 5 days. DS were recorded twice, first during the day of DTR were observed and second on the 5th day of recovery.

2.6. Drought Tolerance Indices

Seven stress indices were evaluated to identify a suitable criterion for screening drought-tolerant accessions based on yield comparisons under WS and WD conditions. The drought tolerance indices were calculated using the following formula:
Stress susceptibility index [45],
SSI = [1- (Ysi/Ypi)]/SI
Stress tolerance index [32],
STI = (Ypi x Ysi)/Yp2
Drought resistance index [46],
DI = [Ysi x (Ysi/Ypi)]/Ys
Tolerance index [47],
TOL = Ypi − Ysi
Geometric mean productivity [32],
GMP = √(Ypi x Ysi)
Mean productivity [47],
MP = (Ypi + Ysi)/2
Yield stability index [48],
YSI = Ysi/Ypi
where Ysi is yield of accession in WD condition, Ypi is yield of accession in WS condition, SI is stress intensity = 1 − (Ys/Yp), Ys is total yield mean in WD condition and Yp is total yield mean in WS condition.

2.7. Statistical Analysis

The interaction of accessions and water treatments across the two trials on the growth and plant physiological responses of amaranth accessions were analyzed using restricted maximum likelihood (REML). The data obtained from the two trials were averaged, and combined analysis of variance was performed using Wald-statistics following a test of homogeneity of variances by keeping water treatments x accessions (WT × A) as fixed effects and Trials × WT × A as random effects.
One-way ANOVA with a split plot design was used to investigate the effect of plant growth and physiology under WS and WD conditions and rewatering assessment. Pearson linear correlations, principal component analysis (PCA) and biplots were performed to analyze the significant correlations between trait parameters. Hierarchical clustering was generated using Manhattan distance to classify tolerance ranking via average linkage method. All data were generated using Genstat Software for Windows 18th edition (VSN International, 2015).

3. Results

3.1. Combined Analysis of Water Treatment, Accession and Trial Environments on Growth and Plant Physiology

The data in Table 2 summarizes the estimates of treatment effects from restricted REML combined analysis for the growth and physiological traits of amaranth accessions evaluated across the two trials. Significant interactions between water treatment and accession were observed across the two trials for yield (p < 0.001), TLA (p < 0.001), RWC at 20% WHC (p < 0.05) and Fv’/Fm’ at 100% WHC (p < 0.01). There were significantly higher relative reductions observed for yield and physiological traits in Trial I than Trial II as the severity of drought stress increased. The mean of each accession for yield and physiological parameters are presented in Supplementary Table S1.

3.2. Genotypic Variations in Growth and Plant Physiology in Response to Drought Stress

3.2.1. Yield and Biomass Partitioning

The mean yield of amaranth accessions was higher in Trial II with an average yield of 48.11 g under WS condition and 33.24 g under WD condition compared to Trial I with 15.78 g and 4.21 g, respectively, however both trials showed a significant reduction under WD (Table 3). There were significant genotypic differences observed in fresh weight biomass partitioning between the leaf and stem among the amaranth accessions in both WS and WD conditions, and drought stress had shifted the fresh weight allocation primarily into stems (p < 0.01). Meanwhile, the SDW was not affected by the drought stress in Trial I or Trial II, although significant changes were observed in SFW in WS and WD conditions.

3.2.2. Relative Water Content

RWC expressing leaf turgor significantly reduced with soil drying (p < 0.001) (Table 4). RWC reduced rapidly from 90% to 61% at terminal drought stress in Trial I, while reductions of RWC were slightly slower in Trial II, with the leaf water status declining from 90% to 83% to 76% at terminal drought stress. Significant genotypic differences were observed among amaranth accessions at 100% WHC in Trial I, and at 50% WHC (p < 0.01) and 20% WHC (p < 0.001) in Trial II.

3.2.3. Chlorophyll Fluorescence

The efficiency of PSII photochemistry, Fv/Fm and Fv’/Fm’ were not affected by soil drying (Table 4). Nevertheless, genotypic differences were observed among amaranth accessions for Fv/Fm and Fv’/Fm’ (p < 0.05) under drought stress in both Trials. The Fv’/Fm’ was significantly higher during Trial I (0.65) compared to Trial II (0.54), and the value declined as the plant increased in size. The decreasing trend also was also observed in Fv/Fm value from 100% to 50% and 20% WHC under WS (0.72, 0.67, 0.64, respectively) and WD conditions (0.72, 0.67, 0.64, respectively) throughout the experimental period.

3.2.4. Leaf Gas Exchange

The efficiency of photosynthetic activity was not influenced by the drought stress, but significant interactions between water treatment and accession were observed for all photosynthetic parameters (p < 0.01) (Table 5). This may imply that amaranth accessions have different adjustments in photosynthetic activity in response to drought stress, as shown by the significant genotypic differences exhibited among amaranth accessions at 100% WHC and at 50% WHC under WS and WD conditions. As the water treatment progressed, the majority of the photosynthetic activity was significantly reduced, including Pn (from 29.13 at 0 DAT to 19.07–19.30 µmolCO2m−2s−1 at 6 DAT), Gs (from 0.19 to 0.12–0.13 molH2Om−2s−1), Ci (from 110.4 to 95.78–108.5 µmolCO2mol−1), E (from 4.51 to 3.17–3.48 mmolH2Om−2s−1) and WUE (from 6.65 to 6.13–6.35 μmol mol−1), while WUEi and Ls significantly increased (from 163.3 to 170.3–176.5 μmol mmol−1, from 0.71 to 0.72–0.75 respectively) in both WS and WD conditions.

3.3. Genotypic Variation in Drought Adaptability and Recovery

Amaranth displayed significant variation in drought adaptability and recovery during rewatering assessment, as shown in DTF (p < 0.001) and DTR (p < 0.001) (Table 6). The plants exhibited tolerance through longer days to wilting (range 1–8 days) while initiating early flowering (range 1–4 days) and recovered instantly once rewatered (range 1–6 days). Although there was no significant difference in LWS, the majority of accessions wilted into a V-shape or U-shape leaf and displayed symptoms such as slight tip drying in early response to drought stress (Figure 2). Upon rewatering, most of the amaranth accessions had at least five leaves senescence, and more branches grew along the stem while accessions 12, 14, 15 31 and 32 died five days after rewatering. The mean of each accession for rewatering assessment is presented in Supplementary Table S2.

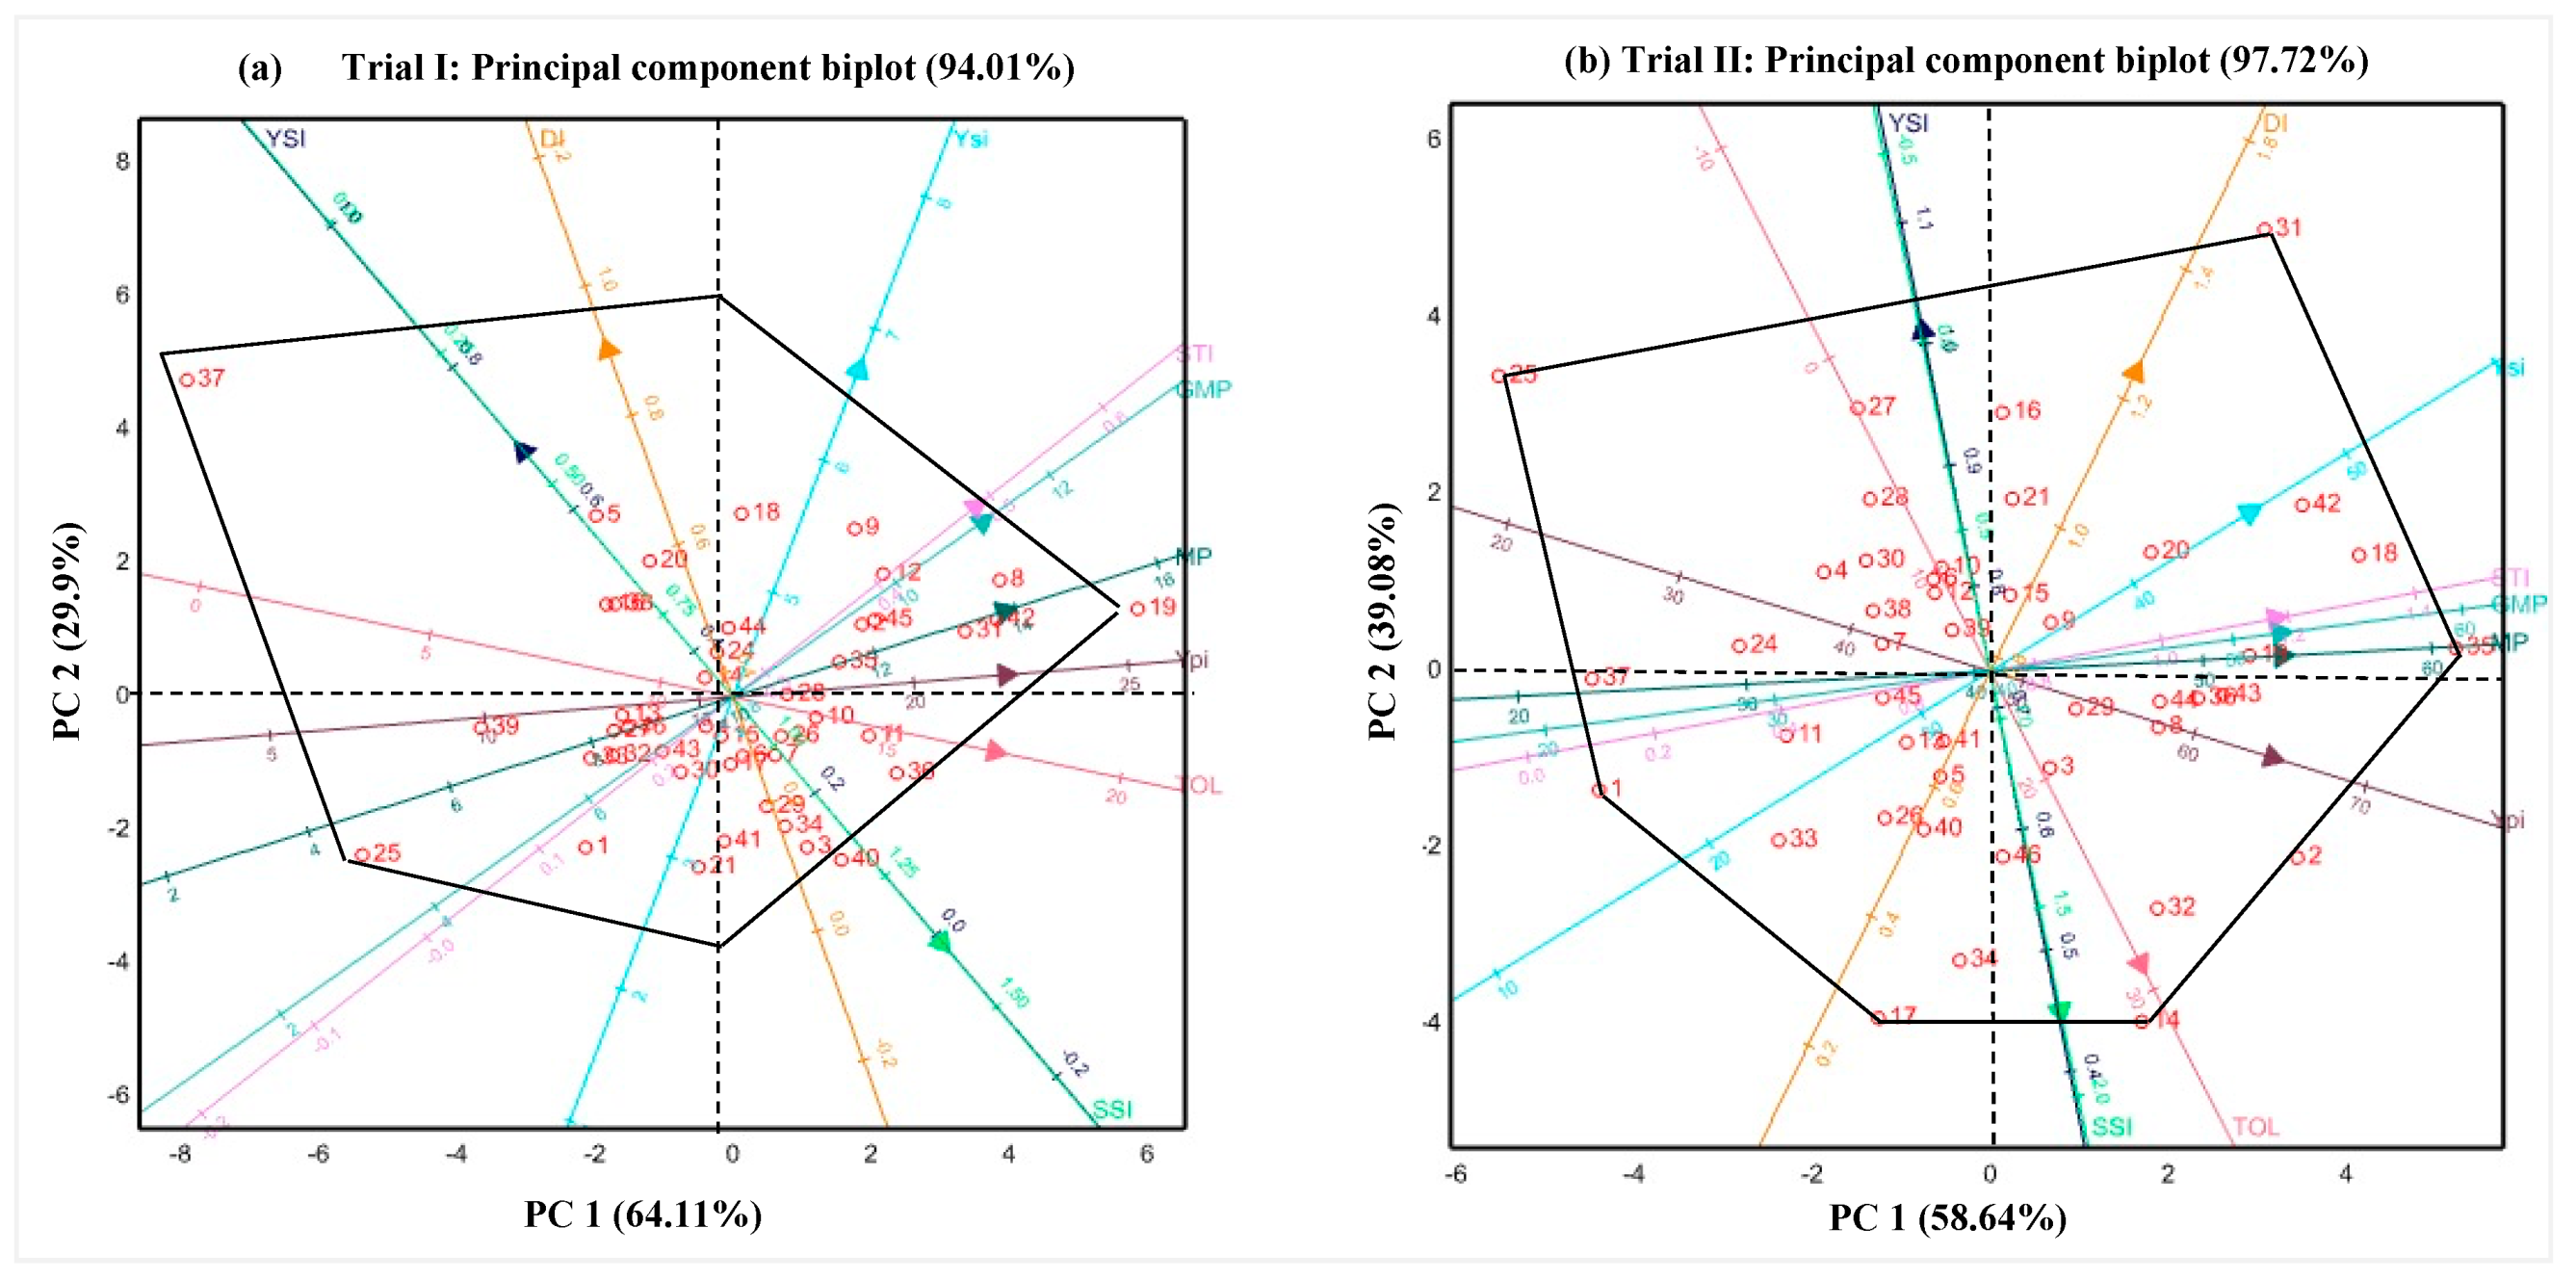
3.4. Interrelationship between Growth, Physiological Traits and Drought Adaptability

PCA biplot analysis was used to identify a combination of indices that may provide a useful criterion for improving drought resistance in amaranth (Figure 3a,b). In Trial I, PC1 accounted for 64% of the variations in Yp, Ys, GMP, MP and STI and PC2 accounted for 30% total variations in DI and YSI (Figure 3b). In Trial II, PC1 accounted for 45% variations in Ys, DI, GMP, MP and STI and PC2 accounted for 39% of variation in YSI (Figure 3b). Smaller angles between dimension vectors in the same direction indicate high correlation of the variable traits in terms of discriminating accessions. Therefore, high yielding accessions in both WS and WD conditions can be obtained based on positive and high PC1 on the biplot (such as accession entries 8, 19, 31, 42 in Trial I and 18, 19, 35 in Trial II). Meanwhile, high yielding accession in WD but low in WS conditions can be obtained based on positive and high values of PC2 (such as accession entry 5, 20, 37 in Trial I; and entry 25 and 2 in Trial II).
The Correlation coefficients for growth and physiological traits in WS and WD conditions for Trial I, Trial II and the rewatering assessment are summarized in Supplementary Table S3a–c. Physiological traits with consistent association with growth traits which include LFW, LDW, SFW, SDW, TLA and SLA under WS and WD conditions and can be considered as possible surrogate traits for drought tolerance. In Trial I, Fv’/Fm’ was positively correlated with TLA (WS: R = 0.27, p < 0.001; WD: R = 0.20, p < 0.05 at 100% WHC) and SLA (WS: R = 0.26, WD: R = 0.33, p < 0.001 at 20% WHC), but negatively correlated with SFW (WS: R = −0.26; WD: R = −0.08, p < 0.001 at 20% WHC). This implies that high Fv’/Fm’ efficiency may promote leaf expansion, but restrict stem growth and contribute less to the total leaf biomass.
In Trial II, Fv/Fm exhibited a negative influence on yield in all soil water conditions, although significant negative correlation was only displayed at 50% WHC in WS (R = −0.19, p < 0.01) and WD conditions (R = 0.35, p < 0.001). This association was influenced by restricted leaf growth as shown by the negative correlation between Fv/Fm at 50% WHC with LFW and TLA in WS (R = −0.25, p < 0.001; R = −0.22, p < 0.01, respectively) and WD conditions (R = −0.31, p < 0.001; R = −0.34, p < 0.001). RWC at 50% WHC was positively correlated with LDW (WS: R = 0.23, p < 0.05, WD: R = 0.27, p < 0.01) and TLA (WS: R = 0.17, p < 0.05, WD: R = 0.29, p < 0.05, respectively), demonstrating that leaf cell turgor increased with increased leaf size and weight.
In the rewatering assessment, DTW was negatively correlated with stem traits (SDW: R = −0.21, p < 0.05), which revealed amaranth accessions with higher stem biomass wilting rapidly with declining soil water. DTW was also significantly influenced by E at 100% WHC (R = 0.25, p < 0.01), Gs at 50% WHC (R = 0.22, p < 0.01), RWC at 20% WHC (R = 0.24, p < 0.05), and WUE at 100% WHC (R = −0.22, p < 0.05). Meanwhile, DTF was significantly influenced by leaf traits (LFW, LDW and TLA: R > 0.20, p < 0.05), suggesting that higher leaf biomass delayed flowering during drought stress. DTR was negatively associated with both leaf traits (LFW, LDW and TLA: R > −0.27, p < 0.05) and stem traits (SFW: R = −0.21, p < 0.05), demonstrating that higher yield amaranth accessions under drought stress were able to recover immediately upon rewatering.

3.5. Selection of Drought Tolerance Indices

The stress intensity of Trial I (0.73) was significantly more severe than that of Trial II (0.31), and significant differences were observed for GMP, MP and STI (p < 0.05) in Trial I and Trial II (Supplementary Table S4a,b). The mean comparisons between accessions were determined for each tolerance index (Supplementary Table S4a). Correlation coefficients conducted between indices and yield under WS (Yp) and WD conditions (Ys) demonstrated that Yp was not associated with Ys (R = 0.12, p > 0.05) in Trial I, demonstrating that high yielding accessions under WS condition did not produce high yield under WD conditions. Meanwhile, Yp was strongly associated with Ys (R = 0.51, p < 0.01) in Trial II, indicating that high yielding accessions under WS condition also have high yield under WD conditions. Nonetheless, several indices showed consistent association with Yp and Ys in both trials, in which GMP, MP and STI were positively correlated with Yp and Ys (R > 0.50, p < 0.001), demonstrating that these indices could discriminate amaranth accessions with high yield under both WS and WD conditions. Meanwhile, SSI was positively correlated with Yp but negatively correlated with Ys (R > 0.20, p < 0.001), indicating that SSI could identify accessions with high yield in WS conditions but low yield in WD conditions. In contrast, YSI was positively correlated with Ys but negatively correlated with Yp (R > 0.20, p < 0.01), showing that YSI will provide accessions with low yield in WS condition but high yield in WD conditions.

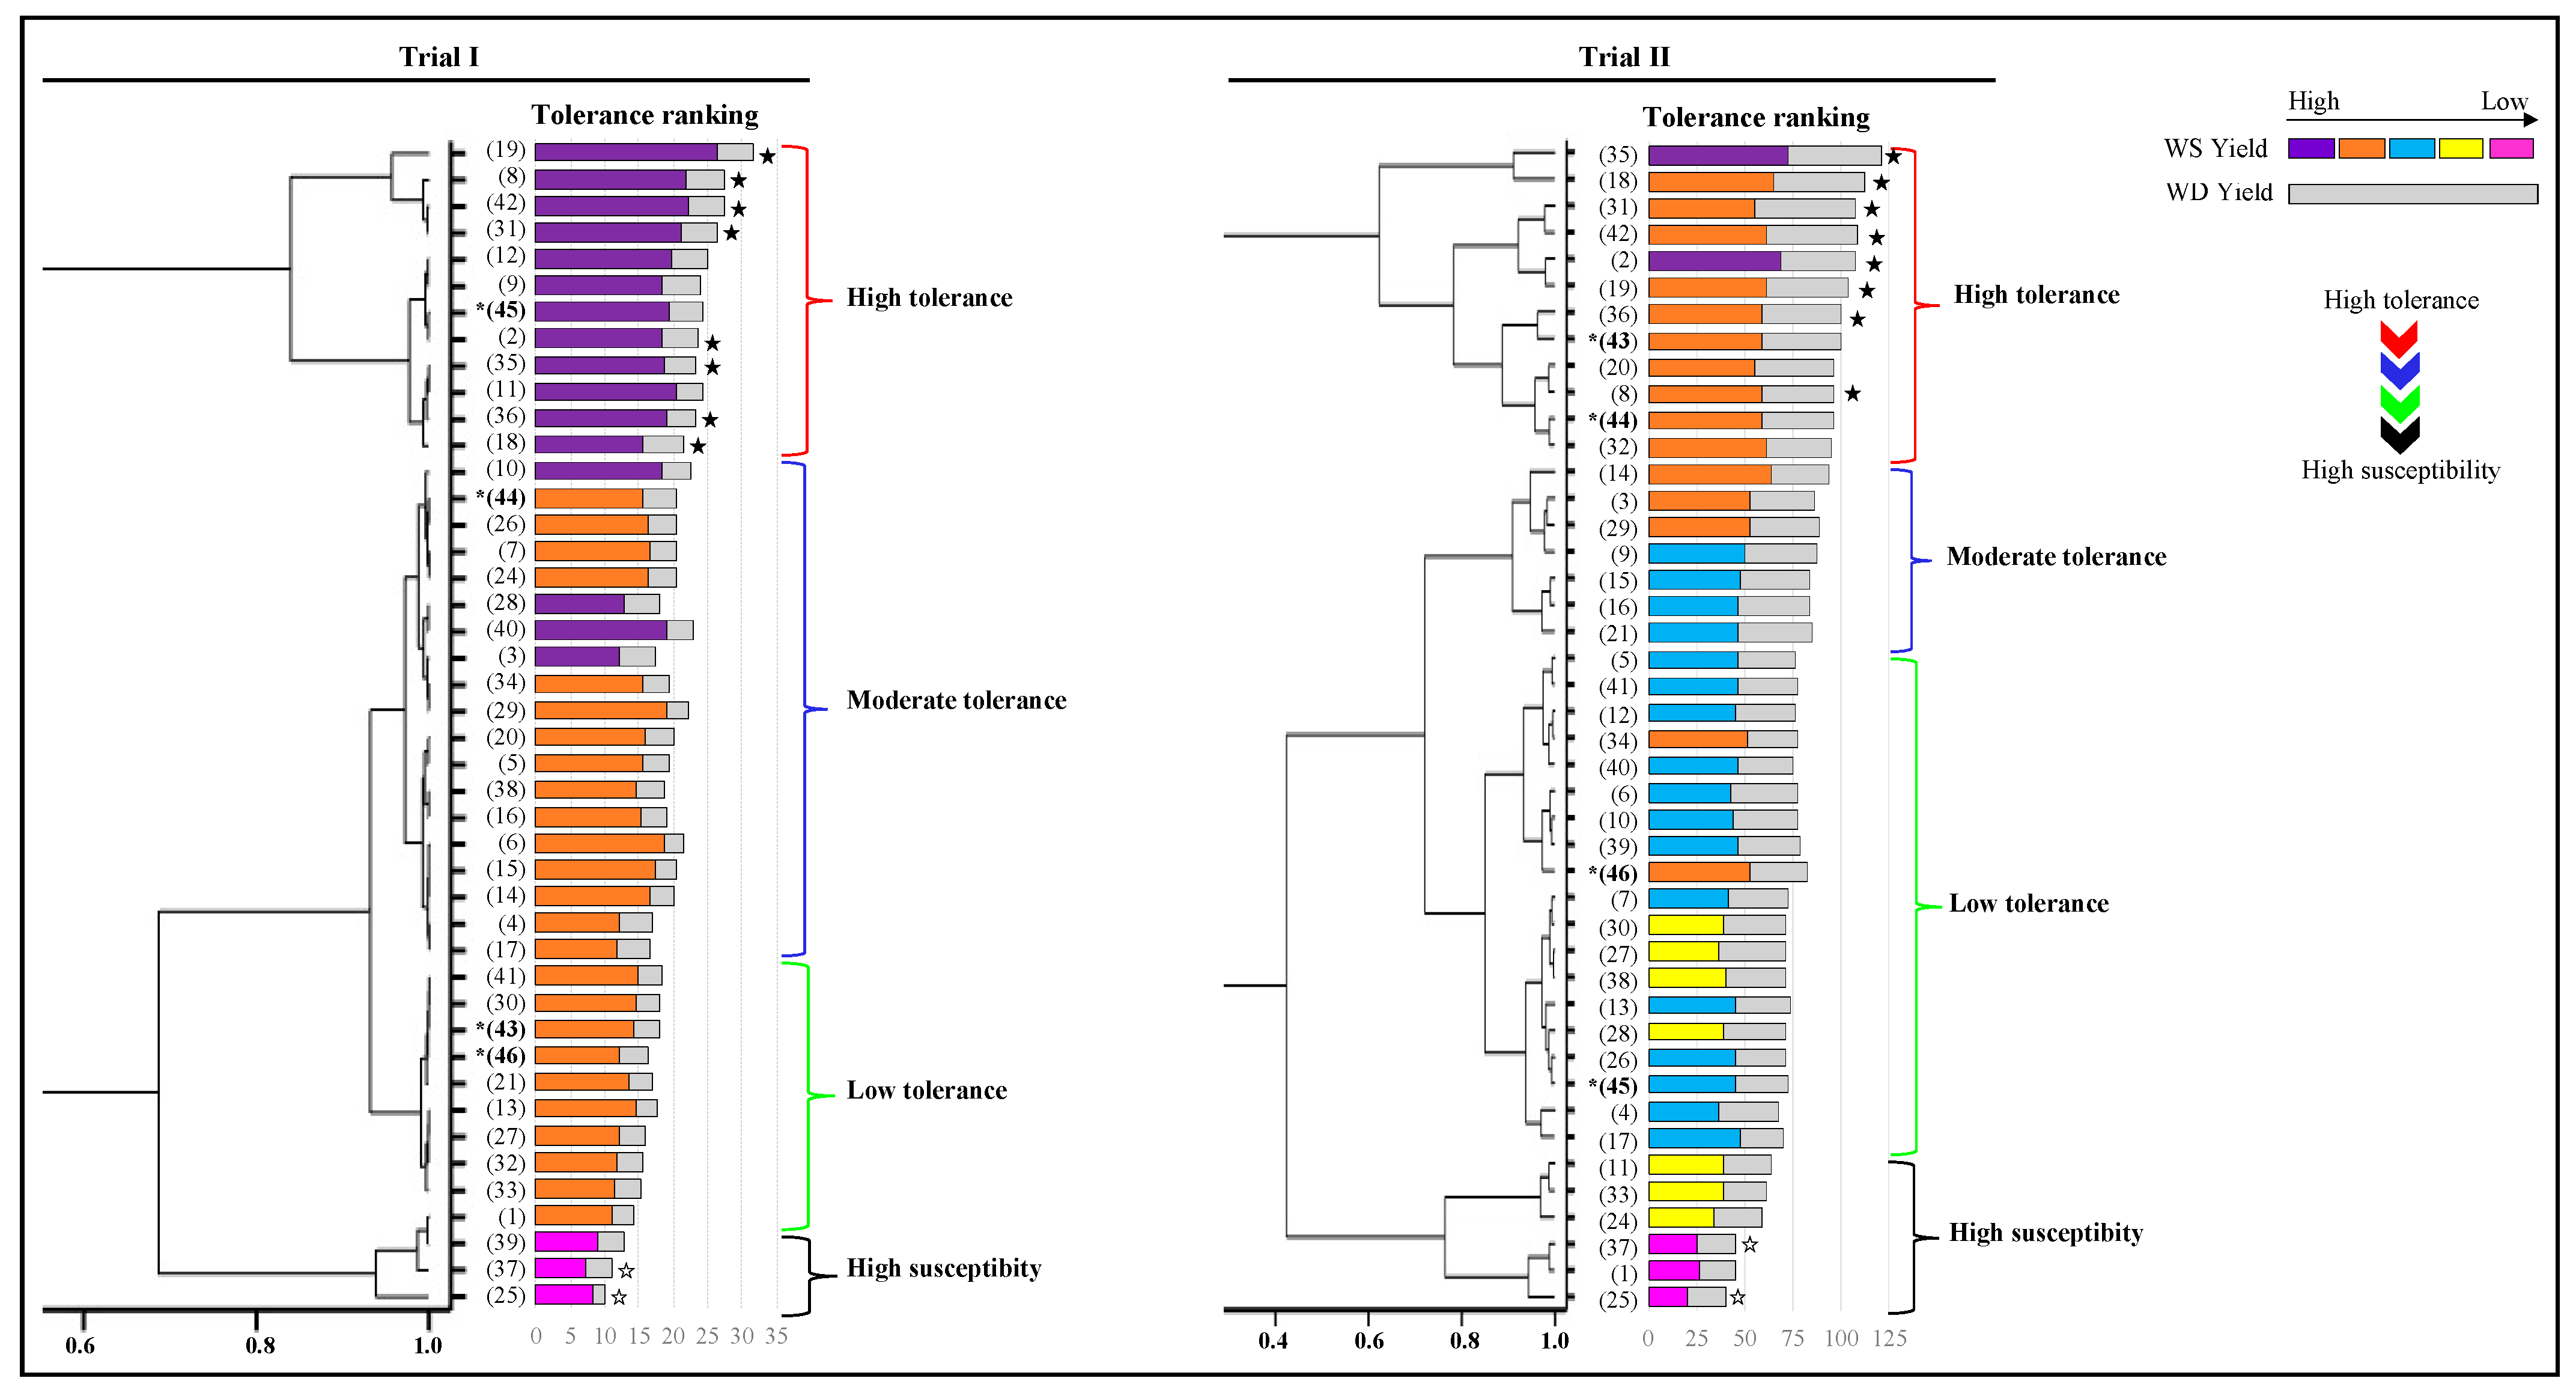
3.6. Drought Tolerance Ranking of 44 Amaranth Accessions

The ranking for drought tolerance among 44 amaranth accessions was ascertained based on GMP, MP and STI, the most effective and stable criterion in the present study. The dendrogram distinguished amaranth accessions into high tolerance (high yielding under WS and WD conditions), moderate tolerance, low tolerance and high susceptibility (Figure 4). Accessions 2, 8, 18, 19, 31, 35, 36 and 42 were considered highly tolerant to drought stress with consistent yield performance in both trials, while accession entries 1, 25 and 37 were the most susceptible. The yield performance of the remaining accessions was varied and unstable, depending on the stress intensity. For example, accession entry 11 was considered highly tolerant in Trial I, but became the most susceptible among the 44 amaranth accessions in Trial II.

3.7. Association of Tolerance Grouping with Plant Growth and Physiology

The relationships between tolerance groups and physiological traits with respective principal components (Supplementary Table S5) are further illustrated by the biplots for Trial I (Figure 5a) and Trial II (Figure 5b). In Trial I, the PCA revealed that the first two PCAs accounted for 65.66% and 66.40% of total variations in WS and WD conditions, respectively. High tolerance accessions were clearly discriminated from susceptible accessions in both WS and WD conditions although there was overlap between high, moderate and low tolerance accessions in the directions of biomass partitioning. There was also no difference in the directions of dimension vectors in biomass partitioning, RWC and Fv’/Fm’ between the two water treatments.
In contrast, in Trial II the PCA revealed that the first two PCAs accounted for 57.26% and 48.31% of total variations on WS and WD conditions, respectively. Under the WS condition, a clear separation was observed between highly tolerant and susceptible accessions, as highly tolerant accessions clustered together in the direction of yield biomass while susceptible accessions were more inclined towards SLA and Fv/Fm. Under the WD condition, the high and moderate tolerance accessions were clustered together towards the positive side of PC1 excelling in E, Gs, RWC, biomass partitioning, Pn, WUE, WUEi and Ls, and clearly separated from high susceptibility accessions which were more inclined towards the negative side of PC1 excelling in Ci and Fv/Fm.

4. Discussion

Drought tolerance is a complex biological process which involves interactions between morphological traits and physiological and biochemical processes and is dependent on the level of drought severity and timing in relation to the stage of crop development [49,50,51]. Furthermore, the mechanisms of plant adaptation to drought stress are strongly influenced by the experimental design which might provide different interpretations for the observed effects of water deficit [52,53]. In this experiment, drought stress was imposed on the individual plants so comparative physiological responses could be applied to any accession presents in an environment [53]. The growth of amaranth in irrigated and drought stress conditions was significantly affected by the environmental conditions, as shown by the significant lower yield production in Trial I compared to Trial II and the difference adaptive responses between the two trials. Thus, revealing that environmental stress intensity plays an important role in drought response and adaption in A. tricolor accessions. This result has also been observed in maize, grown in multiple environment conditions [54] and wheat, grown in rainfed and irrigated locations [55].
It is possible that the more severe drought stress imposed in Trial I may cause a reduction in physiological and metabolic activity in comparison to the moderate drought stress imposed in Trial II [56,57]. Besides, different stress adaptation mechanisms in amaranth might be determined by the capacity of accessions to adapt to different type of drought stress to enhance their growth and development [58,59]. In this study, drought stress significantly reduced yield of some accessions and several of them had lower yield loss, suggesting that A. tricolor was able to grow at reduced soil water availability, although at a slower rate than the fully irrigated plants. The results showed genotypic variations exist in amaranth accessions and these differences may portray the potential success in future improvement for amaranth which may be used to pre-screen lines for further verification under field conditions.
The RWC determines leaf water balance in plants during water deficit periods [60] and estimates the percentage of water in the leaf as a fraction of the total volumetric water that the leaf can hold at full turgor [61]. In this experiment, RWC declined to 61–76%, a range of expected optima for A. tricolor (70–80%) [37], which is higher than other amaranth species such as A. hybridus and A. hypochondriacus, with less than 50% RWC recorded under drought stress [16,62]. Some studies have suggested that high RWC is closely related to drought resistance, as observed in cowpea landraces [63], Arabidopsis [64] and beans [65], and has been successfully used as a screening tool for selecting drought-tolerant potatoes [66]. However, RWC did not appear to be related to drought tolerance in this study but may be serve as indicator for plant water status [67] as higher RWC were correlated with leaf expansion and leaf biomass under WS and WD conditions in this study. Nevertheless, RWC is vital to ensure an accurate assessment of the relative capacity for osmotic adjustment, an indicator of cell turgor through accumulation of organic solutes such as proline [68,69]. Sarker and Oba [37] reported that soil drying increased proline accumulation in drought-tolerant A. tricolor cultivar, and RWC was negatively correlated with proline and soluble protein contents, demonstrating that the synthesis of proline and protein was higher as soon as RWC declined. These solutes are considered as a general marker of drought tolerance [16,70] as it helps to protect cellular proteins, enzymes and cellular membrane against cell dehydration [71], and in A. hypochondriacus and A. cruentus, increase of soluble carbohydrate under drought stress used to regulate water use efficiency [72]. Therefore, further studies are required to quantify compatible solutes on this A. tricolor accessions panel to explore the possible plants osmotic adjustment under drought stress, which then can be considered as a tool for effective selection.
Low Fv/Fm at 50% WHC was associated with high yield under WS and WD conditions in this study, which may serve as a potential marker for indirect selection for drought tolerance in A. tricolor. The value of Fv/Fm did not change under normal and drought stress conditions, 0.72, 0.67 and 0.64 at 100%, 50% and 20% WHC, respectively, and was slightly lower than reported for A. hybridus (0.78) and A. hypochondriacus (0.80), which was also not affected by drought stress [62]. Meanwhile, Hura et al. [15] reported that Fv/Fm of A. cruentus significantly declined in prolonged drought stress at 30% field water capacity. This demonstrates that drought-adaptive response varied between amaranth species, while A. tricolor, A. hybridus and A. hypochondriacus may have the ability to recover from PSII damage at night or because of the PSII protection promoted by the accumulation of total soluble sugar and proline under drought stress [62].
Fv/Fm provides a rapid way to assess plant health, but caution should be used as Fv/Fm is often misinterpreted as a specific indicator of PSII photoinhibition (decrease of CO2 fixation) due to the damage of PSII core subunit D1 [73,74,75]. Rather, Fv/Fm represents quantum yield of PSII that will be low not only when the PSII is inactivated but also due to thermal dissipation through slowly relaxing non-photochemical quenching (NPQ) [73]. The used of Fv/Fm to evaluate the drought tolerance of crops is contradictory [76]. For example, Fv/Fm of drought-tolerant barley [77] and tomato varieties [78] were higher than the drought-sensitive varieties. In contrast, drought-tolerant amaranth accessions had lower Fv/Fm than the susceptible accessions in this study. A low Fv/Fm in high yielding accessions might indicate a photoprotective role rather than photoinhibition. This is because at 50% WHC, photosynthesis rate was reduced under WS and WD conditions due to lower stomatal conductance, as shown by positive correlation between Pn and Gs in both water conditions. This may induce an increased light energy and photoinhibition, and therefore lower Fv/Fm in drought-tolerant amaranth was likely an up-regulation mechanism to dissipate excess electrons [59] by limiting light absorption and maintaining the oxidation state of plastoquinone, the electron accepter of PSII [79]. Further study on non-photochemical quenching (NPQ), a process of dissipating excess light energy which plays an important role for photoprotection [73], or other electron dissipation mechanisms such as photorespiration and cyclic electron that are up-regulated under drought stress [59,80,81] are required to strengthen the use of Fv/Fm as trait selection for drought tolerance in amaranth.
In this study, the leaf and stem biomass partitioning among amaranth accessions under normal and drought conditions were phenotypically diverse, and this study revealed leaf to stem biomass allocation as a major mechanism for drought recovery. Liu and Stützel [14] and Jamalluddin et al. [12] also reported that amaranth altered the biomass allocation into stem as the plant increased in size in both normal and drought stress conditions. Similar results were also found in sorghum as the fraction of biomass into leaf and stem changed over time in normal conditions, and stem biomass was less affected by drought stress compared to leaf due to an increase of soluble sugar of the stem internode [82,83]. The reason behind plasticity of amaranth stem biomass in response to drought stress has never been studied. Nonetheless, in the present study, the stem was likely involved in altered source/sink network during drought stress and may be important for a subsequent recovery phase [84].
Amaranth accessions that had relatively high leaf and stem biomass under control condition performed well under drought stress and were identified as drought tolerant. This suggests that these accessions had a capacity to relocate/distribute carbon and nitrogen absorbed by the roots to the leaf and stem for leaf maintenance or growth during drought stress [85], and some of the solutes such as amino acids and carbohydrates are stored in the stem to be used when water is available [86]. Rewatering assessment may reveal the critical role of recovery in drought adaptation [67]. In this study, accessions with higher stem biomass were more sensitive to drought stress as significant wilting was observed at a high threshold soil water capacity. At this threshold, the plants’ physiological processes start to decline [14], while allowing the plants to stay alive during drought stress and recovering upon rewatering [87,88]. This could be a strategy of amaranth to alter xylem sap in the stems during drought stress, such as to improve the chances of survival, save resources and serve as recovery after the stress phase [88].
Previous studies have concluded that the effectiveness of selection indices for drought tolerance is dependent on the stress severity [89,90]. Therefore, there is a need to determine whether to use severe or moderate drought stress to evaluate stress tolerance in amaranth germplasm. In this study, under more severe stress intensity in Trial I, yield in normal conditions was not correlated with yield under stress conditions, demonstrating that indirect selection for drought tolerant accessions based on the growth performance under irrigated conditions would not be effective if the stress intensity was severe [91,92]. Furthermore, the PCA biplot revealed that under severe drought intensity, stress indices were less discriminative for the amaranth accessions than the moderate drought stress intensity, suggesting that moderate stress may be more suitable for identifying stress tolerance. Nevertheless, the evaluation of drought stress indices in amaranth accessions at various levels of stress can facilitate plant breeders to identify accessions with stable yields in diverse environments. Thus, there is a need to select accessions with a good combination of agronomically important traits, cumulatively contributing to improved yields under target drought conditions [93]. Accessions that show low fluctuations of yield under various levels of drought stress conditions can be considered drought tolerant and stable [55]. In this study, GMP, MP and STI were the most reliable indicators of accession stability and were able to distinguish tolerant/susceptible amaranth accessions in both severe and moderate drought stress, and furthermore identified eight drought-tolerant accessions with low yield fluctuations under various levels of drought stress.

5. Conclusions

The results obtained in this experiment underline the important role of several mechanisms in protecting plants at specific water-deficit conditions. The differences of above-ground biomass partitioning into leaf and stem under drought stress may be a compromised with plants physiological traits such as the recovery process. Fv/Fm was associated with high yield in amaranth which suggests the need for further investigation of this parameter for use as a target trait during selection. Further studies are required to quantify Fv/Fm value of diverse amaranth accessions at different stress intensity to strengthen the use of Fv/Fm as a trait selection for drought tolerance in amaranth. This could be done using a pool of well characterized drought-tolerant genotypes and a contrasting set of drought-susceptible genotypes. Overall, the results showed that genotypic variations existed in amaranth accessions and these differences may show that the A. tricolor germplasm collection in this study could be a rich source of genetic diversity for breeding purposes for drought tolerance traits.

Supplementary Materials

The following are available online at https://0-www-mdpi-com.brum.beds.ac.uk/article/10.3390/agriculture11100994/s1, Figure S1: (a) Scale for leaf wilting scoring (LWS (b) Scale for drought tolerance symptom (DS). Table S1: (a) Mean of each accession for yield and biomass partitioning under water-sufficient (WS) and water-deficient (WD) in Trial I and Trial II, (b) Mean of each accession for relative water content under water-sufficient (WS) and water-deficient (WD) in Trial I and Trial II, (c) Mean of each accession for chlorophyll fluorescence under water-sufficient (WS) and water-deficient (WD) in Trial I and Trial II, (d) Mean of each accession for leaf gas exchange measurement under water-sufficient (WS) and water-deficient (WD) in Trial I and Trial II. Table S2: Mean of each accession for rewatering assessment. Table S3 (a) Correlation coefficients (R) for traits associated with water-sufficient (WS) in the bottom diagonal and water-deficient (WD) in the top diagonal for the 44 A. tricolor accessions in Trial 1. (b) Correlation coefficients (R) for traits associated with water-sufficient (WS) in the bottom diagonal and water-deficient (WD) in the top diagonal for the 44 A. tricolor accessions in Trial II. (c) Correlation coefficient (r) between drought-adaptive capabilities and physiological responses. Table S4: (a) Mean comparisons of drought tolerance indices among amaranth accession, (b) The analysis of variance and correlation coefficient (R) for stress intensity (SI) drought resistance index (DI), geometric mean probability (GMP), mean productivity (MP), stress susceptibility index (SSI), stress tolerance index (STI), stress tolerance (TOL) and yield stability index (YSI) in Trial I (bottom diagonal) and Trial II (top diagonal). Table S5: PCA biplot.

Author Contributions

Conceptualization, N.J., F.J.M. and R.C.S.; methodology, N.J., F.J.M., R.C.S., A.S.; analysis, N.J.; investigation, N.J.; resources, F.J.M., S.M., W.K.H., R.C.S.; writing—original draft preparation, N.J.; writing—review and editing, F.J.M., S.M., A.S., W.K.H., R.C.S.; supervision, F.J.M., R.C.S.; acquisition, N.J., F.J.M., R.C.S. All authors have read and agreed to the published version of the manuscript.

Funding

This research was funded by a MyBrain15 scholarship, Ministry of Higher Education Malaysia.

Institutional Review Board Statement

Not applicable.

Data Availability Statement

The datasets presented in this study are available upon request to the corresponding author.

Acknowledgments

We thank the MyBrain15 scholarship program, Ministry of Higher Education Malaysia, for funding this research. We also thank the School of Biosciences, University of Nottingham Malaysia and Crops for the Future for the technical support. We are grateful for the donation of 19 accessions from the USDA amaranth collection and to East West seeds for the donation of two accessions.

Conflicts of Interest

The authors declare no conflict of interest. The funders had no role in the design of the study; in the collection, analyses, or interpretation of data; in the writing of the manuscript, or in the decision to publish the results.

References

  1. Fahad, S.; Bajwa, A.A.; Nazir, U.; Anjum, S.A.; Farooq, A.; Zohaib, A.; Huang, J. Crop production under drought and heat stress: Plan responses and management options. Front. Plant Sci. 2017, 8, 1147. [Google Scholar] [CrossRef] [Green Version]
  2. Kogan, F.; Guo, W.; Yang, W. Drought and food security prediction from NOAA new generation of operational satellites. Geomat. Nat. Hazards Risk 2019, 10, 651–666. [Google Scholar] [CrossRef] [Green Version]
  3. Vermeulen, S.J.; Campbell, B.M.; Ingram, J.S.I. Climate change and food system. Annu. Rev. Environ. Resour. 2012, 37, 195–222. [Google Scholar] [CrossRef] [Green Version]
  4. Ali, S.; Liu, Y.; Ishaq, M.; Shah, T.; Ilyas, A.; Din, I.U. Climate change and its impact on the yield of major food crops: Evidence from Pakistan. Foods 2017, 6, 39. [Google Scholar] [CrossRef] [PubMed]
  5. Twongyirwe, R.; Mfitumukiza, D.; Barasa, B.; Naggayi, B.R.; Odongo, H.; Nyakato, V.; Mutoni, G. Perceived effects of drought on household food security in South-western Uganda: Coping responses and determinants. Weather. Clim. Extrem. 2019, 24, 100201. [Google Scholar] [CrossRef]
  6. Chivenge, P.; Mabhaudhi, T.; Modi, A.T.; Mafongoya, P. The potential role of neglected and underutilised crop species as future crops under water scarce conditions in Sub-Saharan Africa. Int. J. Environ. Res. Public Health 2015, 12, 5685–5711. [Google Scholar] [CrossRef] [Green Version]
  7. Mustafa, M.A.; Mayes, S.; Massawe, F. Crop diversification through a wider use of underutilised crops: A strategy to ensure food and nutrition security in the face of climate change. In Sustainable, Solutions for Food Security: Combating Climate Change by Adaptation; Sarkar, A., Sensarma, S.R., van Loon, G.W., Eds.; Springer Nature: Cham, Swizerland, 2019; pp. 125–149. [Google Scholar]
  8. Das, S. Systematics and taxonomic delimitation of vegetable, grain and weed amaranths: A morphological and biochemical approach. Genet. Resour. Crop Evol. 2012, 59, 289–303. [Google Scholar] [CrossRef]
  9. Jiménez-Aguilar, D.M.; Grusak, M.A. Minerals, vitamin C, phenolics, flavonoids and antioxidant activity of Amaranthus leafy vegetables. J. Food Compos. Anal. 2017, 58, 33–39. [Google Scholar] [CrossRef] [Green Version]
  10. Rastogi, A.; Shukla, S. Amaranth: A new millennium crop of nutraceutical values. Crit. Rev. Food Sci. Nutr. 2013, 53, 109–125. [Google Scholar] [CrossRef]
  11. Wu, X.; Blair, M.W. Diversity in grain amaranths and relatives distinguished by genotyping by sequencing (GBS). Front. Plant Sci. 2017, 8, 1960. [Google Scholar] [CrossRef] [Green Version]
  12. Jamalluddin, N.; Massawe, F.; Symonds, R.C. Transpiration efficiency of amaranth (Amaranthus sp.) in response to drought stress. J. Hortic. Sci. Biotechnol. 2018, 94, 448–459. [Google Scholar] [CrossRef] [Green Version]
  13. Stetter, M.G.; Zeitler, L.; Steinhaus, A.; Kroener, K.; Biljecki, M.; Schmid, K.J. Crossing methods and cultivation conditions for rapid production of segregating populations in three grain amaranth species. Front. Plant Sci. 2016, 7, 816. [Google Scholar] [CrossRef] [PubMed] [Green Version]
  14. Liu, F.; Stützel, H. Leaf water relations of vegetable amaranth (Amaranthus spp) in response to soil drying. Eur. J. Agron. 2002, 16, 137–150. [Google Scholar] [CrossRef]
  15. Liu, F.; Stützel, H. Leaf expansion, stomatal conductance and transpiration of vegetable amaranth (Amaranthus spp.) in response to soil drying. J. Am. Soc. Hortic. Sci. 2002, 127, 878–883. [Google Scholar] [CrossRef] [Green Version]
  16. Slabbert, R.; Krüger, G.H.J. Assessment of changes in photosystem II structure and function as affected by water deficit in Amaranthus hypochondriacus L. and Amaranthus hybridus L. Plant Physiol. Biochem. 2011, 49, 978–998. [Google Scholar] [CrossRef]
  17. Khanam, U.K.S.; Oba, S. Phenotypic plasticity of vegetable amaranth, Amaranthus tricolor L. under a natural climate. Plant Prod. Sci. 2014, 17, 166–172. [Google Scholar] [CrossRef] [Green Version]
  18. Kadereit, G.; Borsch, T.; Weising, K.; Freitag, H. Phylogeny of Amaranthaceae and Chenopodiaceae and the evolution of C4 photosynthesis. Int. J. Plant Sci. 2003, 164, 959–986. [Google Scholar] [CrossRef]
  19. Sarker, U.; Oba, S. Drought stress effects on growth, ROS markers, compatible solutes, phenolics, flavonoids, and antioxidant activity in Amaranthus tricolor. Appl. Biochem. Biotech. 2018, 186, 999–1016. [Google Scholar] [CrossRef]
  20. Sarker, U.; Oba, S. Drougt stress enhances nutritional bioactive compounds, phenolic acids and antioxidant capacity of Amaranthus leafy vegetable. BMC Plant Biol. 2018, 18, 258. [Google Scholar] [CrossRef] [Green Version]
  21. Liu, F.; Stützel, H. Biomass partitioning, specific leaf area and water use efficiency of vegetable amaranth (Amaranthus spp.) in response to drought stress. Sci. Hortic. 2004, 102, 15–27. [Google Scholar] [CrossRef]
  22. Hura, T.; Grzesiak, S.; Hura, K.; Thiemt, E.; Tokarz, K.; Wedzony, M. Physiological and biochemical tools useful in drought tolerance detection in genotypes of winter triticale: Accumulation of ferulic acid correlates with drought tolerance. Ann. Bot. 2007, 100, 767–775. [Google Scholar] [CrossRef] [Green Version]
  23. Slabbert, R.; Krüger, G.H.J. Antioxidant enzyme activity, proline accumulation, leaf area and cell membrane stability in water stressed Amaranthus leaves. S. Afr. J. Bot. 2014, 95, 123–128. [Google Scholar] [CrossRef] [Green Version]
  24. Luoh, J.W.; Begg, C.B.; Symonds, R.C.; Ledesma, D.; Yang, R. Nutritional yield of African indigenous vegetables in water-deficient and water-sufficient conditions. Food Nutr. Sci. 2014, 5, 812–822. [Google Scholar] [CrossRef] [Green Version]
  25. Babayev, H.; Mehvaliyeva, U.; Aliyeva, M.; Feyziyev, Y.; Guliyev, N. The study of NAD-malic enzyme in Amaranthus cruentus L. under drought. Plant Physiol. Biochem. 2014, 81, 84–89. [Google Scholar] [CrossRef]
  26. Jomo, O.M.; Netondo, G.W.; Musyimi, D.M. Drought inhibition of chlorophyll content among seven Amaranthus species. IARJSET 2016, 3, 1362–1371. [Google Scholar]
  27. Tsutsumi, N.; Tohya, M.; Nakashima, T.; Ueno, U. Variations in structural, biochemical, and physiological traits of photosynthesis and resource use efficiency in Amaranthus species (NAD-ME-type C4). Plant Prod. Sci. 2017, 20, 300–312. [Google Scholar] [CrossRef] [Green Version]
  28. Hura, T.; Hura, K.; Grzesiak, M.; Rzepka, A. Effect of long-term drought stress on leaf gas exchange and fluorescence parameters in C3 and C4 plants. Acta Physiol. Plant. 2007, 29, 103–113. [Google Scholar] [CrossRef]
  29. Johnson, D.A.; Asay, K.H. Viewpoint: Selection for improved response in cool-season grasses. J. Range Manag. 1993, 46, 194–202. [Google Scholar] [CrossRef]
  30. Rao, I.M. Role of physiology in improving crop adaptation to abiotic stresses in the tropics: The case of common bean and tropical forages. In Handbook of Plant and Crop Physiology, 2nd ed.; Pessarakli, M., Ed.; CRC Press: Boca Raton, FL, USA, 2001; p. 32. [Google Scholar]
  31. Hoyos-Villegas, V.; Song, Q.; Kelly, J.D. Genome-wide association analysis for drought tolerance and associated traits in common bean. Plant Genome 2017, 10, 1–17. [Google Scholar] [CrossRef] [PubMed] [Green Version]
  32. Fernandez, G.C.J. Effective selection criteria for assessing stress tolerance. In Proceedings of the International Symposium on Adaptation of Vegetables and Other, Food Crops in Temperature and Water Stress, Tainan, Taiwan, 13–18 August 1992; Kuo, C.G., Ed.; AVRDC: Shanhua, Taiwan, 1992; pp. 257–270. [Google Scholar]
  33. Mitra, J. Genetics and genetic improvement of drought resistance in crop plants. Curr. Sci. 2001, 80, 758–763. [Google Scholar]
  34. Farshadfar, E.; Sutka, J. Multivariate analysis of drought tolerance in wheat substitution lines. Cereal Res. Commun. 2002, 31, 33–39. [Google Scholar] [CrossRef]
  35. Andini, R.; Yoshida, S.; Yoshida, Y.; Ohsawa, R. Amaranthus genetic resources in Indonesia: Morphological and protein content assessment in comparison with worldwide amaranths. Genet. Resour. Crop Evol. 2013, 60, 2115–2128. [Google Scholar] [CrossRef] [Green Version]
  36. Sogbohossou, E.O.D.; Achigan-Dako, E.G. Phenetic differentiation and use type delimitation in Amaranthus spp. from worldwide origins. Sci. Hortic. 2014, 178, 31–42. [Google Scholar] [CrossRef]
  37. Sarker, U.; Islam, M.T.; Rabbani, M.G.; Oba, S. Genotypic variability for nutrient, antioxidant, yield and yield contributing traits in vegetable amaranth. J. Food Agric. Environ. 2014, 12, 168–174. [Google Scholar]
  38. Sarker, U.; Islam, M.T.; Rabbani, M.G.; Oba, S. Variability, heritability and genetic association in vegetable amaranth (Amaranthus tricolor L.). Span. J. Agric. Res. 2015, 13, 17. [Google Scholar] [CrossRef] [Green Version]
  39. Gerrano, D.A.; van Rensburg, W.S.J.; Mavengahama, S.; Bairu, M.; Venter, S.; Adebola, P. Qualitative morphological diversity of Amaranthus species. J. Trop. Agric. 2017, 55, 12–20. [Google Scholar]
  40. Thapa, R.; Blair, M. Morphological assessment of cultivated and wild amaranth species diversity. Agronomy 2018, 8, 272. [Google Scholar] [CrossRef] [Green Version]
  41. Gonzáles, L.; Gonzáles-Vilar, M. Determination of relative water content. In Handbook of Plant Ecophysiology Techniques; Reigosa, M.J., Ed.; Kluwer Academic Publishers: Dordrecht, The Netherlands, 2001; pp. 207–212. [Google Scholar]
  42. Baker, N.R.; Rosenqvist, E. Applications of chlorophyll fluorescence can improve crop production strategies: An examination of future possibilities. J. Exp. Bot. 2004, 55, 1607–1621. [Google Scholar] [CrossRef] [Green Version]
  43. Wang, X.; Wang, L.; Shangguan, Z. Leaf gas exchange and fluorescence of two winter wheat varieties in response to drought stress and nitrogen supply. PLoS ONE 2016, 11, e0165733. [Google Scholar] [CrossRef] [Green Version]
  44. Yin, C.; Berninger, F.; Li, C. Photosynthetic responses of Populus przewalski subjected to drought stress. Photosynthetica 2006, 44, 62–68. [Google Scholar] [CrossRef]
  45. Fischer, R.A.; Maurer, R. Drought resistance in spring wheat cultivars. I. Grain yield response. Aust. J. Agric. Res. 1978, 29, 897–907. [Google Scholar] [CrossRef]
  46. Lan, J. Comparison of evaluating methods for agronomic drought resistance in crops. Acta Agric. Boreali-Occident. Sin. 1998, 7, 85–87. [Google Scholar]
  47. Hossain, A.B.S.; Sears, A.G.; Cox, T.S.; Paulsen, G.M. Desiccation tolerance and its relationship to assimilate partitioning in winter wheat. Crop Sci. 1990, 30, 622–627. [Google Scholar] [CrossRef]
  48. Bouslama, M.; Schapaugh, W.T. Stress tolerance in soybean. Part 1: Evaluation of three screening techniques for heat and drought tolerance. Crop Sci. 1984, 24, 933–937. [Google Scholar] [CrossRef]
  49. Kamoshita, A.; Babu, R.C.; Boopathi, N.M.; Fukai, S. Phenotypic and genotypic analysis of drought-resistance traits for development of rice cultivars adapted to rainfed environments. Field Crops Res. 2008, 109, 1–23. [Google Scholar] [CrossRef]
  50. Bahadur, A.; Chattarjee, A.; Kumar, R.; Singh, M.; Naik, P.S. Physiological and biochemical basis of drought tolerance in vegetables. Water 2011, 38, 1–16. [Google Scholar]
  51. Kumar, R.; Solankey, S.; Singh, M. Breeding for drought tolerance in vegetables. Veg. Sci. 2012, 39, 1–15. [Google Scholar]
  52. Bertolli, S.C.; Mazzafera, P.; Souza, G.M. Why is it so difficult to identify a single indicator of water stress in plants? A proposal for multivariate analysis to assess emergent properties. Plant Biol. 2014, 16, 578–585. [Google Scholar] [CrossRef]
  53. Gilbert, M.E.; Medina, V. Drought adaptation mechanisms should guide experimental design. Trends Plant Sci. 2016, 21, 639–647. [Google Scholar] [CrossRef] [Green Version]
  54. Hao, Z.F.; Li, X.H.; Su, Z.J.; Xie, C.X.; Li, M.S.; Liang, X.L.; Weng, J.F.; Zhang, D.G.; Li, L.; Zhang, S.H. A proposed selection criterion for drought resistance across multiple environments in maize. Breed. Sci. 2011, 61, 101–108. [Google Scholar] [CrossRef] [Green Version]
  55. Ali, M.B.; El-Sadek, A.N. Evaluation of drought tolerance indices for wheat (Triticum aestivum L.) under irrigated and rainfed conditions. Commun. Biometry Crop Sci. 2016, 11, 77–89. [Google Scholar]
  56. Ma, Q.Q.; Wang, W.; Li, Y.H.; Li, D.Q.; Zou, Q. Alleviation of photoinhibition in drought-stressed wheat (Triticum aestivum) by foliar-applied glycinebetaine. J. Plant Physiol. 2006, 163, 165–175. [Google Scholar] [CrossRef]
  57. Naya, L.; Ladrera, R.; Ramos, J.; González, E.M.; Arrese-Igor, C.; Minchin, F.R.; Becana, M. The response of carbon metabolism and antioxidant defences of alfalfa nodules to drought stress and to the subsequent recovery of plants. Plant Physiol. 2007, 144, 1104–1114. [Google Scholar] [CrossRef] [PubMed] [Green Version]
  58. Fang, Y.; Xiong, L. General mechanisms of drought response and their application in drought resistance improvement in plants. Cell. Mol. Life Sci. 2015, 72, 673–689. [Google Scholar] [CrossRef]
  59. Iseki, K.; Homma, K.; Irie, T.; Endo, T.; Shiraiwa, T.; Iseki, K.; Shiraiwa, T. The long-term changes in midday photoinhibition in rice (Oryza sativa L.) growing under fluctuating soil water conditions. Plant Prod. Sci. 2013, 16, 287–294. [Google Scholar] [CrossRef]
  60. Uzildaya, B.; Turkana, I.; Sekmena, A.H.; Ozgura, R.; Karakayab, H.C. Comparison of ROS formation and antioxidant enzymes in Cleome gynandra (C4) and Cleome spinosa (C3) under drought stress. Plant Sci. 2012, 182, 59–70. [Google Scholar] [CrossRef] [PubMed] [Green Version]
  61. Blum, A. Principal Estimates of Plant Water Status for Selection Work; AFRA Regional Training Course on Selection Methods for Drought Tolerance in Cereals and Legumes South Africa; ARC-Roodeplaat: Pretoria, South Africa, 1998. [Google Scholar]
  62. Vargas-Ortiz, E.; Ramírez-Tobias, H.M.; González-Escobar, J.L.; Gutiérrez-Garcia, A.K.; Bojórquez-Velázquez, E.; Espitia-Rangel, E.; de la Rosa, A.P.B. Biomass, chlorophyll fluorescence, and osmoregulation traits let differentiation of wild and cultivated Amaranthus under water stress. J. Photochem. Photobiol. B Biol. 2021, 220, 112210. [Google Scholar] [CrossRef] [PubMed]
  63. Zegaoui, Z.; Planchais, S.; Cabassa, C.; Djebbar, R.; Abrous, O.; Carol, P. Variation in relative water content, proline accumulation and stress gene expression in two cowpea landraces under drought. J. Plant Physiol. 2018, 218, 26–34. [Google Scholar] [CrossRef] [PubMed]
  64. Bac-Molenaar, J.A.; Granier, C.; Keurentjes, J.J.B.; Vreugdenhil, D. Genome-wide association mapping of time-dependent growth responses to moderate drought stress in Arabidopsis: GWAS mapping of growth responses to moderate drought. Plant Cell Environ. 2016, 39, 88–102. [Google Scholar] [CrossRef] [Green Version]
  65. Rosales, M.A.; Cuellar-Ortiz, S.M.; Arrieta-Montiel, M.P.; Acosta-Gallegos, J.; Covarrubias, A.A. Physiological traits related to terminal drought resistance in common bean (Phaseolus vulgaris L.): Drought resistance-related traits in common bean. J. Sci. Food Agric. 2011, 93, 324–331. [Google Scholar] [CrossRef] [PubMed]
  66. Soltys-Kalina, D.; Marczewski, W. The effect of drought stress on the leaf relative water content and tuber yield of a half-sib family of ‘Katahdin’-derived potato cultivars. Breed. Sci. 2016, 66, 328–331. [Google Scholar] [CrossRef] [Green Version]
  67. Chen, D.; Wang, S.; Cao, B.; Cao, D.; Leng, G.; Li, H.; Yin, L.; Shan, L.; Deng, X. Genotypic variation in growth and physiological response to drought stress and re-watering reveals the critical role of recovery in drought adaptation in maize seedlings. Front. Plant Sci. 2016, 6, 1241. [Google Scholar] [CrossRef] [Green Version]
  68. Blum, A. Stress, strain, signalling, and adaptation—Not just a matter of definition. J. Exp. Bot. 2016, 67, 562–565. [Google Scholar] [CrossRef] [PubMed] [Green Version]
  69. Sanders, G.J.; Arndt, S.K. Osmotic Adjustment under drought conditions. In Plant Responses to Drought Stress; Aroca, R., Ed.; Springer: Berlin/Heidelberg, Germany, 2012; pp. 199–229. [Google Scholar]
  70. Liu, C.C.; Liu, Y.G.; Guo, K.; Fan, D.Y. Effect of drought on pigments, osmotic adjustment and antioxidant enzymes in six woody plant species in karst habitats of southwestern China. Environ. Exp. Bot. 2011, 71, 174–183. [Google Scholar] [CrossRef]
  71. Zivcak, M.; Brestic, M.; Sytar, O. Osmotic adjustment and plant adaptation to drought stress. In Drought Stress Tolerance in Plants; Hossain, M., Wani, S., Bhattacharjee, S., Burritt, D., Tran, L.S., Eds.; Springer: Cham, Switzerland; Basel, Switzerland; Auckland, New Zealand, 2016; Volume 1, pp. 105–143. [Google Scholar]
  72. González-Rodríguez, T.; Cisneros-Hernández, I.; Acosta Bayona, J.; Ramírez-Chavez, E.; Martínez-Gallardo, N.; Mellado-Mojica, E.; López-Pérez, M.G.; Molina-Torres, J.; Délano-Frier, J. Identification of factors linked to higher water-deficit stress tolerance in Amaranthus hypochondriacus compared to other grain amaranths and A. hybridus, their ancestor. Plants 2019, 8, 239. [Google Scholar] [CrossRef] [Green Version]
  73. Malnoë, A.; Schultink, A.; Shahrasbi, S.; Rumeau, D.; Havaux, M.; Niyogi, K.K. The plastid lipocalin LCNP is required for sustained photoprotective energy dissipation in Arabidopsis. Plant Cell 2018, 30, 196–208. [Google Scholar] [CrossRef] [PubMed] [Green Version]
  74. Murchie, E.H.; Lawson, T. Chlorophyll fluorescence analysis: A guide to good practice and understanding some new applications. J. Exp. Bot. 2013, 64, 3983–3998. [Google Scholar] [CrossRef] [PubMed] [Green Version]
  75. Adams, W.W., III; Zarter, C.R.; Ebbert, V.; Demmig-Adams, B. Photoprotective strategies of overwintering evergreens. Bioscience 2004, 4, 41–49. [Google Scholar] [CrossRef]
  76. Nemeskéri, E.; Helyes, J. Physiological responses of selected vegetable crop species to water stress. Agronomy 2019, 9, 447. [Google Scholar] [CrossRef] [Green Version]
  77. Li, R.H.; Guo, P.G.; Michael, B.; Stefania, G.; Salvatore, C. Evaluation of chlorophyll content and fluorescence parameters as indicators of drought tolerance in barley. Agric. Sci. China 2006, 5, 751–757. [Google Scholar] [CrossRef]
  78. Bahadur, A.; Kumar, R.; Mishra, U.; Rai, A.; Singh, M. Physiological approaches for screening of tomato genotypes for moisture stress tolerance. In Proceedings of the National Conference of Plant Physiology (NCPP-2010), Varanasi, India, 25–27 November 2010; p. 142. [Google Scholar]
  79. Miyake, C.; Amako, K.; Shiraishi, N.; Sugimoto, T. Acclimation of tobacco leaves to high light intensity drives the plastoquinone oxidation system-relationship among the fraction of open PSII centers, non-photochemical quenching of Chl fluorescence and the maximum quantum yield of PSII in the dark. Plant Cell Physiol. 2009, 50, 730–743. [Google Scholar] [CrossRef]
  80. Kohzuma, K.; Cruz, J.A.; Akashi, K.; Hoshiyasu, S.; Munekage, N.Y.; Yokota, A.; Kramer, D.M. The long-term responses of the photosynthetic proton circuit to drought. Plant Cell Environ. 2009, 32, 209–219. [Google Scholar] [CrossRef] [PubMed]
  81. Bartoli, C.G.; Gomez, F.; Gergoff, G.; Guiamet, J.J.; Puntarulo, S. Up-regulation of the mitochondrial alternative oxidase pathway enhances photosynthetic electron transport under drought conditions. J. Exp. Bot. 2005, 56, 1269–1276. [Google Scholar] [CrossRef] [PubMed] [Green Version]
  82. Ghate, T.; Deshpande, S.; Bhargava, S. Accumulation of stem sugar and its remobilisation in response to drought stress in a sweet sorghum genotype and its near-isogenic lines carrying different stay-green loci. Plant Biol. 2017, 19, 396–405. [Google Scholar] [CrossRef] [PubMed]
  83. Perrier, L.; Rouan, L.; Jaffuel, S.; Clément-Vidal, A.; Roques, S.; Soutiras, A.; Baptiste, C.; Bastianelli, D.; Fabre, D.; Dubois, C.; et al. Plasticity of sorghum stem biomass accumulation in response to water deficit: A multiscale analysis from internode tissue to plant level. Front. Plant Sci. 2017, 8, 1516. [Google Scholar] [CrossRef] [PubMed] [Green Version]
  84. Pinheiro, C.; Chaves, M.M. Photosynthesis and drought: Can we make metabolic connections from available data? J. Exp. Bot. 2011, 62, 869–882. [Google Scholar] [CrossRef] [Green Version]
  85. Irving, L. Carbon assimilation, biomass partitioning and productivity in grasses. Agriculture 2015, 5, 1116–1134. [Google Scholar] [CrossRef] [Green Version]
  86. Vargas-Ortiz, E.; Espitia-Rangel, E.; Tiessen, A.; Délano-Frier, J.P. Grain amaranths are defoliation tolerant crop species capable of utilizing stem and root carbohydrate reserves to sustain vegetative and reproductive growth after leaf loss. PLoS ONE 2013, 8, e67879. [Google Scholar] [CrossRef]
  87. Alfonso, S.U.; Brüggemann, W. Photosynthetic responses of a C3 and three C4 species of the genus Panicum (s.l.) with different metabolic subtypes to drought stress. Photosynth. Res. 2012, 112, 175–191. [Google Scholar] [CrossRef]
  88. Shabala, S.; White, R.G.; Djordjevic, M.A.; Ruan, Y.L.; Mathesius, U. Root-to-shoot signalling: Integration of diverse molecules, pathways and functions. Funct. Plant Biol. 2016, 43, 87–104. [Google Scholar] [CrossRef] [Green Version]
  89. Talebi, R.; Fayaz, F.; Naji, A.M. Effective selection criteria for assessing drought stress tolerance in durum wheat (Triticum durum Desf.). Gen. Appl. Plant Physiol. 2009, 35, 64–74. [Google Scholar]
  90. Panthuwan, G.S.; Fokai, M.; Cooper, S.; Rajatasereekul, S.O.; O’Toole, J.C. Yield response of rice genotypes to different types of drought under rainfed lowlands. Part 1: Grain yield and yield components. Field Crop Res. 2002, 41, 45–54. [Google Scholar]
  91. Gholipouri, A.; Sedghi, M.R.; Sharifi, S.; Nazari, N.M. Evaluation of drought tolerance indices and their relationship with grain yield in wheat cultivars. Recent Res. Sci. Technol. 2009, 1, 195–198. [Google Scholar]
  92. Anwar, J.; Subhani, G.M.; Hussain, M.; Ahmad, J.; Hussain, M.; Munir, M. Drought tolerance indices and their correlation with yield in exotic wheat genotypes. Pak. J. Bot. 2011, 43, 1527–1530. [Google Scholar]
  93. Tardieu, F. Plant response to environmental conditions: Assessing potential production, water demand, and negative effects of water deficit. Front. Physiol. 2013, 4, 17. [Google Scholar] [CrossRef] [PubMed] [Green Version]
Figure 1. Soil volumetric content (% vol) of water-sufficient (WS) and water-deficient (WD) treatments in Trial I and Trial II. Values represented are the mean of 44 A. tricolor accessions in Trial I (N = 3) and Trial II (N = 4), and error bars represent the standard error of the mean (SEM).
Agriculture 11 00994 g001
Figure 2. The examples of rewatering assessment on amaranth accessions, entry 13 and 14. The images were captured (i) a day before the imposition of drought stress (100% WHC), (ii) at terminal drought stress (10% WHC), (iii) after 24-h of rewatering and (iv) after 72-h of rewatering.
Agriculture 11 00994 g002
Figure 3. Principal component biplot grouping for drought tolerance indices in (a) Trial I and (b) Trial II.
Agriculture 11 00994 g003
Figure 4. Cluster analysis of drought tolerance ranking for the 44 A. tricolor accessions calculated based on the GMP, MP and STI values in Trial I and Trial II. The dendrogram discriminates amaranth into four drought tolerance rankings (high, moderate and low tolerance, and high susceptibility). Data represent mean of yield under water-sufficient (WS) and water-deficient (WD) conditions; *43, *44, *45, *46 accessions check variety. Black star represents tolerant accession and white star represents susceptible accessions, consistent in both trials.
Agriculture 11 00994 g004
Figure 5. Principal component biplot on tolerance grouping in association with physiological responses under WS and WD conditions (a) in Trial I and (b) in Trial II.
Agriculture 11 00994 g005
Table 1. List of plant materials used for drought tolerance in two screening trials.
EntryAccessionsGermplasmIDOrigin Country
1AV-TRI 2AVRDCVI055356Bangladesh
2AV-TRI 18AVRDCVI044446India
3AV-TRI 26AVRDCVI049006Thailand
4AV-TRI 33AVRDCVI050610-AViet Nam
5AV-TRI 34AVRDCVI050609-AViet Nam
6AV-TRI 39AVRDCVI054572Philippines
7AV-TRI 40AVRDCVI054571Philippines
8AV-TRI 44AVRDCVI048286Bangladesh
9AV-TRI 49AVRDCVI047504Bangladesh
10AV-TRI 51AVRDCVI057270Cambodia
11AV-TRI 53AVRDCVI042979Indonesia
12AV-TRI 54AVRDCVI042978Indonesia
13AV-TRI 56AVRDCVI058498India
14AV-TRI 57AVRDCVI044426Malaysia
15AV-TRI 58AVRDCVI055139Malaysia
16AV-TRI 68AVRDCVI050111Taiwan
17AV-TRI 69AVRDCVI049431Taiwan
18AV-TRI 3AVRDCVI055353Bangladesh
19AV-TRI 11AVRDCVI047795Bangladesh
20AV-TRI 24AVRDCVI044396-APakistan
21AV-TRI 31AVRDCVI050615-AViet Nam
22AV-TRI 20AVRDCVI043725Malaysia
23AV-TRI 21AVRDCVI043724Malaysia
24US-TRI 3USDAAmes 29505Brazil
25US-TRI 6USDAPI 478310China
26US-TRI 13USDAAmes 2039Indonesia
27US-TRI 14USDAAmes 5354Madagascar
28US-TRI 15USDAAmes 2029Malaysia
29US-TRI 16USDAAmes 29034Malaysia
30US-TRI 19USDAAmes 2199Taiwan
31US-TRI 21USDAPI 607446Thailand
32US-TRI 24USDAPI 632237USA
33US-TRI 25USDAAmes 5110West Africa
34US-TRI 29USDAAmes 26216China
35US-TRI 39USDAAmes 2132India
36US-TRI 46USDAAmes 5118Puerto Rico
37US-TRI 47USDAAmes 1993Taiwan
38US-TRI 20USDAAmes 2024Thailand
39US-TRI 30USDAAmes 5102Hong Kong
40US-TRI 48USDAAmes 1998Taiwan
41US-TRI 49USDAAmes 5134USA
42US-TRI 51USDAPI 633591Unknown
43Local RedLOCAL (Check)var. BBS027Malaysia
44Local PRLOCAL (Check)var. BBS014Malaysia
45ThidaE-WEST (Check)ThidaTanzania
46ZeyaE-WEST (Check)ZeyaTanzania
Table 2. Restricted maximum likelihood (REML) combined analysis for yield, leaf fresh weight (LFW), fresh weight of leaf (LFW) and stem (SFW), dry weight of leaf (LDW) and Genotypic variations in growth and plant physiology in response to drought stress stem (SDW), total leaf area (TLA), specific leaf area (SLA), relative water content (RWC) and Fv’/Fm’of 44 A. tricolor accessions under two water treatments evaluated across the two screening trials. Significant difference at p < 0.05, <0.01, <0.001 (*, **, *** respectively) and non-significant (ns).
Yield (g)LFW (g)SFW (g)LDW (g)SDW (g)TLA (cm2)SLA (cm2g−1)RWC Fv’/Fm’
100% WHC20% WHC100% WHC20% WHC
Estimated variance
Trial (T)468.693.83142.760.880.836463444911.0100.00490
T × Water treatment (WT)2.41.020.230.060264512132.087.10.00010.0003
T × Accession(A)23.59.0610.320.040.111275820520.5800.00010
T × WT × A−4.3−1.46−0.720.02−0.01−1931121−0.050−0.00070
Error Trial I19.826.3164.750.140.14554204232.01227.10.0030.0075
Error Trial II123.335.5241.820.540.41398893312339.91153.50.00660.0077
Wald tests for
fixed effects
WT63.39 ***51.98 ***90.02 ***1.51 ns22.46 ***12.64 ***5.62 *0.77 ns76.65 ***0.01 ns5.44 *
A59.06 *65.23 *68.06 **102.68 ***92.78 ***62.99 *30.44 ns67.57 *51.01 ns71.5 **78.19 ***
WT × A132.96 ***204.03 ***116.47 ***48.86 ns55.82 ns91.3 ***26.51 ns37.86 ns61.2 *67.73 **42.92 ns
Table 3. Mean and the analysis of variance of water treatment on yield and biomass partitioning: fresh weight of leaf (LFW) and stem (SFW), dry weight of leaf (LDW) and stem (SDW), total leaf area (TLA) and specific leaf area (SLA) in 44 A. tricolor accessions evaluated in Trial I (n = 3) and Trial II (n = 4). Significant difference at p < 0.05, <0.01, <0.001 (*, **, *** respectively) and non-significant (ns).
Yield and Biomass Partitioning
Trial IYield (g)LFW (g)SFW (g)TLA (cm2)LDW (g)SDW (g)SLA (cm2g−1)
Mean
Water-sufficient15.788.427.37265.491.150.94239.62
Water-deficient4.211.812.40129.291.090.78118.78
SEM3.962.582.5079.820.340.3041.82
p-values
Water treatment (WT) 8838 *2882 *1626 *12,224,197 **0.19 ns1.76 ns963,703 **
Accession (A)28.88 ***12.52 ***13.07 ***17,104 **0.47 ***0.32 ***4008 **
WT × A20.54 ***8.28 **6.90 ***7713 **0.15 *0.08 ns2807 ns
Subplot error9.43.252.5436770.10.061515
Trial II
Mean
Water-sufficient48.1123.224.90682.322.482.27305.06
Water-deficient33.2414.518.73440.832.002.02257.44
SEM11.276.897.42248.690.830.71106.28
p-values
Water treatment (WT) 19,453 ***6690 **3327 *5,132,472 **20.34 **5.48 ns199,527 *
Accession (A)6673 **234.29 ***289.25 ***318,207 ***4.59 ***3.42 **80,039 ***
WT × A115.11 ns42.42 *41.01 ns46,112 *0.41 ns0.36 ns41,261 ns
Subplot error94.926.736.1931,7610.490.3933,114
Table 4. Mean and the analysis of variance of water treatment on relative water content and chlorophyll fluorescence in 44 A. tricolor accessions (A) at different water holding capacity (WHC) evaluated in Trial I (n = 3) and Trial II (n = 4). Data represents mean, standard error of mean (SEM), mean square with probability significantly different at p < 0.05 (*), p < 0.01 (**), p < 0.001 (***) or non-significant (ns) and mean square of error.
Relative Water Content (RWC)Chlorophyll Fluorescence
Light-Adapted Quantum Yield (Fv’/Fm’)Dark-Adapted Quantum Yield (Fv/Fm)
Trial I Trial II Trial ITrial IITrial II
WHC100%20%100%50%20%100%20%100%50%20%100%50%20%
Mean
Water-sufficient89.9990.8490.3387.0986.730.650.560.540.520.540.720.670.64
Water-deficient87.1361.1290.6582.9275.980.640.490.540.530.530.720.670.63
SEM3.253.632.084.633.270.020.030.040.030.040.030.040.04
p-value
Water treatment (WT)539.94 ns58,296 **2.84 ns9124 **40,687 *0.01 ns0.36 ns0.001 ns0.0002 ns0.03 ns0.02 ns0.02 ns0.03 ns
Accession (A)55.63 **199.30 ns44.13 ns226.4 **199.01 ***0.002 ns0.01 *0.003 ns0.008 ***0.01 ***0.006 ns0.01 *0.01 **
WT × A28.12 ns229.20 ns39.60 ns121.50 ns181.64 **0.001 ns0.06 ns0.003 ns0.002 ns0.005 ns0.003 ns0.04 ns0.01 ns
Subplot error30.08209.339.98129.694.610.0020.060.0020.0030.0060.0050.0040.01
Table 5. Mean and the analysis of variance of leaf gas exchange measurements in 44 A. tricolor accessions at different water holding capacity (WHC) evaluated in Trial II (n = 4). Data represent mean, standard error of mean (SEM), mean square with probability significantly different at p < 0.05 (*), p < 0.01 (**), p < 0.001 (***) or non-significant (ns) and mean square of error.
Leaf Gas ExchangePhotosynthesis, Pn (µmolCO2m−2s−1)Stomatal Conductance, Gs (molH2Om−2s−1)Transpiration, E (mmolH2Om−2s−1)Intracellular [CO2], Ci
(µmolCO2mol−1)
Instantaneous Water Use Efficiency, WUE (μmolmol−1)Intrinsic WUE, WUEi
(μmolmmol−1)
Stomatal Limitation, Ls
WHC100%50%100%50%100%50%100%50%100%50%100%50%100%50%
Mean
Water-sufficient24.6119.30.160.134.033.48109.97108.526.176.13164.64170.250.720.72
Water-deficient33.0419.070.220.124.993.17111.6795.787.056.35160.01176.450.710.75
SEM7.996.270.060.051.111.3442.2750.561.351.6729.5537.530.110.13
p-value
Water treatment (WT)591.57 ns2.62 ns0.305 ns0.010 ns739 ns8.49 ns77.53 ns16,542 ns65.33 ns5.20 ns1468 ns4227 ns0.01 ns0.09 ns
Accession (A)327.67 ***138.83 ***0.016 ***0.008 ***10,371 ***4.82 ***6.62 ***11,560 ***14.25 ***10.23 ***5234 ***4979 ***0.07 ***0.08 ***
WT × A155.85 ns119.82 ***0.007 ns0.007 ***4729 ns4.40 ***2.41 ns5523 **6.27 ns8.44 ***24933346 *0.030.04 **
Spit plot error4755.250.0030.00319741.861.3632481.732.9388021790.010.02
Table 6. Mean and the analysis of variance of days to the early panicle flowering (DTF), days to wilting (DTW), leaf wilting scoring (LWS), drought stress symptoms scoring (DS) and effects of rewatering on the days to recover (DTR) and DS at first and fifth day of recovery (DS-1R, DS-5R, respectively) in 44 A. tricolor accessions. Data represent range, mean, mean square with probability significantly different at p < 0.01 (**), p < 0.001 (***) or non-significant (ns) and mean square of error, n = 3.
Rewatering Assessment
Drought Stress Recovery
DTFDTWLWSDSDTRDS-1RDS-5R
Range0–41–80–50–71–60–90–9
Mean3332245
p-value
Accession2.67 **2.87 ns2.209 ns2.22 ns5.73 ***16.24 ***29.61 ***
Error1.393.482.12.240.81.717.12
Publisher’s Note: MDPI stays neutral with regard to jurisdictional claims in published maps and institutional affiliations.

