Article

Detection of Fusarium Head Blight in Wheat Ears Using Continuous Wavelet Analysis and PSO-SVM

1
National Engineering Research Center for Agro-Ecological Big Data Analysis & Application, Anhui University, Hefei 230601, China
2
State Key Laboratory of Remote Sensing Science, Aerospace Information Research Institute, Chinese Academy of Sciences, Beijing 100094, China
3
University of Chinese Academy of Sciences, Beijing 100049, China
*
Author to whom correspondence should be addressed.
Submission received: 3 September 2021 / Revised: 7 October 2021 / Accepted: 11 October 2021 / Published: 13 October 2021

Abstract

:
Fusarium head blight, caused by a fungus, can cause quality deterioration and severe yield loss in wheat. It produces highly toxic deoxynivalenol, which is harmful to human and animal health. In order to quickly and accurately detect the severity of fusarium head blight, a method of detecting the disease using continuous wavelet analysis and particle swarm optimization support vector machines (PSO-SVM) is proposed in this paper. First, seven wavelet features for fusarium head blight detection were extracted using continuous wavelet analysis based on the hyperspectral reflectance of wheat ears. In addition, 16 traditional spectral features were selected using correlation analysis, including two continuous removal transformed spectral features, six differential spectral features, and eight vegetation indices. Finally, wavelet features and traditional spectral features were used as input features to construct fusarium head blight detection models in combination with the PSO-SVM algorithm, and the results were compared with those obtained using random forest (RF) and a back propagation neural network (BPNN). The results show that, under the same feature variables, the PSO-SVM detection method gave an overall higher accuracy than the BPNN detection method, while the overall accuracy of the RF detection model was the lowest. The overall accuracy of the RF, BPNN and PSO-SVM detection models with wavelet features was higher by 3.7%, 2.9% and 8.3% compared to the corresponding methodological models with traditional spectral features. The detection model with wavelet features combining the PSO-SVM algorithm gave the highest overall accuracies (93.5%) and kappa coefficients (0.903) in the six monitoring models. These results suggest that the PSO-SVM algorithm combined with continuous wavelet analysis can significantly improve the accuracy of fusarium head blight detection on the wheat ears scale.

1. Introduction

Wheat is the most important food crop in the world, and it is a staple food for about one-third of the world’s population [1]. Therefore, healthy and stable wheat growth is important in regard to food security. Fusarium head blight (FHB) is one of the main wheat diseases, which can cause the deterioration of quality and a serious loss of yield [2,3]. Moreover, the pathogen produces toxic deoxynivalenol (DON), which is detrimental to animal and human health [4]. Therefore, the development of an accurate and fast method of monitoring FHB is important for the control of this disease.
Conventional detection methods, such as sampling analysis, are mostly performed by experts and experienced farmers in the field. This approach cannot meet the requirements for monitoring large areas, and it is time-consuming and laborious [5,6]. Hyperspectral remote sensing technology can quickly monitor crop diseases and is suitable for large-scale applications [7,8]. Owing to these advantages, it developed quickly and has a wide range of applications in monitoring the spectrum of crop diseases. At present, several types of spectral features have been mentioned and applied to the spectral detection of crop diseases, including continuous removal transformed features, vegetation indices and differential spectral features. For example, Feng et al. [9] analyzed wheat hyperspectral data using powdery mildew canopy and successfully monitored wheat powdery mildew based on the normalized differential vegetation index (NDVI) and ratio vegetation index (RVI). Jing et al. [10] constructed a model for monitoring the severity of wheat rust using 11 differential spectral features and a random forest algorithm, which provided a decision coefficient of 0.92. Huang et al. [11] constructed a model for FHB monitoring using first-order differential spectral features, vegetation indices and continuous removal transformed features combined with a support vector mechanism. Zheng et al. [12] precisely identified wheat rust using a three-band photochemical reflectance Index (PRI) and anthocyanin reflectance index (ARI).
In addition to these traditional spectral features (SFs), continuous wavelet analysis (CWA), as a new tool for signal processing and analysis, has also been applied to hyperspectral information extraction [13,14]. Zhang et al. [15] successfully used CWA and partial least squares regression to estimate the severity of powdery mildew disease at the leaf level. Chen et al. [16] accurately estimated the nitrogen content in soybean leaf and leaf carbon content through linear models constructed using CWA. Shi et al. [17] analyzed hyperspectral data of wheat and successfully distinguished powdery mildew and yellow rust in wheat using CWA. These results prove the feasibility of CWA for use in crop hyperspectral analysis. However, the wavelet features (WFs) obtained by CWA have rarely been applied to the detection of FHB, and a comparison between traditional SFs and WFs is lacking, so further research is needed.
In terms of classification methods, support vector machines (SVM) have low data distribution requirements and can effectively solve the problem of identifying small sample modes, which are widely used for the spectral detection of crop diseases [18]. However, the kernel function parameter gamma and penalty factor c of an SVM can dramatically affect the classification accuracy [19]. The traditional grid search algorithm is inefficient, computationally intensive, time-consuming and unsatisfactory [20]. Particle swarm optimization (PSO) can be used to find an optimal solution through inter-individual coordination and information exchange [21]. PSO is not only easy to implement, but also converges quickly. Therefore, PSO is widely used to solve model parameter optimization problems.
In this study, WFs and traditional SFs were extracted based on a hyperspectral dataset of wheat ears. By combining the above two sets of feature variables with three algorithms (PSO-SVM, RF and BPNN), a total of six detection models for FHB were constructed, and the accuracy of the detection models was compared. This study aimed to (1) determine the most appropriate CWA-derived WFs for the detection of FHB in winter wheat ears, (2) determine the performance of CWA for the detection of FHB through a comparison of WFs and traditional SFs, and (3) identify the most suitable modeling method by comparing RF, BPNN and PSO-SVM algorithms.

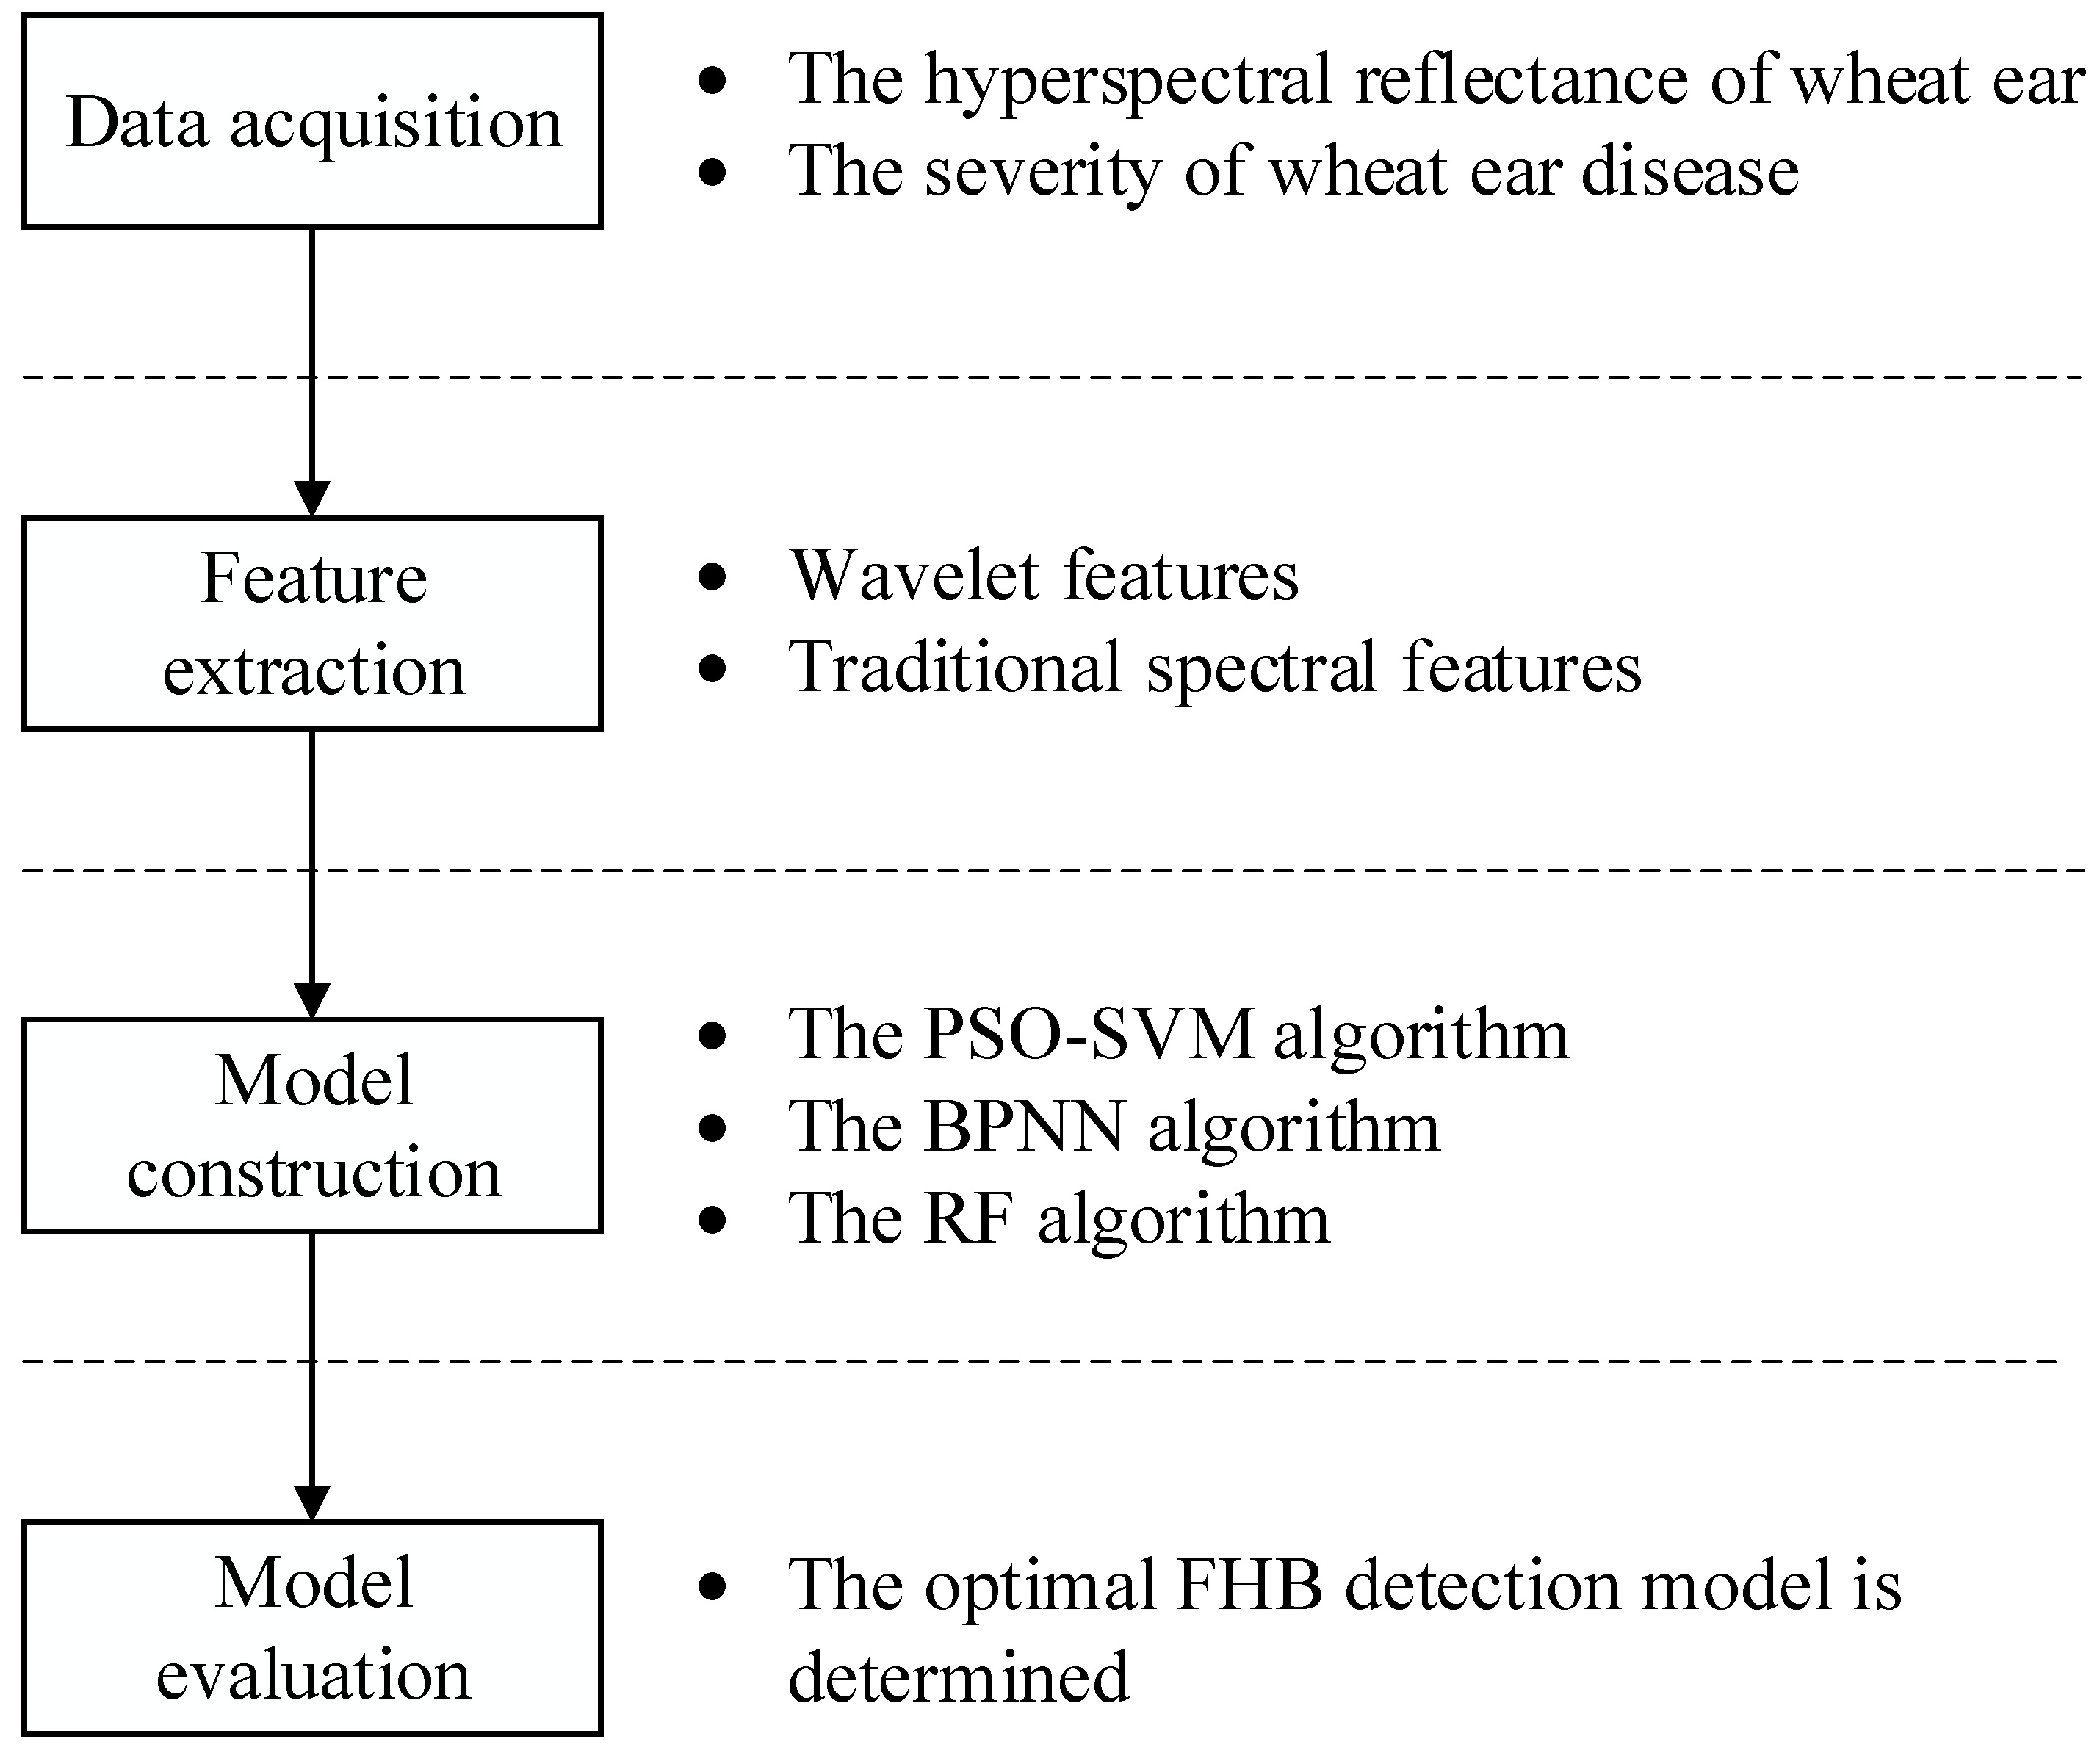
2. Materials and Methods

The workflow of our study is shown in Figure 1. This study involved four main steps: data acquisition, feature extraction, model construction and model evaluation. Each step is described in detail in the following sections. In addition, Python was used for data analysis and model construction in this study.

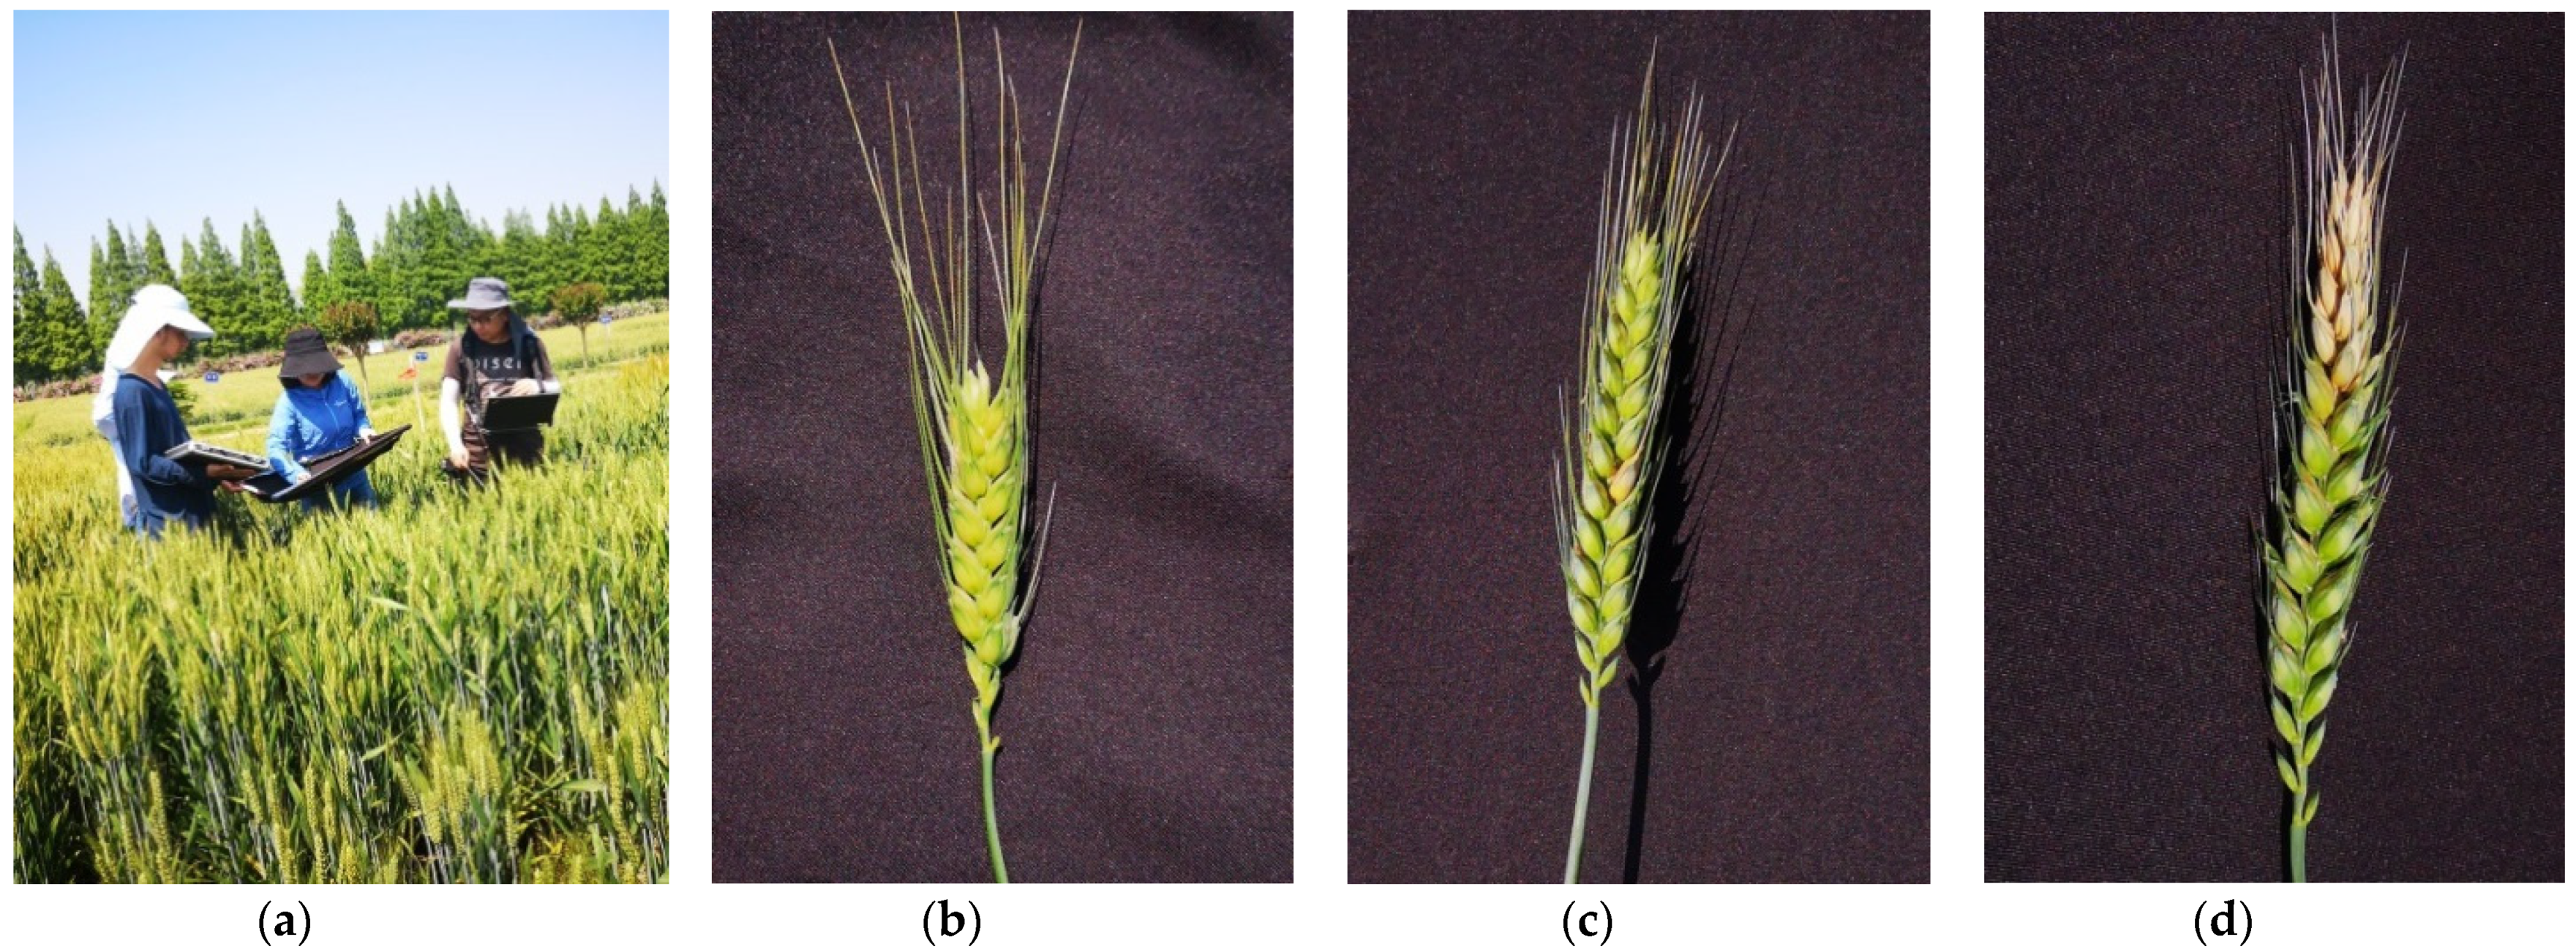
2.1. Experimental Areas

The experimental area is located in Guohe Town, Lujiang County, Anhui Province (31°29′ N, 117°13′ E). Anhui Province is located in eastern China and situated in a subtropical and warm temperate transition climate zone [11]. The average annual temperature of the province is 12~19 °C, and the annual precipitation is 700~1700 mm [20]. FHB is a typical climatic disease, and high temperature and humidity are very conducive to the outbreak of the disease, especially in wheat during tasseling and flowering [22]. According to the meteorological data of Anhui Province, the study area had large precipitation amounts and high temperatures in April 2019. At that time, local wheat was in the wheat heading and flowering stages, which provided favorable conditions for the prevalence of FHB in wheat.

2.2. Data Acquisition

In this experiment, data regarding the hyperspectral reflectance of wheat ears in different diseases of wheat blast were collected in the field environment during two periods: 5 and 8 May 2019. An ASD Field Spec Pro FR spectrometer, with a spectral range of 350~2500 nm, was used in the experiment. The spectral resolution in the region of 350~1000 nm and 1000~2500 nm is 3 nm and 10 nm, respectively. In order to reduce the influence of the solar zenith angle on the measurement results, all spectral measurements were conducted between 10:00 and 14:00. In this study, to accurately measure the spectra of wheat ears, we used a 1 × 1 m black cloth. The wheat ears collected from the field were placed on the black cloth, and the spectrometer probe was placed on top of the wheat ear to measure the spectrum (Figure 2). Each wheat ear sample was measured 10 times and the spectrum was calibrated with a 40 × 40 cm BaSO4 calibration panel before each measurement. An average of the 10 spectra was used as the reflectance spectrum of the wheat ear, and the spectral curve was resampled to 1 nm. The spectral range from 350 to 1000 contains the main disease information, while the spectral range from 1000 to 2500 contains little disease information and more noise, which may affect the detection results. Therefore, only the spectral range of 350 to 1000 was selected in this study.
When collecting the spectrum of each wheat ear, the severity of wheat ear disease was calculated. According to the technical specification for the prediction of wheat head blight (GB/T 15796-2011) published and implemented in 2011, the severity of the disease for each wheat ear is the ratio of the number of infected grains to the total amount of grains. The severity of the disease ranges from 0 to 1, with 0 denoting healthy samples and 1 denoting severely infected samples. In this study, 108 samples of wheat ears were collected. Taking into account the number of samples and the distribution of disease severity, the disease severity was reclassified into three categories, with 38 healthy samples (disease severity = 0), 38 samples with mild infection (0 < disease severity < 0.5) and 32 samples with severe infection (disease severity ≥ 0.5).

2.3. Analysis Methods

2.3.1. Continuous Wavelet Analysis

In the study, CWA was performed on the spectral data of reflectance of wheat ears, which extracted WFs for the detection of wheat FHB. The CWA process is shown in Figure 3, which is divided into three steps: calculation of the wavelet power scalogram, construction of the correlation scalogram and identification of WFs by threshold.
Step 1: Calculation of the wavelet power scalogram.
First, the continuous wavelet transform was performed on spectral reflectance data of wheat ears, and the generic form of the applied mother wavelet basis function is shown in Equation (1):
ψ a , b ( λ ) = 1 a ψ ( λ b a )  
where a is the scaling factor of the wavelet width and b is the shift factor of the wavelet position. Based on the absorption characteristics of vegetation indices, this study selected Mexican caplets [23]. In order to reduce the difficulties in the calculation, only the wavelet power of the pairwise scales (2n, n = 1, 2… 10) was used [24]. The wavelet energy coefficients generated by the continuous wavelet transform are obtained using Equation (2):
W f ( a , b ) = < f ( λ ) , ψ a , b > = + ψ ( λ b a ) d λ
where   f ( λ ) is the reflectance spectrum and   W f ( a , b ) is the wavelet energy coefficient.
Step 2: Construction of the correlation scalogram.
The correlation between wavelet energy coefficients and disease severity was analyzed in order to generate a series of decision coefficients (R2). The m × n matrix is composed of R2 values of wavelet energy coefficients on different scales in different bands, which is called a correlation scalogram. This correlation scalogram summarizes the sensitivity between the wavelet energy coefficients and the severity of the disease [25].
Step 3: Identification of WFs by threshold.
WFs were selected from the correlation spectrogram using the threshold method, i.e., a 5% threshold was used in this study. Thus, 5% of the highest R2 elements in the correlation spectra were conserved as the wavelet feature regions. Only the elements with the highest R2 were conserved as WFs for use in FHB detection in each wavelet feature region.

2.3.2. Traditional Spectral Features

To determine the performance of CWA in FHB identification, a total of 16 SFs were selected for comparison with WFs extracted via CWA (Table 1). Spectral differential transform and continuum removal transform can eliminate some background effects and can increase implicit information, so differential spectral features and continuum removal spectral features are widely used in detecting crop disease spectra [26,27]. In addition, eight vegetation indices were selected and applied for use in the spectral detection of crop diseases [11,25,28]: (1) photosynthesis—physiological reflectance index (PHRI); (2) pigment variation parameters—triangular vegetation index (TVI), anthocyanin reflectance index (ARI) and normalized pigment chlorophyll index (NPCI); (3) greenness—greenness index (GI); (4) biophysical parameters—narrow band normalized vegetation index (NBNDVI) and plant senescence reflectance index (PSRI); and (5) water and nitrogen content—nitrogen reflectance index (NRI). The sources of definitions, references and descriptions of these 16 traditional SFs are summarized in Table 1.

2.3.3. Model Construction and Evaluation

An SVM cleverly solves the operation of inner product in a high-dimensional space using the kernel function, so it solves the issue of nonlinear classification [38]. In accordance with the results of previous studies, the radial basis kernel function (RBF) was used in this study [39]. However, the RBF kernel parameter gamma and penalty factor c can greatly affect the accuracy of the classification [40]. PSO is an optimization algorithm, which is easy to implement because it does not have to adjust too many parameters [19]. The PSO-SVM detection model construction process is shown in Figure 4, and the steps used in this study to optimize the SVM using PSO are as follows:
  • The penalty parameter c and the radial basis function parameter gamma are encoded in the form of real number vectors as the particle positions of PSO. The parameters of PSO are initialized, such as the number of iterations, population size, inertia factor, learning factor, and the location and velocity of each particle.
  • The particle fitness value is set as the classification accuracy, and the suitability value of each particle is calculated on the basis of the position parameters of the initial particle. The individual particle extremum, Pbest and the population extremum, Gbest, are updated according to the suitability value.
  • The values of velocity, position and suitability of each particle are recalculated by iteration, and then the group extreme value, Gbest, and the individual extreme value, Pbest, are adjusted according to the suitability value in the new population after the iteration.
  • When the maximum number of iterations is reached, the location parameter of the particle with the highest suitability value is displayed as the penalty parameter c and the function parameter gamma.
  • The optimal penalty parameter c and the radial basis function parameter gamma obtained via the PSO algorithm are substituted in the SVM for the construction of the PSO-SVM detection model.
In addition, to better evaluate the role of the PSO-SVM algorithm in the detection model, two classical algorithms (RF and BPNN) were used to be compared with the PSO-SVM algorithm [41,42]. A total of six detection models for FHB were constructed by combining two sets of feature variables (WFs and SFs) with three classification methods (RF, BPNN and PSO-SVM). To better evaluate the accuracy and stability of these detection models, a 10-fold cross-validation method was used in this study [43,44]. In this method, the wheat samples were divided into 10 mutually exclusive subsets of similar size. Each subset was used as a test set, and the remaining 9 subsets of data were used as a training set. The results of 10 tests were counted to obtain a confusion matrix of the detection model. Finally, the performance of the detection model was evaluated using sensitivity, kappa coefficient, specificity and overall accuracy in the confusion matrix.

3. Results and Discussion

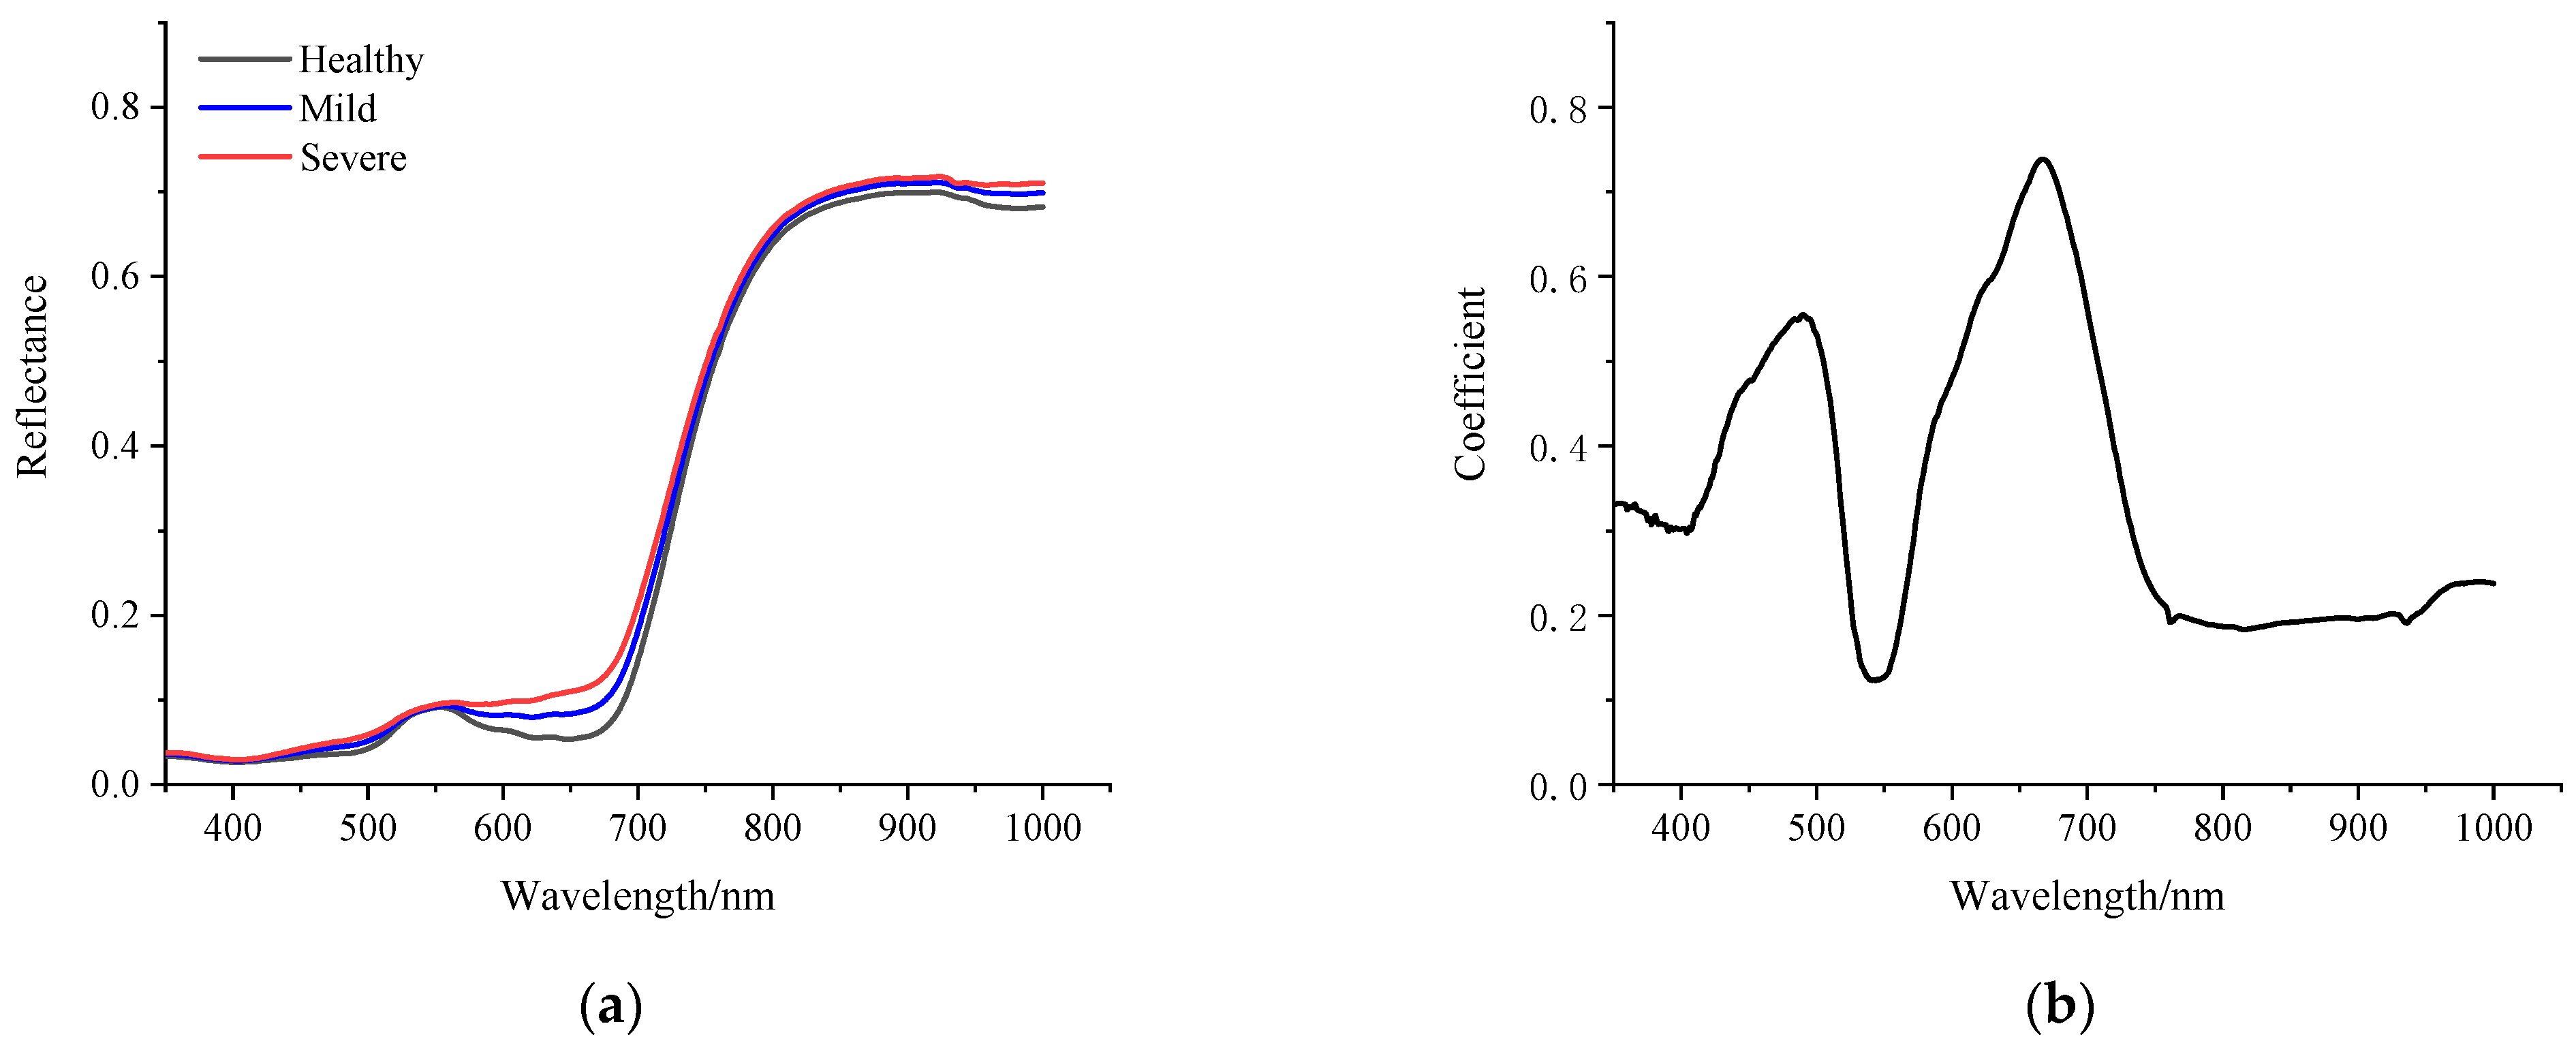
3.1. Variations in Reflectance Spectra Due to Fusarium Head Blight

Figure 5 shows the spectral reflectance curves at different disease severities and the curves of the correlation coefficients between the disease severity and reflectance. As seen in Figure 5a, the spectral reflectance increased with disease severity, which is why a positive correlation can be found between disease severity and reflectance in the 350–1000 nm band range (Figure 5b). In addition, it is obvious that the spectral reflectance of the infected wheat ears significantly increased in the ranges 450–520 and 582–720 nm, so a high correlation coefficient can be found in the ranges 450–520 and 582–720 nm. However, the change in spectral reflectance at wavelengths from 520 to 582 nm was not significant. This result was obtained because when the pathogen-infected wheat ears, the content of chlorophyll and carotene in wheat ears was reduced in order to weaken the spectral absorption capacity in visible regions, so infected wheat ears have higher spectral reflectance than healthy wheat ears [45,46]. These results show a change in the reflectance spectra due to FHB, which indicates the potential of hyperspectral data in FHB detection.

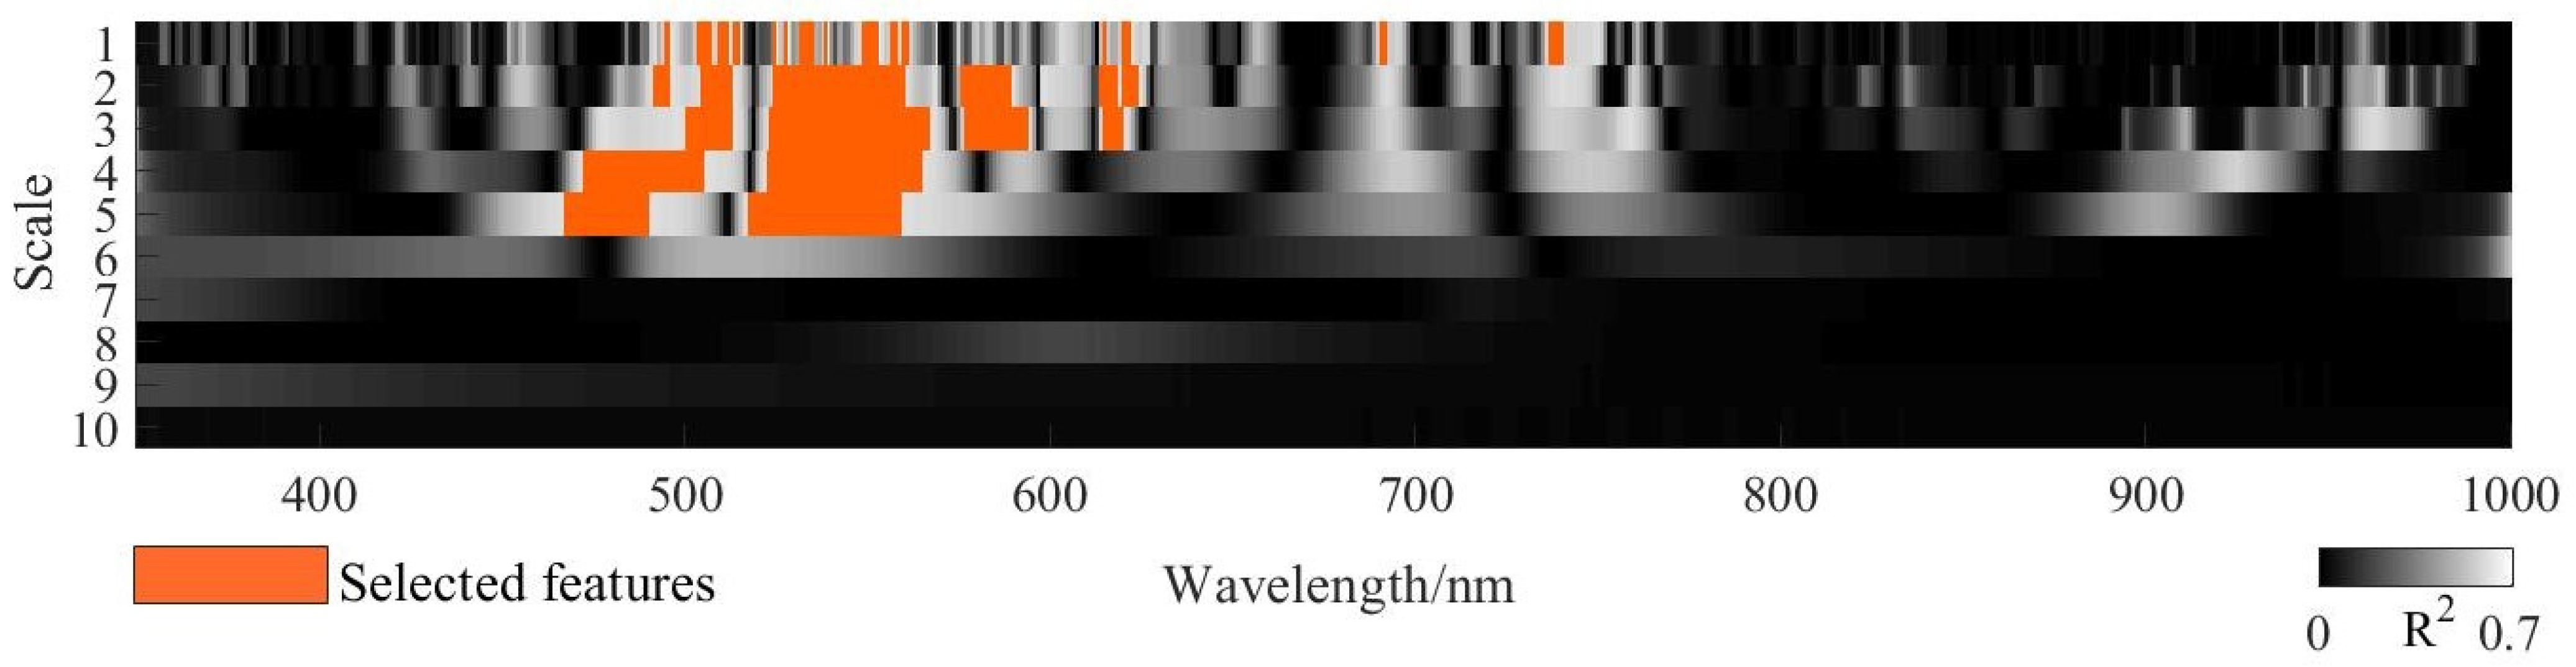
3.2. Sensitivities to Fusarium Head Blight with Wavelet Features

Based on the data on the hyperspectral reflectance of wheat ears, the correlation scalogram generated by the application of CWA is shown in Figure 6. In this study, the threshold of R2, which is the largest 5% in the correlation scalogram, is 0.62. Based on this threshold, a total of seven wavelet feature regions were selected from the correlation scalogram. The highest R2 element was retained in each wavelet feature region, which generated a total of seven WFs for use in FHB detection. The band positions and scales of these WFs are summarized in Table 2. All of these WFs were distributed at low scales of two to five, and their bands were generally distributed at pigment absorption positions in the visible region from 380 to 780 nm, such as blue valley (WF01), blue edge (WF02), green peak (WF03), yellow edge (WF04), orange edge (WF05) and red edge (WF06, WF07). These wavelet positions indicate a significant change in the pigment content in the infected wheat ear [15,17,24]. In addition, the WFs were highly significantly correlated with disease severity (p < 0.001), and the absolute value of their correlation coefficient with disease severity was greater than or equal to 0.8. This result shows that wavelet technology has great potential for FHB spectral detection.

3.3. Sensitivities to Fusarium Head Blight with Traditional Spectral Features

Table 3 summarizes the correlation coefficients and absolute coefficients of the selected traditional SFs with disease severity. All 16 selected traditional SFs were highly correlated with disease severity (p-value < 0.001). Among them, three traditional SFs had absolute correlation coefficients greater than or equal to 0.8, namely PSRI, SDy and (SDr − SDy)/(SDr + SDy). PSRI maximizes the sensitivity of the carotenoid to chlorophyll ratio, so it can capture the change in pigmentation within the wheat ear [34]. SDy, (SDr–SDy)/(SDr+SDy) were calculated according to the differential spectral reflectance of the yellow and red edges, which were strongly related to the chlorophyll content [37,47]. Compared with the wavelet features extracted using CWA (Table 2), the sensitivity to FHB of most traditional SFs was weaker. This is because CWA statistically analyzes the entire spectrum at different scales at different locations, so the wavelet features can more sensitively capture changes in pigment content within an infected wheat ear [48].

3.4. Detection Model of Fusarium Head Blight

Table 4 summarizes the sensitivity, kappa coefficient, specificity and overall accuracy of all the wheat FHB detection models. Among all the models, the detection model with WFs combined with the PSO-SVM algorithm gave the highest overall accuracy (93.5%) and kappa coefficient (0.903). The results show that the CWA-derived wavelet features as input variables combined with the PSO-SVM algorithm can effectively detect FHB on the wheat ear scale. In addition, under the same feature variables, the overall accuracy of the detection model constructed using PSO-SVM is higher than that of the BPNN detection model, while the overall accuracy of the detection model constructed using RF is the lowest. When WFs were used as input features, compared to detection models constructed using RF or BPNN algorithms, the overall accuracy of the detection models built using PSO-SVM improved by 11.1% and 7.4%, respectively, and the kappa coefficients were increased by 0.167 and 0.111, respectively. The overall accuracy and kappa coefficient of the PSO-SVM detection model constructed using SFs were 85.2% and 0.778, respectively, which is 6.5% and 2% higher in the overall accuracy, and the kappa coefficient improved by 0.098 and 0.038 compared to the RF and BPNN detection models, respectively. In addition, comparing the sensitivity and specificity of the detection models constructed using the three algorithms, with the same feature variables, the PSO-SVM detection model had the highest sensitivity and specificity, the BPNN detection model had the second highest sensitivity and specificity, and the RF detection model had the lowest sensitivity and specificity. The choice of an appropriate algorithm to build a model has a significant impact on improving the accuracy of crop disease detection [49]. Compared to RF and the BPNN, PSO-SVM cleverly solves the operation of inner product in a high-dimensional space based on a unique kernel function, thus effectively solving the nonlinear classification issue [19,21]. Moreover, the penalty factor c and the kernel parameter gamma were optimized via PSO, thus significantly improving the accuracy of the detection model [21]. Combined with the analysis above, the PSO-SVM detection model has greater practical significance than the crop disease detection model constructed by RF or BPNN algorithms.
In addition, this study focused on comparing the performance of WFs and SFs for FHB detection. RF, BPNN and PSO-SVM detection models constructed using WFs as input features gave overall accuracies of 82.4%, 86.1% and 93.5% with kappa coefficients of 0.736, 0.792 and 0.903, respectively. Compared with the detection models constructed using SFs as input features, the overall accuracy increased by 3.7%, 2.9% and 8.3%, respectively, and the kappa coefficients increased by 0.056, 0.042 and 0.125, respectively. The sensitivity and specificity values of the detection model built using WFs as input features were higher than those of the detection model built using SFs as input features according to the same algorithm. These results show that the wavelet features performed better than the traditional SFs in FHB detection. In the process of WF extraction, CWA analyzed all spectral wavelengths on different scales, and the sensitivities to FHB of wavelet energy coefficients on all different scales at different wavelengths were counted and optimal positions and scales were achieved [24,25,50]. Therefore, the comprehensive performance of the detection model built using SFs as input features is worse than the detection model built using WFs as input features.
However, the CWA method also has limitations. WF extraction using CWA is based on a global statistical search process and is not a physical process, so generalizing WFs relies heavily on a uniformly distributed and representative training sample [13,25,51]. In addition, the effects of the wheat fertility period and variety were not considered. Therefore, tests of generalizability should be performed, and the stability of results should be strengthened in future studies to facilitate the examination of results related to generalizability and stability.

4. Conclusions

In this study, seven WFs for use in FHB detection were extracted using CWA based on the reflectance spectral data (350–1000 nm) of wheat ears. The WFs were then combined with RF, BPNN and PSO-SVM algorithms to build detection models and compared with the detection models built using 16 traditional SFs as input features. The extracted WFs were able to effectively detect the severity of FHB, and their sensitivity to FHB was better than that of SFs. The overall accuracy of the detection models built by the WFs in combination with the three algorithms (RF, BPNN and PSO-SVM) improved by 3.7%, 2.9% and 8.3%, respectively, compared to those built using SFs as input features. The overall accuracy and kappa coefficient of the detection model based on the PSO-SVM algorithm were the highest with the same input features, which improved by more than 2% and 6% compared to the BPNN and RF algorithms, respectively. In addition, among all the detection models, the detection model built using WFs in combination with PSO-SVM had the best performance, with an overall accuracy of 93.5% and a kappa coefficient of 0.903. This illustrates the superior performance of CWA and PSO-SVM in regard to FHB detection.

Author Contributions

Conceptualization, L.H. and K.W.; information analysis, L.H. and K.W.; writing—original draft, L.H. and K.W.; methodology, L.H., Y.D. and W.H.; investigation, Y.D. and W.H.; writing—review and editing, K.W., H.M. and L.L.; software, Y.L. All authors have read and agreed to the published version of the manuscript.

Funding

This work was supported by the Beijing Nova Program of Science and Technology (Z191100001119089), the National Natural Science Foundation of China (42071423), the National Natural Science Foundation of China (42071320), the Program of Bureau of International Cooperation, the Chinese Academy of Sciences (183611KYSB20200080), SINO-EU, Dragon 5 proposal: Application of Sino-Eu Optical Data into Agronomic Models to Predict Crop Performance and to Monitor and Forecast Crop Pests and Diseases (ID 57457).

Institutional Review Board Statement

Not applicable.

Conflicts of Interest

The authors declare no conflict of interest.

References

  1. Banerjee, K.; Krishnan, P.; Das, B. Thermal imaging and multivariate techniques for characterizing and screening wheat genotypes under water stress condition. Ecol. Indic. 2020, 119, 16. [Google Scholar] [CrossRef]
  2. Machado, L.V.; Mallmann, C.A.; Mallmann, A.O.; Coelho, R.D.; Copetti, M.V. Deoxynivalenol in wheat and wheat products from a harvest affected by fusarium head blight. Food Sci. Technol. 2017, 37, 8–12. [Google Scholar] [CrossRef] [Green Version]
  3. Malbran, I.; Mourelos, C.A.; Pardi, M.; Oufensou, S.; Balmas, V.; Delogu, G.; Migheli, Q.; Lori, G.A.; Juarez, M.P.; Girotti, J.R. Commercially available natural inhibitors of trichothecene production in Fusarium graminearum: A strategy to manage Fusarium head blight of wheat. Crop Prot. 2020, 138, 7. [Google Scholar] [CrossRef]
  4. Ollier, M.; Talle, V.; Brisset, A.L.; Le Bihan, Z.; Duerr, S.; Lemmens, M.; Goudemand, E.; Robert, O.; Hilbert, J.L.; Buerstmayr, H. QTL mapping and successful introgression of the spring wheat-derived QTL Fhb1 for Fusarium head blight resistance in three European triticale populations. Theor. Appl. Genet. 2020, 133, 457–477. [Google Scholar] [CrossRef] [Green Version]
  5. Huang, L.S.; Zhang, H.S.; Huang, W.J.; Dong, Y.Y.; Ye, H.C.; Ma, H.Q.; Zhao, J.L. Identification of Fusarium head blight in wheat ears using vertical angle-based reflectance spectroscopy. Arab. J. Geosci. 2021, 14, 1–14. [Google Scholar] [CrossRef]
  6. Qiu, R.; Yang, C.; Moghimi, A.; Zhang, M.; Steffenson, B.J.; Hirsch, C.D. Detection of fusarium head blight in wheat using a deep neural network and color imaging. Remote Sens. 2019, 11, 2658. [Google Scholar] [CrossRef] [Green Version]
  7. Zhang, D.; Chen, G.; Zhang, H.; Jin, N.; Gu, C.; Weng, S.; Wang, Q.; Chen, Y. Integration of spectroscopy and image for identifying fusarium damage in wheat kernels. Spectrochim. Acta Part A Mol. Biomol. Spectrosc. 2020, 236, 118344. [Google Scholar] [CrossRef] [PubMed]
  8. Su, W.-H.; Zhang, J.; Yang, C.; Page, R.; Szinyei, T.; Hirsch, C.D.; Steffenson, B.J. Automatic evaluation of wheat resistance to fusarium head blight using dual mask-RCNN deep learning frameworks in computer vision. Remote Sens. 2020, 13, 26. [Google Scholar] [CrossRef]
  9. Feng, W.; Shen, W.Y.; He, L.; Duan, J.Z.; Guo, B.B.; Li, Y.X.; Wang, C.Y.; Guo, T.C. Improved remote sensing detection of wheat powdery mildew using dual-green vegetation indices. Precis. Agric. 2016, 17, 608–627. [Google Scholar] [CrossRef]
  10. Jing, X.; Bai, Z.; Gao, Y. Wheat stripe rust monitoring by random forest algorithm combined with SIF and reflectance spectrum. Trans. CSAE 2019, 35, 154–161. [Google Scholar]
  11. Huang, L.; Wu, Z.; Huang, W.; Ma, H.; Zhao, J. Identification of fusarium head blight in winter wheat ears based on fisher’s linear discriminant analysis and a support vector machine. Appl. Sci. 2019, 9, 3894. [Google Scholar] [CrossRef] [Green Version]
  12. Zheng, Q.; Huang, W.J.; Cui, X.M.; Dong, Y.Y.; Shi, Y.; Ma, H.Q.; Liu, L.Y. Identification of wheat yellow rust using optimal three-band spectral indices in different growth stages. Sensors 2019, 19, 35. [Google Scholar] [CrossRef] [Green Version]
  13. Xu, Y.; Wang, J.J.; Xia, A.Q.; Zhang, K.Y.; Dong, X.Y.; Wu, K.P.; Wu, G.F. Continuous wavelet analysis of leaf reflectance improves classification accuracy of mangrove species. Remote Sens. 2019, 11, 254. [Google Scholar] [CrossRef] [Green Version]
  14. Zhang, S.W.; Shen, Q.; Nie, C.J.; Huang, Y.F.; Wang, J.H.; Hu, Q.Q.; Ding, X.J.; Zhou, Y.; Chen, Y.P. Hyperspectral inversion of heavy metal content in reclaimed soil from a mining wasteland based on different spectral transformation and modeling methods. Spectroc. Acta Part A Molec. Biomolec. Spectr. 2019, 211, 393–400. [Google Scholar] [CrossRef]
  15. Zhang, J.C.; Yuan, L.; Wang, J.H.; Huang, W.J.; Chen, L.P.; Zhang, D.Y. Spectroscopic leaf level detection of powdery mildew for winter wheat using continuous wavelet analysis. J. Integr. Agric. 2012, 11, 1474–1484. [Google Scholar] [CrossRef]
  16. Chen, J.X.; Li, F.; Wang, R.; Fan, Y.F.; Raza, M.A.; Liu, Q.L.; Wang, Z.L.; Cheng, Y.J.; Wu, X.L.; Yang, F.; et al. Estimation of nitrogen and carbon content from soybean leaf reflectance spectra using wavelet analysis under shade stress. Comput. Electron. Agric. 2019, 156, 482–489. [Google Scholar] [CrossRef]
  17. Shi, Y.; Huang, W.; Zhou, X. Evaluation of wavelet spectral features in pathological detection and discrimination of yellow rust and powdery mildew in winter wheat with hyperspectral reflectance data. J. Appl. Remote Sens. 2017, 11, 026025. [Google Scholar] [CrossRef]
  18. Zhang, Z.P.; Ding, J.L.; Zhu, C.M.; Wang, J.Z.; Ma, G.L.; Ge, X.Y.; Li, Z.S.; Han, L.J. Strategies for the efficient estimation of soil organic matter in salt-affected soils through Vis-NIR spectroscopy: Optimal band combination algorithm and spectral degradation. Geoderma 2021, 382, 13. [Google Scholar] [CrossRef]
  19. Wang, Z.; Zhang, X.L.; Zhang, F.; Chan, N.W.; Kung, H.T.; Liu, S.H.; Deng, L.F. Estimation of soil salt content using machine learning techniques based on remote-sensing fractional derivatives, a case study in the Ebinur Lake Wetland National Nature Reserve, Northwest China. Ecol. Indic. 2020, 119, 106869. [Google Scholar] [CrossRef]
  20. Huang, L.; Zhang, H.; Ruan, C.; Huang, W.; Hu, T.; Zhao, J. Detection of scab in wheat ears using in situ hyperspectral data and support vector machine optimized by genetic algorithm. Int. J. Agric. Biol. Eng. 2020, 13, 182–188. [Google Scholar] [CrossRef]
  21. Liu, C.J.; Zhang, F.; Ge, X.Y.; Zhang, X.L.; Chan, N.W.; Qi, Y.X. Measurement of total nitrogen concentration in surface water using hyperspectral band observation method. Water 2020, 12, 18. [Google Scholar] [CrossRef]
  22. Jin, X.; Jie, L.; Wang, S.; Qi, H.; Li, S. Classifying wheat hyperspectral pixels of healthy heads and fusarium head blight disease using a deep neural network in the wild field. Remote Sens. 2018, 10, 395. [Google Scholar] [CrossRef] [Green Version]
  23. Zhang, J.C.; Wang, B.; Zhang, X.X.; Liu, P.; Dong, Y.Y.; Wu, K.H.; Huang, W.J. Impact of spectral interval on wavelet features for detecting wheat yellow rust with hyperspectral data. Int. J. Agric. Biol. Eng. 2018, 11, 138–144. [Google Scholar] [CrossRef] [Green Version]
  24. Zhang, J.; Yuan, L.; Pu, R.; Loraamm, R.W.; Yang, G.; Wang, J. Comparison between wavelet spectral features and conventional spectral features in detecting yellow rust for winter wheat. Comput. Electron. Agric. 2014, 100, 79–87. [Google Scholar] [CrossRef]
  25. Shi, Y.; Huang, W.; González-Moreno, P.; Luke, B.; Dong, Y.; Zheng, Q.; Ma, H.; Liu, L. Wavelet-based rust spectral feature set (WRSFs): A novel spectral feature set based on continuous wavelet transformation for tracking progressive host–pathogen interaction of yellow rust on wheat. Remote Sens. 2018, 10, 525. [Google Scholar] [CrossRef] [Green Version]
  26. Tan, C.W.; Du, Y.; Zhou, J.; Wang, D.L.; Luo, M.; Zhang, Y.J.; Guo, W.S. Analysis of different hyperspectral variables for diagnosing leaf nitrogen accumulation in wheat. Front. Plant Sci. 2018, 9, 11. [Google Scholar] [CrossRef] [PubMed]
  27. Pu, R.; Ge, S.; Kelly, N.M.; Gong, P. Spectral absorption features as indicators of water status in coast live oak (Quercus agrifolia) leaves. Int. J. Remote Sens. 2003, 24, 1799–1810. [Google Scholar] [CrossRef]
  28. Zhang, D.; Wang, Q.; Lin, F.; Yin, X.; Gu, C.; Qiao, H. Development and evaluation of a new spectral disease index to detect wheat fusarium head blight using hyperspectral imaging. Sensors 2020, 20, 2260. [Google Scholar] [CrossRef] [PubMed]
  29. Pu, R.L.; Gong, P. Wavelet transform applied to EO-1 hyperspectral data for forest LAI and crown closure mapping. Remote Sens. Environ. 2004, 91, 212–224. [Google Scholar] [CrossRef]
  30. Gamon, J.A.; Serrano, L.; Surfus, J.S. The photochemical reflectance index: An optical indicator of photosynthetic radiation use efficiency across species, functional types, and nutrient levels. Oecologia 1997, 112, 492–501. [Google Scholar] [CrossRef] [PubMed]
  31. Broge, N.H.; Mortensen, J.V. Deriving green crop area index and canopy chlorophyll density of winter wheat from spectral reflectance data. Remote Sens. Environ. 2002, 81, 45–57. [Google Scholar] [CrossRef]
  32. Gitelson, A.A.; Merzlyak, M.N.; Chivkunova, O.B. Optical properties and nondestructive estimation of anthocyanin content in plant leaves. Photochem. Photobiol. 2001, 74, 38–45. [Google Scholar] [CrossRef]
  33. Filella, I.; Serrano, L.; Serra, J.; Penuelas, J. Evaluation wheat nitrogen status with canopy reflectance index and discriminant analysis. Crop. Sci. 1995, 35, 1400–1405. [Google Scholar] [CrossRef]
  34. Merzlyak, M.N.; Gitelson, A.A.; Chivkunova, O.B.; Rakitin, V.Y. Non-destructive optical detection of pigment changes during leaf senescence and fruit ripening. Physiol. Plant. 1999, 106, 135–141. [Google Scholar] [CrossRef] [Green Version]
  35. Penuelas, J.; Gamon, J.A.; Fredeen, A.L.; Merino, J.; Field, C.B. Reflectance indices associated with physiological changes in nitrogen- and water-limited sunflower leaves. Remote Sens. Environ. 1994, 48, 135–146. [Google Scholar] [CrossRef]
  36. Zarco-Tejada, P.J.; Berjon, A.; Lopez-Lozano, R.; Miller, J.R.; Martin, P.; Cachorro, V.; Gonzalez, M.R.; De Frutos, A. Assessing vineyard condition with hyperspectral indices: Leaf and canopy reflectance simulation in a row-structured discontinuous canopy. Remote Sens. Environ. 2005, 99, 271–287. [Google Scholar] [CrossRef]
  37. Gong, P.; Pu, R.; Heald, R.C. Analysis of in situ hyperspectral data for nutrient estimation of giant sequoia. Int. J. Remote Sens. 2002, 23, 1827–1850. [Google Scholar] [CrossRef]
  38. Guo, A.; Huang, W.; Ye, H.; Dong, Y.; Ma, H.; Ren, Y.; Ruan, C. Identification of wheat yellow rust using spectral and texture features of hyperspectral images. Remote Sens. 2020, 12, 1419. [Google Scholar] [CrossRef]
  39. Huang, L.; Li, T.; Ding, C.; Zhao, J.; Zhang, D.; Yang, G. Diagnosis of the severity of Fusarium head blight of wheat ears on the basis of image and spectral feature fusion. Sensors 2020, 20, 2887. [Google Scholar] [CrossRef]
  40. Han, Z.Y.; Zhu, X.C.; Fang, X.Y.; Wang, Z.Y.; Wang, L.; Zhao, G.X.; Jiang, Y.M. Hyperspectral estimation of apple tree canopy LAI based on SVM and RF regression. Spectrosc. Spectr. Anal. 2016, 36, 800–805. [Google Scholar] [CrossRef]
  41. Jiang, X.H.; Xue, H.R.; Zhang, L.N.; Gao, X.J.; Wu, G.D.; Bai, J. Nondestructive detection of chilled mutton freshness based on multi-label information fusion and adaptive BP neural network. Comput. Electron. Agric. 2018, 155, 371–377. [Google Scholar] [CrossRef]
  42. Chan, A.H.Y.; Barnes, C.; Swinfield, T.; Coomes, D.A. Monitoring ash dieback (Hymenoscyphus fraxineus) in British forests using hyperspectral remote sensing. Remote Sens. Ecol. Conserv. 2021, 7, 306–320. [Google Scholar] [CrossRef]
  43. Shen, X.; Cao, L.; Coops, N.C.; Fan, H.C.; Wu, X.Q.; Liu, H.; Wang, G.B.; Cao, F.L. Quantifying vertical profiles of biochemical traits for forest plantation species using advanced remote sensing approaches. Remote Sens. Environ. 2020, 250, 20. [Google Scholar] [CrossRef]
  44. Zhao, J.L.; Fang, Y.; Chu, G.M.; Yan, H.; Hu, L.; Huang, L.S. Identification of leaf-scale wheat powdery mildew (Blumeria graminisf. sp. Tritici) combining hyperspectral imaging and an SVM classifier. Plants 2020, 9, 936. [Google Scholar] [CrossRef] [PubMed]
  45. Ma, H.; Huang, W.; Jing, Y.; Pignatti, S.; Laneve, G.; Dong, Y.; Ye, H.; Liu, L.; Guo, A.; Jiang, J. Identification of Fusarium head blight in winter wheat ears using continuous wavelet analysis. Sensors 2019, 20, 20. [Google Scholar] [CrossRef] [PubMed] [Green Version]
  46. Zhang, D.-Y.; Chen, G.; Yin, X.; Hu, R.-J.; Gu, C.-Y.; Pan, Z.-G.; Zhou, X.-G.; Chen, Y. Integrating spectral and image data to detect Fusarium head blight of wheat. Comput. Electron. Agric. 2020, 175, 105588. [Google Scholar] [CrossRef]
  47. Guo, T.; Tan, C.W.; Li, Q.; Cui, G.X.; Li, H.G. Estimating leaf chlorophyll content in tobacco based on various canopy hyperspectral parameters. J. Ambient Intell. Humaniz. Comput. 2019, 10, 3239–3247. [Google Scholar] [CrossRef]
  48. Lu, J.; Huang, W.; Zhang, J. Quantitative identification of yellow rust and powdery mildew in winter wheat based on wavelet feature. Spectrosc. Spectr. Anal. 2016, 36, 1854–1858. [Google Scholar]
  49. Ma, H.; Huang, W.; Jing, Y.; Dong, Y.; Zhang, J.; Nie, C.; Tang, C.; Zhao, J.; Huang, L. Remote sensing monitoring of wheat powdery mildew based on AdaBoost model combining mRMR algorithm. Trans. CSAE 2017, 33, 162–169. [Google Scholar]
  50. Li, D.; Wang, X.; Zheng, H.B.; Zhou, K.; Yao, X.; Tian, Y.C.; Zhu, Y.; Cao, W.X.; Cheng, T. Estimation of area- and mass-based leaf nitrogen contents of wheat and rice crops from water-removed spectra using continuous wavelet analysis. Plant Methods 2018, 14, 20. [Google Scholar] [CrossRef]
  51. Zhang, J.C.; Wang, N.; Yuan, L.; Chen, F.N.; Wu, K.H. Discrimination of winter wheat disease and insect stresses using continuous wavelet features extracted from foliar spectral measurements. Biosyst. Eng. 2017, 162, 20–29. [Google Scholar] [CrossRef]
Figure 1. The workflow of the study.
Agriculture 11 00998 g001
Figure 2. Field survey and FHB-infected ear of winter wheat the three diseases severity: (a) field survey, (b) healthy wheat ears, (c) wheat ears with mild infection, (d) wheat ears with severe infection.
Agriculture 11 00998 g002
Figure 3. Flowchart of wavelet feature extraction using continuous wavelet analysis.
Agriculture 11 00998 g003
Figure 4. Flowchart of particle swarm optimized support vector machine detection model.
Agriculture 11 00998 g004
Figure 5. Reflectance spectrum and correlation curve of normal and diseased samples of wheat ear: (a) reflectance spectrum of healthy, mild and severe wheat ear samples (350–1000 nm) and (b) correlation coefficient between reflectance and disease severity.
Agriculture 11 00998 g005
Figure 6. Visualization of the correlation scalogram generated using continuous wavelet analysis. The orange region represents a sensitive wavelet feature region (R2 > 0.62).
Agriculture 11 00998 g006
Table 1. Traditional spectral features selected in the study.
CategoryTitleDefinitionDescription or FormulaReference
Continuous removal transformed spectral featuresDepThe depth of the feature
minimum
relative to the hull
In the range 550–750 nm[27,29]
AreaThe area of the absorption
feature
that is the product of DEP
and WID
In the range 550–750 nm[27,29]
Vegetation indicesPHRIPhysiological reflectance
index
(R550 − R531)/(R531 + R570)[30]
TVITriangular vegetation index0.5 × 120(R750 − R550)–200(R670 − R550)][31]
ARIAnthocyanin reflectance
index
(R550)−1 − (R700)−1[32]
NBNDVINarrow-band normalized
difference
vegetation index
(R850 − R680)/(R850+R680)[33]
NRINitrogen reflectance index(R570 − R670)/(R570 + R670)[33]
PSRIPlant senescence
reflectance index
(R680 − R500)/R750[34]
NPCINormalized total pigment to
chlorophyll a ratio index
(R680 − R430)/(R680 + R430)[35]
GIGreenness indexR554/R677[36]
Differential spectral
features
DbFirst-order maximal derivative
inside blue edge
In the range 490–530 nm[37]
SDbSummation of first-order
derivatives inside blue edge
In the range 490–530 nm[37]
SDySummation of first-order
derivatives inside yellow edge
In the range 550–582 nm[37]
SDr/SDbThe ratio of the SDr and SDbSDr/SDb[37]
(SDr − SDb)/
(SDr + SDb)
The normalized value of
The SDr and SDb
(SDr − SDb)/(SDr + SDb)[37]
(SDr − SDy)/
(SDr + SDy)
The normalized value of
the SDr and SDy
(SDr − SDy)/(SDr + SDy)[37]
Table 2. Wavelength positions and scales of identified wavelet features.
WFsScaleWavelength (nm)RR2p-ValuePeculiarity
WF0144740.800.640.000Blue valley
WF0214950.810.650.000Blue edge
WF031528−0.840.710.000Green peak
WF0425820.840.710.000Yellow edge
WF0536150.820.670.000Orange edge
WF0616910.800.640.000Red edge
WF071738−0.810.650.000Red edge
Table 3. The correlation between traditional spectral features and disease severity.
SortingSFsRR2p-Value
1PSRI0.810.650.000
2SDy0.800.640.000
3(SDr − SDy)/(SDr + SDy)−0.800.640.000
4NRI−0.790.630.000
5GI−0.780.610.000
6SDb−0.740.550.000
7Db−0.740.540.000
8NPCI0.740.540.000
9Dep0.680.470.000
10(SDr − SDb)/(SDr + SDb)0.680.470.000
11ARI0.640.410.000
12PHRI−0.620.380.000
13SDr/SDb0.570.320.000
14TVI−0.470.220.000
15NBNDVI−0.460.210.000
16Area−0.340.120.000
Note: SFs = spectral features.
Table 4. Comparison of results of wheat FHB monitoring models constructed with different features and algorithms.
AlgorithmInput
Features
Predicted Results
HealthyMildSevereSe (%)Sp (%)OA (%)Kappa
RFWFsHealthy344089.578.582.40.736
Mild426868.490.0
Severe032990.678.9
SFsHealthy335086.874.278.70.680
Mild525865.885.7
Severe052784.476.3
BPWFsHealthy343189.584.286.10.792
Mild429576.385.7
Severe023093.882.8
SFsHealthy334186.881.483.20.750
Mild527671.190.0
Severe023093.878.9
PSO-SVMWFsHealthy352192.194.393.50.903
Mild036294.792.9
Severe023093.893.4
SFsHealthy352192.181.485.20.778
Mild527671.192.9
Severe023093.881.5
Note: Se = sensitivity, OA = overall accuracy, Sp = specificity.
Publisher’s Note: MDPI stays neutral with regard to jurisdictional claims in published maps and institutional affiliations.

