1. Introduction
In 1984, Alec Jeffreys proposed applying DNA information to the field of human identity recognition and termed this process ‘DNA fingerprinting’, which has subsequently received considerable attention owing to its practical value and characteristics of high variability and stable heredity [
1,
2]. DNA fingerprinting can be used for identification of plant individuals, which is also valuable for determining kinship in human and animal [
3,
4,
5,
6]. Currently, DNA fingerprinting technology is an effective tool used in plant sciences, human genetics, and animal breeding-related fields [
7,
8,
9,
10,
11,
12,
13,
14,
15]. DNA fingerprints also play an extremely important role in plant breeding [
16,
17,
18], which requires accurate plant genotyping to ensure consistency in the genetics and physiology of improved plant cultivars [
19,
20,
21,
22].
Single-nucleotide polymorphisms (SNPs) have been successfully used to construct DNA fingerprints. This has become the preferred approach for genotyping laboratories because the unique features of SNPs, such as multiple loci, high variability, and somatic stability, are irreplaceable [
23,
24,
25]. The development of DNA fingerprinting using SNP markers has attracted substantial interest because of the practical potential [
26,
27,
28], such as for marker-assisted selection (MAS), owing to accurate identification at the cultivar level. Kim and colleagues developed and validated allele-specific SNP and insertion/deletion (InDel) markers for eight yield-enhancing genes to increase the yield potential of rice (
Oryza sativa) [
29]. Among plant genomic studies, Sikandar et al. detected putative quantitative trait loci associated with ovary traits in melon (
Cucumis melo) using SNP-CAPS markers [
30]. Cui et al. studied the population structure and genetic diversity of watermelon (
Citrullus lanatus) based on SNPs of the chloroplast genome [
31]. Sana et al. identified favorable SNP alleles and candidate genes for frost tolerance in pea (
Pisum sativum) [
32]. Applications also include the improvement of crops, such as rice and onion (
Allium cepa) [
33,
34].
DNA fingerprint data can be collected and stored in a database [
35]. DNA fingerprint databases are indispensable tools for genotyping and plant breeding with comprehensive support [
36,
37]. In recent years, databases have been developed based on services provided by websites, such as RSRS. Available online:
http://bioinformatics.fafu.edu.cn/RSRS (accessed on 8 August 2021) [
38], CropSNPdb. Available online:
http://snpdb.appliedbioinformatics.com.au (accessed on 11 August 2021) [
39], avocado unambiguous genotype SNP database [
40], Tomato SNP Database. Available online:
http://tgsol.seeders.co.kr/index.php/tg/mab (accessed on 22 August 2021) [
41], SorGSD. Available online:
http://sorgsd.big.ac.cn (accessed on 22 August 2021) [
42], and CicArVarDB. Available online:
http://cicarvardb.icrisat.org/ (accessed on 6 August 2021) [
43]. Furthermore, several database management systems based on biological laboratories have been developed to organically integrate laboratories and databases [
44,
45,
46,
47,
48,
49,
50], but lack integrated data analysis features. There are currently human [
51] and animal [
52] SNP database management systems. However, there is no plant SNP database management system for standardized collection of experimental data, quality control, DNA fingerprint review and merging, and data analysis integration, and no reports of database management systems developed for plant SNP fingerprints.
Establishing an SNP fingerprint database management system for plants is particularly difficult for several reasons. First, inherited diversity in plants, also termed genetic diversity, is the sum of genetic variation between individuals within a species or between different individuals within a population. Unlike human DNA fingerprinting databases, every human being has a unique fingerprint [
1,
3,
4,
14]. A plant DNA fingerprint data management system must be able to merge the fingerprints of individual and mixed samples [
14,
15,
50]. Second, different SNP detection platforms must design different probes and primer sequences for the same variant locus during data collection on the Kompetitive Allele Specific PCR (KASP™) platform, which may result in different allele names for the same locus on different platforms. Therefore, when constructing an SNP fingerprint database management system that is compatible with multiple platforms, it is necessary to convert fingerprint data from different platforms into a uniform allele nomenclature, and to construct allele nomenclature reference tables between multiple platforms and the target platform. Third, although the current database management systems provide comprehensive information on SNPs, they lack a function that can efficiently collect and process data from different platforms, such as KASP and SNP array platforms. Fourth, the current SNP data management systems do not solve the problem of processing fingerprints of duplicate experimental data. Fifth, the current SNP database management systems cannot realize DNA fingerprint comparison and genetic analysis functions. Therefore, it is essential to develop a SNP fingerprint database management system that is suitable for plant species.
In this study, we describe the design of plant SNP database management system (PSNPdms), which was developed to solve the problems described above. PSNPdms is a database management system for efficient storage, management, and analysis of KASP and SNP array data for advancing genetic research and breeding applications in plants. It is available at:
https://psnp-dms.cn:8445/snp, accessed on 18 October 2021. The following objectives guided the development of PSNPdms.
PSNPdms is compatible with multiple markers (SNP and InDel markers), multiple platforms (KASP and SNP chip platforms), multiple species (currently 23 species of plants, and subsequently will be updated to support additional plant species).
The system fully integrates with the KASP platform, allowing for graphical presentation of KASP data and providing support for online modification of typing data.
The system has a three-level access structure, which also contains three hierarchical fingerprint libraries with progressive relationships. This is a simple, efficient, and common management structure for laboratory personnel, which can adapt to complex and changing experimental requirements with a simple workflow process.
Standardization of experimental processes provides a unified communication language for all laboratory personnel and improves the reproducibility of experiments. The standardized collection of data provides the basis for automated algorithm processing. The fingerprint data memory cache function provides a rapid means to read fingerprint data and, thus, accelerates the reading of fingerprint data.
The PSNPdms system provides effective support for data quality control through standardized experimental design, standard reference samples, a fingerprint statistical selection algorithm (FSSA), a raw data correlation query, fingerprint comparison function, and fingerprint identification result database. These quality control mechanisms provide effective technical support mainly for tracking and evaluating experimental accuracy, fingerprint data accuracy and completeness, fingerprint differences in the standard fingerprint database, and the accuracy of identification results.
Construction of a full allele reference table between multiple platforms and the target platform, so that fingerprint data of different platforms can be converted into a uniform allele name to facilitate data sharing.
PSNPdms provides several fixed data formats for fingerprinting, and data from different platforms or formats can be imported by data format conversion. We use a common internal format to store SNP data, which allows the import of data from other sources. The system can generate standard fingerprint packet format data, including sample information, site information, and fingerprint information. Different laboratories using this system can share data and interact by using this standardized fingerprint packet format.
Development of a FSSA that solves the problem of merging the fingerprints of mixed samples and single samples in plant detection, providing a unique standard fingerprint for each plant species for the construction of a standard DNA fingerprint database.
Development of the fingerprint comparison algorithm, which enables the comparison of DNA fingerprint data. In addition, we integrated a genetic analysis function in the system, which enables the drawing and downloading of dendrograms.
Over the past four years, PSNPdms has been widely used by 23 institutions, including the National Rice Research Institute of China, the Chinese Academy of Agricultural Sciences, and the China Center for Science and Technology Development, and has proven to be a flexible and easily extensible to support high-throughput automated laboratory for plant breeding. PSNPdms is free to use, the algorithm is open source software (OSS) available for widespread use, and we encourage interested researchers to adapt and further develop the system.
2. Materials and Methods
2.1. System and Database Schema
As a SNP and InDel marker-based genotyping experimental system, we developed a plant SNP database management system (PSNPdms) for data management based on the KASP and SNP array platforms. The PSNPdms system, with SNP and InDel marker fingerprint data as its core, can manage experimental and fingerprint information, and provide comprehensive functions, such as storage, query, comparison, genetic analysis, and graphical display of the data. The PSNPdms system adopts a three-level access structure, which is a simple, efficient, and versatile management structure for laboratory personnel, adapting to complex and changing experimental needs with a simple workflow process. The first level of access is primarily for laboratory testing personnel, providing the core drivers of the testing process, completion of the sample testing process, and initial analysis, storage, and processing of the data. The second level of access is for senior data analysts with the ability to interpret results, but who will also provide technical guidance and oversight of sample testing and be responsible for the final quality of sample testing. These two levels of access strictly divide the privilege and responsibilities between different personnel to improve the efficiency of testing and analysis. The third level of access is the highest level of authority, which is principally a senior technical expert who is responsible for providing technical support and clarification of important and difficult problems in the system, as well as suggesting constructive improvements to the experimental procedures and data analysis for the first- and second-level users.
The PSNPdms system adopts a “hierarchical responsibility system” model, in which each level of users is responsible for the data and results they generate; thus, urging different users to improve their detection technology and data analysis quality. Based on this model, we do not allow users to modify other users’ fingerprint data and other information in the system, which is also a mandatory internal rule constraint in each functional module of the system.
The PSNPdms system includes a KASP raw fingerprint database and three hierarchical fingerprint databases, which are used to store the incoming fingerprint information, termed Database L1 (the primary fingerprint database), Database L2, and Database L3 (also termed the standard fingerprint database), respectively. The KASP raw fingerprint database stores the data together with locus coordinate information and typing information generated after detection by the KASP platform. The functions of the three databases are as follows: (1) Database L1 stores the raw data exported from the KASP or SNP array platform and the fingerprint data generated after the initial selection. (2) Database L2 stores the fingerprint generated after selection in Database L1 and the fingerprint data generated by the second selection. (3) Database L3 stores the fingerprints generated by Database L2 selection and provides data locking functions to build a stable standard fingerprint. Based on the aforementioned user hierarchy and privilege division, users at all levels have the following operating privilege for different fingerprint databases: (1) primary users can manipulate their own fingerprint data submitted to Database L1 and select the resulting fingerprint data. (2) Intermediate users have operational access to all fingerprint data associated with these samples in Databases L2 and L3 after importing sample information. (3) Advanced users can view all data in Databases L1, L2, and L3, cannot modify or delete data, but can select and lock fingerprints. (4) Data query and comparison privilege in Database L3 is open to all three levels of users so that users can perform fingerprint comparison and data analysis based on stable standard fingerprint data.
The PSNPdms system incorporates three levels of users with separate privileges to operate different fingerprint database functions. (1) Primary users, who must have the basic ability to design experiments and complete experimental operations. After preliminary analysis of the data generated by the experiments, the data will be submitted to the system’s KASP original fingerprint database and Database L1. Primary users can use the system’s functions to automatically process and manually verify duplicate fingerprints of the samples integrated in Database L1, and the generated fingerprints will be stored in Database L1 as a result of the integration, and submitted to Database L2 as the primary user’s experimental fingerprints. (2) Intermediate users, who can synthetically process multiple sets of parallel experimental fingerprints of the sample submitted to Database L2 by multiple primary users, compile the final fingerprint data of the sample, and store it in Databases L2 and L3 by means of system functions for automatic processing and manual verification. In addition, only intermediate users can delete or modify their submitted fingerprints in the standard fingerprint database. The fingerprint data in the standard fingerprint database will be used for genetic analysis, variety identification, parentage identification, data sharing, database construction, and other scenarios. (3) Advanced users, who have access to all user data, such as samples, fingerprints, and genetic analysis.
2.2. Fingerprint Data Entry
The PSNPdms system is compatible with offline data from KASP and SNP array platforms. The system uses CSV and Excel (XLS/XLSX) file formats for inputting fingerprint data. The system is seamlessly integrated with the KASP platform and supports two types of data files, both of which are in CSV format. The data compatible with the SNP array and other platforms are imported through a common data file in Excel spreadsheet format.
The fingerprint data information table exported by the KASP platform is in the CSV file format that can be opened and viewed with the SNPviewer software (Available online:
http://results.lgcgenomics.com/software/snpviewer/ accessed on 30 August 2021). This file contains the coordinates of the locus data, the genotyping information, and the relevant information of the electrophoresis plate, which are detected and standardized by the KASP platform, including the barcode number of the daughter plate/master plate, well number of the daughter plate/master plate, genotyping data, x-axis/y-axis position, locus name, and DNA barcode.
When the fingerprint data are entered into the database, the PSNPdms system first parses the raw locus data and stores it in the KASP raw fingerprint database. Subsequently, these raw locus data are merged according to the master plate and master well to create a fingerprint containing all locus data and are stored in Database L1.
The KASP raw fingerprint database holds the most original information, which we can reconstruct into a coordinate graph using the x-and y-axis coordinate information contained therein. PSNPdms can also provide multiple overlay coordinates of these locus data, such as overlaying all the data points of a sample, overlaying all the data points of a single locus on a master plate, and overlaying all the data points of a single locus on multiple master plates. When we subsequently view the data points, we can also retrieve their associated data and correct the genotyping of problematic data points by overlaying the coordinate map, avoiding corrections and re-importation from the KASP platform’s analysis software. The KASP raw fingerprint database provides convenience in later data analysis and processing, thus we usually use this data format to exchange data with the PSNPdms system after detecting data using the KASP platform, to ensure that the PSNPdms system can obtain more comprehensive information on the experimental data.
The common data format used in the SNP array platform does not contain detailed genotyping coordinate information, so it is directly parsed into fingerprints and stored in Database L1 when it is stored. The original fingerprint data associated with the SNP array data in subsequent functions are retrieved from Database L1. Therefore, Database L1 can also be considered the original fingerprint database of the SNP array platform.
Different SNP platforms require the design of different probes and primer sequences for the same variable locus, which may result in different allele names for the same locus on different platforms. Therefore, to achieve multi-platform compatibility, PSNPdms must convert the fingerprint data of different platforms into a uniform allele nomenclature and construct an allele nomenclature cross-reference table between multiple platforms and the target platform. For example, we can use the KASP platform as the target platform and convert the data from other platforms, such as a SNP array platform, to the KASP platform. Considering maize (Zea mays) as an example, the allele nomenclature control table can be determined by comparing the fingerprints obtained on multiple platforms using a main inbred line, such as B73, as a benchmark. To unify these multi-platform fingerprint data, PSNPdms provides a function module to convert the data based on the allele nomenclature comparison table. Of course, users can also convert the data in advance and then submit it to the system. The system will not convert the data if it detects that the submitted data are consistent with the target platform data.
2.3. Algorithms
2.3.1. Fingerprint Comparison Algorithm
PSNPdms not only could take care of the automation from experiment to fingerprint storage, but it also has the analysis function of sample fingerprints, which can realize the comparison function of genotyping results. We have proposed a large-scale data comparison algorithm based on biological DNA fingerprint characteristics: fingerprint comparison algorithm based on grouping and statistics (FCGS). The core of this algorithm is a DNA fingerprint comparison algorithm for SNP marker. It can be compatible with the KASP and SNP array platforms. This algorithm can be applied to the study of crop genetic research, crop breeding, evolution analysis, and plant variety protection. While our work on the development of FCGS focuses on maize, this new method is general and can be applied to other crops, animals, and eukaryotic microorganisms. In addition, we have also developed the code includes an execution mode based on command line invocation, allowing it to run on an operating system without a graphical interface and the FCGS algorithm can be embedded into other software and databases.
Data generated by the SNP detection platform need to be converted for unified numerical representation (
Table 1). SNP data need to be converted into the AB genotype representation format first. This method was used to convert all locus data into binary data where A and B represents two alleles. Next, A and B alleles were, respectively, mapped to numerical data, thus completing the numerical conversion of SNP data. The conversion steps are as follows:
Define the order of base mapping: 1.A; 2.G; 3.C; 4.T;
Convert the SNP character type data into the AB genotype format, A/A, A/B, or B/B, in accordance with the order of base mapping;
Define the numerical expression of the AB genotype format: A = 1, B = 2, then the SNP character data can be converted into numerical data of genotype.
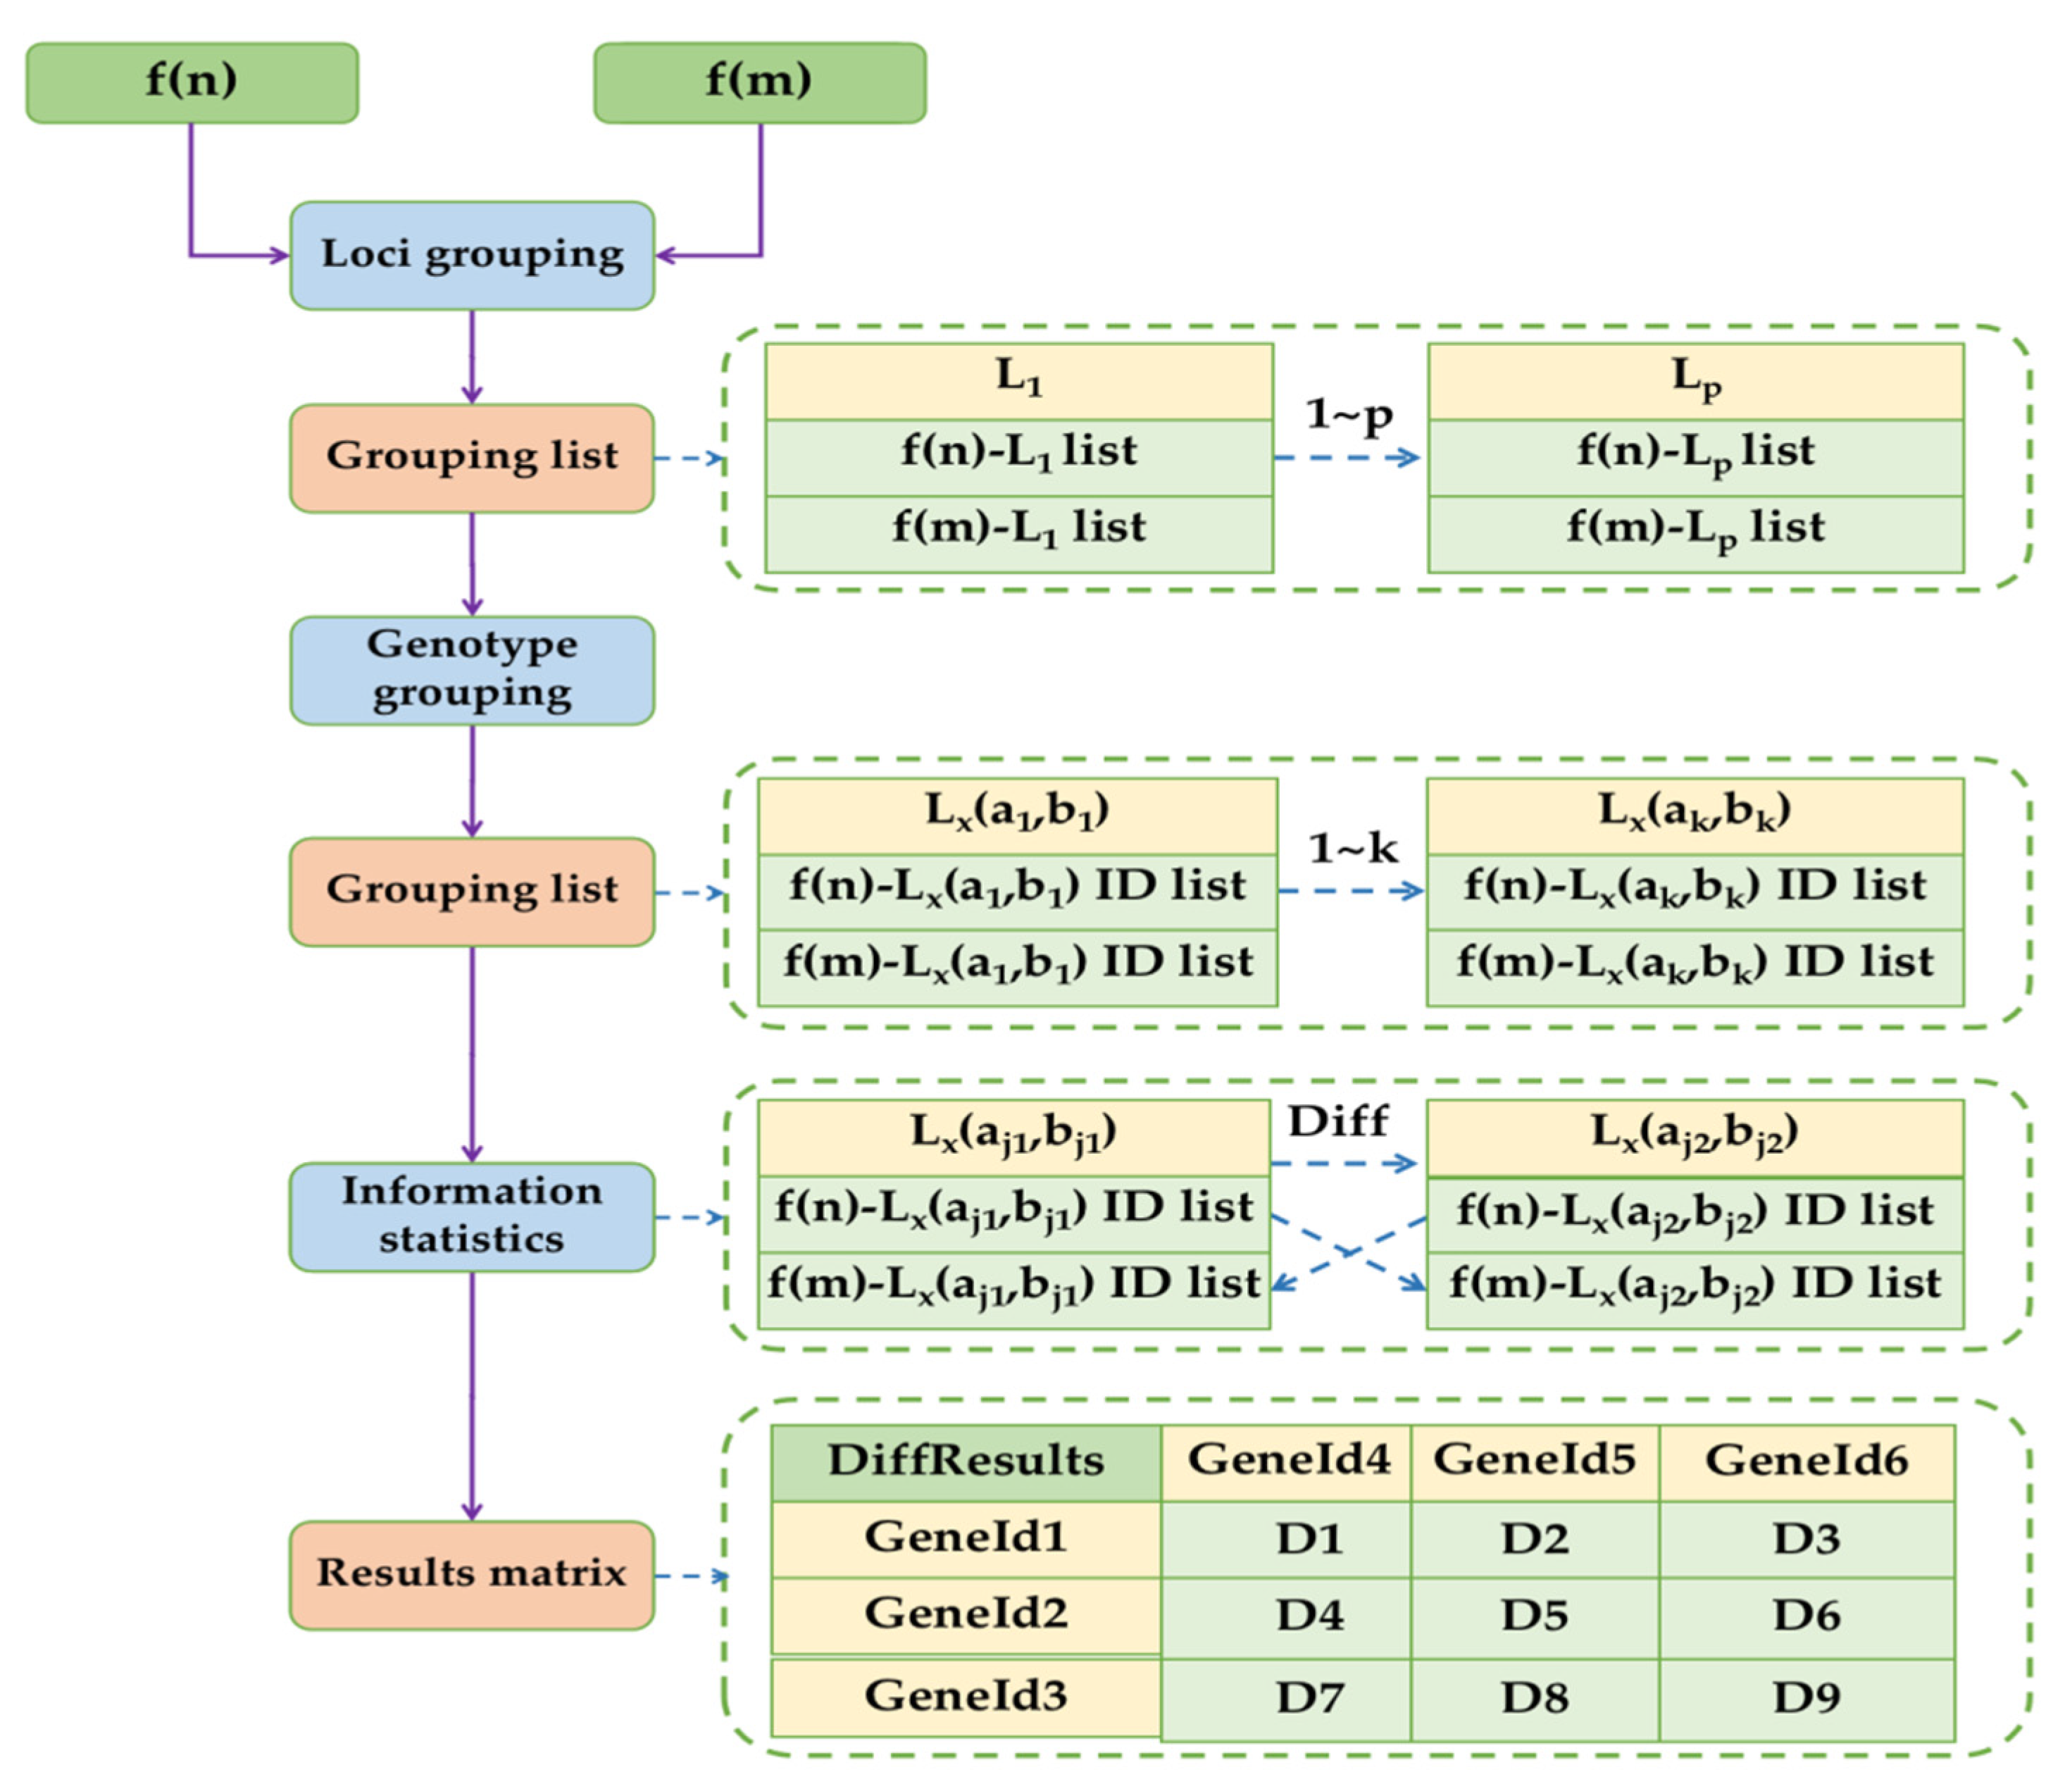
The FCGS algorithm is a novel DNA fingerprint comparison algorithm. Its core function is to directly and quickly locate the differential loci to avoid the large amount of invalid computation U, thus improving the algorithm performance. The FCGS algorithm workflow is shown in
Figure 1.
We input the fingerprint lists f(n) and f(m) into the FCGS algorithm as two datasets for comparison. Since it was assumed that each fingerprint contains
loci, expressed as L
1-L
p, all the loci in f(n) and f(m) were grouped and correlated according to L
1 to L
p. Each loci grouping contains two lists, containing the data of corresponding loci in f(n) and f(m), respectively. Suppose that L
x contains k genotyping data from a given locus from L
1 to L
p, which are expressed as L
x (a
1, b
1)-L
x (a
k, b
k), where a
1, b
1, a
k, and b
k are loci. f(n) and f(m) can be grouped into 1 to k according to the genotypes at the L
x locus. Each group still contains two genotype grouping lists, respectively containing the genotyping data from f(n) and f(m) at the L
x locus. There is no difference between f(n) and f(m) data in a single group. It is necessary to use the FCGS algorithm to compare k genotype groups at the L
x locus in pairs and construct grouping association relationships with those data to observe differences in genotypes. Any nondifferential genotype grouping data were ignored. As shown in
Figure 1, if L
x (a
j1, b
j1) and L
x (a
j2, b
j2) are judged by FCGS to have different genotypes, then the information of association between these two genotypes will be recorded. There is a difference between the f(n)-L
x (a
j1, b
j1) and f(m)-L
x (a
j2, b
j2) ID lists when the subsequent comparison information is counted. There is also a difference between the f(n)-L
x (a
j2, b
j2) and f(m)-L
x (a
j1, b
j1) ID lists. The two fingerprint ID lists need to be iterated by FCGS algorithm and then count the results in the matrix table. When all genotyping pairs with differences at all loci were counted, all the differential loci information contained in the comparison results were also extracted. In the results matrix, D1-D9 is the number of differential loci between fingerprints. If it is necessary to filter the results according to the range parameters of the differential loci, then it is necessary to mark the differential loci data that do not meet the requirements in the matrix table.
The FCGS algorithm is coded in Java language and can be run cross-platform on Windows, Linux, or Mac operating systems, but the user must first install and configure the advanced Java Development Kit (JDK) version 1.7 (Oracle Corporation, Redwood Shores, CA, USA). The code is available at:
https://github.com/plantdna/fcgs, accessed on 18 October 2021. In addition, the code also includes an execution mode based on command line invocation, allowing it to run on an operating system without a graphical interface and the FCGS algorithm can be embedded into other software and databases.
In addition to the FCGS algorithm being integrated in PSNPdms, a separate comparison tool has been developed to allow researchers to perform fingerprint comparison of large sample batches on their own. As seen in
Figure 2, a comparison software with a graphical interface is integrated into the code. This tool allows the user to download the corresponding data sample template file. Users need to sort out fingerprint data according to the requirements of the template and set relevant parameters in the software interface for fingerprint data comparison. After the comparison, the differential loci information between the fingerprint data can be obtained.
This software uses CSV fingerprint data format. The user can download the sample template of data format with the “Download Template” button and click on the “Start Compare” button. After comparison, the matrix table of the comparison results can be downloaded from the “Download Result” button in the comparison result interface. The fingerprint number, result record, and usage time of the comparison will be displayed on the interface.
The pseudo-code of Algorithm 1 is:
| Algorithm 1 FCGS |
1: Input: [a1, a2, a3, …, am] as fingerprints lists 1, [b2, b2, b3, …, bn] as fingerprints list 2
2: Init a two layers tree with first layer node is each locus, and second layer node is each genotyping of each locus. The genotyping node is the leaf node. For each leaf node, init two empty lists, first named GA for the fingerprints from list 1, second named GB for the fingerprints from list 2.
3: Init the result matrix named MATRIX with m rows stands for each fingerprints in list1 and n columns stands for each fingerprints in list2, and 0 for all items’ init value.
4: # grouping finger prints from list1 and list2
5: FOR node IN leafNodes
6: FOR a[i] IN lists1
7: IF (a[i] has same Locus and same genotyping with node) THEN
8: put i in node.GA
9: END IF
10: END FOR
11: FOR b[j] in lists2
12: IF (b[j] has same Locus and same genotyping with node) THEN
13: put j in node.GB
14: END IF
15: END FOR
16: END FOR
17: # comparation
18: FOR node IN leafNodes
19: FOR indexA IN node.GA
20: FOR indexB in node.GB
MATRIX[indexA, indexB] = MATRIX[indexA, indexB] + 1
21: END FOR
22: END FOR
23: END FOR
24: return MATRIX
25: Output: MATRIX-> if item MATRIX[i, j] = 0 stands for the ith fingerprint in list 1 and jth fingerprint in list 2 are same; else is different. The value of MATRIX[i, j] is the different loci count. |
2.3.2. Fingerprint Statistical Selection Algorithm
For plant variety identification, population-based sample identification is generally adopted, supplemented by individual sample identification. The population sample test can quickly and inexpensively identify the differences between most species, whereas the individual sample test can be used to accurately differentiate between samples that are indistinguishable owing to similar genetic backgrounds. We use the following three methods to improve the completeness and accuracy of fingerprint data: (1) supplemental experiments to reduce missing data; (2) controls between replicate experiments to improve the accuracy of a single experimenter; and (3) controls between parallel experiments to validate the accuracy of data from multiple experimenters. We developed a fingerprint statistical selection algorithm (FSSA) to select representative fingerprints from all loci to provide complete and accurate fingerprint data for the construction of Database L3 (the standard fingerprint database).
When using the FSSA algorithm to select fingerprint-typing data, we must make two selections, corresponding to Databases L1 and L2.
Fingerprint typing data selection by a single experimenter is performed in Database L1. The fingerprint data generated by a single experimenter from the experiment will be used as the selected fingerprint in Database L1 after it is entered into the database. The resultant fingerprints generated after processing by the FSSA algorithm will be stored in Database L1 and then stored as input fingerprints in Database L2 as the data to be selected. The selection of Database L1 focuses primarily on improving the accuracy and completeness of individual experimenter’s data.
Fingerprint typing data selection among multiple experimenters is performed in Database L2. The resultant fingerprint through selection by the FSSA algorithm from multiple experimenters will be stored in Database L2, and will be stored in Database L3 as the final fingerprint data used for comparison, genetic analysis, and database compilation. The selection of Database L2 is mainly to compare the consistency of the data between different experimenters and to verify the robustness of the data.
To describe the FSSA algorithm, we first assume that a sample has n fingerprints, denoted as G1-Gn. Each fingerprint contains p loci, denoted as L1-Lp, respectively. The algorithm selects the resultant fingerprint generated after calculation as Gt. The minRepeat parameter is defined as the minimum threshold for the number of fingerprint groups to limit the amount of fingerprint data for controlling, as well as the amount of data on the locus. Generally, in Database L1, this parameter means that only one fingerprint needs to be present to participate in locus selection, thus ensuring the integrity of the fingerprint data. In Database L2, this means that at least two experimenters have performed parallel experiments on the sample to participate in the selection, thus ensuring the accuracy and reliability of the final standard fingerprint data. Definition of the minPercentage parameter represents the minimum threshold of genotype preponderance that controls the range of representative genotypes to be selected. An increase in the value of the parameter minPercentage will result in a more accurate selection of the final fingerprint data Gt, but will also increase the number of missing loci in Gt, so it must be set appropriately. There are two common parameter values: (1) this is a more relaxed model, which indicates that a genotype of a locus must be predominant to be selected; and (2) this is a strict pattern, which indicates that all genotypes at the locus must be identical to be selected.
The flow of the FSSA algorithm can be described as follows.
- (1)
Detect the number of G1-Gn fingerprints, and if n < minRepeat, end the algorithm.
- (2)
Group G1-Gn fingerprints by loci L1-Lp, filtering out locus groupings that contain fewer elements than minRepeat.
- (3)
Secondary grouping of loci L1-Lp by genotype and calculation of the proportion of different genotypes at that locus.
- (4)
Using the parameter minPercentage, filter the percentage of genotypes contained in each genotype grouping in loci L1-Lp, select the genotype that meets the parameter requirements as the representative genotype of the locus, and construct the fingerprint Gt as the representative fingerprint of the sample.
The core of the FSSA algorithm is to simulate the manual processing of fingerprint data. This algorithm is an excellent solution to the problem of integrating large-scale SNP and InDel locus data. The FSSA algorithm automatically determines and selects the best genotype, and automatically overlooks a locus where there are data consistency problems. Thus, the algorithm mainly deals with the loci that can be determined automatically based on the data, and the small number of undetermined loci can be redetermined by selecting them through manual review or by starting a new experiment. PSNPdms improves the efficiency of the entire data integration process by combining algorithmic and manual processing to reduce errors.
2.4. System and Database Implementation
PSNPdms was built in three consecutive years with continuous testing and optimization. The core of the system is the automation of biological experiments. The PSNPdms system uses the Java language and J2EE technology for development, based on the B/S model development of the WEB system. The system supports cross-platform installation, but production environments generally use the Ubuntu and Centos operating-system environments to provide better server performance. PSNPdms deploys the Tomcat Web Application Server (The Apache Software Foundation, Wakefield, MA, USA) and MySQL Database Server (Oracle Corporation, Redwood Shores, CA, USA) using Docker (TODO) container technology and uses the MyBatis (the Apache Software Foundation) framework to provide a unified database access interface.
The PSNPdms system is designed to store, analyze, and screen fingerprints generated using SNP and InDel tagging technologies. In addition, PSNPdms is an efficient and flexible management system. Users can freely manipulate all correlation data of different crops by switching the functional modules of the crop genus. To date, PSNPdms has been used to compile SNP fingerprint databases for 13 crops, comprising maize, rice, wheat (Triticum aestivum), soybean (Glycine max), cotton (Gossypium hirsutum), rape (Brassica rapa), cucumber (Cucumis sativus), tomato (Solanum lycopersicum), cabbage (B. oleracea), watermelon, pepper (Capsicum annuum), melon, and kale (B. oleracea), and can be extended to be compatible with almost all plant fingerprint data. The databases of these crops mainly use population detection to construct fingerprints, but the system is compatible with individual detection data. In addition, the system can be extended for use in applications, such as animal and microbiological fields. PSNPdms has proven to be a stable and efficient DNA fingerprint database management system, in use by 23 organizations over four years.
3. Results
3.1. System Modules and Functionality
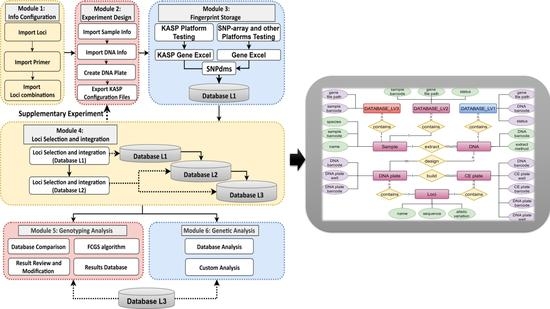
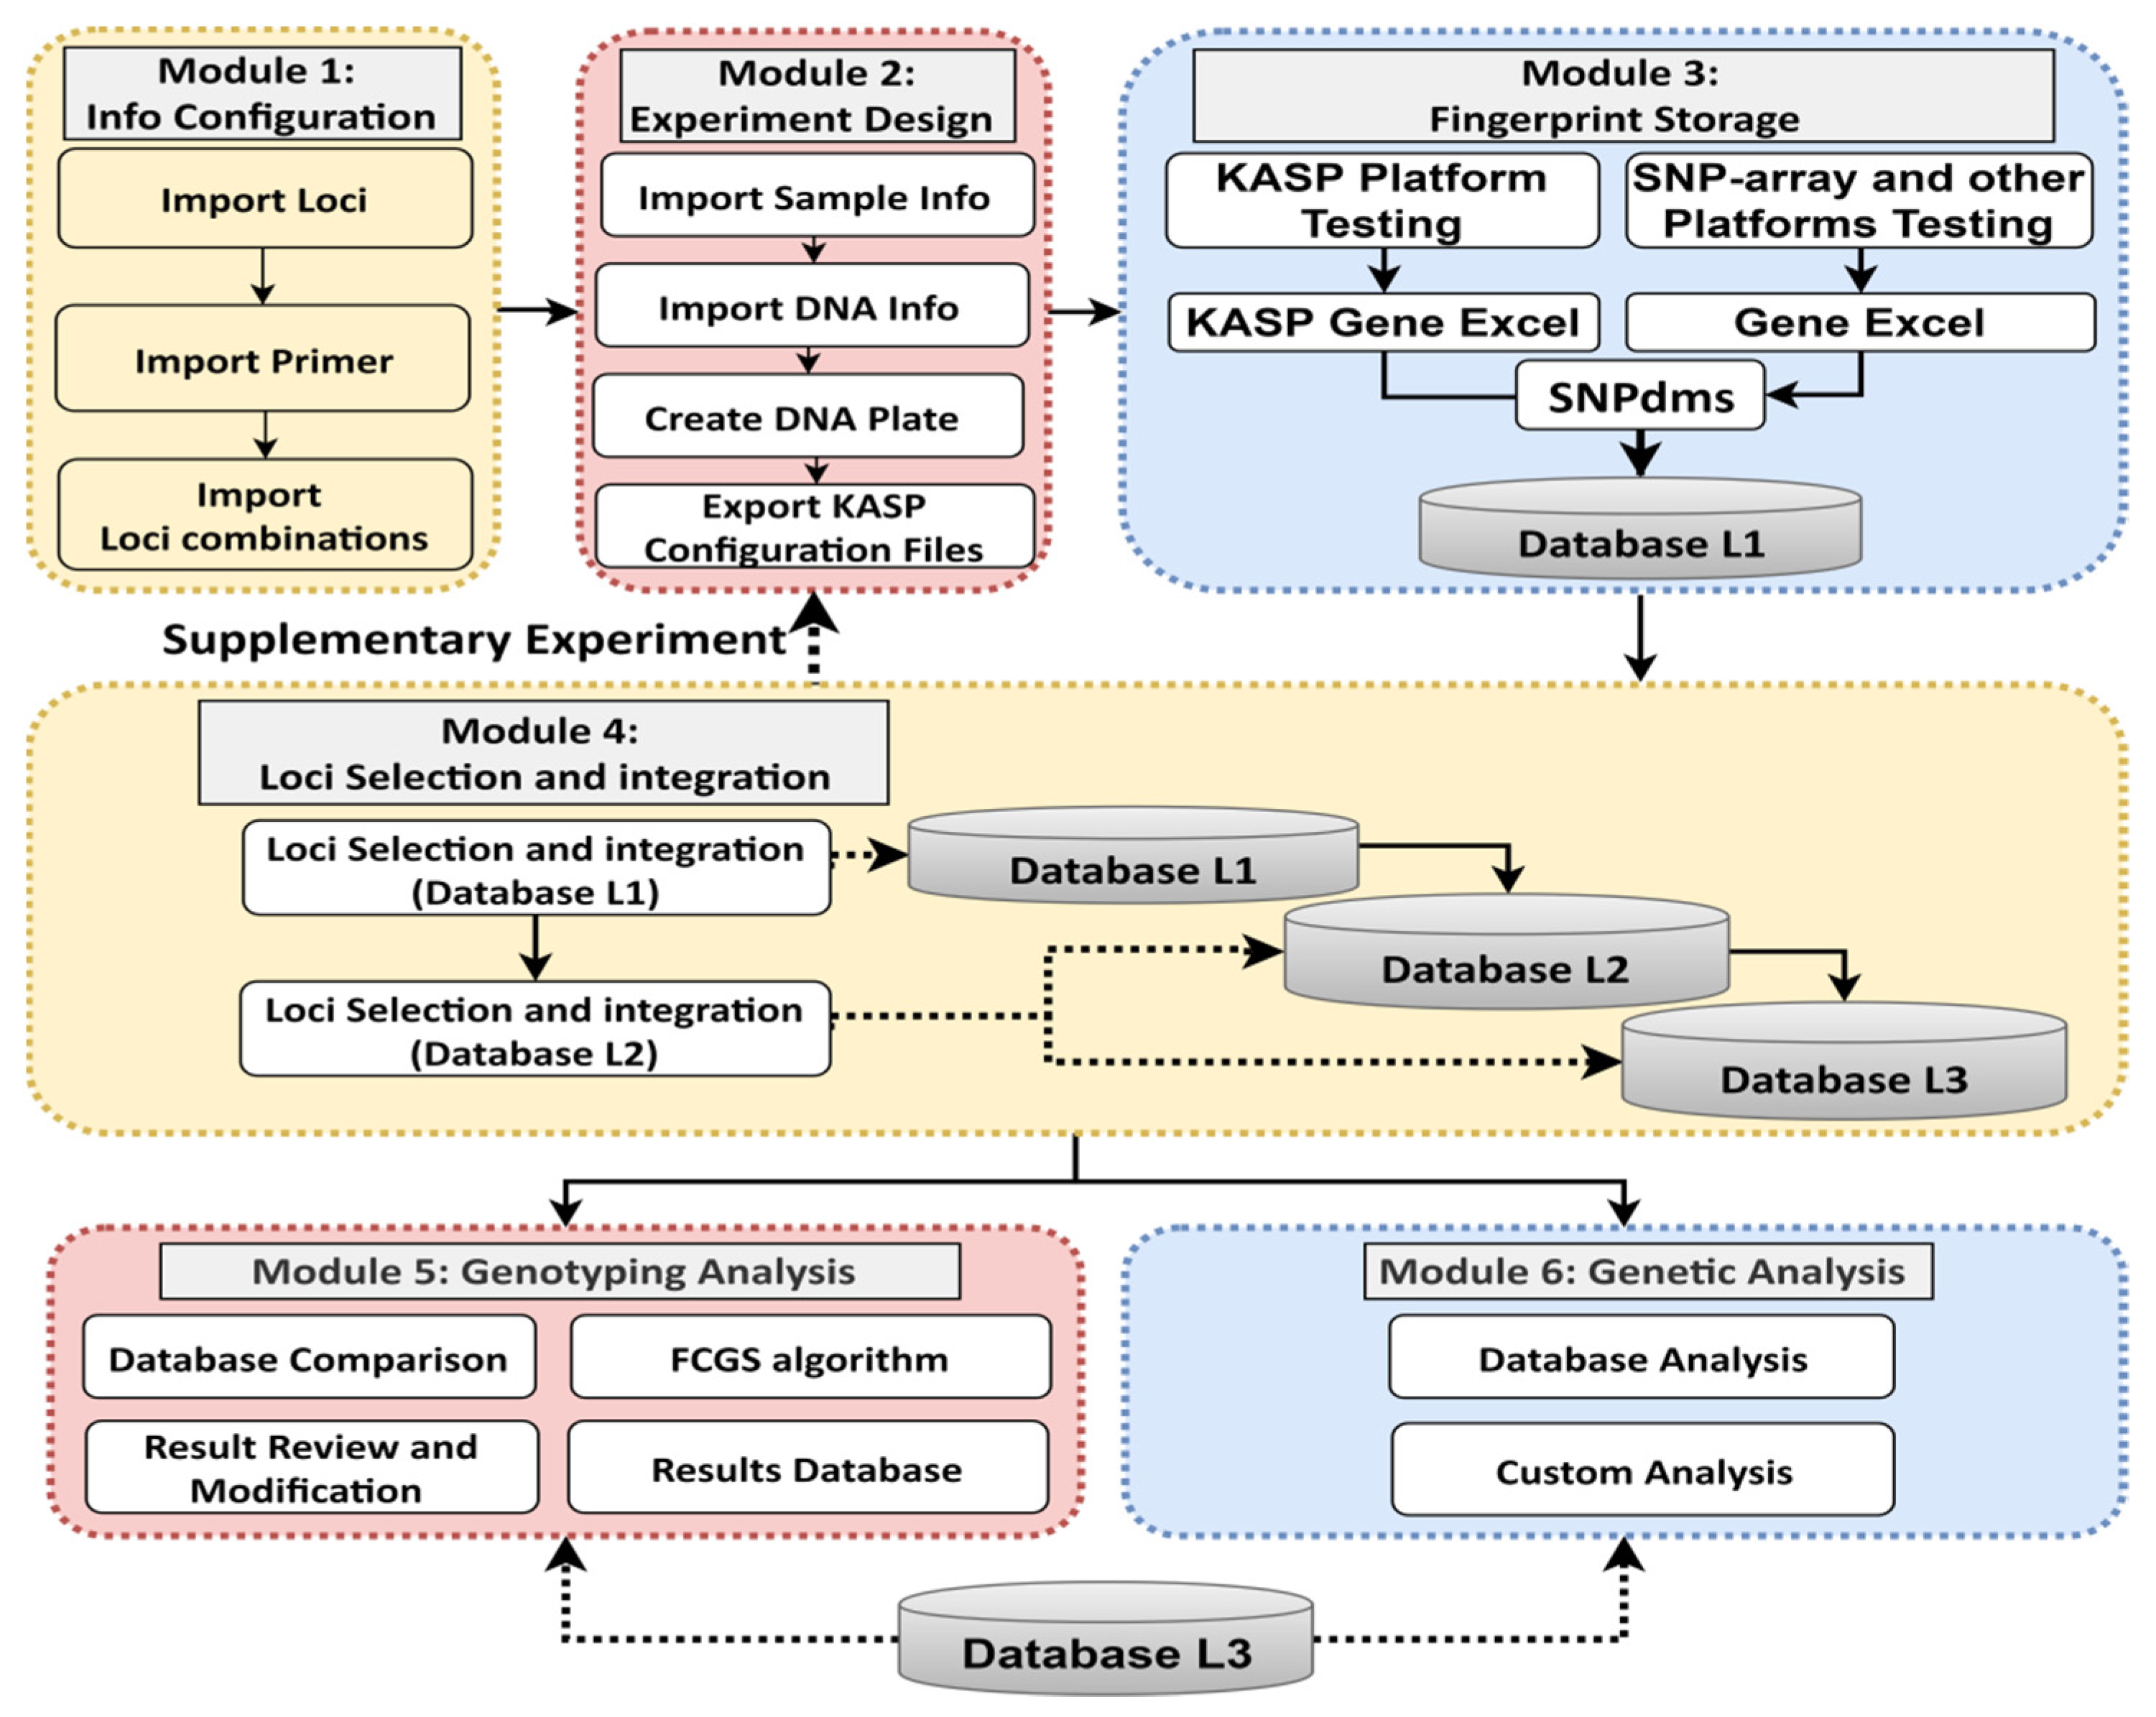
The core concept of the PSNPdms system is to reduce the error rate and improve the standardization of the experimental process. The core functions include process management and analysis of key data for SNP and InDel labeling assays. The primary goal of the system is to provide a set of standardized overall solutions to closely integrate the experimental personnel, experimental procedures, the use of testing platforms, data analysis methods and processing procedures, and other elements and links to achieve seamless integration between the elements and links. The PSNPdms system is based on the principle of “design before experiment” to provide a standardized pre-experiment design module to standardize the design method, such as standardized design of barcode number, set DNA extraction and PCR amplification plate information, and other processes and information. The data files generated by the testing platform are then docked to the system to facilitate seamless access to the testing data for storage. After the fingerprint data enters the system, the system works with the built-in multi-level privileges, FSSA algorithm, manual audit, and other modules to integrate the fingerprint data between fingerprint databases at different levels in a progressive manner, to achieve the goal of selecting representative fingerprint data to generate standard fingerprint data. These representative fingerprint data can be used to confirm the differences in fingerprint data through the species identification function provided by the system. The modular structure of PSNPdms is shown in
Figure 3.
PSNPdms is designed as a specialized tool system with the goal of focusing on the critical data and steps of the experiment, the fingerprints, and the data that are correlated with the fingerprints. The first step is to perform basic parameter configuration. The system administrator configures the corresponding locus, primer, and locus combination information for each crop. This information is used to describe the locus composition of each crop fingerprint, so that the database can be used for locus detection and to ensure that locus information contained in the database is supported by the system. The second step is to perform experimental work. This step begins when the intermediate user receives the sample to be tested. The intermediate user imports the information on the samples to be tested into the system, and the system automatically binds and authorizes the intermediate user to the samples to be tested. The intermediate user organizes and distributes the samples to be tested to multiple primary users to conduct the experiment. The primary user first designs and imports into the system the DNA information required for the experiment, which includes the DNA and sample cross-relationships, and designs a DNA plate (i.e., master plate) to calibrate the nesting order of the extracted DNA. The primary user must follow the design information when extracting DNA and storing DNA. The third step is to conduct experiments to generate fingerprint data and import the data into the PSNPdms system. As the system supports the KASP and SNP array platforms, the data generated are available in various file formats, mainly CSV and Excel formats. Given that the KASP platform can complete the entire process from DNA plate replication and PCR amplification to detection, the PSNPdms system can export the DNA plate information file, which can be directly imported into the KASP platform. Thus, the fingerprint data file generated after detection on the KASP platform will be consistent with the DNA plate (master plate) and the electrophoresis plate (daughter plate) generated during the detection process, and this information can be used to trace the experimental data. The SNP array platform is not docked in this system owing to the large number of SNP array manufacturers. The data from SNP array platform detection can be imported through a common Excel data format defined by the PSNPdms system, and these data can be traced through the DNA experiment. The fourth step is to screen the incoming fingerprint data for representative typing. The primary user selects Database L1 fingerprints and the intermediate user selects Database L2 fingerprints to generate the final fingerprint to be written into the standard fingerprint database. This process is mainly used to confirm the data and evaluate the quality of the data to control whether it is necessary to restart additional or repeated experiments to ensure the accuracy of the standard fingerprint. The SNPviewer feature of PSNPdms allows the user to correct fingerprint data directly for other analysis problems, which reduces experimentation and accelerates data processing. Finally, PSNPdms can also generate reports for variety identification and genetic analysis, both of which are conducted using standard fingerprint database data. The comparison function mainly adopts a new FCGS comparison algorithm to improve the comparison speed, and enables the storage, viewing, and reporting of the variety identification results. The genetic analysis mainly enables construction of dendrograms of various styles based on the Nei1983 and unweighted pair-group method with arithmetic mean (UPGMA) algorithms, and users can download the genetic distance information table and dendrogram images generated by the genetic analysis.
3.2. System Model
PSNPdms is built using a relational database and implemented in MySQL (Oracle Corporation), which is the current mainstream OSS.
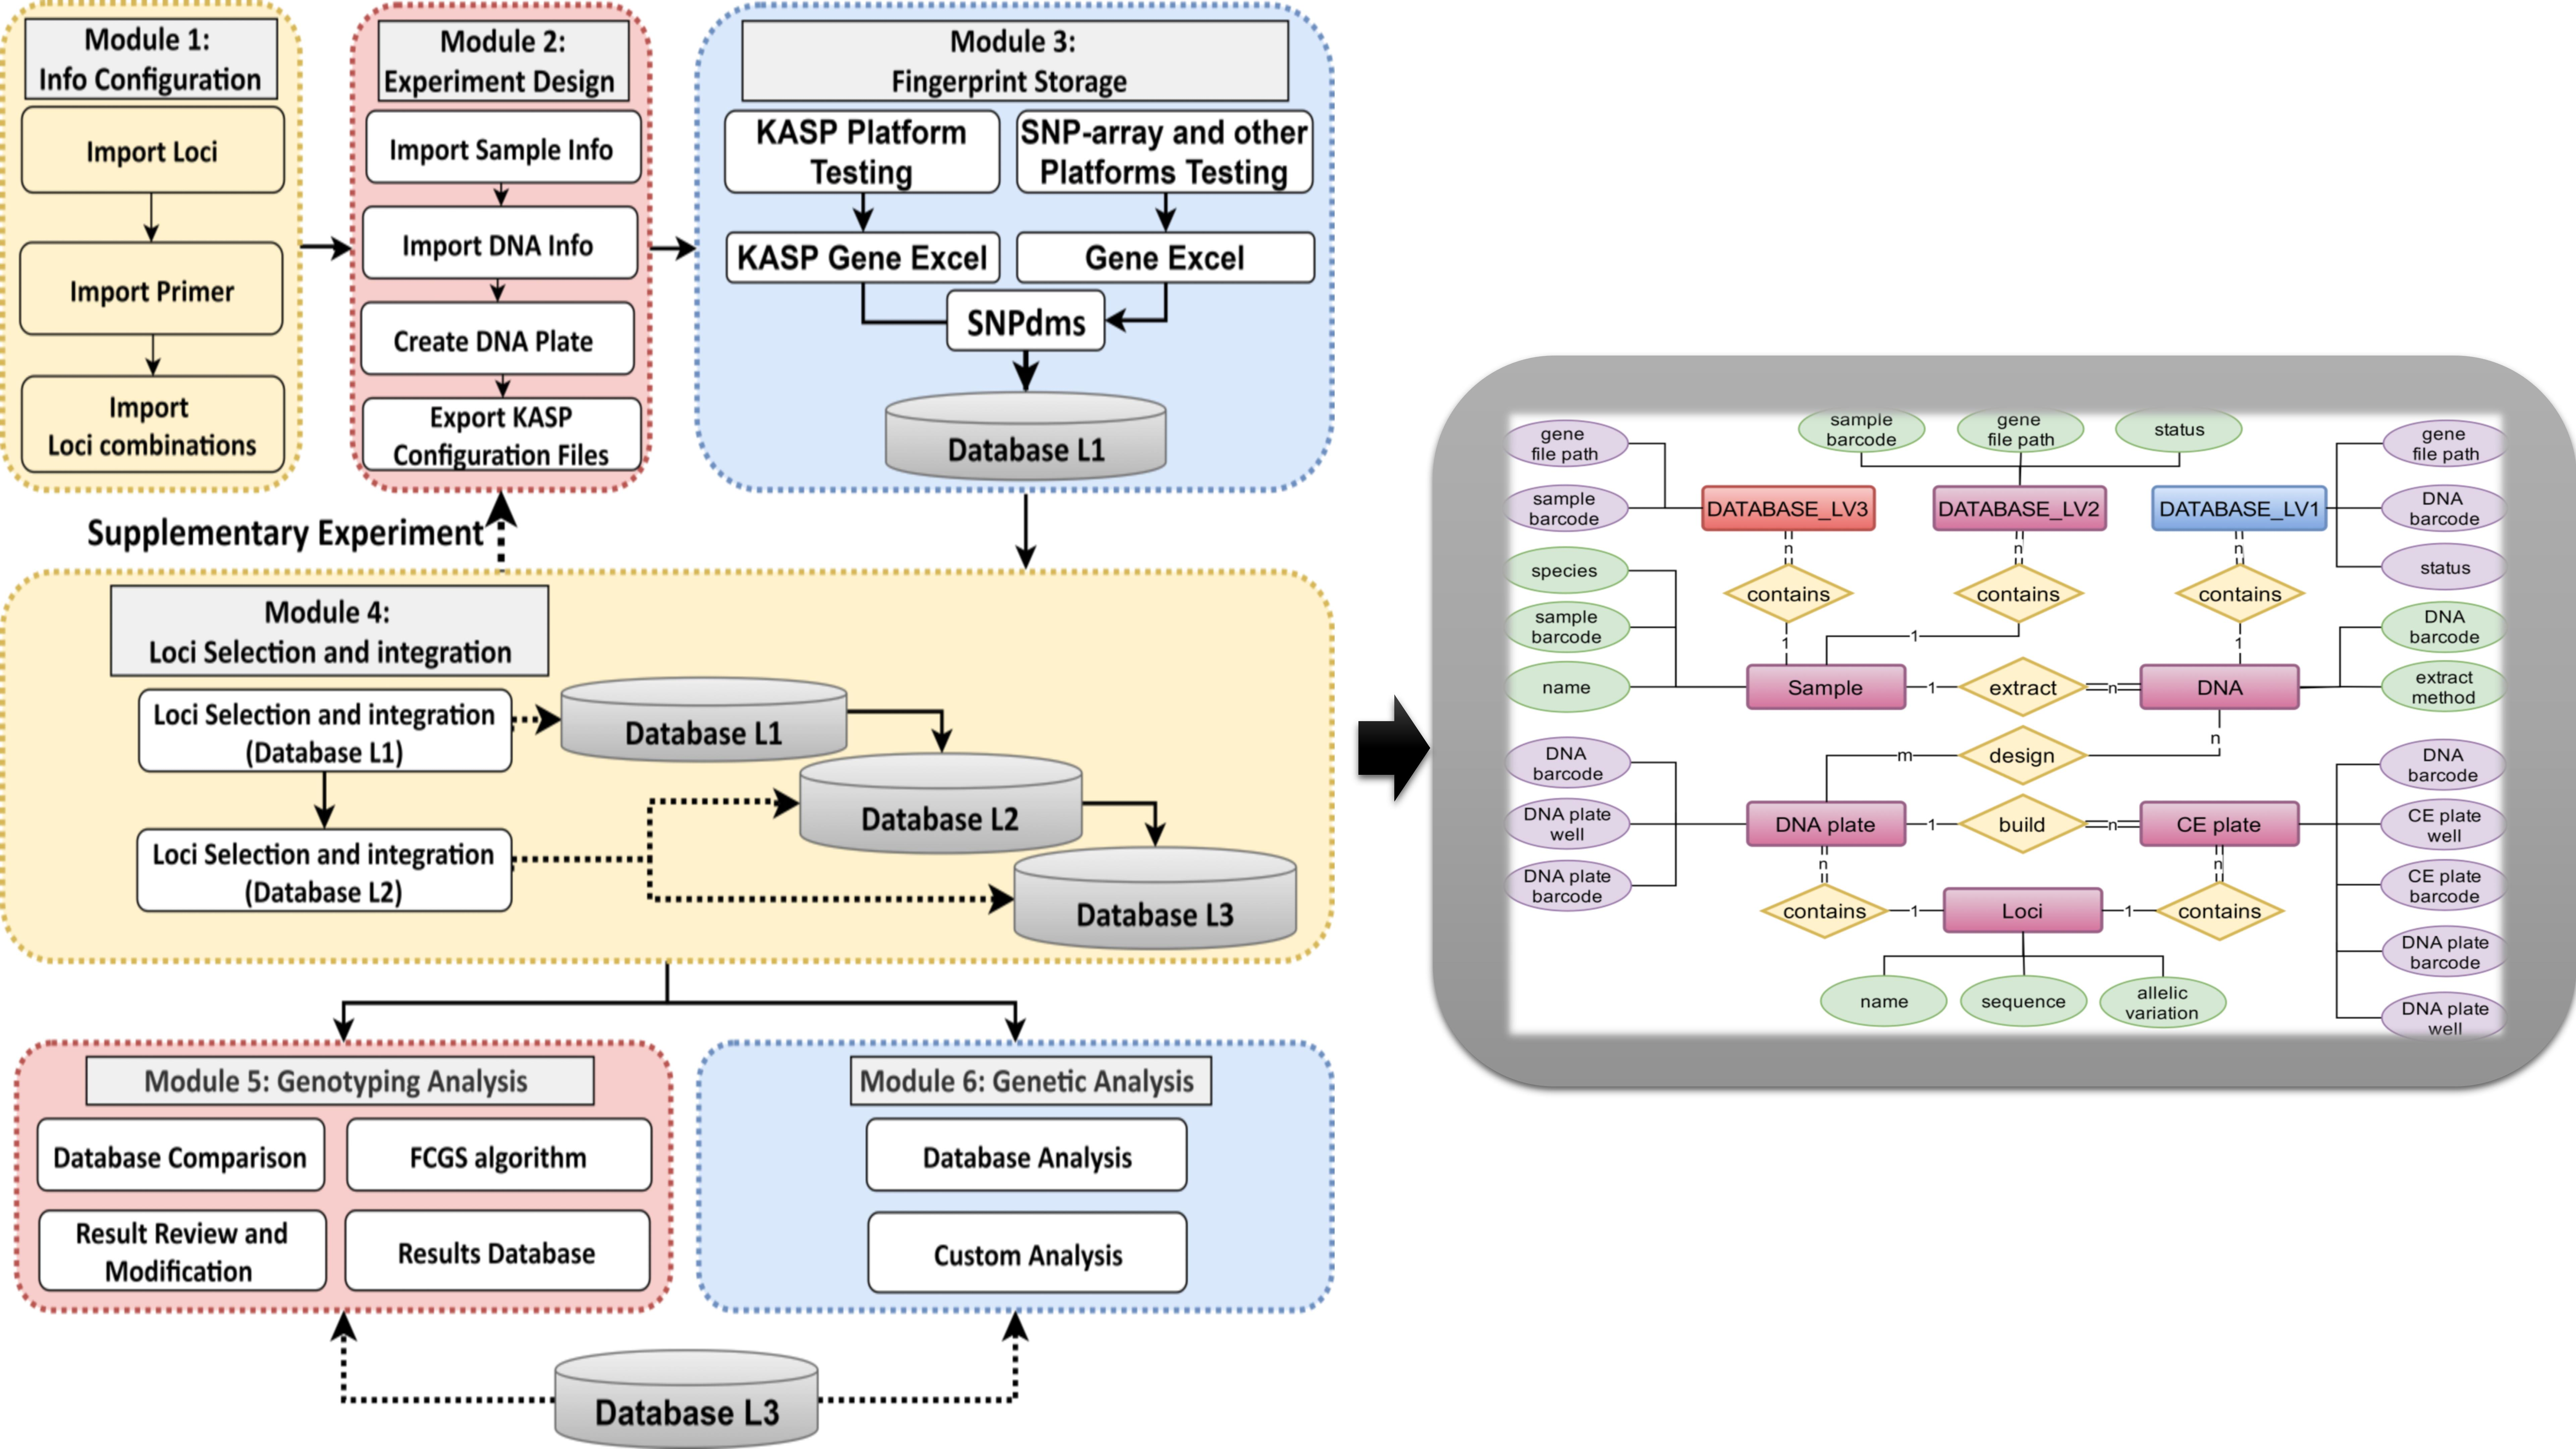
Figure 4 shows the entity-relationship model (ERD) and class-table model of PSNPdms which using the “Chen ERD” representation [
53], we first identified seven entities and four relationships (
Figure 4A). The “DNA plate” is split into two tables: “master_plate” and “master_plate_hole”. The “CE plate” is split into two tables, “CE_plate” and “CE_plate_well” (
Figure 4B). These data tables mainly describe the key information used in the whole system. As shown in
Figure 4A, the fingerprint information in the fingerprint database is composed of three levels of Loci as the skeleton combination, and the whole experimental process is described by the table relationship of Sample-DNA–DNA plate–CE plate, which provides the ability for trace localization. The whole system is based on these core data, and then extends the related functions to provide efficient business processing power and traceability analysis capability.
A variety of key data information is identified by means of barcode numbers throughout the database. This formatted barcode number provides a straightforward display of data characteristics, such as the user and crop genus. While extending the barcode range, it ensures that errors are avoided when using these barcode numbers to bind material, such as samples and DNA, for off-line transfer from PSNPdms, making it easier and more convenient for sample managers to organize samples for storage in the sample database.
We use the JSON data file format for fingerprint storage. This format has several advantages, such as simplifying the size of the fingerprint storage file and improving the speed of formatting and parsing fingerprint data files. Given that fingerprint data in the system will be read and written with high frequency, and will be used extensively in the fingerprint comparison module of the fingerprint identification, the system uses a fingerprint cache mechanism to cache fingerprint data. This caching mechanism will automatically load all fingerprint data into the memory when the server program starts. When used, the user only needs to read the data directly from the memory cache, which improves the fingerprint reading speed. To ensure consistency between the fingerprint in the memory and the fingerprint in the database, trigger scripts based on MySQL database syntax are added to each of the three levels of the fingerprint database. These triggers cause the fingerprint record to automatically trigger and execute a script program that writes the fingerprint record ID and action type to a fingerprint change tracking table when it is created, modified, or deleted. The PSNPdms system automates the reading and refreshing of these fingerprint records with changes into memory through a timed task to ensure consistency between the memory fingerprint cache and the database. In addition, to avoid the problem of untimely refresh, the fingerprint cache interface will read the information from the fingerprint change tracking table every time it reads the cached fingerprint, and then read the data after a memory cache fingerprint refresh. In this process, mechanisms such as re-entrant read–write locks are used to improve the speed of multi-threaded reading and avoid data error problems.
3.3. System Access
PSNPdms uses a flat interface design language, based on the open-source user interface framework Bootstrap3 (
https://www.bootcss.com, accessed on 18 October 2021). Open-source JavaScript tools, including the jQuery database (
https://jquery.com/, accessed on 18 October 2021), form validation, and other libraries and plug-ins are used to provide a better user experience.
PSNPdms is a complete process laboratory system that performs batch import and export operations of data via Excel or CSV file formats. Once the samples are brought into the laboratory, barcode number labels will be printed via barcode printers and stapled to the outer packaging of the sample material. After the samples have been confirmed through offline verification, this sample information will be batch-entered into the PSNPdms system by intermediate users. Samples are then assigned to different primary users to conduct experimental work. The primary user predesigns a control table between the sample and DNA in PSNPdms and imports it into the system, then creates a DNA plate to store the extracted DNA. The user then must follow the experimental design information to perform DNA extraction and store the DNA.
Both KASP and SNP array platforms use DNA panels to perform data inspection and generate the fingerprint data. These fingerprint data files are imported into the PSNPdms system (
Figure 5A). The raw fingerprint data are stored in the KASP raw fingerprint database and the primary fingerprint database. The SNP viewer function (
Figure 5B) provides a more intuitive means of viewing and modifying locus data by restoring the raw data to coordinate graphics and data lists. The various locus data overlays can show the analytical quality and data characteristics of the raw data from multiple perspectives, providing comprehensive information for data determination.
Fingerprint data are processed by different users, and filtered and integrated from Database L1 to Database L2, and then to the standard fingerprint database, which ensures the quality of the data in the standard database. After using these standard fingerprint data in the fingerprint-matching function, all matching results can be confirmed by intermediate and advanced users and then entered into the variety identification result database (
Figure 5C). The FCGS algorithm is used in these matching functions to provide a better user experience. This allows the user to save the valid comparison results and at the same time provides support for the generation of result reports and modification of result data. In practice, these data will also provide a consistent reference for issuing similar reports several times, thus ensuring the accuracy and consistency of the conclusions.
The standard fingerprint database provides the data source for the genetic analysis function (
Figure 5D), but users can also use fingerprint data from outside the system to perform genetic analysis in a specified format. The core business of this function is computationally based on a graphical database in R (Ross Ihaka and Robert Gentleman, University of Auckland, Auckland, New Zealand), which provides implementation of several genetic distance calculation algorithms and generation of dendrograms of several styles. Users can download the genetic analysis output and image files.
3.4. Data Quality Control
The PSNPdms system has internal quality control mechanisms, using the standardized experimental design, standard reference samples, FSSA algorithm function, raw data correlation query, fingerprint comparison function, fingerprint identification results database, and other multiple aspects and dimensions, to provide functional support for data quality control. These quality control mechanisms mainly provide effective technical support for tracking and evaluating experimental accuracy, fingerprint data accuracy and completeness, fingerprint differences in the standard fingerprint database, and the accuracy of identification results.
First, at the experimental design stage, the system allows the user to standardize key information for experiments by pre-recording sample, DNA, and DNA plate information. The key information used in the experimental procedure must be consistent with this experimental design information to ensure that the sample flow process, DNA extraction and flow process, and DNA storage information are conducted according to this pre-defined information. Thus, in the event of a problem, the process information can be compared with the system to determine if there is a problem with the key process parameters. It is also mandatory that additional standard reference samples are added during the experiment to ensure that at least one standard reference sample fingerprint is present for electrophoresis of the test DNA plate. In this manner, the reliability of the fingerprint in the plate can be assessed during data analysis and after the fingerprint has been stored.
PSNPdms can trace the samples back to their source. The system can trace the DNA data of each sample through the entire workflow. The sample barcode number and DNA barcode number are used throughout the experiment and fingerprint data analysis processing. Thus, when a problem occurs in the experimental and data analysis process, the two barcode numbers can be used to locate the person responsible for the important stages, such as experimenters and data analysts, thus providing more information to determine the cause of the problem.
Given that the intermediate processes of the KASP and SNP array platforms are managed by the respective detection platforms and control software, the input information for these platforms is provided by the PSNPdms system; therefore, we do not need to concern ourselves with the detection processes of these platforms. PSNPdms mainly monitors the accuracy of experiments from the characteristics of the fingerprint data generated by these detection platforms. It focuses on the number of loci and missing loci of fingerprint data. The number of loci and missing loci are used to determine the level of repeatability between multiple fingerprints of a sample. This reflects the capability of personnel, the stability of the instrument, the quality of the reagents, and the stability of the locus, for example. Therefore, it is necessary to continuously train personnel, improve the care and maintenance of the instrument, use high-quality reagents, pay attention to the storage method, improve the design of the locus, and replace it with a higher-quality locus.
The FSSA algorithm in the PSNPdms system automates the determination of consistency characteristics between data from multiple sets of duplicate experimental data from a single experimenter or multiple sets of parallel experimental data from multiple experimenters, so that the user can focus only on sample data that are problematic after the algorithm processing. Users display and correct problematic raw data through the SNPviewer graphical function module provided by PSNPdms. Additional experimental fingerprints are provided by conducting supplemental experiments to reduce the number of missing loci and repeating experiments to reduce the number of differential loci and to improve data integrity and consistency. Based on the representative fractional selection method of the FSSA algorithm, most of the data noise generated in the experiment can be solved by repeating the experiment three times. After processing the data noise, the number of valid representative typing loci that can be selected by the FSSA algorithm will be increased, thus improving the integrity and reliability of the data.
After the data are entered into the standard fingerprint database, it is possible to determine the sample variability within a variety by matching the fingerprint data with an identified standard fingerprint of the same variety name through the matching function provided by PSNPdms, and to determine the sample variability between varieties by matching it with other fingerprints of different variety names in the standard fingerprint database. These are important parameters for assessing the quality of the standard fingerprint database established for each crop. The raw data can also be correlated to provide an improved basis for determining the specifics between problematic fingerprint data. Ultimately, historical determinations based on the variety identification results database provide a valid reference.
The PSNPdms data selection mechanism is an artificial selection mechanism. To ensure the accuracy of the fingerprint data generated by selection, it is necessary to control the maximum threshold of the proportion of noisy data as <40%; that is, the normal number of data sets must be ≥60%. In the actual detection process, a compromise between the minimum number of experiments and the best experimental results is made. Therefore, we usually first conduct two independent experiments for the control, and then select an algorithm to handle the problem before conducting a third independent experiment, so as to minimize the detection time and improve data quality. We prepared three sets of maize hybrid sample fingerprints: groups A and B were identical, and group C comprised the noisy data. First, we uploaded groups A and C to PSNPdms and used the menu functions “Database L1” and “Data Filter” to automatically filter and integrate the fingerprint data. We observed that there were many instances of missing loci. We uploaded group B to PSNPdms and used the menu functions “Database L1” and “Data Filtering” to automatically filter and integrate the groups A, B, and C data. We observed that the missing spots (loci) were filled in. Thus, we can improve the completeness and accuracy of the fingerprint data and achieve the quality control goal through this experimental method and data selection mechanism.
4. Discussion
To date, PSNPdms has been used in network database systems and software at 23 institutions of the Chinese Breeding Institute (including the Science and Technology Development Center of the Chinese Academy of Agricultural Sciences and the Chinese Rice Research Institute). PSNPdms has been used to establish SNP marker databases for breeding of crops such as maize, rice, and wheat. In practical applications, we observed that the pattern of multiple sets of duplicate fingerprint data in multiple crops shows a generalized pattern, whereas the field of DNA detection in humans and microbes is one of exceptional patterns. Thus, while the PSNPdms system achieves compatibility with plant data, it can also be applied to humans, microbes, and in other fields. At present, the PSNPdms system supports both diploid and polyploid crops. For simplification of polyploidy, for data detection and post-processing algorithms, we usually select diploidized markers for detection. In addition, to provide support for multi-crop data storage and reading operations, we have compiled a crop genus code table to unify the data among users, so that data from different users can be compared according to the crop genus code and marker name for identification.
The functionality of PSNPdms can be extended depending on the target sample being studied, as it is a potentially efficient DNA fingerprinting management platform for plant breeding research, animal breeding, and microbiology. For different plants, such as cotton or other polyploid plants, PSNPdms is also compatible.
At present, there are more than 50 active national forensic DNA fingerprint databases, including some of the largest compiled in China and the United States [
3,
34,
35,
36,
37]. Many countries have developed both animal-based and crop-based DNA fingerprint databases, as well as corresponding DNA fingerprint reference database indexing capabilities [
6,
38,
39]. Fingerprint-matching algorithms are a core technology in the construction and subsequent application of fingerprint databases. The purpose of these databases is to accurately evaluate the differences in fingerprint locus information between the detection data and the fingerprint database, and to provide a reliable basis for scientific conclusions. The algorithm shows significant application advantages for different laboratories that use genotyping. First, the algorithm is universal and can handle outputs from almost all current experimental platforms, including Page, Consumer Electronics, and KASP. The algorithm can also be used for various forms of molecular labeling data, including SNPs, SNP arrays, and InDels. This directly addresses the current problem of not being able to reference or share data across multiple laboratories owing to different experimental purposes and facilities. In addition, based on user-supplied raw data, FCGS is able to perform comparisons with 100% accuracy.
Other SNP typing software (Kraken or Affy SNP array) typically use a single locus with multiple data points overlaid (either from the same batch or from different batches). This allows for rapid and efficient locus typing, as the same locus often shows similar genotyping effects, such as whether it is tightly clustered, or whether heterozygous typing favors certain homozygous typing. This single locus, multi-sample overlap capability is also available in the PSNPdms.
In SNP genotyping software, a coordinate position determination threshold is set, and when one or both of the horizontal and vertical coordinates of a datum point exceeds the set threshold, it will be judged as a valid data point. Therefore, when the threshold is set too strictly, some data points may be judged as missing data points, resulting in a high frequency of missing data. After the typing data is entered into the database, the data points are overlapped by sample, so that the same sample can be integrated and then checked manually. When a sample shows a high percentage of missing data, the overlay can be viewed by sample rather than locus, and a manual review of loci for the same sample can be performed to further increase the read rate. If a sample is checked individually based on the locus, the amount of data is too large to manipulate. By overlaying all loci for a single sample, the database allows for graphical representation of this feature, rather than simply genotype data.
In contrast to other software, we added this feature because SNP marker assays are functional markers that focus on a small population of SNP loci, thus allowing samples to be accumulated on a single-locus scale. Conversely, when SNP markers are used for variety identification, use of medium flux samples (i.e., tens to hundreds of locus orders) is required; it is then more appropriate to use multiple locus overlays of a single sample to clearly show the read rate, read performance, and missing data for the genotype for that sample.
We plan to develop a fingerprint-matching microservice application based on the current FCGS algorithm. The main application will share the list of fingerprint data contained in the fingerprint-matching task, which can generate multiple comparison tasks containing a moderate number of fingerprints, and then distribute these small-scale tasks to fingerprint data matching services on multiple servers. After matching, the results are returned to the master server, allowing servers with different capabilities to be better used to perform large-scale matching tasks together. Finally, the comparison server nodes can be extended to provide larger and faster data comparison services.


