Article

Practices and Strategies for Adaptation to Climate Variability in Family Farming. An Analysis of Cases of Rural Communities in the Andes Mountains of Colombia and Chile

by
Carla Marchant Santiago
1,*,
Paulina Rodríguez Díaz
2,
Luis Morales-Salinas
3,
Liliana Paz Betancourt
4 and
Luis Ortega Fernández
5
1
Laboratory of Territorial Studies LabT UACh, Institute of Environmental and Evolutionary Sciences, Austral University of Chile, Valdivia 5090000, Chile
2
Institute of Geography, Pontifical Catholic University of Chile, Santiago 8320000, Chile
3
Laboratory for Research in Environmental Sciences (LARES), Department of Environmental Sciences and Renewable Natural Resources, Faculty of Agricultural Sciences, University of Chile, Santiago 8320000, Chile
4
Faculty of Education, Exact and Natural Sciences University of Cauca, Ecohabitats Foundation, Popayán 190001, Colombia
5
Ecohabitats Foundation, Popayán 190001, Colombia
*
Author to whom correspondence should be addressed.
Submission received: 1 October 2021 / Revised: 25 October 2021 / Accepted: 31 October 2021 / Published: 4 November 2021

Abstract

:
Climate variability imposes greater challenges on family farming and especially on rural communities in vulnerable mountainous regions such as the Andes in Latin America. Changes in rainfall patterns and fluctuations in temperatures cause a greater frequency of extreme events, increased pests, and crop diseases, which even lead to food insecurity in communities that depend on self-production for survival. This is why strategies need to be developed to face this new scenario. Two cases of adaptation experiences to the effects of climate variability in rural communities in Chile (Araucanía Region) and Colombia (Cauca Department) were analyzed on this paper. For this, a mixed methodological approach was adopted that included the analysis of climate data, socioeconomic, and productive characterization of the communities, and a characterization of adaptation practices for both cases. The results show various ways of adapting mainly to changes in the availability and access of water for the development of agriculture and for domestic use. Likewise, it is shown that in order to be successful, the measures for facing climate variability must be part of coordinated strategies under a community-based adaptation approach and not developed in isolation.

1. Introduction

Around 80% of agricultural holdings are based on family farming in Latin America. Family farming is defined by the Food and Agriculture Organization (FAO) [1] as “a way of organizing agriculture, livestock, forestry, fishing, aquaculture, and grazing, which is managed and operated by a family and which depends predominantly on family work, both by women and men”. This type of agriculture is essential to ensuring the food sovereignty of the Andean peoples and, according to Kohler and Romeo [2], is key to developing inclusive rural development strategies. family farming is particularly vulnerable, both to the effects of climate change and climate variability [3,4], because many of its activities depend directly and indirectly on the climate [5,6]. Family production is mainly oriented towards self-consumption and its level of diversification of economic activities is generally low [7]. Climatic variability increases the uncertainty of native and agricultural livestock production at the local scale in all the links of the production chain [8]. This is manifested mainly through variations in production and yields of the crops [9], accentuating the vulnerability of rural Andean communities as they are their main source of livelihood [10].
This work addresses climate variability (hereinafter, CV) and its effects on family farming in two rural communities in the Latin American Andes. Analyzing CV at this scale is essential for the development of local strategies that allow rural communities adapting to changes. According to the Intergovernmental Panel on Climate Change (IPCC) [11], CV is defined as the variations in the average state and other statistical characteristics of the climate (standard deviation, extreme episodes, etc.), in all spatial and temporal scales broader than those of meteorological phenomena, possibly due to natural internal processes of the climate system or variations in external forces (natural or anthropogenic). Therefore, its impacts are manifested in the short term and are possible to observe in small spatial scales. In Latin America, the effects of CV are evident from the increase in the frequency and intensity of extreme hydrometeorological events, mainly in areas with vulnerable rural populations in socioeconomic and climatic terms [11,12]. According to “Consorcio para el Desarrollo Sostenible de la Ecorregión Andina” (CONDESAN) [13], the frequency of extreme weather events increased by almost 40% between 2001 and 2010 in Andean countries.
Understanding CV at local scales is relevant because it can be caused and strengthened by natural internal processes of the climate system (internal variability) or by variations in natural or anthropogenic external forces (external variability). Therefore, it will have specific manifestations in each locality that is analyzed. Seaman et al. [14] point out that the effects of CV are more notable in rural communities in developing countries, given that most of the family income structure depends on agriculture and the levels of modernization and adaptation capacity are lower than in developed countries. This is key for the design of adaptation plans, since the development and implementation of any measure to address these new scenarios will require a thorough knowledge of the impacts at the local scale, considering that the strategies may not be replicable [6,15].
The two experiences presented in this work were those of rural communities in Colombia and Chile who developed adaptation measures to CV for their farms. In both cases, there is information that allow placing CV as an external factor that increases their vulnerability [16,17]. According to Martínez [15], CV affects coffee and sugarcane crops in Cauca, Colombia through the increase in or appearance of new pests and diseases, generating effects such as the increase in the use of chemical inputs, higher production costs, and deterioration of the soil in the medium and long term. On the other hand, studies indicate that a sustained decrease in rainfall has occurred since the second half of the twentieth century in the Araucanía Region, southern Chile. This has caused episodes of water shortages that are increasingly frequent and more prolonged [18,19,20,21,22,23]. These water shortages threaten the continuity of family farming.
These observations highlight the need to implement local adaptation measures and plans for family farmers against the effects of CV, since this is a threat to family farming as a productive way and traditional livelihood in the rural world. FAO [24] has recognized that global climate change policies do not clearly articulate the role of agriculture and food security and that the capacity of generating synergies is limited due to the separation adaptation and mitigation measures under different plans. These plans are normally executed with top-down approaches, at regional scales, and require high implementation costs for family farmers, while excluding them from these processes. According to Martínez [16], greater importance has been given to the need to reduce the effects of climate change and variability through the creation of adaptation plans in Latin America in recent years. These require a concerted effort by various stakeholders in the rural world, government entities, Non Governmental Organizations (NGOs), and academia. The mechanisms that each country and community develop depend on a series of factors, but mainly on the way in which the environmental and social dimensions are understood and integrated. For this, it is relevant to consider approaches such as community-based adaptation, which is defined by IPCC [11] as a process of local adaptation induced by the community. Community adaptation focuses on empowering autonomy and promoting communities’ adaptive capacity. This is an approach that takes the context, culture, knowledge, capacity to act and the preferences of the communities as strengths. This is the case of family farming communities in Ghana [25], where farmers use a series of inter- and extra-farm strategies to face the effects of CV on their livelihoods, considering collective action strategies. Likewise, Singh et al. [26] have described how family farmers have had to cope with the effects of CV through autonomous adaptation strategies in India. However, Abid [27] mentions that family farmers’ adaptive capacity to climate variation depends on their experience and ability to recognize those changes. Likewise, Herrador and Paredes [28] point out that local organization capacity is a key element to develop adaptation strategies on their study conducted in the Andes in Ecuador.
The objective of this paper is to analyze two experiences of the implementation of adaptation practices to climate variability in rural communities of the Latin American Andes: Curarrehue and Pucón in southern Chile (Araucanía Region) and Popayán in southern Colombia (Cauca Department). The former strategies are carried out individually and intuitively by the farmers, and the latter strategies are part of a coordinated strategy implemented within the framework of a public-private intervention program (Farm Adaptation Plans) [29]. Thus, the following questions are addressed in this article: How does climate variability manifest itself in these two cases? What are the projected future climatic scenarios? What are the socioeconomic and productive characteristics of family farming communities in both places? Which practices do communities develop to face the challenges that climate variability imposes on them? The paper is structured as follows: first, the main characteristics of each area in Chile and Colombia, and how climatic data (precipitation trends) and projected climatic trends were analyzed are presented in Materials and Methods. This information was used to understand the kind of challenges that family farmers may face in the future. Additionally, the socioeconomic parameters that were used to characterize each community and their climate adaptation strategies are described. Then, the results are presented, including the analysis of current CV patterns and projected climatic scenarios, the description of each community, and their most relevant adaptation practices. Lastly, the paper closes with a discussion of the main findings and conclusions.

2. Materials and Methods
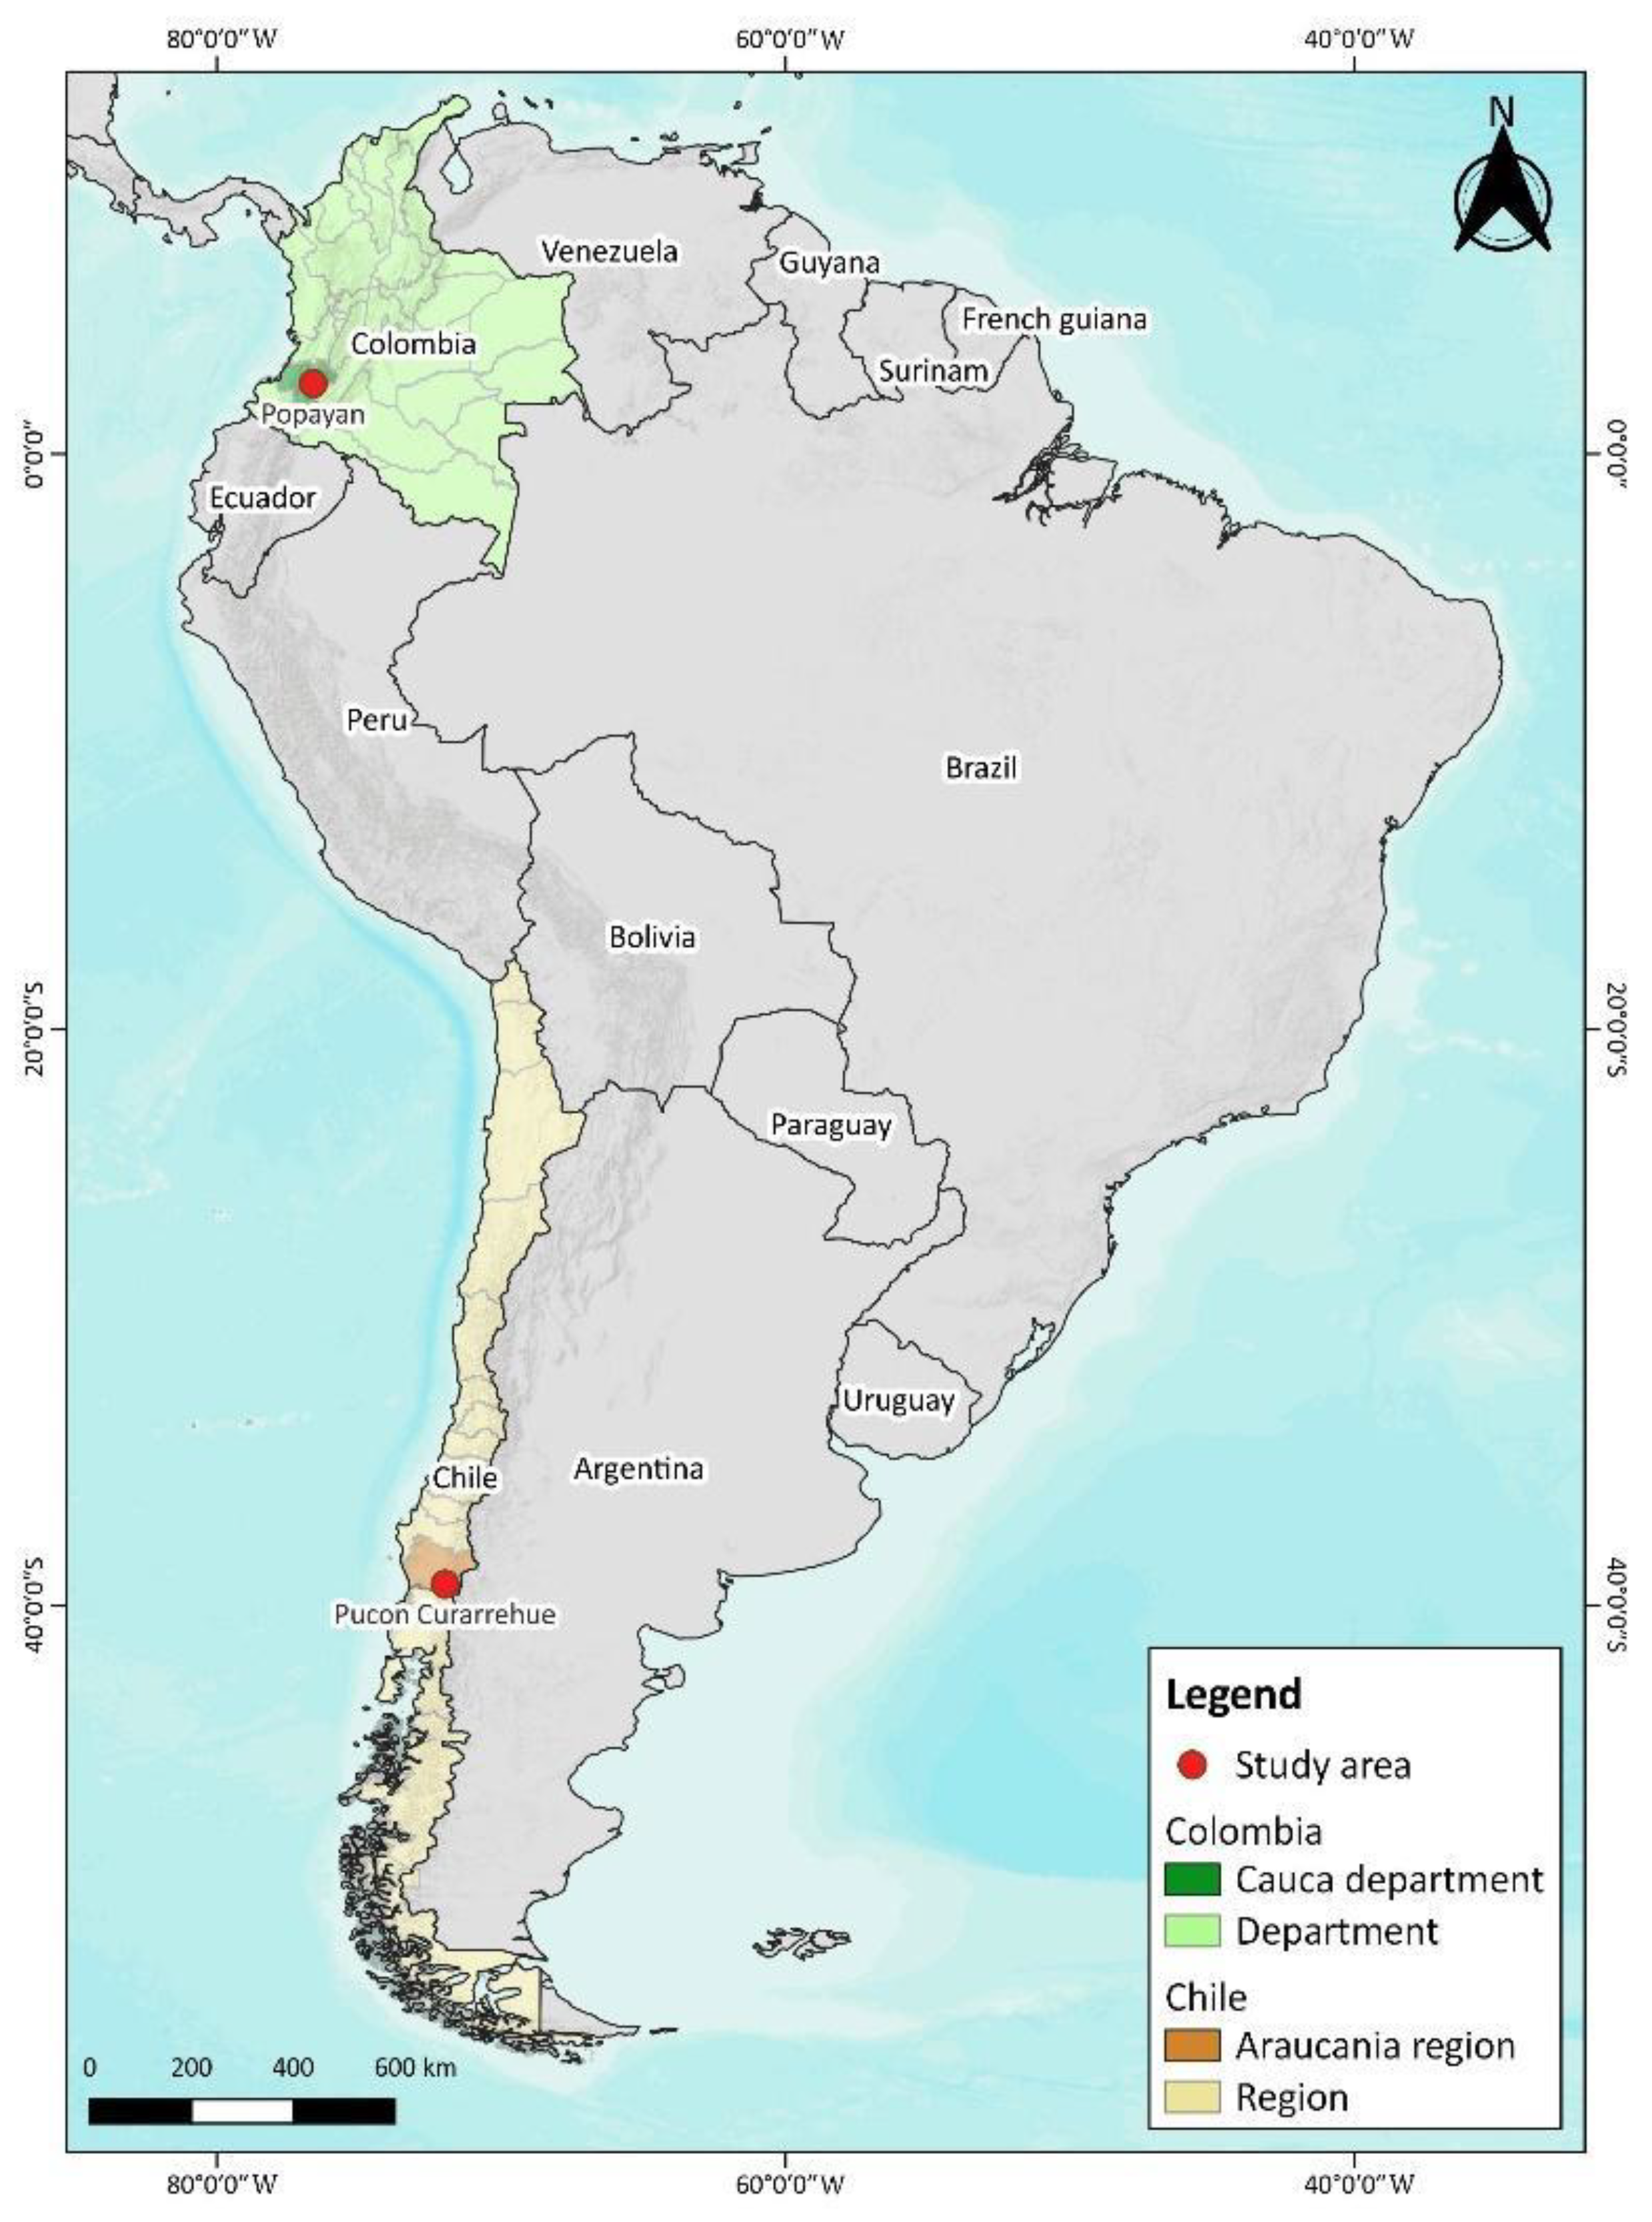
2.1. Study Area

The first case is located in Colombia, in the Department of Cauca, specifically in the northwestern rural area of Popayán. It comprises seven villages (veredas): Los Cerrillos, Danubio, Las Mercedes, San Rafael, La Mota, Villanueva, and Los Tendidos (Figure 1). According to the political-administrative division of the country, a village corresponds to the smallest unit of territorial administration of the departments. According to Paz and Ortega [29], this territory is characterized by the development of rural agriculture dedicated to monocultures of coffee and panela sugar cane. They use practices that cause environmental degradation, such as burning, development of temporary crops without conservation efforts, cultivation on soils with steep slopes, and deforestation of native forests in water supply basins which face contamination problems due to residues from coffee production.
Popayán’s climate is cataloged as “humid temperate” (Cfb according to Köppen–Geiger) with a narrow temperature range through the year (January: 20 °C–12.5 °C, July: 20.4 °C–11.9 °C, Max–Min T°). The average annual rainfall is 2121 mm, with rainfall throughout the year without a defined dry period. However, in the months of June and July, precipitation decreases considerably. Relative humidity increases from winter to summer, with values of 85% in January and 80% in July.
In Chile, the case study is located in the municipalities of Curarrehue and Pucón in the Araucanía Region. The agriculture that is developed is mainly for subsistence. It consists of family gardens where garden produce, vegetables, aromatic herbs, and some annual crops, such as wheat, are grown [30]. The area has a “temperate, rainy, and Mediterranean” climate due to its proximity to the ocean. This decreases towards the foothills of the mountains where the annual temperature amplitude is significant, as it is at a greater distance from the coast, resulting in a greater continental influence in climate. The temperature regime varies significantly through the year (January: 22.2 °C–8.5 °C, July: 9.7 °C–2.7 °C, Max–Min T°). Curarrehue presents approximately 35 episodes of frost per year with an absolute minimum temperature of −4.4 °C in winter, −3.6 °C between September and October, and −2.4 °C between April and May, associated with autumn frosts (early frosts), winter, and spring frosts (late frosts). Average annual rainfall is 2442 mm with an approximate water deficit of 146 mm/year. The study area presents rainfall throughout the year, without a dry period, which indicates that it rains every month of the year. The wet period lasts 8 months, during which a water surplus of 1618 mm is reached.

2.2. Methodological Approach

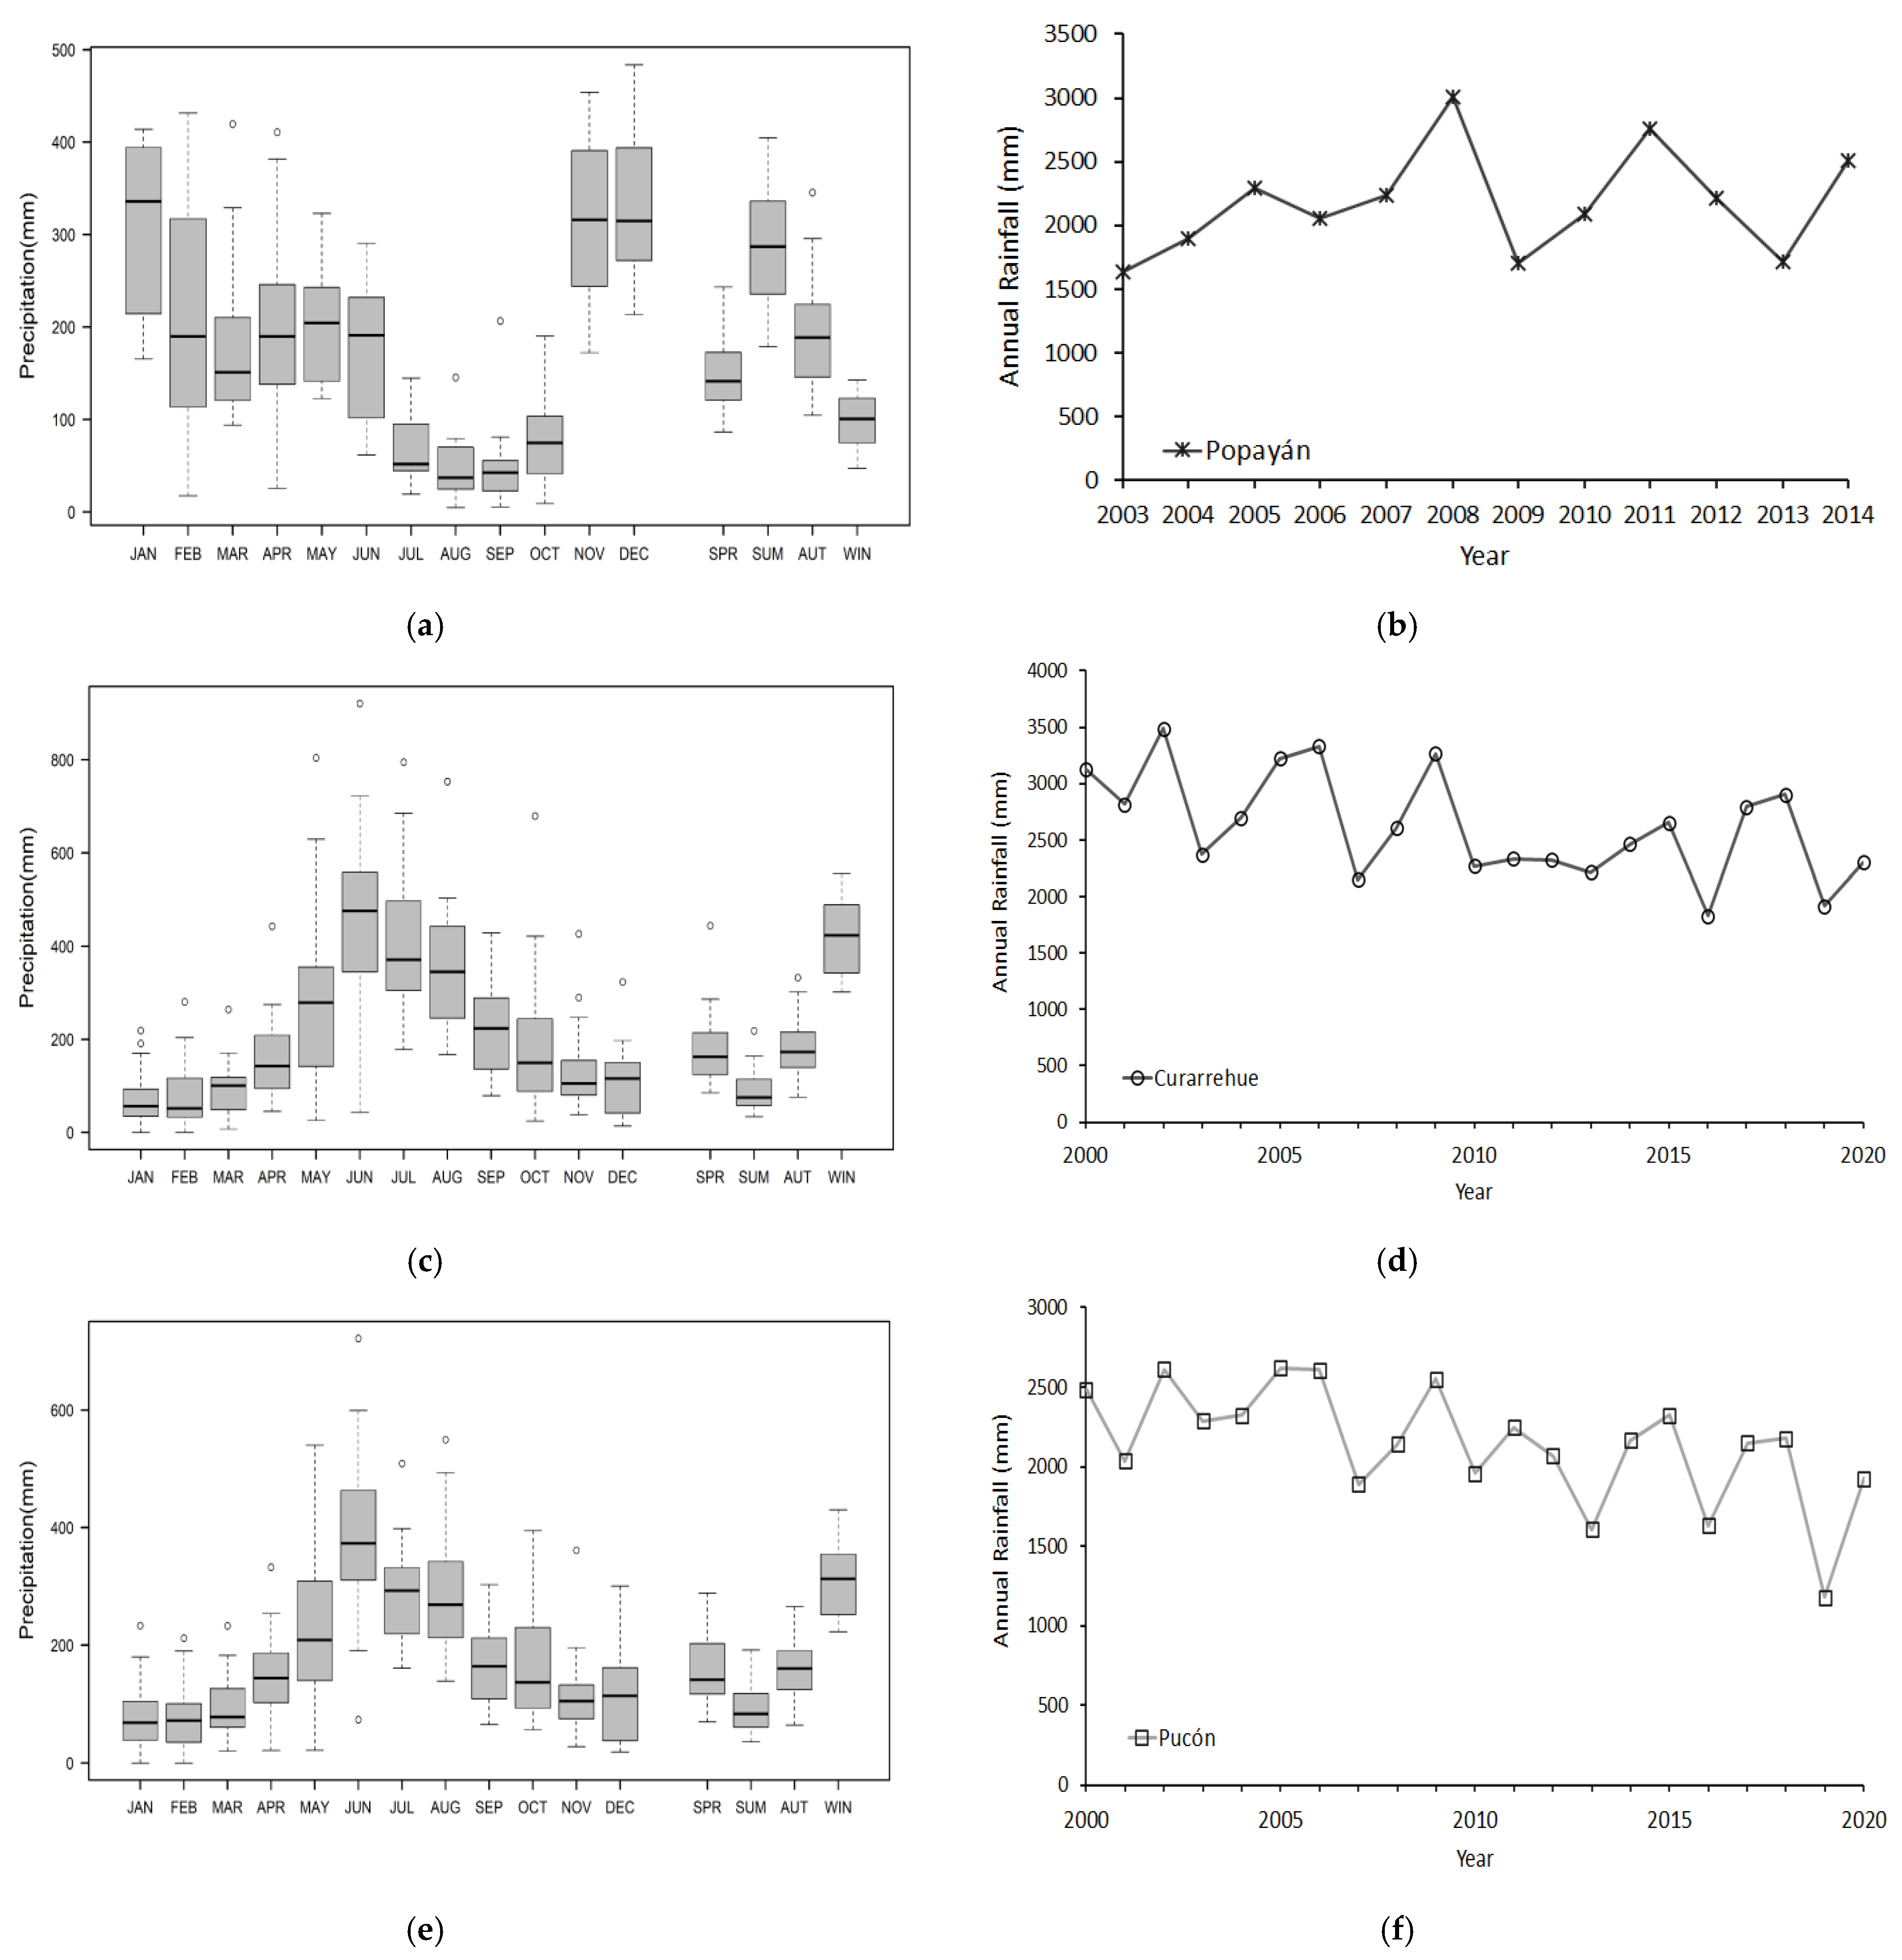
2.2.1. Trend Analysis of Rainfall Periods

Precipitation is a variable that has shown great variability and uncertainty associated with the climatic phenomena of El Niño, La Niña, and other oscillations, so an approximation can be achieved by studying the temporal evolution of the trend. The combined effect of precipitation and temperature would be affecting soil water balance and with it crop yields [31]. For the analysis rainfall time series, the non-parametric Mann–Kendall test [32] was used to estimate the trend of the series of temperature and precipitation in the period 2000–2020. Finally, a slope estimator based on Kendall’s tau coefficient was used to test for trends [33]. A significance level of 5% was used for all tests. This approach has been suggested for the analysis of trends in climatological and hydrological periods by the World Meteorological Organization (WMO) [34] and has also been used in previous studies on climate change and climate variability [35,36,37]. We conducted the statistical tests in R [38,39].

2.2.2. Analysis of Climate Change Scenarios

To estimate the future behavior of precipitation and temperature, we resort to the climate change scenarios estimated by the different climate research centers under the methodological approach of the IPCC. This is relevant information to determine how adaptation strategies may need modification and adjustment as the climate changes. The Climate Change, Agriculture and Food Security database (CCAFS-Climate global database) that corresponds to bias-corrected climate change projections was used. In order to work with a database at a 1 km2 spatial resolution, the delta method was used for the coupled models (Coupled Model Intercomparison Project 5 CMIP5) and the four routes of the Representative Concentration Pathways (RCP) found in the IPCC report [40,41,42,43]. The first RCP8.5 corresponds to a more pessimistic scenario (4 °C temperature increase), while the last scenario RCP2.6 is the most optimistic (1 °C temperature increase), but there are also two average scenarios (RCP4.5 and RCP6.0) between these extreme scenarios. For the present article, an ensemble scenario was used as an exploratory step, which theoretically corresponds to an average scenario of the RCPs defined by the IPCC [44].
The delta method was preferred because it has proven to be reliable for generating climate matrices (Grids) on a monthly average scale, where we obtain scenarios for average decadal climatic conditions [44]. For each climate scenario, future 30-year periods named 2030 (2020–2049), 2040 (2030–2059), 2050 (2040–2069), 2060 (2050–2079), 2070 (2060–2089), and 2080 (2070–2099) were used, and for the monthly average climatic variables corresponding to precipitation, average, maximum and minimum temperatures were used. As a baseline, the world climate database, WorldClim, was used due to its high spatial resolution (30 arc-s) and the quality of its spatial interpolation. This database was developed from historical global climate data, with more than 47,000 weather stations around the world between 1950 and 2000 [45,46,47].

2.3. Socioeconomic, Productive, and Adaptation Practices Characterization

A characterization of family farms was carried out in both cases, considering socioeconomic and productive dimensions. A set of nine parameters was used (Table 1). For Colombia, data from baseline studies of the TeSac-Cauca project developed by Paz and Ortega were used (139 family farmers) [29]. In the Chilean case, data were collected in field campaigns carried out between 2017 and 2019.
The snowball approach [48] was used to select small farmers on a second stage in order to characterize adaptation strategies. Eighteen farms were visited in Colombia, and 30 farms were visited in Chile. During each visit, the entire farm was observed, including their adaptation practices, and semi-structured surveys were used to interview the person in charge of the farm, mostly women (52.5% in Colombia and 50.5% in Chile). The ages ranged mostly between 30 and 59 years old (41.8% in Colombia and 40.2% in Chile). The questions of the survey were grouped into 4 categories: socioeconomic profile, associativity and networks, characteristics of the production system, adaptation practices (see Appendix A). Characterization worksheets were used to systematize the information (type of adaptive practice, description, operation, etc.) during each visit, which was complemented with a photographic record.
Lastly, a process of triangulation of the information [49] provided by the socioeconomic and productive assessment, the participant observation, and the analysis of the semi-structured interviews and characterization sheets of practices carried out in each farm was performed.

3. Results

3.1. CV Characterization: Precipitation Trends

Figure 2 shows the average monthly precipitation (a,c) and total annual precipitation (b,d) for the period 2000–2016 for the towns of Popayán, Colombia, and Curarrehue and Pucón, Chile (2000–2020). Figure 2c,d show a trend in the values of total annual precipitation for the time period. Table 2 shows the descriptive statistical values of trends in annual precipitation between 2000 and 2020 for the study areas in Colombia and Chile. In the case of Chile, the localities of Curarrehue and Pucón show significant negative trends, with a Sen’s slope of −38,438 and −29,365 mm per decade, respectively. However, Popayán, Colombia, showed a not significant positive trend of +39,069 mm per decade. From a regional perspective, decreasing trends are observed in southern Central Chile. However, in the Cauca Region in Colombia, there is an increasing trend.
The information available in the scientific literature indicates that extreme precipitation events will intensify in both countries [23,29]. Droughts are likely to be more recurrent and of longer duration in Chile. At the same time, there will be prolonged rainfall events that could be of shorter duration but greater intensity in Colombia. This scenario may change precipitation patterns not only on the monthly amount, but also on their seasonality, and long-term trends. There are very little data on precipitation patterns for the study area at the time frame of study, so a supplementary analysis is required in order to determine the temporal precipitation pattern. Thus, it is necessary to estimate the average of future precipitations in order to interpret climate change scenarios in both places.

3.2. Climatic Trends

Table 3 and Table 4 show the result of the analysis on the climatic grids associated with the climate change scenarios for Popayán and Curarrehue by the year 2050, for precipitation and temperature (mean, maximum, and minimum).
In the area of Popayán, Colombia, it is expected on average by the year 2050 that precipitation increases in the order of 80 mm. However, other scenarios show increases in the order of 150 mm or more. According to Table 2, the monthly average amounts are expected to show a positive trend, accumulating an average surplus in the order of more than 23 mm/decade. In the case of the average temperature (Table 5), increases between 0.7 °C and 1.4 °C are expected by the year 2050, depending on the climate change scenario used. In the summer period, an average increase of 0.6 °C is expected by the year 2050. However, it could exceed 1.1 °C, depending on the climate change scenario used.
On average, by the year 2050, precipitation is expected to decrease in Curarrehue by 65 mm. However, the most pessimistic scenarios show decreases of 200 mm or more. According to Table 3, the monthly average amounts are expected to show a negative trend, accumulating an average deficit in the order of 20 mm/decade. In the case of the average temperature (Table 6), by the year 2050, increases of between 0.5 °C and 0.8 °C are expected, depending on the climate change scenario used. In the summer period, an average increase of 1 °C is expected by the year 2050; however, the increase could reach up to 2 °C, depending on the climate change scenario used.

3.3. Socioeconomic and Productive Characterization of the Rural Community in Cauca, Colombia

The Cauca case study corresponds to farmers belonging to the Climate-Adapted Sustainable Territories project (TeSac-Cauca), an initiative that brought together more than 100 rural families (Appendix B). The adult population (between 30 and 59 years old) predominates this group, which represents 41.8%, while children (between 0 and 14 years old), correspond to 17.4% of the population. The population is mainly female (52.5%).
Of these families, 23.6% are made up of three people. The educational level shows that 47.9% of households have a member with a secondary education. There is a gap in post-secondary levels, where only 12.9% of households have members at this level. Such disparity on the level of education between families hinders collective learning experiences as it is necessary to preliminarily leveling up knowledge in order to properly include everyone. With regard to the livelihoods on the farm, the development of mixed economic activities predominates (56.4% of the farms), in which income is diversified through production for subsistence and food crops mainly for sale and, to a lesser extent, other products such as wood, firewood, honey, and compost. On the other hand, participation in social organizations or community groups oriented towards the management of natural resources is low (71.4% do not participate in any). Of the remaining population, 23.6% participate in some form of association (e.g., soil, water or land management groups; savings or credit groups or nursery and reforestation groups).
With regard to access to land, 61.4% of the population owns farms sized between 1 and 5 hectares, highlighting the constant process of land subdivision which requires land use to be optimized as a strategic option. Forty percent of them are mainly dedicated to agricultural use. Of the families, 52.9% have a low diversification index, that is, they produce only between 1 to 4 products, which threatens food security for the families. This is directly related to the marketing index, which is also low; 69.3% of families sell 1 or 2 products. These products include mainly coffee, sugar cane, and vegetables for self-consumption. On the other hand, 36.4% of households receive income from 2 sources, which normally correspond to employment on other farms, loans with formal institutions or government subsidies.
One of the key aspects for family farming is the technology used to obtain and manage water on the property. The use of tanks or infrastructure for rainwater harvesting predominates (27% of the total), which improves their capacity for adaptation. Lastly, with respect to the changes implemented by the families in the farms regarding water management in the last 10 years, 81.4% of the families did not carry out any action, and only 6.4% carried out two or more actions. These changes include: starting to irrigate, introducing micro-watershed management, improving irrigation systems, and improving drainage.

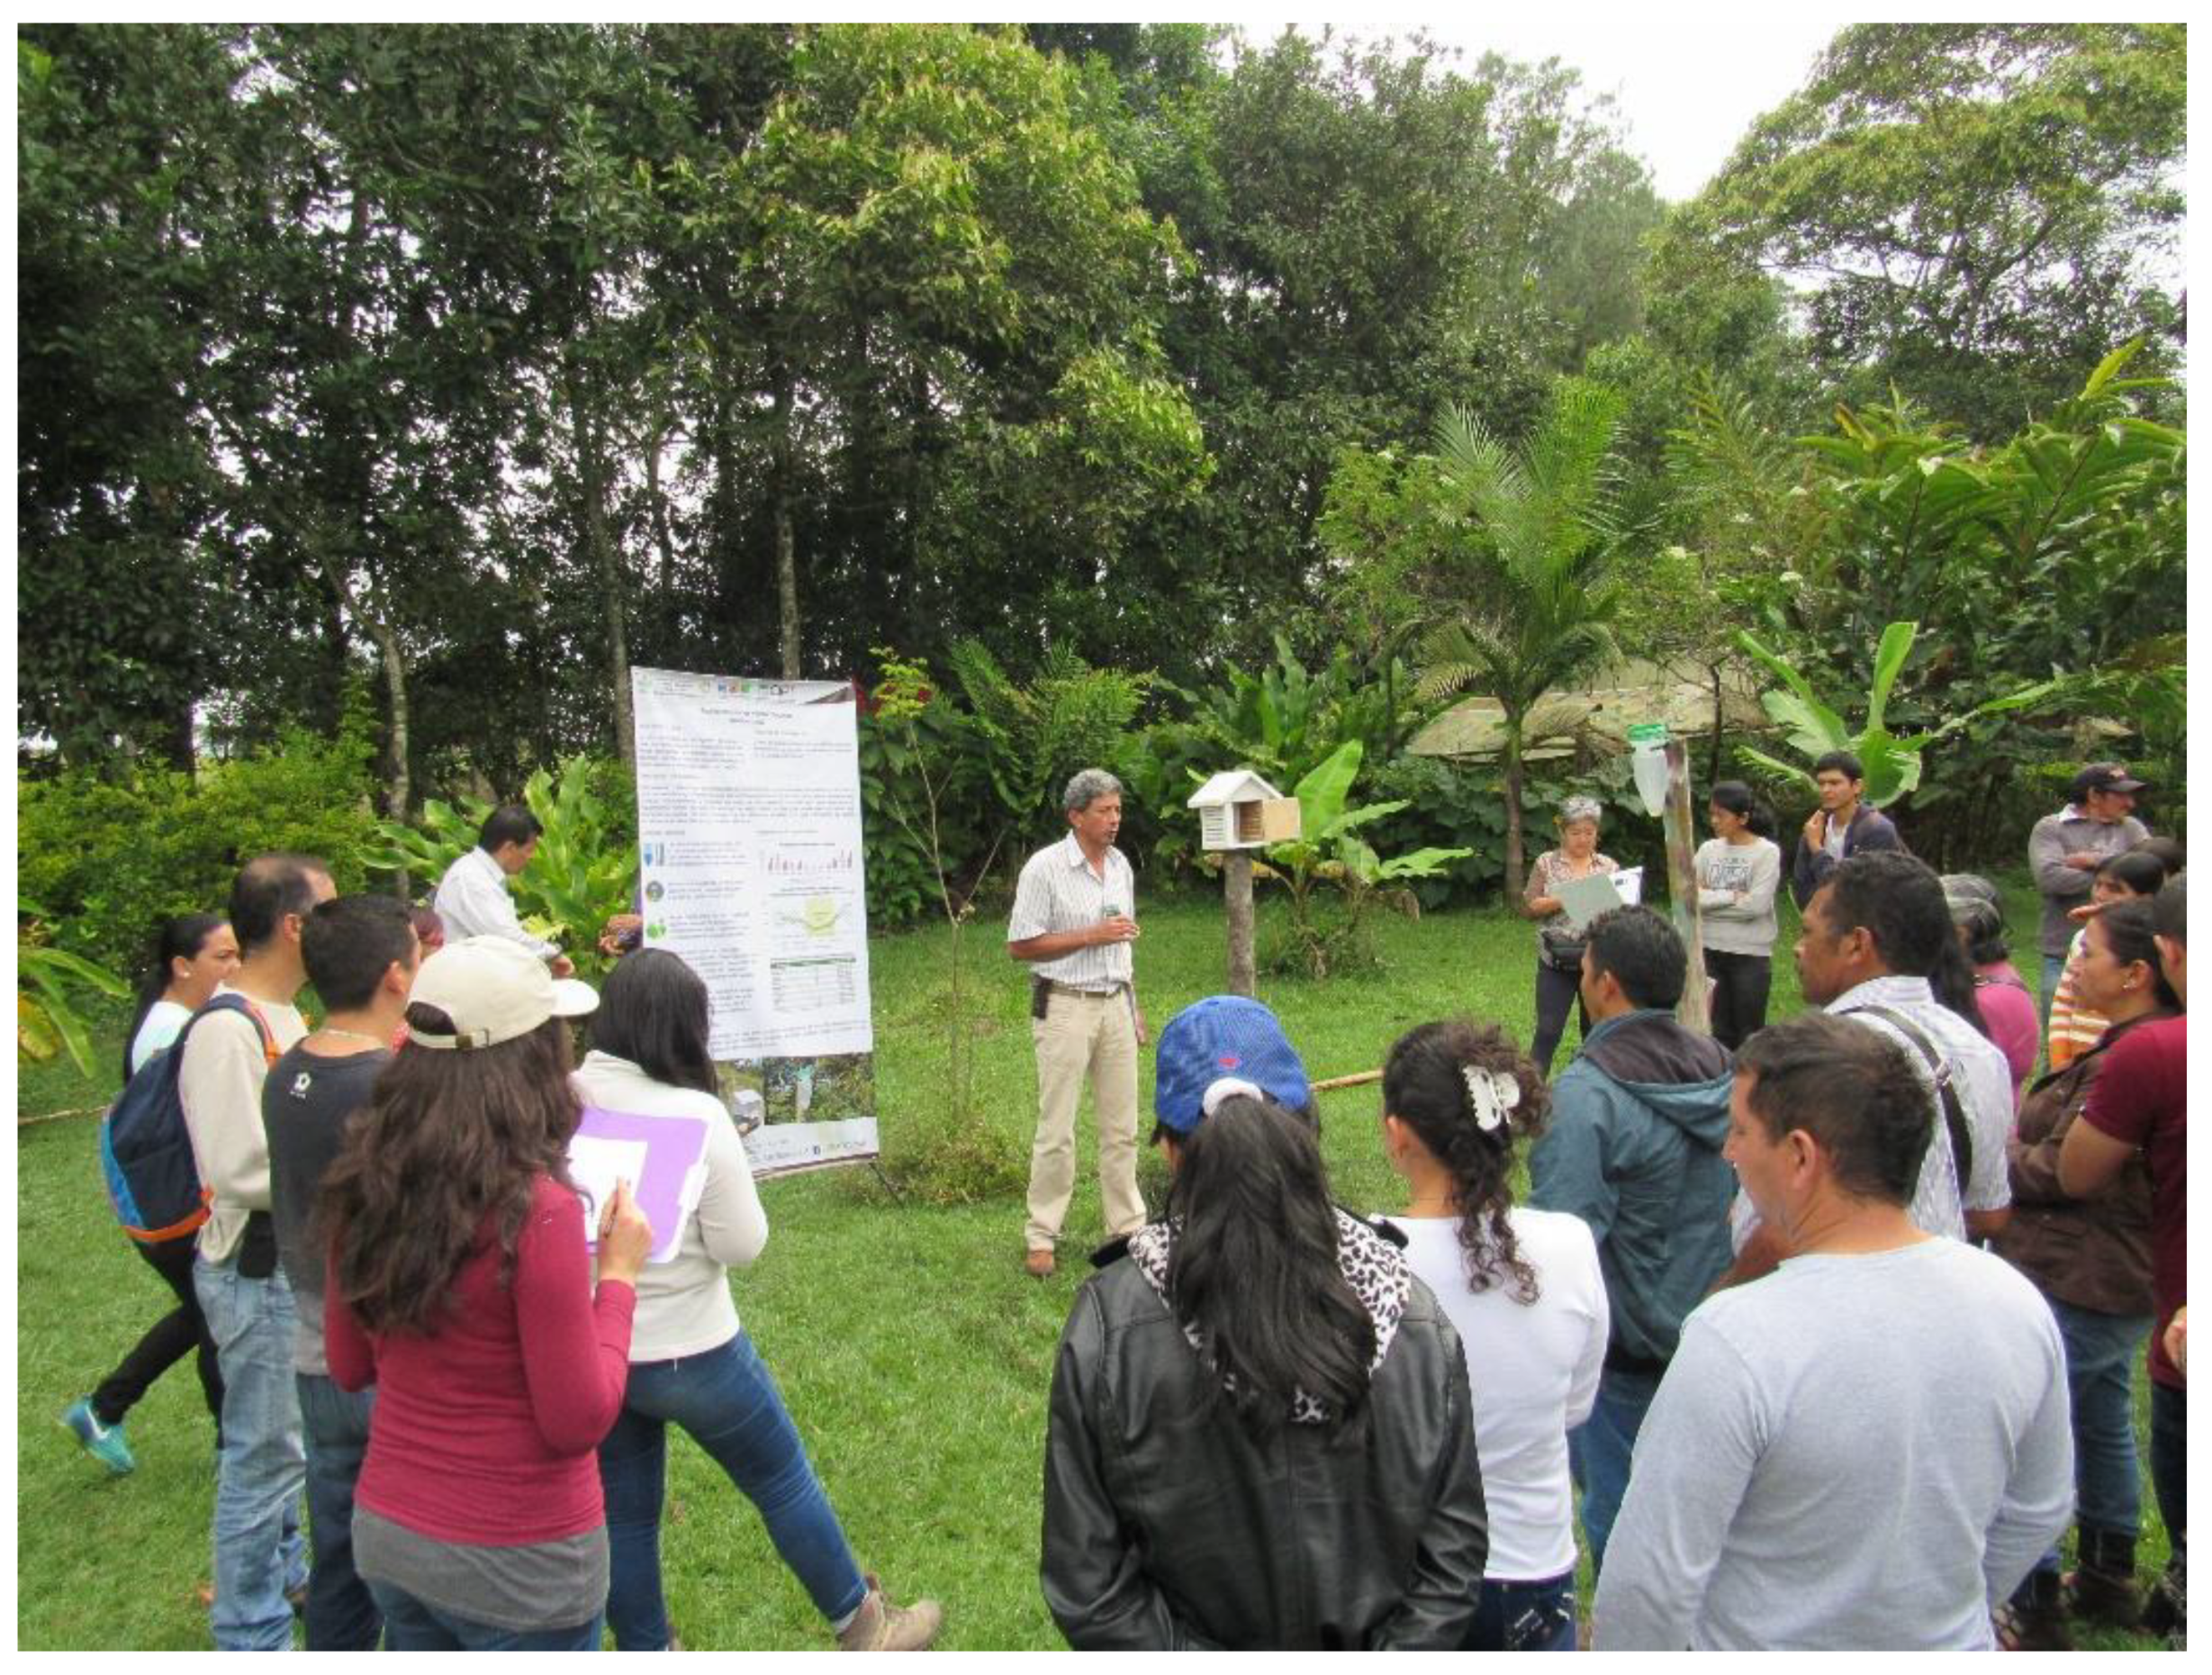
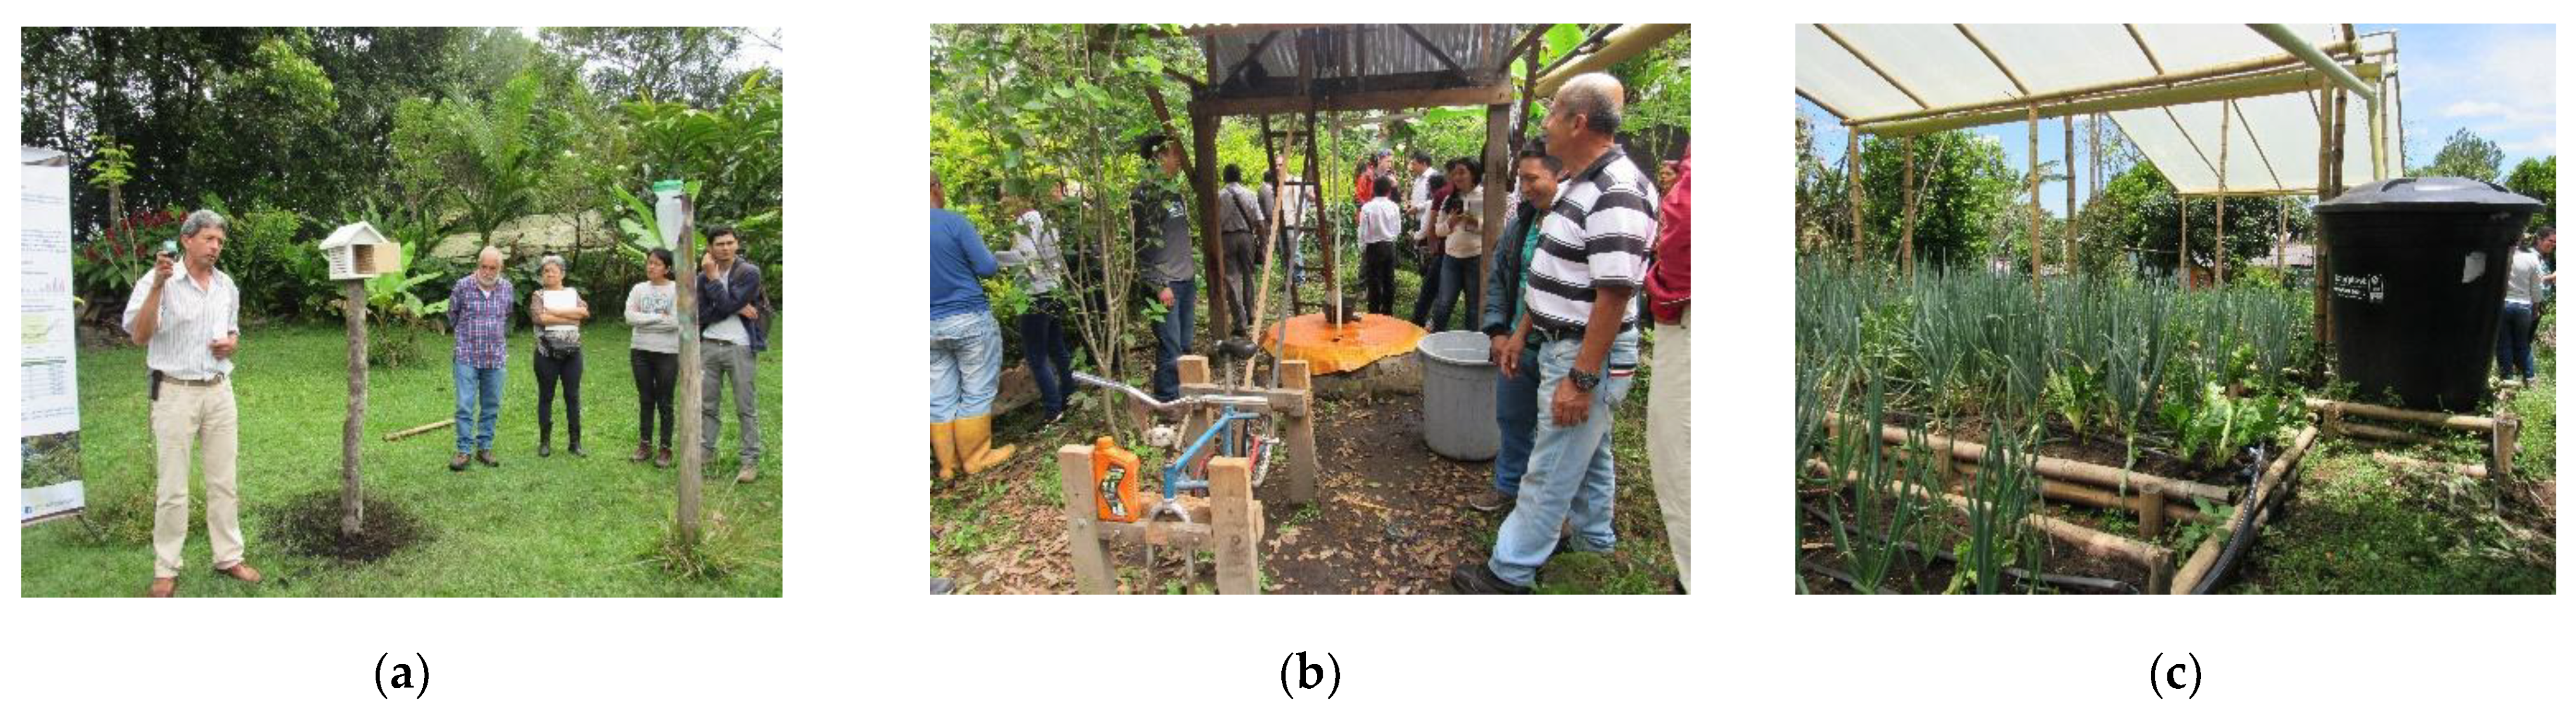
The Bottom-Up Strategy of the TeSac-Cauca Project for Adaptation to Climate Variability

The TeSac project was implemented between 2014 and 2019 and promoted by Ecohabitats Foundation, the Association of Community Action Boards, the CGIAR Research Program on Climate Change, the Agriculture and Food Security (CCAFS), and the Center for Tropical Agriculture (CIAT). This is a pilot model that seeks to develop interventions for adaptation to CV at the farm level, with a strong base in local knowledge, and aims to deploy low-cost interventions, co-created and adapted to the capacities and possibilities of each family. Currently, Ecohabitats, in coordination with the Association of Community Action Boards, continues with its development.
The project is based on the hypotheses of “Climate-Smart Agriculture”, a proposal promoted by FAO [50], which seeks to guide actions to transform and reorient agricultural systems to guarantee food security in a context of a changing climate. Lipper et al. [51] point out that this concept has allowed the roles of agriculture, sustainable agricultural development and food security to be linked with the development of climate change policies.
This strategy is developed with the Farm Adaptation Plans methodology [29], through the visualization of the territory in a continuous adaptive framework, conceiving adaptation as a social, multidimensional, and contextualized process. The approach of this strategy combines technical-scientific knowledge with the participation of organized communities possessing local knowledge deeply rooted in their territory. Additionally, this approach not only responds to the current and future impacts of climate variability, but is based on the assessment of the knowledge, expectations, and real experiences of local people; therefore, it contributes to the “bottom up” approach, with measures relevant to socioeconomic development and environment of a given territory. These characteristics enhance the viability of farm planning interventions. Paz and Ortega [29] point out that the participating communities have been able to self-manage economic resources or investments for their communities, which is an indicator considered by the team of facilitators for their choice. The families participate in two levels of territorial organization and representation: in its community at the local level, and on a larger scale. The authors point out that this approach has a series of advantages, especially its non-interventionist nature, since it is the same people from the community who identify and execute the objectives and methodologies for the actions, which allows training people from the community that can replicate the methodologies used (Farmers’ Field School), in addition to allowing a more efficient management of resources and time (Figure 3).
Four practices that propose simple and low-cost tools for decision-making by farmers when choosing the best adaptations to CV stand out in the TeSac project strategy.
  • Design of Farm-level Adaptation Plans
This is the first measure developed in the project. Using a participatory method [29], the consulting team and the rural locals develop collective mappings to define the territory and identify the resources, vulnerabilities, magnitude, and time scale in which they recognize there is an affectation. Based on this initial analysis, the families, with the support of local facilitators, define adequate short and medium-term adaptation measures to reduce the identified impacts (mainly droughts, rains, and winds), considering the costs of implementation and maintenance. The main short-term adaptation measures were smart water management and vertical house gardens, and the medium-term measures were generating smart weather and climate information and implementation of Farm-level Adaptation Plans which are described as follows.
To consider the organizational dimension of the communities in question, several workshops are held to gather information on aspects related to food security, natural resource management, and climate change crisis management (considering that the change in climatic conditions to which the farmers are accustomed is threatening their way of life). Once these analyses have been carried out, a workshop is held to project a “vision of the future up to 2030”, identifying the main opportunities that the community has to achieve its development vision.
  • Smart water management
A series of practices were identified that consider the design of domestic rainwater harvesting systems and irrigation mini-districts. This approach is fundamental due to the scarcity or difficulty in accessing water for consumption and irrigation, especially during the 4 months that were identified by farmers with greater water deficit. The program emphasizes the promotion and training of farmers in the manufacture of these systems. The Strategy of Farmer’s Schools for Adaptation implemented by the Ecohabitats program emphasizes the promotion and training of farmers in the manufacture of these systems. Then, skilled farmers will be in charge of scaling and multiplying these measures to other communities and regions.
Water harvest is carried out considering the water needs of each farm, which allows the implementation of ponds of varying sizes. Then, the collected water is used for irrigation and domestic consumption and contributes to maintaining subsistence crops during the dry season.
Other practices are added, such as the use of the rope water pump. This is used to optimize the extraction of underground water, reducing the effort and risk for women and children in charge of hauling water from sources that are away from their homes. This pumping mechanism is powered by hydraulic force to extract water in shallow wells avoiding the use of external power sources. The water obtained can be used for irrigation, human and domestic consumption, as well as for storage throughout the year. The system does not exhaust the flow from which it is supplied, does not pollute, and requires little maintenance. With it, families can obtain 200 L/day in the rainy season and 100 L/day in the dry season. This water is used 70% in the home and the remaining 30% is used for agricultural purposes. Together, these two measures resolve the water supply for the family farm throughout the year.
  • Generation of smart weather and climate information
This is a fundamental pillar of the CV adaptation strategy, as it allows producers to analyze their local data with the information provided by Ecohabitats in “Boletines de Pronósticos Climáticos” (Climatic forecast bulletins) prepared with information by Instituto de Hidrología, Meteorología y Estudios Ambientales (Institute for Hydrology, Meteorology and Environmental Studies, IDEAM, for the acronym in Spanish). This supports decision-making related to harvesting and sowing periods, the use of agricultural inputs, the emergence of pests and diseases, and other post-harvest activities.
The practice is part of a Climate Information System designed by Ecohabitats, consisting of community-run meteorological stations composed of a rain gauge and a manual reading maximum and minimum thermometer in 10 selected farms based on an agroclimatic analysis of the territory. The producers record data on a daily basis from their instruments, and then these are collected and systematized by a rural young woman, who delivers them to Ecohabitats. The Ecohabitats team then manage the data, produce analyses, plots, and integrates them with the forecasts provided by IDEAM, to generate the Climate Bulletins, which are distributed and analyzed in village sessions. The information generated in the analysis sections of the bulletins, such as agricultural recommendations, provides feedback to the Mesa Técnica Agroclimática del Cauca. This is one of the most relevant practices for the adaptation process, since it allows farmers to optimize decision-making during all stages of the process.
  • Vertical house gardens
These are developed to promote food security. They have drip irrigation systems to maximize water usage. This practice allows self-production for daily sustenance and reduces dependency and expenses associated with buying food. It is also a good alternative for farms that have restricted space for cultivation. In addition, it is seen as an alternative for the permanent and sustainable generation of extra income for families. Examples of this are the production of vegetables and organic fertilizer in biofactories implemented on the same farms, which are marketed between farms and also in nearby urban organic markets such as Popayán. Figure 4 presents some of the practices described.

3.4. Characterization of Rural Communities in Southern Chile: Curarrehue and Pucón

This case study comprises 30 farmer families, where the adult population (between 30 and 59 years old) predominates with 40.2%, while 14% of the population are children (between 0 and 14 years old), which is the least represented group (see Appendix B). This fact indicates an aging population and generates uncertainty about the permanence of peasant knowledge and practices in these localities. The female population represents 50.5% of the population. Families are mainly made up of four members (33.3%). Regarding the educational level, the maximum level reached by at least one member of the family is high school (secondary) in 50% of the households, while 46.7% have reached post-secondary levels. This level of formal education helps the implementation of rural outreach programs. The economic and productive activities are mainly mixed (73.3%), combining self-sufficiency with the commercialization of surpluses and other economic activities outside the farm, such as remunerated jobs in construction or services. The diversified nature of their economic activities promotes income stability. On the other hand, 100% of households are part of at least one territorial organization. These groups are diverse in nature: producers, rural women, indigenous communities, water management, organizations for access to subsidies, among others.
Access to land for the rural communities analyzed predominantly consists of farms of between 1 and 5 hectares (43.3%) which shows how land is being divided and may be prone to changes in land use. In relation to the main activity of the property, 46.2% develop a predominantly agricultural use. Along these lines, the percentage of households differentiated by number of income sources shows that 46.7% receive income from three sources. These correspond to jobs outside the home, pensions, loans with formal institutions or government subsidies, among others. The productive diversification index indicates that 73% of households produce between five and eight different products, which is classified as a medium level of diversification.
The technologies of water acquisition and management on the farm are characterized by the predominance of the use of water ponds associated with natural springs (non-potable water) with 46.3% of the cases. Lastly, changes in water management practices in the last 10 years show that 46.7% of households made one change, while 30% made no changes. The main changes were joining a Rural Drinking Water Committee (CAPR, for the acronym in Spanish), acquiring a pump, implementing modernized irrigation, and incorporating rainwater harvest.

Intuitive and Individual Adaptation Practices of the Farmers of Curarrehue and Pucón

Climate variability manifests as a sustained trend of decreasing rainfall in Curarrehue and Pucón. In addition, difficulties of access and use due to the governance of this resource in Chile worsens the situation. The Chilean government grants permanent water use rights to private parties, which can be traded (sold or mortgaged) on the market and are separated from the land [52]. To face this double problem, farmers develop adaptation practices, mainly oriented towards the management of water. However, it is important to establish that these practices do not consist of coordinated strategies, but are essentially individual initiatives developed with some aid from sectoral state programs.
The practices identified come from both the outreach of public agencies and academia, as well as local and traditional ecological knowledge. The broad territorial coverage of the National Agricultural Development Institute (INDAP) has had a notable impact on the practices developed by farmers from Curarrehue and Pucón, through the rural outreach programs Local Development Program (PRODESAL) and Indigenous Territorial Development Program (PDTI). On the other hand, the use of local ecological knowledge as the main input for the implementation of practices stands out. An example of this observed in the study area is the prediction of local meteorological conditions, i.e., the ability to anticipate how the next growing season will be, in terms of temperature and rainfall, based on the observation of nature: 63% of the farmers who mentioned knowing how to predict the meteorological conditions of the following year or season indicated that they used this knowledge when planning their allotments and other activities such as beekeeping. Despite this, all those who possess this knowledge stated that CV no longer allows them to anticipate as effectively as before.
The adaptation practices identified are mostly implemented in an individual fashion (57%) and to a lesser extent as collective actions (43%), that is, they are implemented on several farms simultaneously and in a coordinated manner. The former practices are usually based on the knowledge acquired in an empirical and vernacular way, while the latter practices are usually acquired through the extension of academic projects and public agencies such as INDAP and the municipal Rural Development Units. However, in both cases, the process begins with the identification of a climatic stressor (for example, drought) already present in the territory, the effects of which are well known to those affected. Subsequently, different methods are tested to face the damage, either with practices that seek to mitigate it, such as the incorporation of rainwater harvests and other methods of accumulating water, or replacing those that are no longer effective, with new ones, such as the change in the irrigation system from a hose to a more efficient and technological one. Finally, those practices that proved to be more effective and relevant to the family reality (in terms of the need for economic and human resources) are maintained over time, while they continue to be tested and improved based on experience. In this case study, the most representative adaptation practices can be grouped into two main types: (i) practices aimed at regeneration of the vegetational cover, and (ii) practices for efficient water use. These interventions are similar in their technical simplicity and the low cost of implementation they require.
  • Practices aimed at regeneration of the vegetational cover
In this group, five practices stand out, namely. The first is the conservation of riparian and creek vegetation. This is carried out with evergreen tree and shrub species, selected by farmers for their ability to attract or accumulate water, to reduce the evaporation of surface water. Many times, in combination with the above, the second stand-out practice, hillside reforestation, is carried out with native plant species.
The third stand-out practice, which is used in spaces for the rearing of small, domestic animals, is the maintenance of permanent deep-rooted meadows which increases the porosity of the soil and thus its potential for water infiltration. The fourth stand-out practice, is the generation of shade in order to reduce the temperature and evaporation of natural water sources. That is, the production of dark and cold environments with native plant species and other means such as fenced to prevent the access of animals that destroy the sources of shade. The fifth and final stand-out practice is species conservation, which helps to protect natural sources of water, avoiding the extraction of native tree and shrub species, considered by farmers with potential to attract or maintain water, in key areas (for example in slopes), such as coihues (Nothofagus dombeyi), canelos (Drimys winteri), pitras (Myrceugenia exsucca), lumas (Amomyrtus luma), nalcas (Gunnera tinctoria), chilcos (Fuchsia magellanica), and ferns.
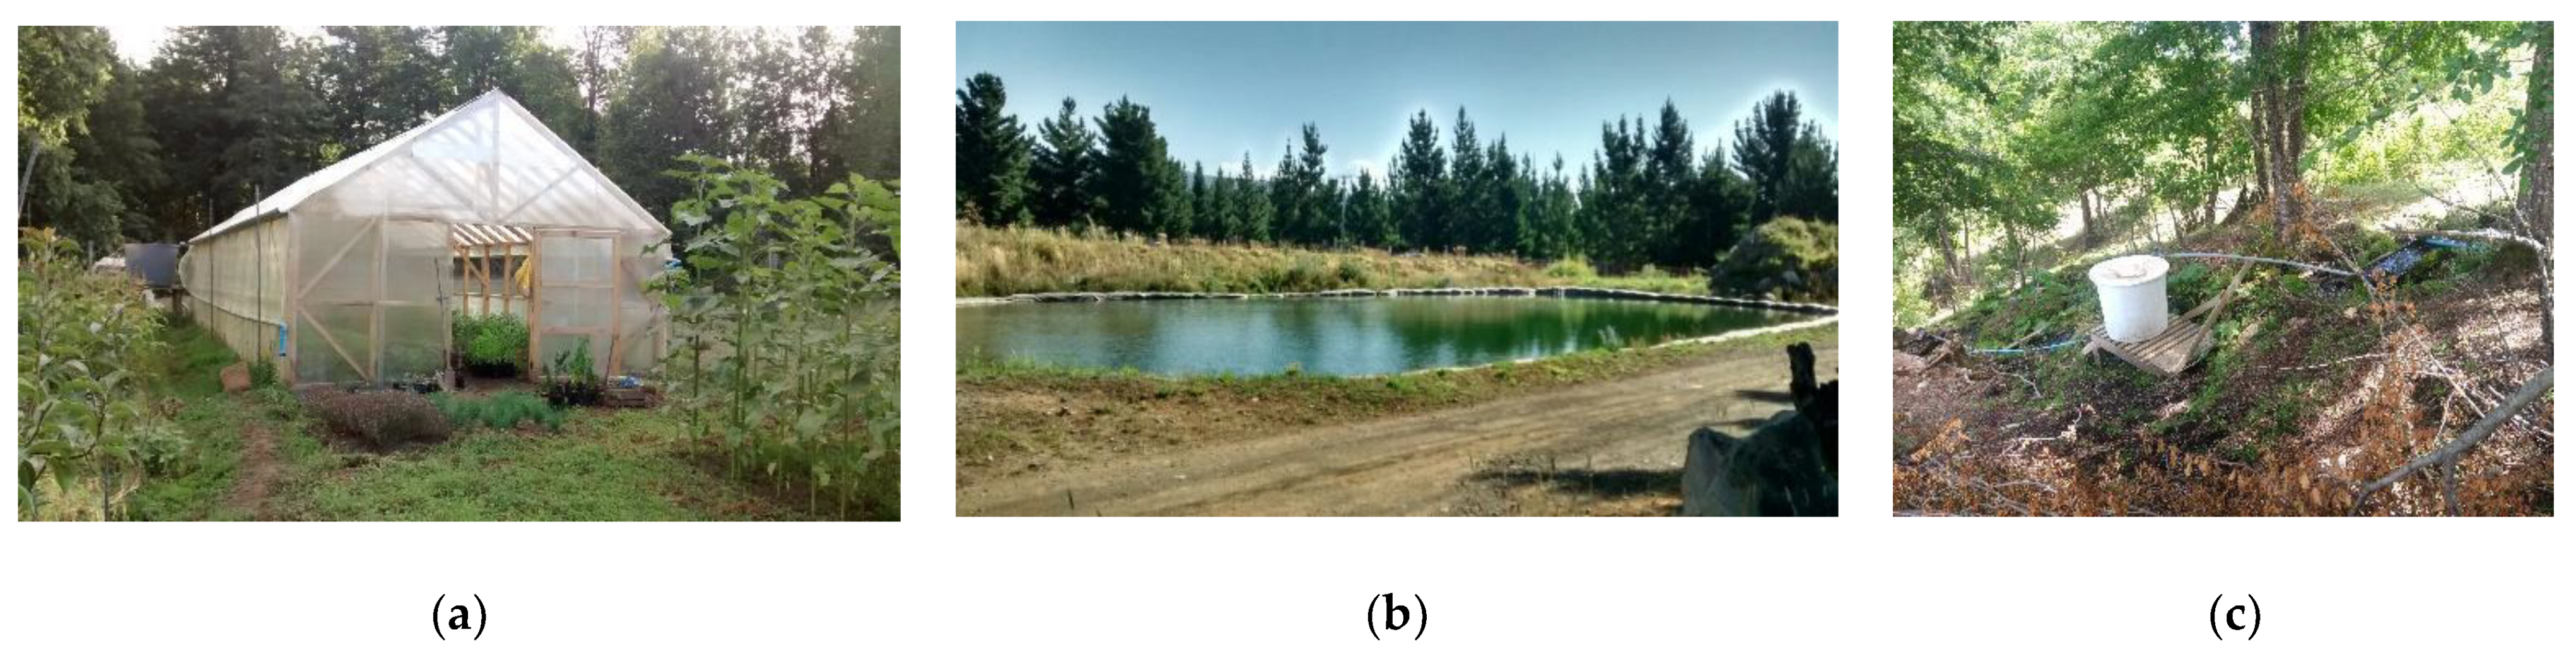
  • Practices for the efficient use of water
Four practices were observed in this group. The first is the generation of transport structures and water storage in favor of the slope. This is part of the local ecological knowledge and it constitutes a way of adapting to living in mountainous territories, where water is difficult to access and is often far from home. The practice involves locating structures that take advantage of the slopes in such a way that the unevenness and other variables, such as variations in the thickness of the hoses, increase the water pressure, while leaving a minimal impact on the surrounding nature. Water accumulates in ponds to make it available in a prioritized way in times of scarcity.
The second practice, rainwater harvest, was observed in different formats (Figure 5). In Pucón, the installation of polycarbonate greenhouses with a system for collecting the water falling on the roofs stands out. This water is transported in gutters leading to a pond where they are stored to be used later in the irrigation in the same greenhouse. Additionally, some families leave buckets and/or ponds of different sizes exposed to the rain for them to fill with water and then use it for minor tasks (irrigation of ornamental plants, cleaning, etc.). In addition, some families take advantage of the rigid roofs of sheds, warehouses, or other structures to harvest rainwater through gutters that collect it and lead to a pond that stores it for later use. Another form of water harvesting corresponds to the third practice, which is the collection of water in a micro-reservoir, designed with a load capacity previously calculated for the conditions of the place. Lastly, the fourth practice, the adoption of technological irrigation systems, was observed. Families, either on the basis of their formal studies or INDAP’s outreach programs, have implemented drip and sprinkler irrigation systems, replacing or complementing hose irrigation and flood irrigation. These practices make water consumption more efficient, in addition to reducing the work time that irrigation requires for farmers.

4. Discussion

Climate variability is mostly expressed as changes in annual rainfall patterns [53], that negatively affect farmers. In Colombia, they say that the climate is more intense and irregular in the watershed than before. This is especially relevant given the close connection between water availability and agriculture [31]. The scientific literature [29] describes a higher frequency of extreme weather events in Colombia, such as extended rain events, abnormal storms, and drought regimes [54]. In the case of Chile, on the other hand, CV translated into drought, and displacement of rainfall towards the end of winter [23]. This results in increased uncertainty on key processes and activities related to agriculture, such as sowing time. In the case of Colombia, the extended rain events result in the proliferation of pests and infestation of insects, reducing yields and altering the production cycles. This reduces productivity in crops such as coffee and increases the dependence on external products, increasing production costs and reducing food safety for the families [55]. In the case of Chile, the reduction in precipitation [22], added to topographic (slopes) and soil (high drainage soils) [56] characteristics, increases the need for improved management of the scarce water available, using rainwater collection techniques, and improved irrigation systems.
Climate projections show that future scenarios will maintain climate variability. This could translate into an increase of an average of 80 mm of rain by 2050 in Popayán, and an average of 65 mm of rain reduction in Curarrehue and Pucón. Temperature trends are also increasing, making it important to understand these projections in order to produce adequate adaptation mechanisms that allow the early mitigation of or reduction in the effects of climate change, as pointed out by Singh et al. [26]. These changes will turn to be the new conditions for these highly sensitive mountain regions, Kohler and Romeo [2]. Climate adaptation will allow the maintenance of agricultural practices for the subsistence of these Andean communities [7,9]. In addition to this is the lack of consideration of CV as a current issue by the farmers, as they still use conventional agricultural calendars and expect the rainy and dry seasons to behave “normally”, in other words, as they historically have. They still wait for the rain to start the sowing season and the dry season for harvesting [29]. This has a direct impact on the families’ capacity for adapting to this new scenario.
The effects of CV are evident with the increase in extreme weather events in terms of both frequency and intensity, especially in rural areas where the population is more vulnerable to climatic and socioeconomic instability [12,40]. Some examples include changes in precipitation levels, increase in temperature, variation in the zero degree isotherm, glacier loss, desertification, biodiversity loss, and erosion and reduction in soil productivity. Moreover, it is well known that the effects of climate change are more acute on the mountains [57], which suffer higher temperature changes than the valleys [58].
Farmer communities analyzed on each case present similar characteristics in terms of demographic and socioeconomic aspects. In Chile, there is a greater presence of single-person households for the elderly, typically female, a medium educational level, and a predominance of mixed production activities. In both cases, we found that populations were aging with low representation of children (0–14 years old, 17.4% in Colombia and 14% in Chile). This observation agrees with the pattern of rural to urban migration also seen in other areas of the World ([59,60]). Additionally, in the Chilean case, this makes harder to adopt adaptive practices, making older people more vulnerable [61,62]. Population aging disproportionally affect lonely women that face harder challenges implementing water harvest structures.
There are important differences in participation in organizations, where the Chilean case presents a higher participation rate of farmers in these instances, which may respond to the existing rural outreach model in Chile that promotes the participation and transformation of family farmers into entrepreneurs [63]. From the productive point of view, access to land is also similar; farms of up to 5 hectares predominate in both cases, with the development of activities such as subsistence agriculture, focused on horticultural production and the possession of small domestic animals. However, these activities are not the main source of family income, so they need tertiary activities to complement their income. Diversified income reduces the dependence of these family units on single economic activities that may make them more vulnerable.
We found differences on the implementation and types of CV adaptation strategies for each case. In Chile, the main issue was water management implementing specific actions that aim to improve water collection, and irrigation enhancement. In Colombia, adaptation is seen as a comprehensive process that includes the development of technologies, training and education about the different dimensions of CV. In this sense, the case of the TeSacCauca project in Colombia is a good example of a planned strategy that addresses the problem in a comprehensive way, that is, considering technical, organizational, and cultural aspects of the farmers and their communities, as proposed by the IPCC [11]. The participation and empowerment of the local population in all stages of the process of elaboration and implementation of the practices, is considered by Paz and Ortega [29] as key to their success. The strategy stands out for its non-interventionist nature, since it is the community members themselves who identify and execute the objectives and methodologies of the actions. This means that people are trained who can replicate the methodologies used, in addition to allowing for a more efficient management of resources and time. The strategy is developed under theoretical guidelines that seek to combine food security with climate change, such as the hypotheses of climate-smart agriculture [50].
In the Chilean case, the use of a series of practices with adaptive capacity was identified, mainly to water scarcity. However, these practices are not planned from a central agency. These are individually executed at the farm level without the clear objective of adapting to CV, and they do not respond to the development of a previously designed strategy at the local level. This means that its continuity over time cannot be ensured, nor does it allow for the development of a follow-up and evaluation of the effectiveness of the measures. This is consistent with the results indicated by Fuentes and Marchant [64], who argue that family farming in Curarrehue is in an initial adaptation phase, characterized by the promotion of rainwater harvesting techniques through state resources and outreach agents. However, in this case, the capacity of the farmers to understand and identify the main threats to agricultural activity and the operation of the farm stands out, as based on empirical observation and local knowledge.
These practices, although they lack articulation and cannot be considered an organized strategy, as in the Colombian case, show an interest in generating adaptation mechanisms to CV, based mainly on local and traditional ecological knowledge. This has been identified as a key factor in increasing resilience to climate variability [65] and to a lesser extent by scientific knowledge supported by rural outreach programs. There are important weaknesses in these practices, such as the failure to consider projections of future climate change scenarios, which limits the scope, planning and performance evaluation of adaptive practices. Likewise, the inorganic way in which these practices are being implemented makes it difficult to validate and replicate successful experiences in neighboring farms or with similar problems in the surrounding territory. This supports the point made by Cutter et al. [66], who say that the success of an adaptation strategy depends on the level of knowledge about CV and the organization capacities of the communities.

5. Conclusions

This paper shows that CV is present along the Colombian and Chilean Andes, and farming communities are affected, especially subsistence agriculture. This is crucial considering that climatic projections indicate that these conditions will remain for the long term. In this sense, CV should not be seen only as a biophysical phenomenon, but as a complex issue with social, economic, cultural, and technological dimensions. Therefore, adaptation should be seen as an integral process involving knowledge, communities, and the articulation of technical skills to develop strategic infrastructure. This translates into development of low-cost, easy-to-implement water harvest technologies in the Chilean case. In the Colombian case, this would address the reduction in soil fertility and the reduction in dependence on external supplies via bio-factories. These are key adaptation practices in order to reduce the vulnerability of local communities to climate change.
The experiences presented in this text show that the development of adaptation practices and strategies at a local scale with a community focus—with diagnoses limited to the reality of the community, and interventions applied in a participatory and pedagogical way, where the method of “learning by doing” is also preferred—are an adequate adaptive capacity development approach, as is the case of the TeSac-Cauca project in Colombia. It is also important to consider other aspects, such as the organizational capacity and the characteristics, practices, and local knowledge of the farmers. These factors added together form better and more efficient systems for providing climate information that can provide all the necessary components for developing more comprehensive plans, which can combine technical and local knowledge. Having a validated methodology to build local adaptation plans, such as the Manual of Farm-level Adaptation Plans, allows the local adaptation processes to be scaled up and multiplied to other rural communities in Latin America.
Finally, understanding the financial returns and other benefits from the implemented adaptation practices and interventions is essential for opening up new research perspectives on the adaptation to CV. It is also necessary to move towards strategies that allow the inclusion of other actors (NGOs, academia, etc.). They may collaborate to trigger adaptation processes with a community focus since it is the only way to face the current climate emergency scenario which seems relentless.

Author Contributions

Conceptualization, C.M.S., P.R.D. and L.O.F.; methodology, L.M.-S., L.O.F. and L.P.B.; formal analysis, L.M.-S. and P.R.D.; investigation, C.M.S., P.R.D. and L.O.F.; writing—original draft preparation, C.M.S. and P.R.D.; writing—review and editing, C.M.S., P.R.D. and L.O.F.; visualization, P.R.D. and L.M.-S. All authors have read and agreed to the published version of the manuscript.

Funding

This work was partly supported by the Vice-rectory for Research, Development and Artistic Creation Austral University of Chile [grant number S-2020-04].

Institutional Review Board Statement

Not applicable.

Informed Consent Statement

Informed consent was obtained from all subjects involved in the study.

Data Availability Statement

The data that support the findings of this study are available upon request from the authors.

Conflicts of Interest

The authors declare no conflict of interest.

Appendix A. Thematic Table for Interviews

Socioeconomic ProfileAssociativity and Networks
Characteristics of the family group
How is the family group composed? N° members, gender, ages, educational level.
Who works on the property? Who works outside?
Networking
Who do you ask for help when you need it?
Do you belong to a peasant or production association? which?
Support from public organisms
Have you received any kind of help to improve your production or sales? for example: subsidies, training, loans, spaces to market your products
Characteristics of the production systemAdaptation practices
Farm area
What is the size of your farm?
Variety of production
How many different products do you produce per season? Which?
Income
How is the family income (stable, sporadic)?
Where do they come from (land, pension, jobs outside the home, etc.)?
What do you produce on your property? For example: vegetable garden, farm, greenhouses, animals, dairy products, honey, wool, preserves, fabrics, looms, handicrafts, etc.
Is production for sale, domestic consumption, or both?
Do you offer any paid services to other people? For example: babysitting, cooking, horseback riding, tourist services, etc.
Technologies
What technological devices or tools or infrastructures do you have to facilitate work on your farm?
Do you have a greenhouse?
Do you have a solar panel?
Water management practices
Where do you get your water for domestic use? Where do you get your water for productive use?
How do you manage the water? How do you water?
Do you collect rainwater?
Have you made changes to your water management practices?
Practices
What do you do when the weather changes? What actions do you take?
Have you had to change your agricultural or water management practices?
What changes have you made in the last 10 years?

Appendix B. Socioeconomic and Productive Characterization

DimensionIndicatorCategoriesColombiaChile
DemographicAge rangeChildren (0–14 años)17.4%14%
Youth (15–29 años)22.9%28%
Adults (30–59 años)41.8%40.2%
Elderly (60 y más)17.9%17.8%
Percentage of population by genderFemale52.5%50.5%
Male47.5%49.5%
SocioeconomicNumber of household members16.4%13.3%
2 to 467.9%66.7%
5 to 924.9%20%
10 or more0.8%0%
Education leerInformal education1.4%0%
Primary school37.9%3.3%
High school47.9%50%
Technical/University studies12.9%46.7%
Livelihoods on the farmSubsistence43.6%26.7%
Crop production for commercialization: (Colombia coffee, caña; Chile: wheat, others)=)0%0%
Mixed activities:56.4%73.3%
Diversification of sources of income and types: (salary, subsidies, rents)012.1%3.3%
1 source35.7%20%
2 sources36.4%23.3%
3 sources11.4%46.7%
4 or more sources4.3%6.7%
Participation in organizations rural drinking water committee, agricultural association, peasant associations)Does not belong to any group71.4%0%
1 group23.6%20%
2 groups2.9%46.7%
3 or more groups2.1%33.3%
ProductiveAccess to land>1 ha26.4%26.7%
Between 1 to 5 ha61.4%43.3%
More than 5 ha12.1%30%
Main activity on the farmMainly agriculture40%46.2%
Livestock and crop production33%34.6%
Other activities27%19.2%
Ways to obtain and use water on the property (by total number of cases)Irrigation (Colombia)/Rural drinking water (Chile)2.9%20.4%
Tanks or infrastructures for rainwater harvesting27.0%5.6%
Water Ponds17.2%46.3%
Wells0.6%5.6%
Solar powered water pumps2.3%31.9%
Water pumps with wind power source0.6%0%
Other type of pumps6.9%9.3%
None of the above42.5%11.1%
Change on water practices management in the last 10 yearsNo changes81.4%30%
1 change12.1%46.7%
2 or more6.4%23.3%

References

  1. FAO. El legado del AIAF 2014 y el camino a seguir. In Acto de Clausura Año Internacional de la Agricultura Familiar 2014; FAO: Rome, Italy, 2014. [Google Scholar]
  2. Kohler, T.; Romeo, R. La agricultura de montaña es agricultura familiar. In La Agricultura de Montaña es Agricultura Familiar: Una Contribución de las Zonas de Montaña al Año Internacional de la Agricultura Familiar 2014; Wymann von Dach, S., Romeo, R., Vita, A., Wurzinger, M., Kohler, T., Eds.; FAO, CDE, BOKU: Rome, Italy, 2014; pp. 10–11. [Google Scholar]
  3. IPCC. Climate Change 2007: Impacts, Adaptation and Vulnerability; Contribution of Working Group II to the Fourth Assessment Report of the IPCC; Cambridge University Press: Cambridge, UK, 2007. [Google Scholar]
  4. Pereira Lindoso, D.; Dalboni Rocha, J.; Debortoli, N.; Cavalcanti, I.; Eiró, F.; Bursztyn, M.; Rodrigues Filho, S. Indicators for Assessing the Vulnerability of Smallholder Farming to Climate Change: The Case of Brazil’ s Semi-Arid Northeastern Region; IPEA: Brazilia, Brazil, 2012; p. 1.
  5. Eitzinger, J. Der Klimawandel–seine Auswirkungen auf agrarmeteorologische Aspekte und Anpassungsoptionen für die Landwirtschaft im europäischen Kontext. Ländlicher Raum 2010, 3, 1–11. [Google Scholar]
  6. Campos, M.; Herrador, D.; Valdés, C.M.; McCall, M.K. Estrategias de adaptación al cambio climático en dos comunidades rurales de México y El Salvador. Boletín Asoc. Geógrafos Españoles 2013, 61, 329–352. [Google Scholar]
  7. Maletta, H. Tendencias y Perspectivas de la Agricultura Familiar en América Latina. In Documento de Trabajo N° 1. Proyecto Conocimiento y Cambio en Pobreza Rural y Desarrollo; Rimisp: Santiago, Chile, 2011; Available online: http://bit.ly/1g63Fcg (accessed on 30 October 2021).
  8. Vermeulen, S.; Campbell, B.; Ingram, J. Climate Change and Food Systems. Annu. Rev. Environ. Resour. 2012, 37, 195–222. [Google Scholar] [CrossRef] [Green Version]
  9. Antón, J.; Kimura, S.; Lankiski, J.; Cattaneo, A. A Comparative Study of Risk Management in Agriculture under Climate Change. In OECD Food, Agriculture and Fisheries Papers; 2012; Available online: https://0-www-oecd--ilibrary-org.brum.beds.ac.uk/content/paper/5k94d6fx5bd8-en (accessed on 30 October 2021). [CrossRef]
  10. Córdova, R.; Hogarth, N.J.; Kanninen, M. Sustainability of smallholder livelihoods in the ecuadorian highlands: A comparison of agroforestry and conventional agriculture systems in the indigenous territory of Kayambi People. Land 2018, 7, 45. [Google Scholar] [CrossRef] [Green Version]
  11. IPCC. Anexo II: Glosario. In Cambio Climático 2014: Informe de Síntesis; Contribución de los Grupos de trabajo I, II y III al Quinto Informe de Evaluación del Grupo Intergubernamental de Expertos sobre el Cambio Climático; IPCC: Ginebra, Suiza, 2014; pp. 127–141. [Google Scholar]
  12. Montaña, E. Escenarios de Cambio Ambiental Global, Escenarios de Pobreza Rural; CLACSO: Buenos Aires, Argentina, 2013. [Google Scholar]
  13. CONDESAN. 20 Years of Sustainable Mountain Development in the Andes—From Rio 1992 to 2012 and Beyond; CONDESAN: Lima, Perú, 2011. [Google Scholar]
  14. Seaman, J.A.; Sawdon, G.E.; Acidri, J.; Petty, C. The Household Economy Approach. Managing the impact of climate change on poverty and food security in developing countries. Clim. Risk Manag. 2014, 4, 59–68. [Google Scholar] [CrossRef] [Green Version]
  15. Acevedo-Osorio, Á.; Leiton, A.A.; Durán, M.V.L.; Quiroga, K.L.F. Sustentabilidad y variabilidad climática: Acciones agroecológicas participativas de adaptación y resiliencia socioecológica en la región Alto-Andina colombiana. Rev. Luna Azul 2017, 44, 6–26. [Google Scholar] [CrossRef] [Green Version]
  16. Martínez Barón, D. Análisis del Cambio Institucional en la Zona Rural Noroccidental de Popayán en un Contexto de Variabilidad Climática. Master’s Thesis, Pontificia Universidad Javeriana, Facultad de Estudios Ambientales y Rurales, Bogotá, Colombia, 2016. [Google Scholar]
  17. CDKN. Análisis interinstitucional y multisectorial de vulnerabilidad y adaptación al cambio climático para el sector agrícola de la cuenca alta del río Cauca. Impactando políticas de adaptación. In Metodología de Análisis de Vulnerabilidad Para la Cuenca Alta del río Cauca; Reporte Técnico; CDKN: Cauca, Colombia, 2013. [Google Scholar]
  18. Lara, A.; Wolodarsky-Franke, A.; Aravena, A.; Villalba, R.; Solari, M.; Pezoa, L.; Rivera, A.; Le Quesne, C. Climate Fluctuations Derived from Tree-rings and Other Proxy-records in the Chilean Andes: State of the Art and Future Prospects. Glob. Chang. Mt. Reg. 2005, 23, 145–156. [Google Scholar]
  19. Díaz, D.; Morales, L.; Castellaro, G.; Neira, F. Topoclimatic Modeling of Thermopluviometric Variables for the Bío Bío and La Araucanía regions, Chile. Chil. J. Agric. Res. 2010, 70, 604–615. [Google Scholar] [CrossRef]
  20. Christie, D.; Boninsegna, J.; Cleaveland, M.; Lara, A.; Le Quesne, C.; Morales, M.; Mudelsee, M.; Stahle, D.; Villalba, R. Aridity changes in the Temperate-Mediterranean transition of the Andes since AD 1346 reconstructed from tree-rings. Clim. Dyn. 2011, 36, 1505–1521. [Google Scholar] [CrossRef]
  21. González-Reyes, A.; Muñoz, A. Cambios en la precipitación de la ciudad de Valdivia (Chile) durante los últimos 150 años. Bosque 2013, 34, 191–200. [Google Scholar] [CrossRef] [Green Version]
  22. Garreaud, R.D.; Álvarez-Garretón, C.; Barichivich, J.; Boisier, J.P.; Christie, D.; Galleguillos, M.; Le Quesne, C.; McPhee, J.; Zambrano-Bigiarini, M. The 2010-2015 megadrought in central Chile: Impacts on regional hydroclimate and vegetation. Hydrol. Earth Syst. Sci. 2017, 21, 6307–6327. [Google Scholar] [CrossRef] [Green Version]
  23. Alvarez-Garretón, C.; Boisier, J.P.; Garreaud, R.; Seibert, J.; Vis, M. Progressive water deficits during multiyear droughts in basins with long hydrological memory in Chile. Hydrol. Earth Syst. Sci. 2021, 25, 429–446. [Google Scholar] [CrossRef]
  24. FAO. Food Security and Agricultural Mitigation in Developing Countries: Options for Capturing Synergies; FAO: Rome, Italy, 2009. [Google Scholar]
  25. Philip, A.; Kaunza-Nu-Dem, M.K.; Ayembilla, J.A. Smallholder farmers’livelihood adaptation to climate variability andecological changes in thesavanna agroecological zone of Ghana. Heliyon 2019, 5, e01492. [Google Scholar] [CrossRef] [Green Version]
  26. Singh, R.K.; Singh, A.; Kumar, S.; Sheoran, P.; Sharma, D.K.; Stringer, L.C.; Quinn, C.H.; Kumar, A.; Singh, D. Perceived Climate Variability and Compounding Stressors: Implications for Risks to Livelihoods of Smallholder Indian Farmers. Environ. Manag. 2020, 66, 826–844. [Google Scholar] [CrossRef]
  27. Abid, M.; Scheffran, J.; Schneider, U.A.; Elahi, E. Farmer Perceptions of Climate Change, Observed Trends and Adaptation of Agriculture in Pakistan. Environ. Manag. 2019, 63, 110–123. [Google Scholar] [CrossRef]
  28. Herrador-Valencia, D.; Paredes, M. Cambio climático y agricultura de pequeña escala en los Andes ecuatorianos: Un estudio sobre percepciones locales y estrategias de adaptación. J. Lat. Am. Geogr. 2016, 15, 101–121. [Google Scholar] [CrossRef]
  29. Paz, L.A.; Ortega, L.P. Estudio de Línea Base de Comunidades: Informe de Análisis del sitio Para Cauca–Los Cerrillos, Colombia; CGIAR Research Program on Climate Change, Agriculture and Food Security (CCAFS): Copenhagen, Denmark, 2014. [Google Scholar]
  30. Marchant, C.; Fuentes Acuña, N.; Kaulen Luks, S.; Ibarra, J.T. Saberes locales en huertas de montaña del sur de los Andes: Un refugio de memoria biocultural mapuche pewenche. Pirineos 2020, 175, e060. [Google Scholar] [CrossRef]
  31. Cai, X.M.; Wang, D.B.; Laurent, R. Impact of climate change on crop yield: A case study of rainfed corn in central Illinois. J. Appl. Meteorol. Clim. 2009, 48, 1868–1881. [Google Scholar] [CrossRef]
  32. Kendall, M.G.; Stuart, A. The Advanced Theory of Statistics: Design and Analysis, and Time-Series; Charles Griffin & Company Limited: London, UK, 1968. [Google Scholar]
  33. Sen, P.K. Estimates of the Regression Coefficient Based on Kendall’s Tau. J. Am. Stat. Assoc. 1968, 63, 1379–1389. [Google Scholar] [CrossRef]
  34. Sneyers, R. On the Statistical Analysis of Series of Observations; World Meteorological Organization: Geneva, Italy, 1990. [Google Scholar]
  35. Rodrigo, F.S.; Trigo, R.M. Trends in daily rainfall in the Iberian Peninsula from 1951 to 2002. Int. J. Climatol. 2007, 27, 513–529. [Google Scholar] [CrossRef]
  36. Wambua, R.M.; Mutua, B.M.; Raude, J.M. Detection of Spatial, Temporal and Trend of Meteorological Drought Using Standardized Precipitation Index (SPI) and Effective Drought Index (EDI) in the Upper Tana River Basin, Kenya. Earth Environ. Sci. 2018, 3, 83–100. [Google Scholar] [CrossRef] [Green Version]
  37. Hunziker, S.; Brönnimann, S.; Calle, J.M.; Moreno, I.; Andrade, M.; Ticona, L.; Huerta, A.; Lavado-Casimiro, W. Effects of undetected data quality issues on climatological analyses. Clim. Past Discuss. 2017, 1–31. [Google Scholar] [CrossRef] [Green Version]
  38. R Core Team. A Language and Environment for Statistical Computing; R Foundation for Statistical Computing: Vienna, Austria, 2018. [Google Scholar]
  39. Pohlert, T. Trend: Non-Parametric Trend Tests and Change-Point Direction; R Package Version 1.1.0; 2018; Available online: https://cran.r-project.org/ (accessed on 30 October 2021).
  40. IPCC. Climate Change 2013: The Physical Science Basis; Working Group I Contribution to the Fifth Assessment Report of the Intergovernmental Panel on Climate Change; Cambridge University Press: Cambridge, UK; New York, NY, USA, 2013. [Google Scholar]
  41. IPCC. Climate Change 2021: The Physical Science Basis; Contribution of Working Group I to the Sixth Assessment Report of the Intergovernmental Panel on Climate Change; Masson-Delmotte, V., Zhai, P., Pirani, A., Connors, S.L., Péan, C., Berger, S., Caud, N., Chen, Y., Goldfarb, L., Gomis, M.I., Eds.; Cambridge University Press: Cambridge, UK, 2021; in press. [Google Scholar]
  42. Taylor, K.E.; Stouffer, R.J.; Meehl, G.A. An Overview of CMIP5 and the Experiment Design. Bull. Am. Meteorol. Soc. 2012, 93, 485–498. [Google Scholar] [CrossRef] [Green Version]
  43. Moss, R.H.; Edmonds, J.A.; Hibbard, K.A.; Manning, M.R.; Rose, S.K.; Van Vuuren, D.P.; Meehl, G.A. The next generation of scenarios for climate change research and assessment. Nature 2010, 463, 747–756. [Google Scholar] [CrossRef] [PubMed]
  44. Torres, R.R.; Benassi, R.B.; Martins, F.B.; Lapola, D.M. Projected impacts of 1.5 and 2 °C global warming on temperature and precipitation patterns in South America. Int. J. Climatol. 2021, 1–15. [Google Scholar] [CrossRef]
  45. Navarro-Racines, C.; Tarapues, J.; Thornton, P.; Jarvis, A.; Ramírez-Villegas, J. High-resolution and bias-corrected CMIP5 projections for climate change impact assessments. Sci. Data 2020, 7, 7. [Google Scholar] [CrossRef] [PubMed] [Green Version]
  46. Hijmans, R.J.; Cameron, S.E.; Parra, J.L.; Jones, P.G.; Jarvis, A. Very high resolution interpolated climate surfaces for global land areas. Int. J. Climatol. 2005, 25, 1965–1978. [Google Scholar] [CrossRef]
  47. Fick, S.E.; Hijmans, R.J. WorldClim 2: New 1km spatial resolution climate surfaces for global land areas. Int. J. Climatol. 2017, 37, 4302–4315. [Google Scholar] [CrossRef]
  48. Parker, C.; Scott, S.; Geddes, A. Snowball Sampling; SAGE Research Methods Foundations: London, UK, 2019. [Google Scholar]
  49. Gibson, C.B. Elaboration, generalization, triangulation, and interpretation: On enhancing the value of mixed method research. Organ. Res. Methods 2017, 20, 193–223. [Google Scholar] [CrossRef] [Green Version]
  50. FAO. Climate Smart Agriculture: Policies, Practices and Financing for Food Security, Adaptation and Mitigation; FAO: Rome, Italy, 2010. [Google Scholar]
  51. Lipper, L.; McCarthy, N.; Zilberman, D.; Asfaw, S.; Branca, G. (Eds.) Climate Smart Agriculture. Building Resilience to Climate Change; Springer Nature: Cham, Switzerland, 2018. [Google Scholar]
  52. Budds, J. El acceso a los recursos de agua de los agricultores en el valle de La Ligua, Chile. Rev. Derecho Adm. Económico 2003, 2, 371–379. [Google Scholar]
  53. Puertas, O.; Carvajal, Y.; Quintero, M. Estudio de tendencias de la precipitación mensual en la cuenca alta-media del río Cauca, Colombia. DYNA 2011, 78, 112–120. Available online: http://www.scielo.org.co/scielo.php?script=sci_arttext&pid=S0012-73532011000500013&lng=en&tlng=es (accessed on 16 October 2021).
  54. Devereux, T.; Acosta, M. Manual de las Medidas de Adaptación al Cambio Climático Practicadas por los Campesinos de Asocampo de la Cuenca Río Las Piedras, Cauca, Colombia; Centro Internacional de Agricultura Tropical (CIAT): Popayán, Colombia, 2013. [Google Scholar]
  55. Agrawal, A.; Perrin, N. Climate adaptation, local institutions and rural livelihoods. In Adaptation to Climate Change: Thresholds, Values, Governance; Adger, N., Lorenzoni, I., O’Brien, K., Eds.; Cambridge University Press: New York, NY, USA, 2009; pp. 350–367. [Google Scholar]
  56. Montalba, R.; Fonseca, F.; García, M.; Vieli, L.; Altieri, M. Determinación de los niveles de riesgo socioecológico ante sequías en sistemas agrícolas campesinos de La Araucanía chilena: Influencia de la diversidad cultural y la agrobiodiversidad. Pap. Rev. Sociol. 2015, 100, 607–624. [Google Scholar] [CrossRef] [Green Version]
  57. Herzog, S.K.; Martínez, R.; Jørgensen, P.; Tiessen, H. Climate Change and Biodiversity in the Tropical Andes; Inter-American Institute for Global Change Research (IAI) and Scientific Committee on Problems of the Environment (SCOPE): Montevideo, Uruguay, 2011. [Google Scholar]
  58. Carrasco, J.; Cassas, G.; Pizarro, R.; Saravia, M. Impactos del Cambio Climático, Adaptación y Desarrollo en las Regiones Montañosas de América Latina; FAO: Santiago, Chile, 2011. [Google Scholar]
  59. Li, Y.; Westlund, H.; Liu, Y. Why some rural areas decline while some others not: An overview of rural evolution in the world. J. Rural Stud. 2019, 68, 135–143. [Google Scholar] [CrossRef]
  60. Xiao, W.; Zhao, G. Agricultural land and rural-urban migration in China: A new pattern. Land Use Policy 2018, 74, 142–150. [Google Scholar] [CrossRef]
  61. Johnson, K.M.; Lichter, D.T. Rural Depopulation: Growth and Decline Processes over the Past Century. Rural Sociol. 2019, 84, 3–27. [Google Scholar] [CrossRef] [Green Version]
  62. Rodríguez-Soler, R.; Uribe-Toril, J.; De Pablo Valenciano, J. Worldwide trends in the scientific production on rural depopula-tion, a bibliometric analysis using bibliometrix R-tool. Land Use Policy 2020, 97, 104787. [Google Scholar] [CrossRef]
  63. Landini, A. Concepción de extensión rural en 10 países latinoamericanos. Andamios 2016, 13, 211–236. [Google Scholar] [CrossRef] [Green Version]
  64. Fuentes, N.; Marchant, C. ¿Contribuyen las prácticas agroecológicas a la sustentabilidad de la agricultura familiar de montaña? El caso de Curarrehue, región de la Araucanía, Chile. Cuad. Desarro. Rural 2016, 13, 35–66. [Google Scholar] [CrossRef]
  65. Hatfield, S.C.; Marino, E.; Whyte, K.P.; Dello, K.D.; Mote, P.W. Indian time: Time, seasonality, and culture in Traditional Ecological Knowledge of climate change. Ecol. Process. 2018, 7, 25. [Google Scholar] [CrossRef]
  66. Cutter, S.L.; Boruff, B.J.; Shirley, W.L. Social vulnerability to environmental hazards. Soc. Sci. Q. 2003, 84, 242–261. [Google Scholar] [CrossRef]
Figure 1. Study area in Chile and Colombia. Source: Authors.
Agriculture 11 01096 g001
Figure 2. Box-plot for monthly mean precipitation (a,c,e), and total annual (b,d,f) for the period 2003–2014 for the towns of Popayán, Colombia, and the period 2000–2020 for Curarrehue and Pucón, Chile.
Agriculture 11 01096 g002
Figure 3. Meeting of farmers of the project farms. Source: authors.
Agriculture 11 01096 g003
Figure 4. Various practices identified: meteorological station (a), ram pump to obtain water (b), and irrigation systems (c). Source: authors.
Agriculture 11 01096 g004
Figure 5. Various forms of rainwater harvesting: in a greenhouse (a), rainwater harvesting in a micro-reservoir (b), and the use of slopes and shadows (c). Source: authors.
Agriculture 11 01096 g005
Table 1. Description of parameters used to describe family farmer communities (modified from Paz and Ortega [25]).
DimensionIndicatorDescription
SocioeconomicsNumber of household membersCharacterizes the existing workforce potential in each farm/property
Education levelDescribes the highest level of formal education obtained by family members
Livelihoods on the farmCorresponds to the forms of obtaining income that the family generates
Diversification of sources of income and typesReflects the family’s ability to generate multiple incomes
Participation in organizationsEvaluates the number of organizations in which the family participates
ProductiveAccess to landDetermines the area in hectares available per farm/property
Main activity on the farmDescribes the main productive activity of each farm/property: agriculture, livestock, other
Ways to obtain and use water on the property (by total number of cases)Identifies the number of sources/wells for obtaining water on the property
Water management practicesIdentifies the number of practices implemented on the farm
Table 2. Descriptive statistics of trends in annual precipitation (mm) between 2000 and 2020.
NameAverageVarianceCV (%)Kendall’s TauS-Statisticsp ValueSignificanceSen’s SlopeTrends
Curarrehue2611.2198,84917.1−0.324−680.043*−38.438-
Pucón2164.7136,17217.0−0.362−760.024*−29.365-
Popayan2176.7180,68919.50.242160.304ns39.069+
* Significant cases with confidence level of 90%.
Table 3. Monthly mean precipitation values per decade and their trend for Popayan, Colombia, obtained from the application of the delta method to the coupled models (CMIP5) and for the average of the four routes of the Representative Concentration Pathways (RCP) found in the 2014 IPCC report.
DecadeJanFebMarAprMayJunJulAugSepOctNovDec
2020254.1364.4347.9312.2228.2249.2313.9336.4255.8220.6209.7254.5
2030256.9358.6344.1317.5239.7251.6316.5341.7262.1225.8213.4255.3
2040254.3361.6349.1314.0233.9250.7316.5340.2259.8229.6213.6251.4
2050260.5356.0342.6320.7241.8255.7320.4346.2268.7236.2218.1256.2
2060258.6362.5350.6323.0234.9253.2320.1344.2268.4239.8220.7253.4
2070264.5354.2343.9324.1242.1256.5321.7350.5277.0245.0223.7255.0
2080266.5352.7343.8325.7242.5256.8322.7354.4280.1250.0225.4253.1
Trend0.203−0.154−0.0400.2250.1740.1250.1440.2700.3980.4900.268−0.009
Table 4. Monthly mean precipitation values per decade and their trend for Curarrehue, Chile, obtained from the application of the delta method to the coupled models (CMIP5) and for the average of the four routes of the Representative Concentration Trajectories (RCP) found in the latest IPCC report.
DecadeJanFebMarAprMayJunJulAugSepOctNovDec
202021.749.644.738.827.654.488.7170.5203.8217.5159.489.5
203023.149.545.138.128.254.785.0169.8203.5217.1157.689.0
204019.745.542.136.225.452.883.8164.0201.0215.3159.184.5
205021.546.642.435.626.852.080.7163.9197.5212.7154.684.7
206017.640.838.432.923.449.577.7155.0192.0209.6152.079.3
207020.542.540.133.525.348.976.0157.0190.7208.4147.680.5
208020.441.539.232.824.848.274.7155.0187.9205.5145.779.2
Slope−0.04−0.15−0.11−0.11−0.06−0.12−0.24−0.29−0.29−0.21−0.24−0.19
Table 5. Monthly mean temperature values per decade and their trend for Popayan, Colombia, obtained from the application of the delta method to the coupled models (CMIP5) and for the average of the four routes of the Representative Concentration Trajectories (RCP) found in the 2014 IPCC report.
DecadeJanFebMarAprMayJunJulAugSepOctNovDec
202020.420.320.220.320.620.720.620.620.420.420.520.5
203020.720.720.520.620.921.121.021.020.820.820.920.9
204020.820.820.620.721.021.221.121.120.920.921.021.0
205021.321.221.121.221.521.621.521.521.421.421.521.4
206021.421.321.221.321.521.721.621.621.521.421.521.5
207021.721.621.521.621.922.022.021.921.821.821.921.8
208021.921.921.721.822.122.222.222.222.022.022.122.1
Trend0.0250.0260.0260.0250.0250.0240.0260.0260.0270.0270.0260.026
Table 6. Monthly mean temperature values per decade and their trend for Curarrehue, Chile, obtained from the application of the delta method to the coupled models (CMIP5) and for the average of the four routes of the Representative Concentration Trajectories (RCP) found in the 2014 IPCC report.
DecadeJanFebMarAprMayJunJulAugSepOctNovDec
202014.68.010.512.814.011.98.45.53.43.33.95.5
203014.88.210.713.114.212.18.65.63.63.54.15.6
204015.18.310.913.314.512.48.75.83.73.64.25.8
205015.48.711.213.614.812.79.16.03.93.84.56.0
206015.88.811.513.915.313.09.36.14.03.94.56.1
207015.99.011.614.115.413.29.56.34.24.14.86.3
208016.29.211.914.315.613.49.76.44.34.24.96.5
Trend0.0250.0260.0260.0250.0250.0240.0260.0260.0270.0270.0260.026
Publisher’s Note: MDPI stays neutral with regard to jurisdictional claims in published maps and institutional affiliations.

