
Factors Influencing Technical Efficiency in the EU Dairy Farms

1
Department of Economics of Food Industry and Agriculture, Institute of Agricultural Economics and Information, Mánesova 1453/75, 130 00 Prague, Czech Republic
2
Department of Agricultural Commodities, Institute of Agricultural Economics and Information, Mánesova 1453/75, 130 00 Prague, Czech Republic
*
Author to whom correspondence should be addressed.
Agriculture 2021, 11(11), 1114; https://0-doi-org.brum.beds.ac.uk/10.3390/agriculture11111114
Submission received: 18 October 2021
/
Revised: 5 November 2021
/
Accepted: 7 November 2021
/
Published: 9 November 2021
(This article belongs to the Special Issue Agricultural Food Marketing, Economics and Policies)
Abstract
:This paper aims to analyse the technical efficiency (TE) of dairy farms and find its determinants. To accomplish this problem, the Stochastic Frontier Analysis was applied. The data were obtained from the Farm Accountancy Data Network database for dairy farms (TF15-45—Specialist dairying) for 2004–2019. Dairy farms were divided into four clusters according to their physical size (number of livestock units per farm) and economic size (standard output per farm). The largest farms by physical and economic size are located in Denmark and Cyprus. The smallest, in comparison, are in Bulgaria, Croatia, Latvia, Lithuania, Austria, Poland, Romania, and Slovenia. Farms in the EU are relatively technically efficient, i.e., they use their resources efficiently to produce maximum output (production). However, they have the potential to achieve better economic results and be more competitive, as the size of farms’ is not fully optimised. The abolition of the milk quota can be considered a factor in improving technical efficiency, as the indicator is higher after the abolition. New and old member states have almost comparable technical efficiency levels (the p-value of the t-test is 0.463), with old members having slightly higher level TE. Subsidies have contradictory effects on TE. Farm efficiency with higher subsidies per cow is higher for farms with €51–100/cow. However, as subsidies increase, TE decreases. Only the group of farms with the highest subsidies has a higher TE. More diversified farms are more technically efficient than specialised farms. Milk yield did not influence the analysed indicator. The analysis results can serve the stakeholders as a tool for modelling future agricultural policy, as the European farms are very heterogenous and show different conditions and economic outcomes.
Keywords:
subsidies; farm size; milk; cluster analysis; stochastic frontier analysis; European Union1. Introduction
The dairy sector is associated with a particular degree of uncertainty. In livestock, diseases in animal husbandry, perishability of the product, product prices and feed prices play a role and influence productivity positively and negatively [1]. The dairy sector is affected by structural changes, including the geographical relocation of milk production or the introduction of an intensive production system. These changes may affect farm efficiency, farm profitability, or the sector’s sustainability in traditional milk-producing areas [2].
EU milk production is important in a global context. EU countries are the second-largest milk producers in the world (after India). The EU is also one of the largest milk exporters, together with New Zealand and the United States. In 2020, milk production in the EU increased. The largest importer is China. In the following years, EU production is expected to grow, but at a slower rate than the global average; the herd is expected to decrease but milk yields are expected to increase. The dairy sector has been relatively stable during the pandemic, but some structural changes may have long-term implications [3]. The role of competitiveness in the dairy market has become significant. The main EU milk production countries are Germany, France, the Netherlands, Poland, and Italy, that account for more than 66% of the total EU milk production in 2019 [4].
The evaluation of technical efficiency is a widely discussed topic in many scientific papers. There are two basic definitions of technical efficiency in the literature: (1) Koopmans [5] states that “a producer is technically efficient if the growth of any output requires a reduction in at least one other output or an increase in at least one input, and a reduction in any input requires an increase in at least one other input or a reduction in at least one output”. (2) Another definition is the formal analogy between Debreu‘s resource utilisation coefficient [6] and Farrell’s measure of technical efficiency [7], offered by Färe and Lovell as “Debreu–Farrell’s measure of efficiency” [8], according to which the coefficient of technical efficiency is “one minus a proportional reduction in all inputs, which nevertheless allows the same amount of output to be produced; a value of one indicates technical efficiency and a value below one corresponds to technical inefficiency.
In the literature dealing with the theory of efficiency measurement, two basic methods are described: DEA—data envelopment analysis and SFA—stochastic frontier analysis. DEA, introduced by Aigner et al. [9], is a non-parametric method that requires the use of mathematical programming, while SFA, introduced by Farell [7], is a parametric method that uses econometric modelling. Coelli et al. [10] compared the two approaches and found that the main advantages of SFA are the ability to take into account the so-called statistical noise and to perform hypothesis testing.
Some studies have evaluated the factors affecting the technical efficiency with respect to the abolition of quotas [11,12,13], to new and old EU member states [14,15], to regions [16,17,18], subsidies drawing [19,20], herd size [18,21,22], the ratio of the total number of dairy cows to the total number of cattle [23], and the economic size [24]. Technical efficiency in agriculture is influenced by many other factors such as technology, quality of factors, management and organisation on the farm, political and institutional conditions, farm economies of scale, etc. [25]. It is assumed that farms are heterogeneous in terms of conditions. Different conditions lead to a different performance of farms.
A very similar analysis of Czech dairy farms was presented by Žáková Kroupová [26]. They evaluated the productivity of Czech dairy production to the EU in comparison, using the SFA, using the same FADN data source (TF14-45 Specialist milk production). They evaluated 27 EU countries in the period 2004–2016. The average technical efficiency of the Czech Republic was 94.01% and was characterised by increasing returns to scale. The study also showed that efficiency in EU 13 countries was lower than in EU 15 countries. The efficiency of the EU 13 was also subject to greater fluctuations. This paper follows on from that study and provides a more detailed analysis.
The aim of this work is to estimate the production function and to calculate the technical efficiency of dairy farms, and to identify the determinants of technical efficiency, i.e., the drivers of competitiveness in the EU market. The following working hypotheses were formulated: The number of cows on the farm has a significant influence on technical efficiency (H1); the level of subsidies per LU has a significant influence on technical efficiency (H2); the level of milk yield has a significant influence on technical efficiency (H3); the specialization of the farm (share of dairy cows in total LU or share of milk production in total production) has a significant influence on technical efficiency (H4 and H5).
2. Materials and Methods
Data from the Eurostat database were used for the cluster analysis. The data concerned dairy farms with farm type TF14-45 (Specialist dairying) for the year 2016, the last available year in the database for data broken down by farm type [27].
Data for production function estimation were obtained from the Farm Accountancy Data Network (FADN) database [28]. FADN data for evaluating the technical efficiency of dairy farms have been used in many research papers [13,29,30,31]. FADN data represents EU milk production for 2014–2019 for each Member State at the NUTS 1 level (regional level). The unbalanced panel dataset for production function estimation contained 1646 dairy farm observations (farm type TF14-45; Specialist milk) from 25 EU member states. Incomplete data from the other three member states were removed from the dataset. The production function estimation includes an output variable and several input variables—capital, labour, land, and material. The output variable is expressed by cow’s milk production per farm (€/farm). All variables in financial units (euros) were deflated by the corresponding price index to correct the values for inflation. The labour variable is represented by the annual work unit (AWU). The land variable is the total utilised agricultural land used by farm. The capital variable is expressed by the depreciation of fixed assets plus contract work. The material variable is represented by the cost of feed for grazing livestock. The next step of the study was to analyse the relationship among TE and various indicators such as the number of cows (in LU) per farm, subsidies for milk production, milk yield in kg, farm specialisation expressed by the share of dairy cows (LU) in total LU and by the share of milk production in total output.
2.1. Cluster Analysis
The first step of the study was to apply cluster analysis to aggregate European countries according to their homogeneity in terms of different physical and economic size. Cluster analysis involves different methods and algorithms to group the observations (in our case, the member states). For the objective of this work, the hierarchical Ward’s method was used. Unlike the other methods that measure the distance directly, Ward’s method analyses the variance of clusters. Ward’s method is considered the most appropriate method for quantitative variables [32].
The clusters were formed based on the indicators of physical size, expressed by the livestock unit per farm, and the indicator of economic size, expressed by the standard output per farm. Both indicators were calculated for the farm of TF14-45 Specialist dairying, according to the FADN grouping. The data refer to the year 2016, the last available year for the required grouping level.
2.2. Stochastic Frontier Analysis (SFA)
The first step in calculating technical efficiency is to estimate the production function. The SFA was chosen for estimation because it is the most appropriate approach under agricultural sector conditions. The production function can be written and estimated as follows [10]:
where yi is the production (output), xi represents the production factors (inputs), β are the estimated parameters, vi is the error term, and ui is the technical inefficiency.
There are two models that can be estimated under SFA—the fixed-effects model and the random-effects model. In the fixed-effects model, the inefficiency term is assumed to be fixed and correlated with the regressors. In contrast to the fixed-effects model, the inefficiency term ui in the random-effects model is randomly distributed with constant mean and constant variance, and is expected to be uncorrelated with the regressors and the error term vit.
Greene [33] discussed that the proposed random-effects model has serious flaws. The most important one is that the inefficiency is the same in time. For long time-series data, this is an undesirable assumption. To avoid these limitations, Greene [33] proposed a “true” random Effects model that can be formulated as follows:
where wi is the random firm specific effect and vit and uit are the symmetric and one-sided components.
Following Färe [34], to estimate a production function in transcendental logarithmic (translogarithmic) form, we used the factors of production land, labour, capital, material, and a time variable. The translogarithmic production function can be written as follows:
where y is the output variable; A depicts the total factor productivity; α and β are the estimated parameters (coefficients), their subscripts represent the relevant input variable; input variables: p, land; K, capital; L, labour; M, material; T is the time variable representing technical change; vit is the error term, and uit is the technical inefficiency term.
The true random effects (TRE) model described above was used to estimate the production function [34].
Once the production function has been estimated, the technical efficiency (TE) can be calculated. An index for TE can be defined as the ratio between the observed output (y) and the maximum realisable output (y*):
Since y ≤ y*, the index TE is restricted to a value between 0 and 1; TE reaches 1 when a farm produces the maximum possible output (i.e., y = y*), with the given inputs. According to the theory of production efficiency, a farm can operate below the frontier due to technical inefficiency [35]. Jondrow [36] proposed to calculate TE for the half-normal distribution of the inefficiency term from the error term εi as the expected value of −ui conditional on εi:
where ,
, represent the standard normal density and Φ(∙) the standard normal cumulative density functions.
Coelli et al. [10] discussed that the best estimator for the model is the maximum likelihood (ML) method, while the other estimators (ordinary least squares (OLS) and corrected ordinary least squares (COLS)) could provide biased estimates. However, Schmidt [37] pointed out the possibility of SFA providing biased estimates due to measurement error. M-estimators, which are considered robust regression estimators, can avoid the problems of data imperfections and ignore outliers [38]. Forty-eight robust M-estimators were presented by de Menezes et al. [39]; it is likely that these estimators can be used to avoid problems of SFA.
2.3. Linear Regression Model
A linear regression model was estimated to analyse the relationship between TE and the indicators. The model attempts to fit a linear equation to the given data. A linear regression model can be written in the form Y = a + bX, where X is the explanatory variable (in our case, an indicator), and Y is the dependent variable (in our case TE).
All variables used for empirical analysis are represented in Table 1.
3. Results
The section on results is divided into several parts. The first part describes the leading milk producers in the EU. Other parts are devoted to the analysis of technical efficiency analysis in relation to selected criteria that may influence efficiency.
3.1. Main Milk Producers in the EU
The first part of the paper identifies leading milk producers in the EU using cluster analysis. Dairy farms were classified into four groups according to their physical (PS) and economic size (ES).
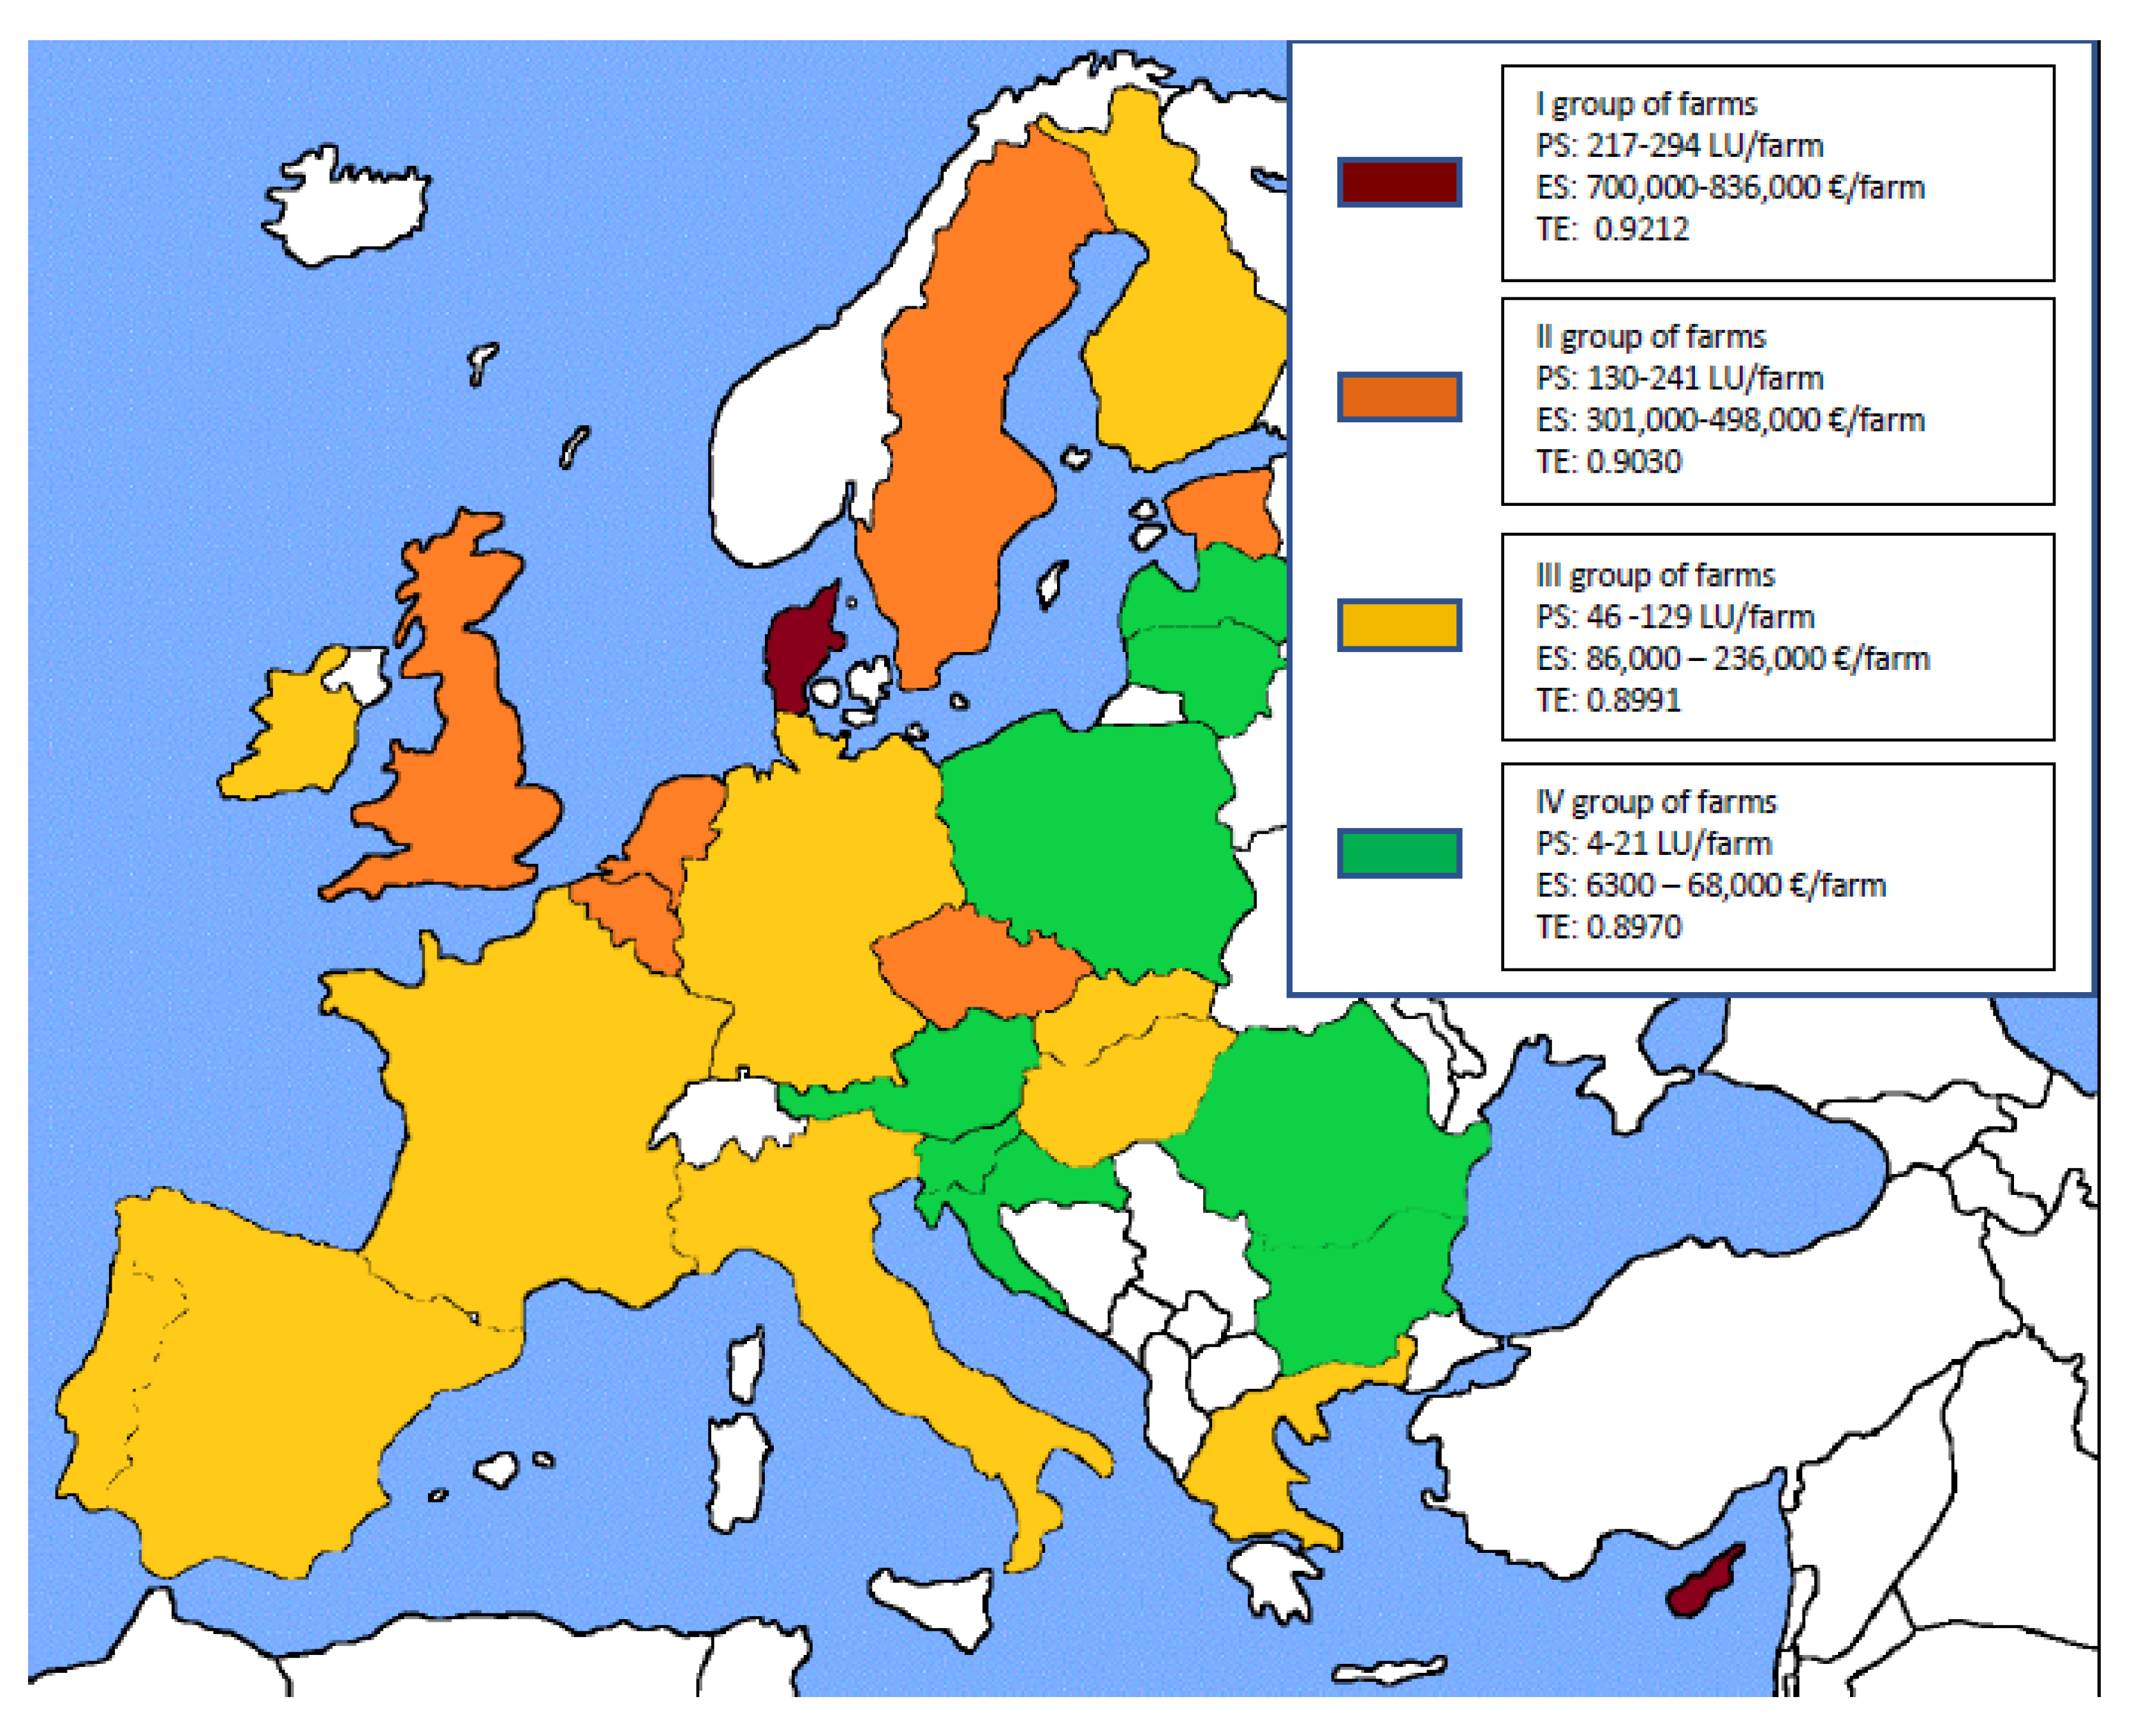
The first group consists of the largest farms with more than 217 LU/farm and more than 700 thousand €/farm (Figure 1). Only two countries belong to this group—Denmark and Cyprus (according to the FADN methodology, they belong to the economic size class XI, i.e., large farms). The second-largest group of farms includes Belgium, Czechia, Estonia, Luxembourg, the Netherlands, Sweden, and the United Kingdom. These farms have 130–241 LU/farm and 301–498 thousand €/farm (economic class IX, middle-sized farms). Smaller farms represent the third group with 46–129 LU/farm and standard output of 86–236 thous. €/farm (economic size VII and VIII, i.e., middle-sized farms). These are mainly western EU countries and some eastern countries. Germany, Ireland, Greece, Spain, France, Hungary, Malta, Portugal, Slovakia, and Finland belong to the third group. The smallest farms are represented by the countries located mainly in the east and south-east of the European continent and having 4–21 LU/farm with a standard output of 6–68 thousand €/farm (economic size III-VII, i.e., mainly small farms). This group is represented by Bulgaria, Croatia, Latvia, Lithuania, Austria, Poland, Romania, and Slovenia.
The level of technical efficiency was calculated below. There are no significant differences between the TE of a given cluster (p-value is higher than 0.600). However, it is observed that TE is slightly higher in the member states with a larger size of farms in the sector.
3.2. Technical Efficiency of EU Dairy Farms
All the estimated first-order parameters of the production factors are significant at the 1% level of significance, based on the z-test (Table 2). The assumption of monotonicity and quasiconcavity was satisfied in the case of all production factors, since the values of the production factors in the dataset were normalised by their geometric mean, the estimated parameters of the production factors can be interpreted as production elasticities. All the production elasticities had a positive sign, which is consistent with economic theory. The production elasticity showed the change in total output when the value of production increased by 1%. The factor of production labour (0.302) and capital (0.322) had the highest elasticities. This means that total output changed by 0.3% when labour or capital increased by 1%.
In comparison, the land and material variables had lower elasticity. The parameter λ (lambda) represents the ratio between the variance of the inefficiency term uit and the error term vit. The significant parameter indicates the presence and the significance of technical inefficiency in the variation in residuals. The return to scale for European milk farms is increasing (1.147), which means that the scale of farms is not fully optimal and could be increased to achieve better economic results.
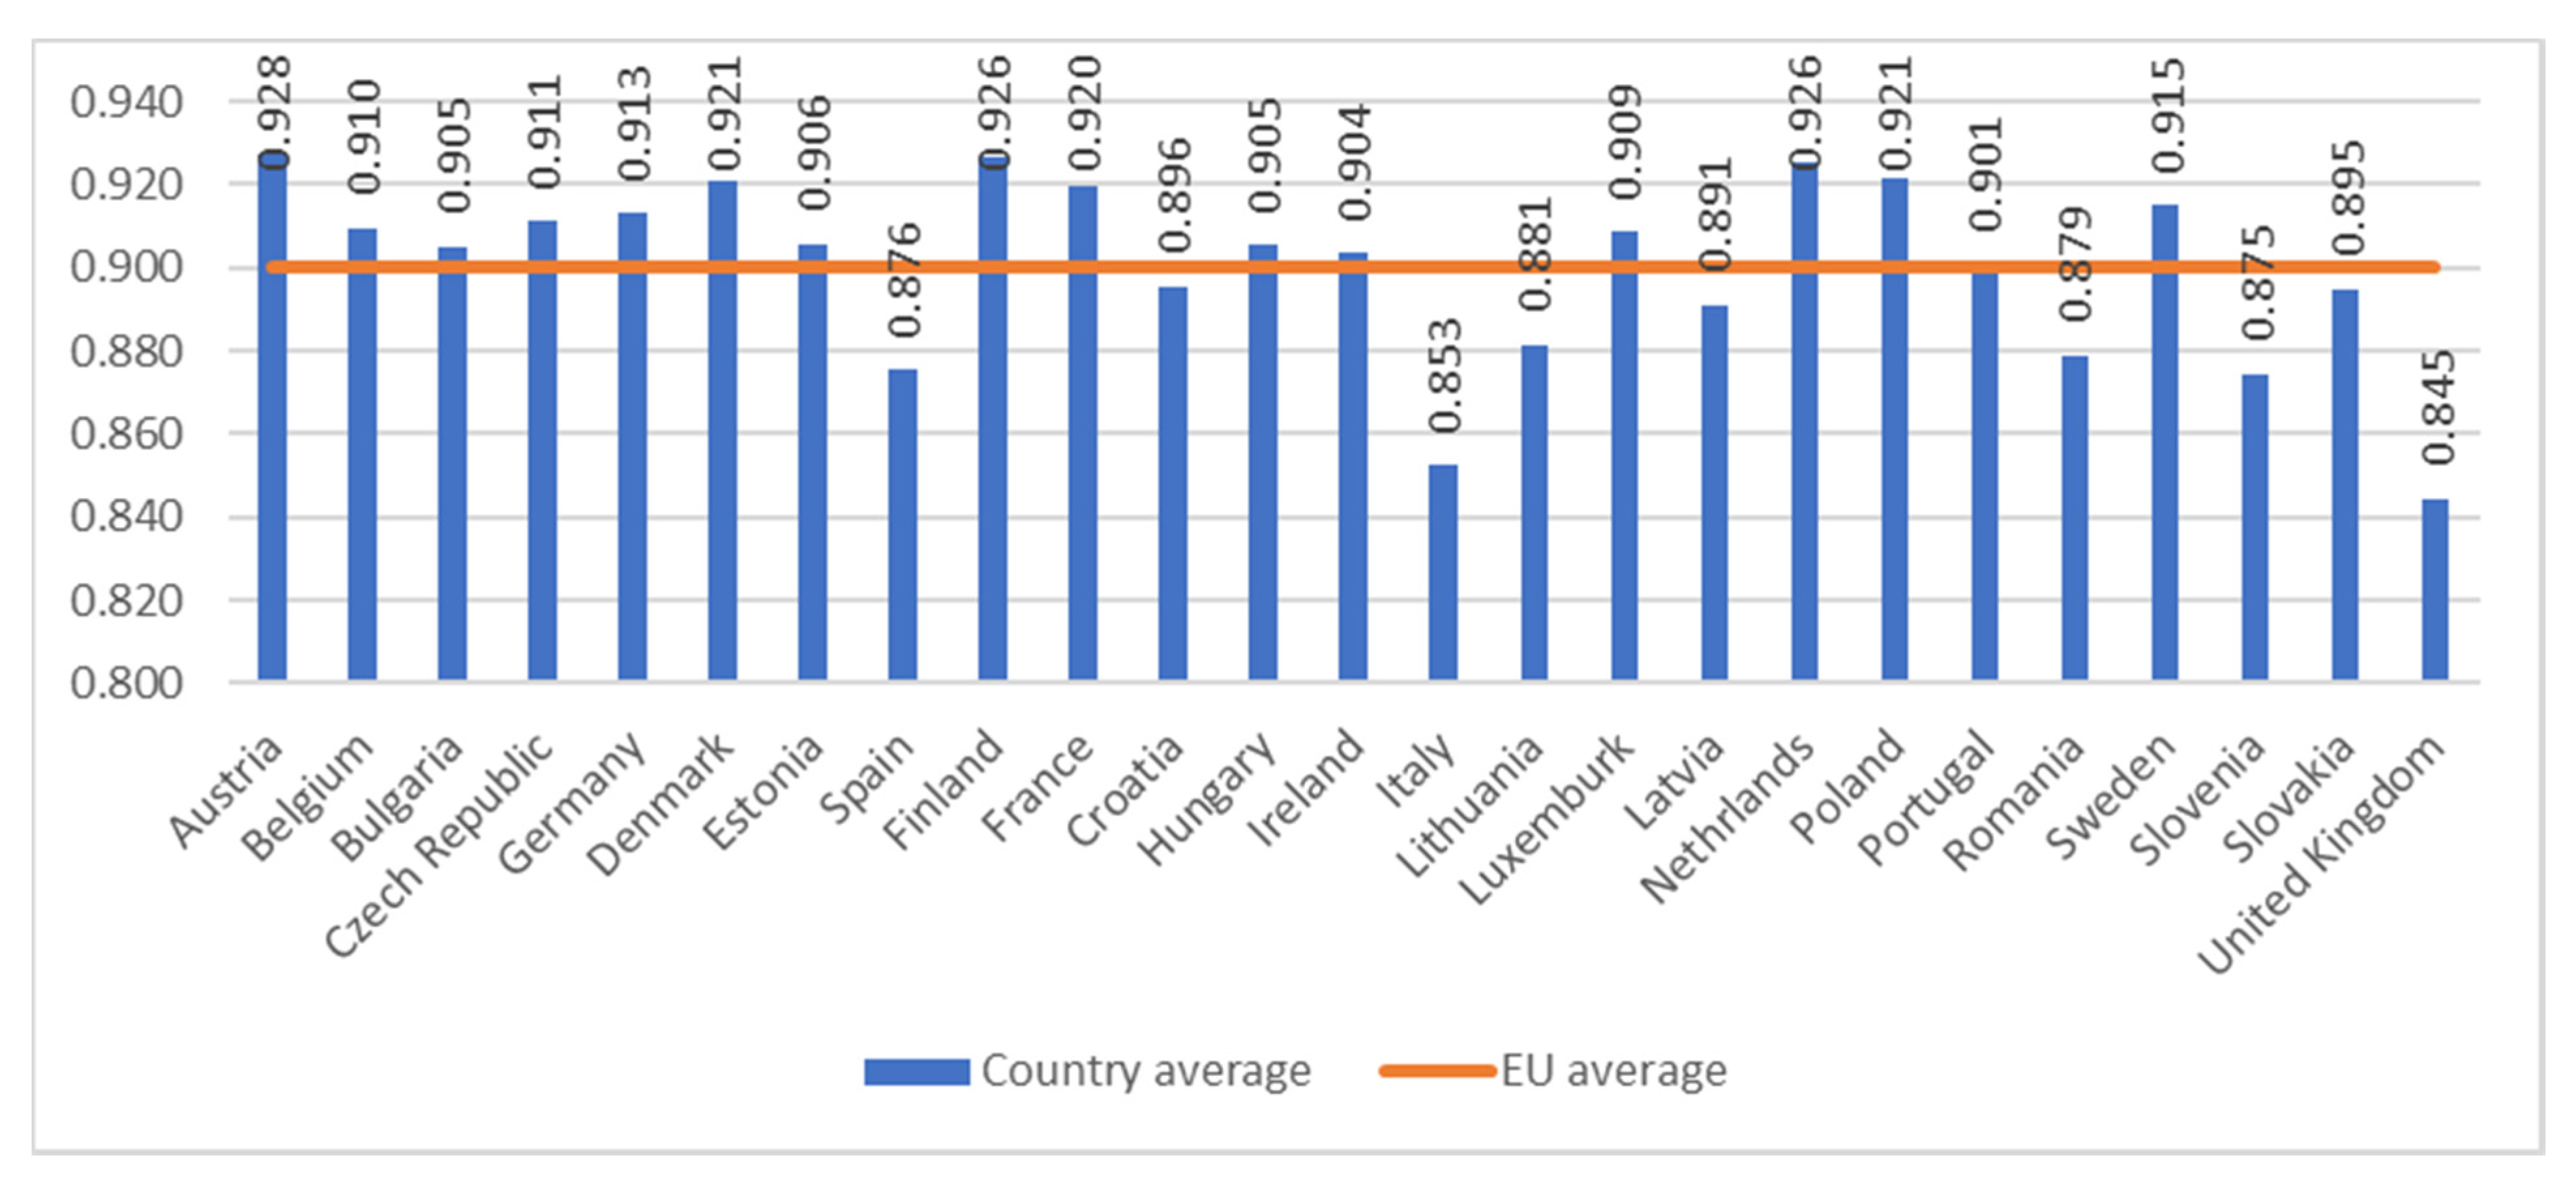
The calculated TE in the different EU member states is shown in Figure 2. The average technical efficiency in the EU is 0.900, which means that European dairy farms are relatively efficient. The average technical efficiency of the EU-13 member states (0.897) is lower than the EU-15 average (0.903), although the difference is not significant according to the t-test (p-value 0.463). The technical efficiency of the old and new member states is comparable. Among the EU-15 countries, the highest technical efficiency is achieved by Austria, Finland, and the Netherlands. Finland and the Netherlands belong to the second large cluster. Austria, on the other hand, belongs to a cluster with small farms. The lowest efficiency among the EU-15 countries was found in Italy and the United Kingdom. Among the EU-13 countries, Poland and the Czech Republic achieved the best efficiency. Poland reached very good results with TE equal to 0.921 compared to the most efficient EU-15 countries, although it belongs to the last cluster with a small economic size.
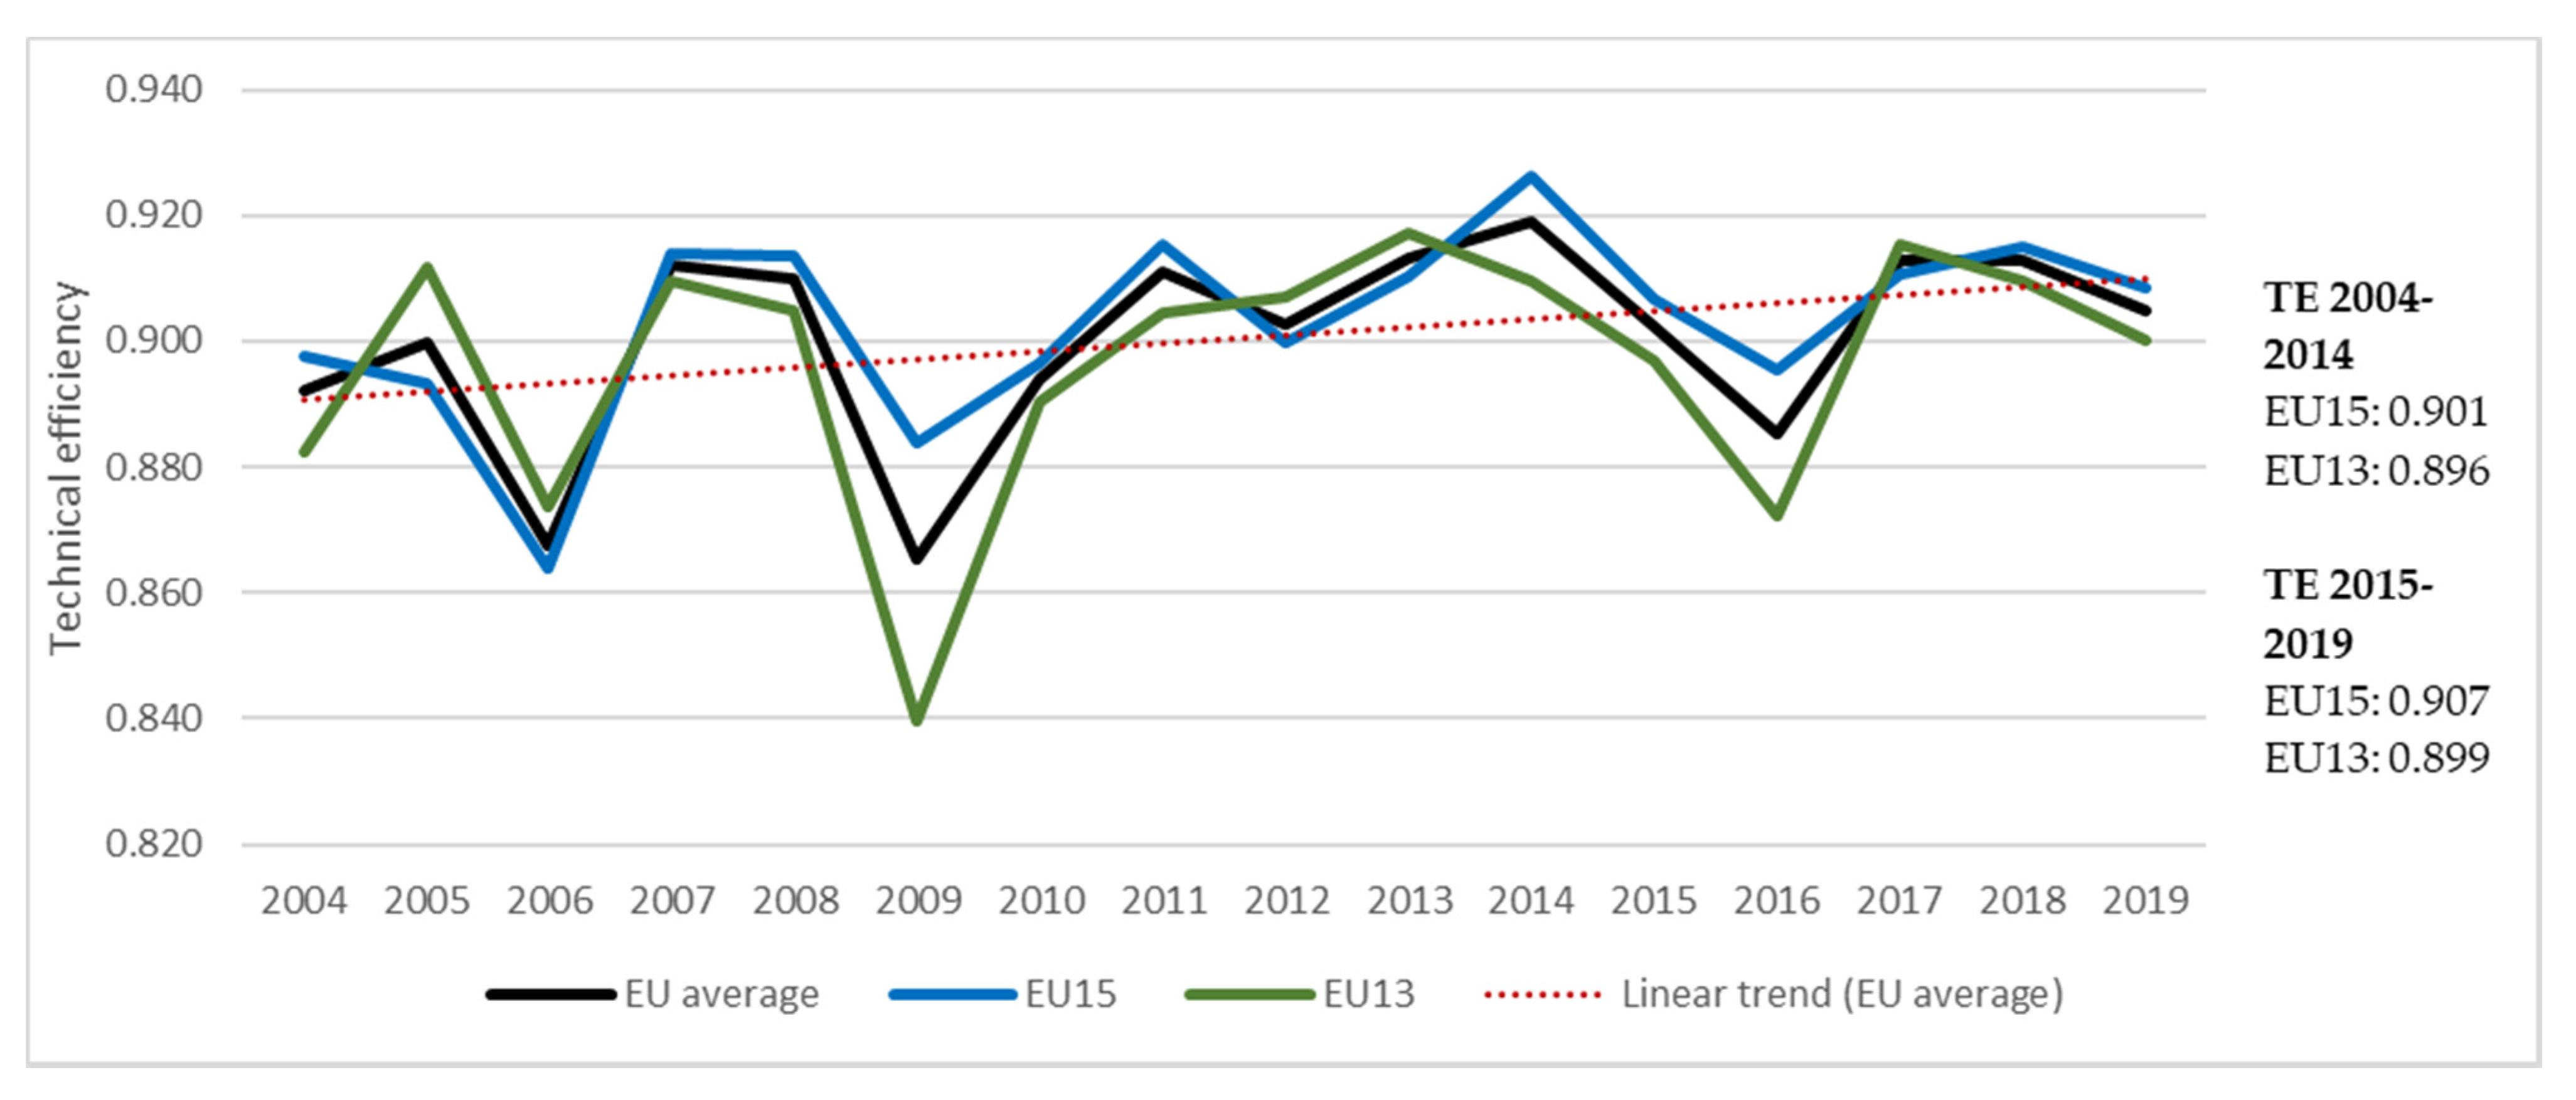
The development of TE showed an increasing linear trend (as shown in Figure 3). The largest decrease in TE was observed in 2009, the year of the financial crisis. The EU-15 and the EU-13 member states showed a very similar development. However, the fluctuations of the development curve were more pronounced in the EU-13. The TE was higher after the abolition of milk quotas (after April 2015). According to Čechura et al. [13], the main driver of productivity growth is the scale effect, which could be strengthened after the abolition of milk quotas, positively impacting farms.
3.3. Analysis of Factors Affecting Technical Efficiency
The following hypothesis were formulated and tested to analyse the relationship between TE and different indicators (Table 3).
For each relationship, the linear regression model was estimated. The parameter (linear regression coefficient) represents the significance of the relationship, i.e., whether the chosen indicator has an impact on TE. Three of the five relationships tested proved to be significant. These relationships are analysed in more detail below. Two relationships were not demonstrated.
3.3.1. Relationship between Technical Efficiency and Number of Cows
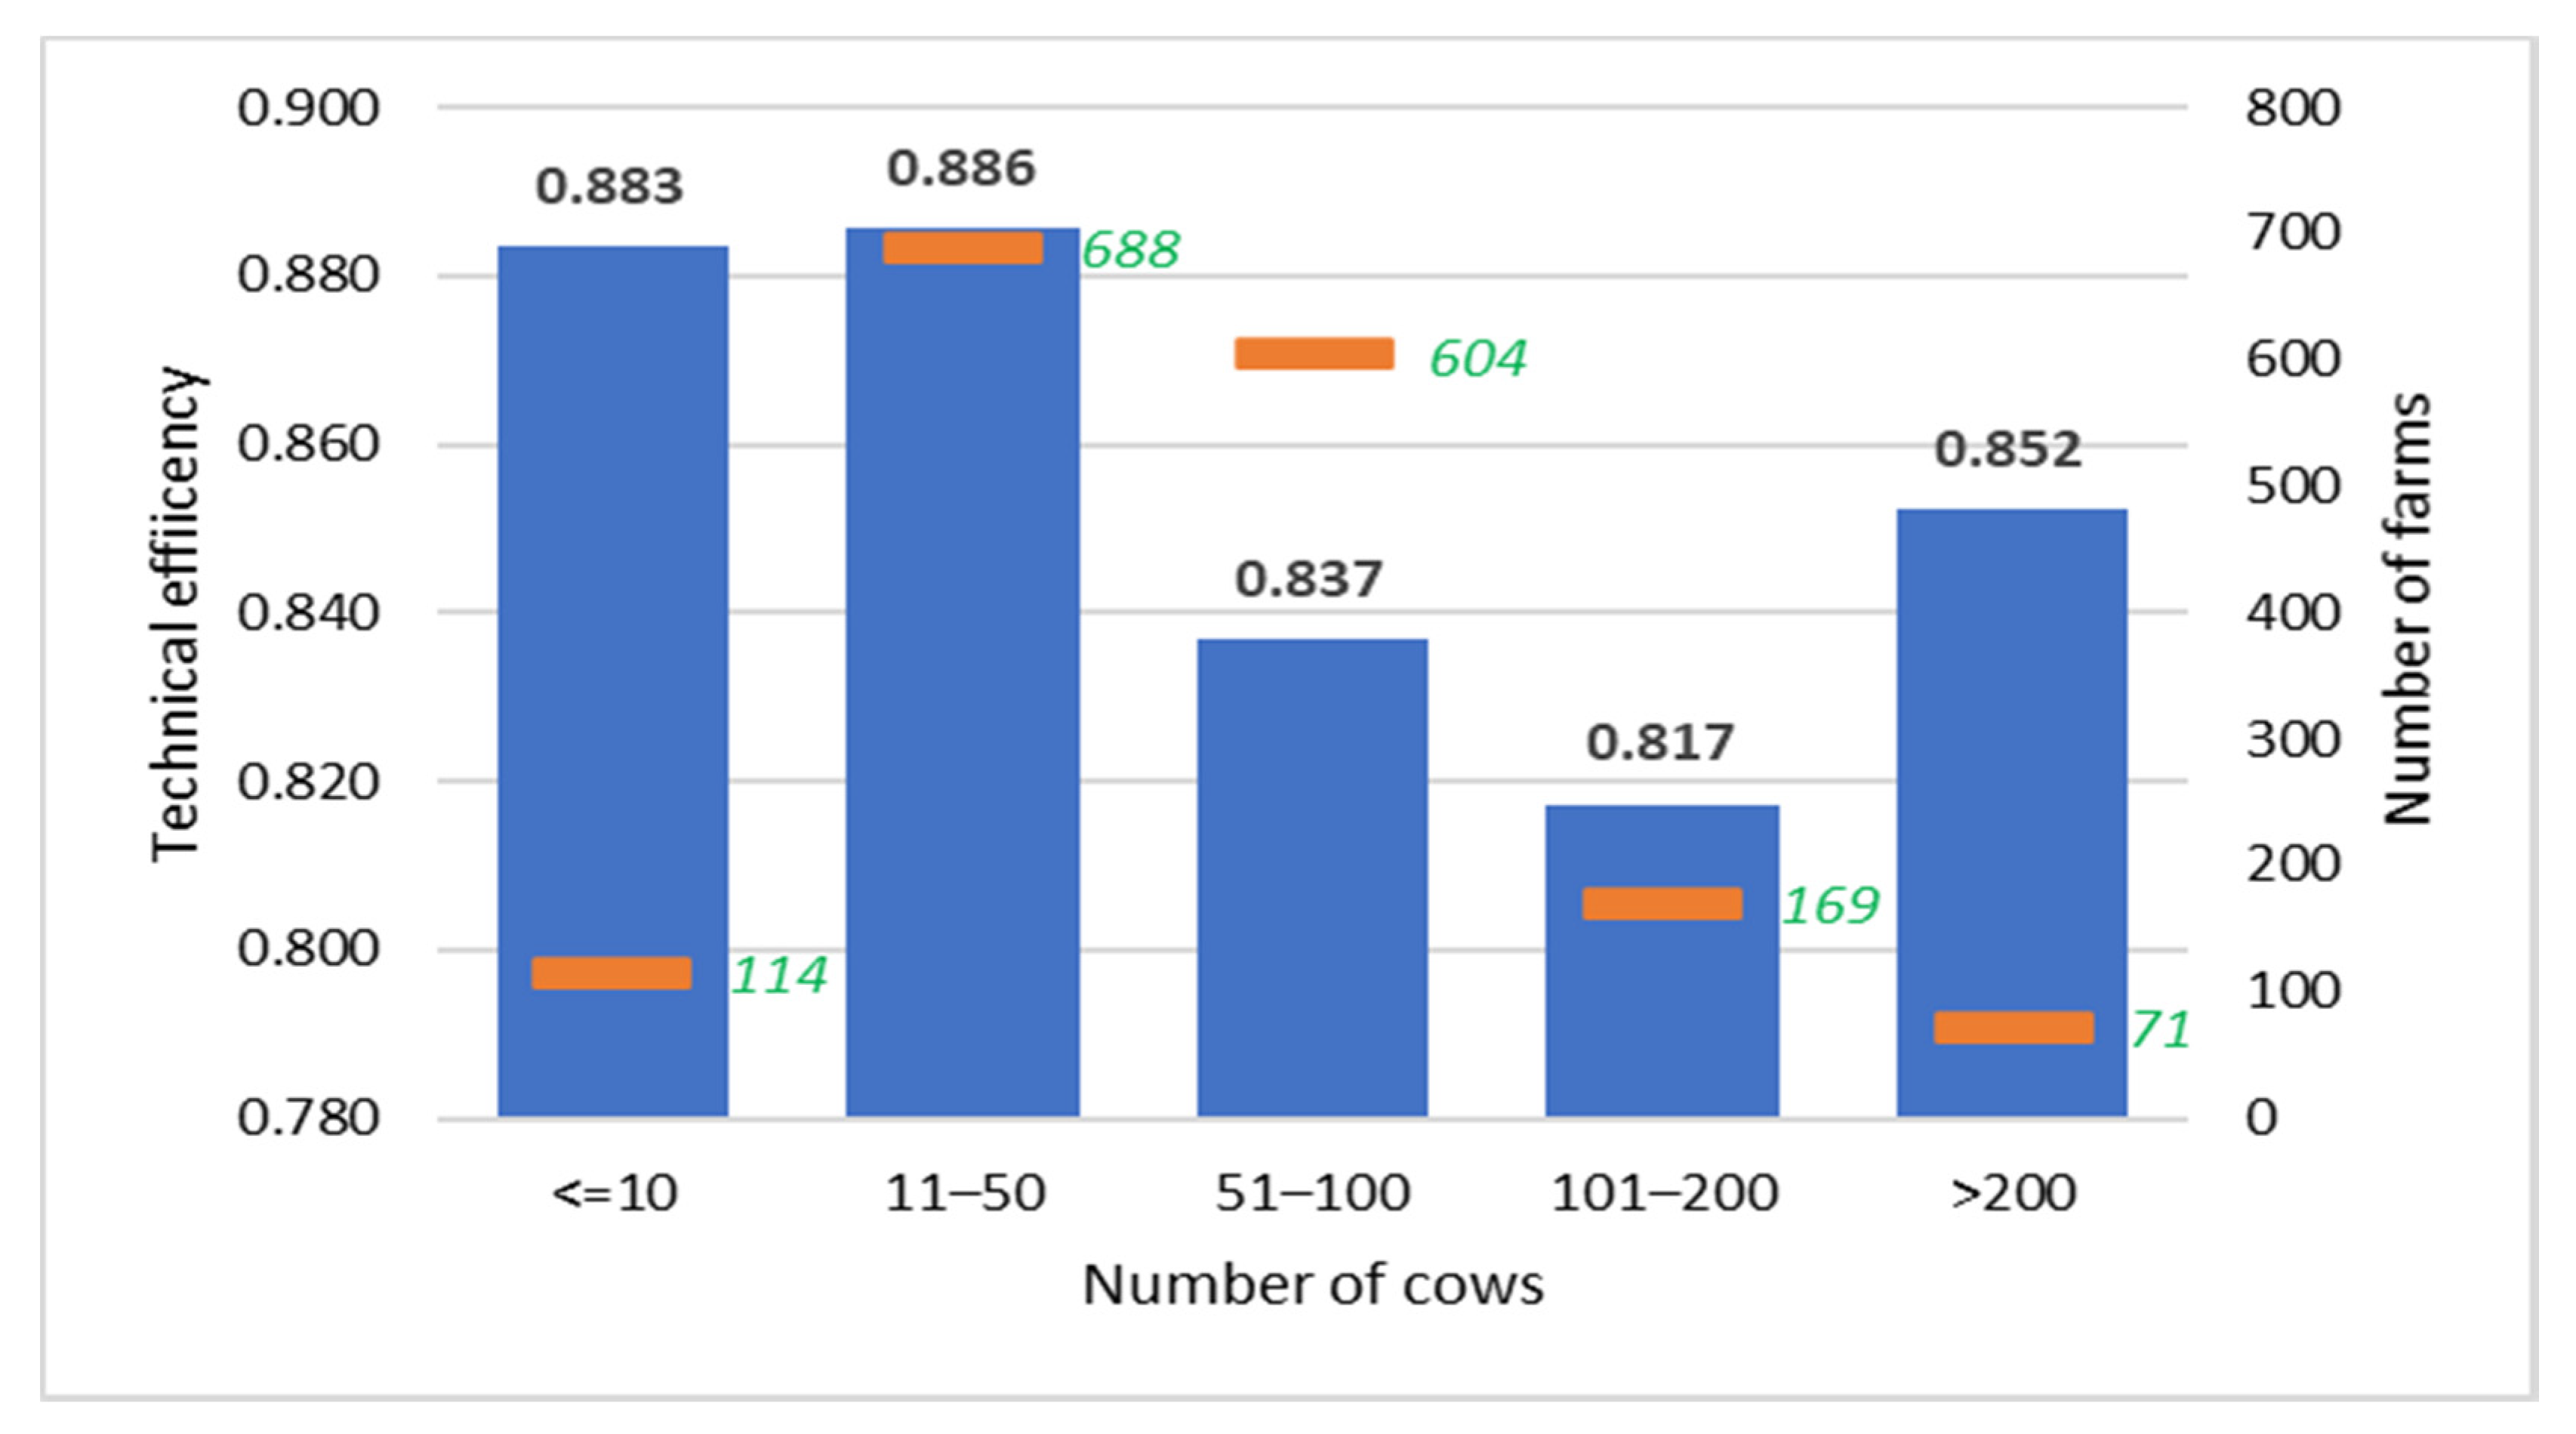
The analysis revealed significant differences in technical efficiency among farms in relation to the number of cows (herd size). Most farms in the EU have on average 11–100 cows. The fewest farms have more than 200 cows (mainly Germany and Slovakia) or less than ten cows (mainly Bulgaria, Croatia, Lithuania, Poland, and Romania). The highest TE was observed in the group of farms with less than 50 cows (Figure 4). The group of farms with the highest TE (11–50 cows) is the most numerous. As the herd size increases (up to 200 cows) TE is decreases. However, the average TE of farms with more than 200 cows is 0.8522, which is higher than the TE of the previous two groups. Large farms with more than 200 cows achieve very good efficiency.
3.3.2. Relationship between Technical Efficiency and Subsidies per Cow in Dairy Farming
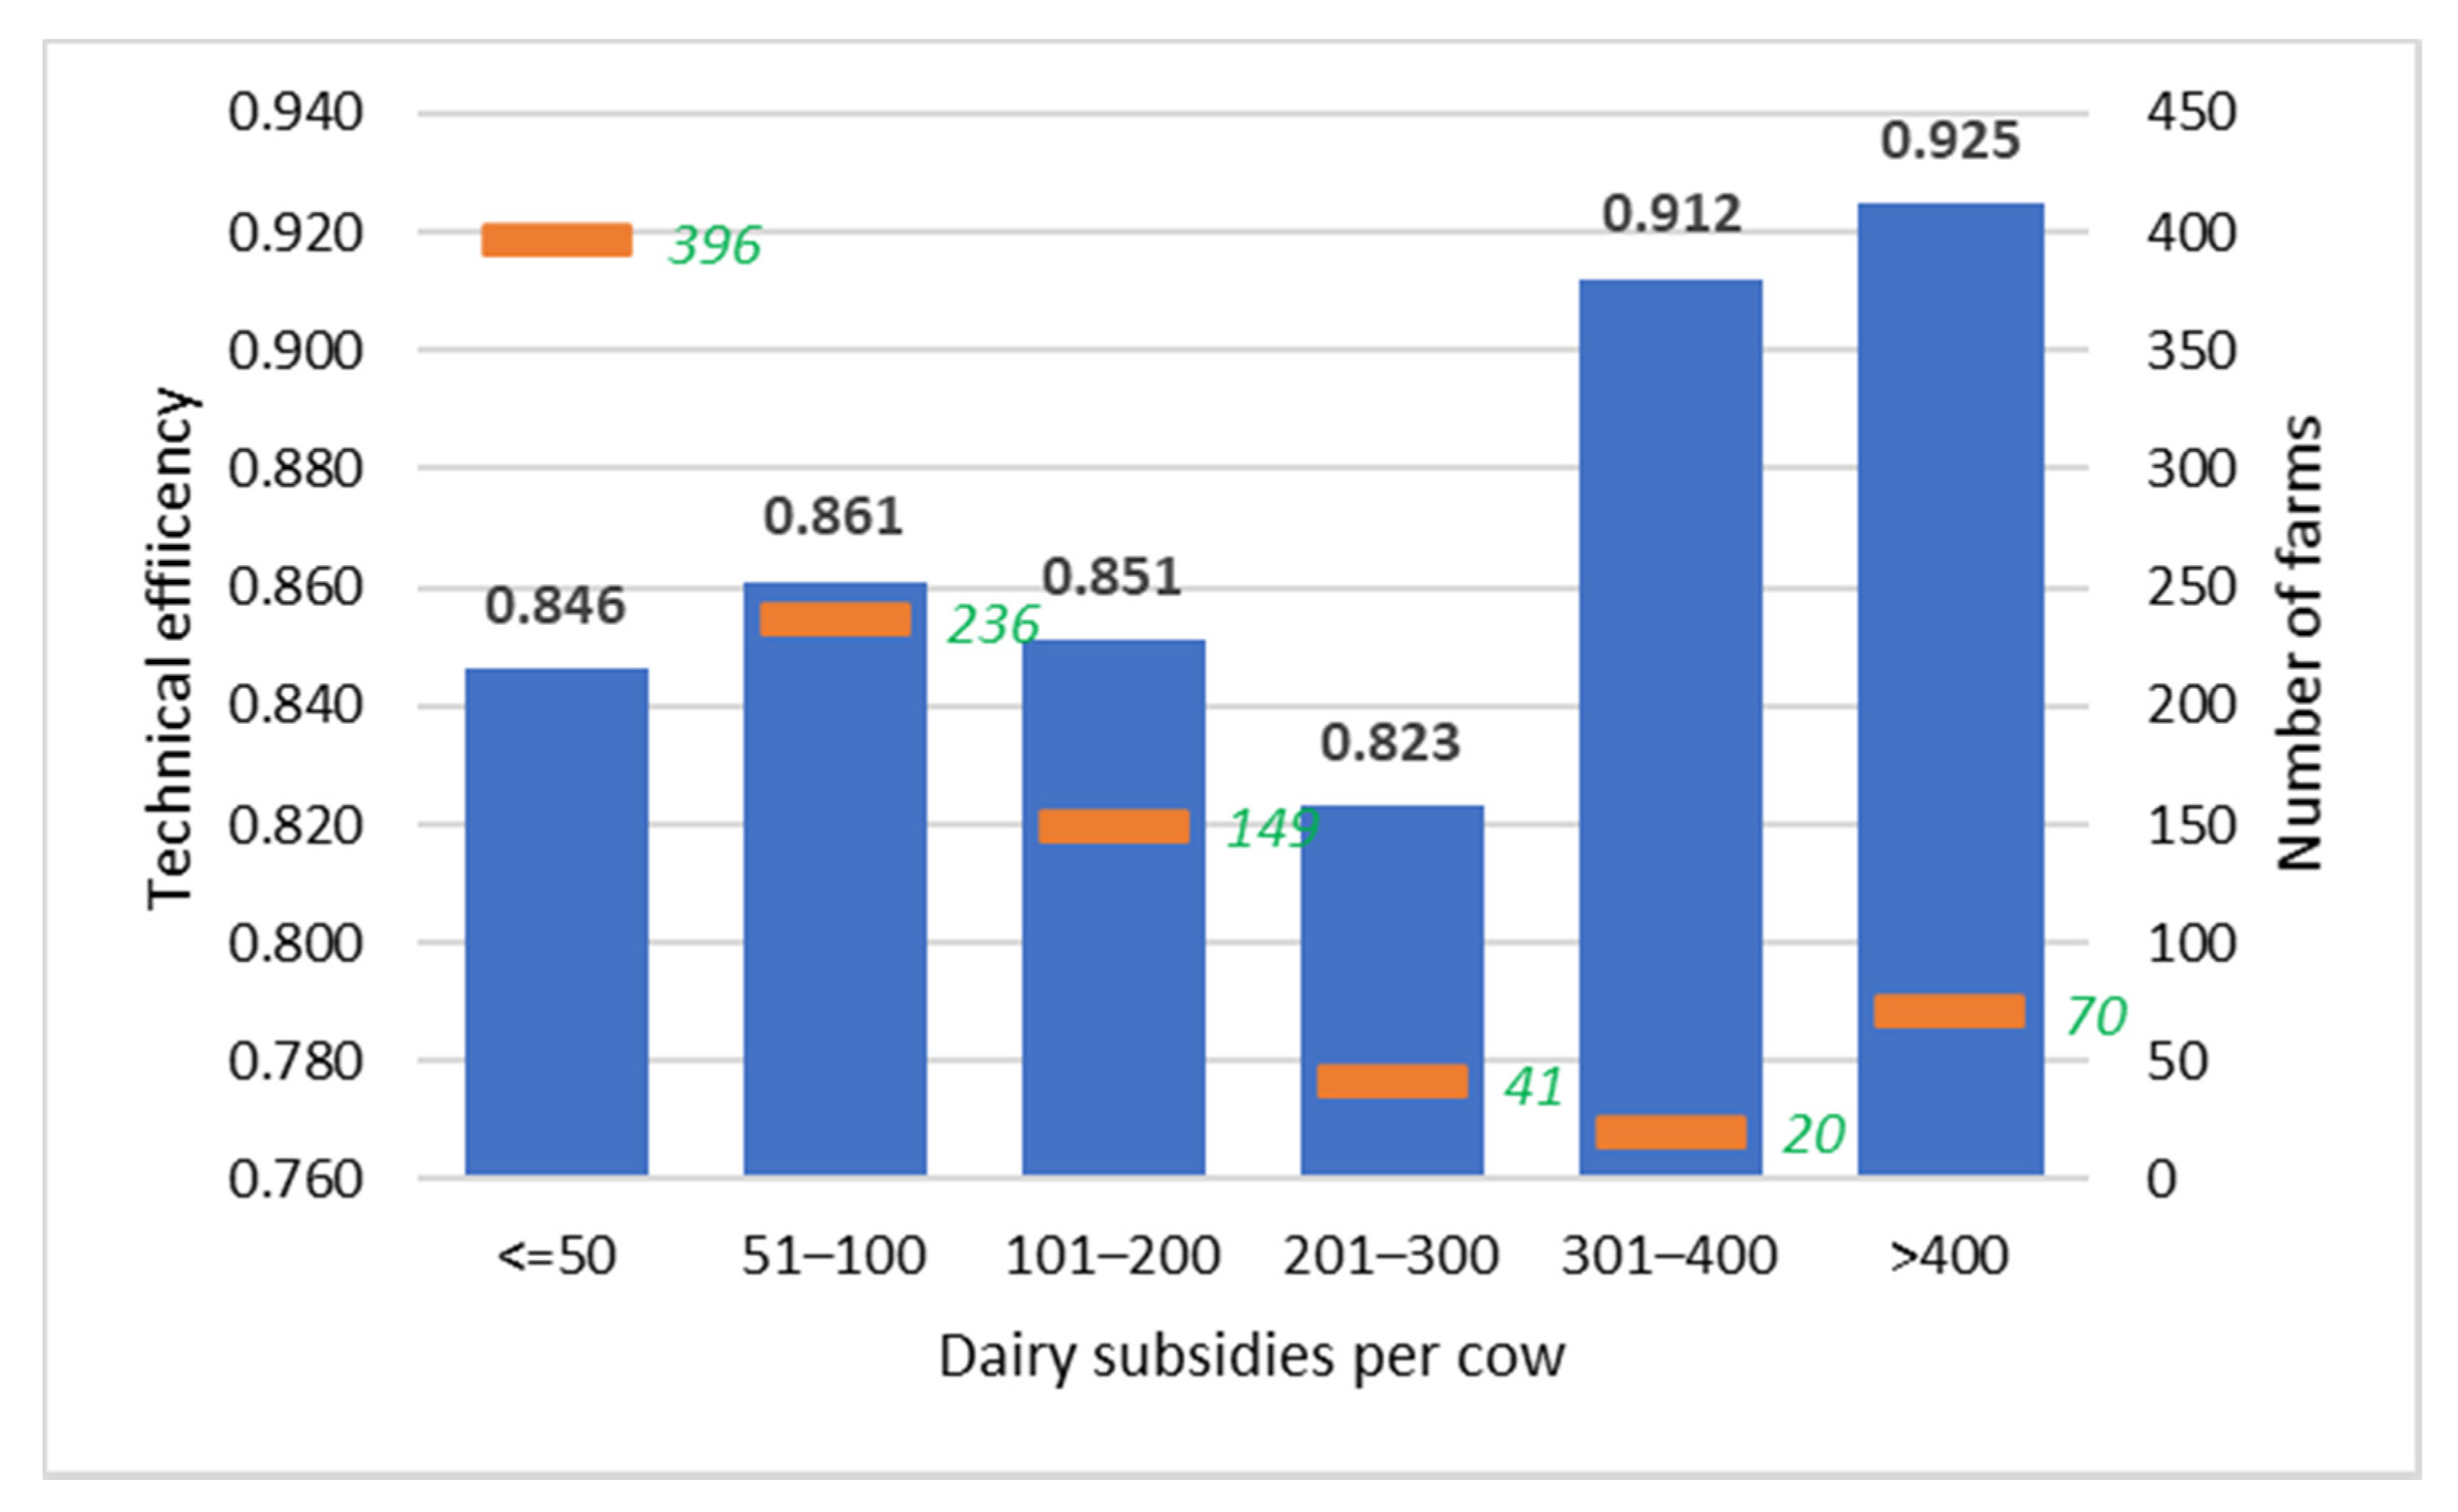
Technical efficiency was assessed with respect to subsidy dairying, which includes all subsidies for dairy products. Most farms in the dataset in the EU have subsidies per cow of less than 50 EUR/cow. Bulgaria, Lithuania, Poland, and Romania have the lowest subsidies. The lowest TE belongs to farms with subsidies for dairy products of 201–300 EUR/cow (Figure 5). From subsidies of 201–300 EUR/cow, the technical efficiency increases with a higher subsidy amount. This means that farms with more than 300 EUR/cow have the highest technical efficiency. These farms are mostly located in Finland and Sweden. The dairy sector in these countries is the most productive in terms of milk yield, where it is at or above nine thousand kg/cow.
3.3.3. Relationship between Technical Efficiency and the Proportion of Dairy Cows (in LU) in the Total LU
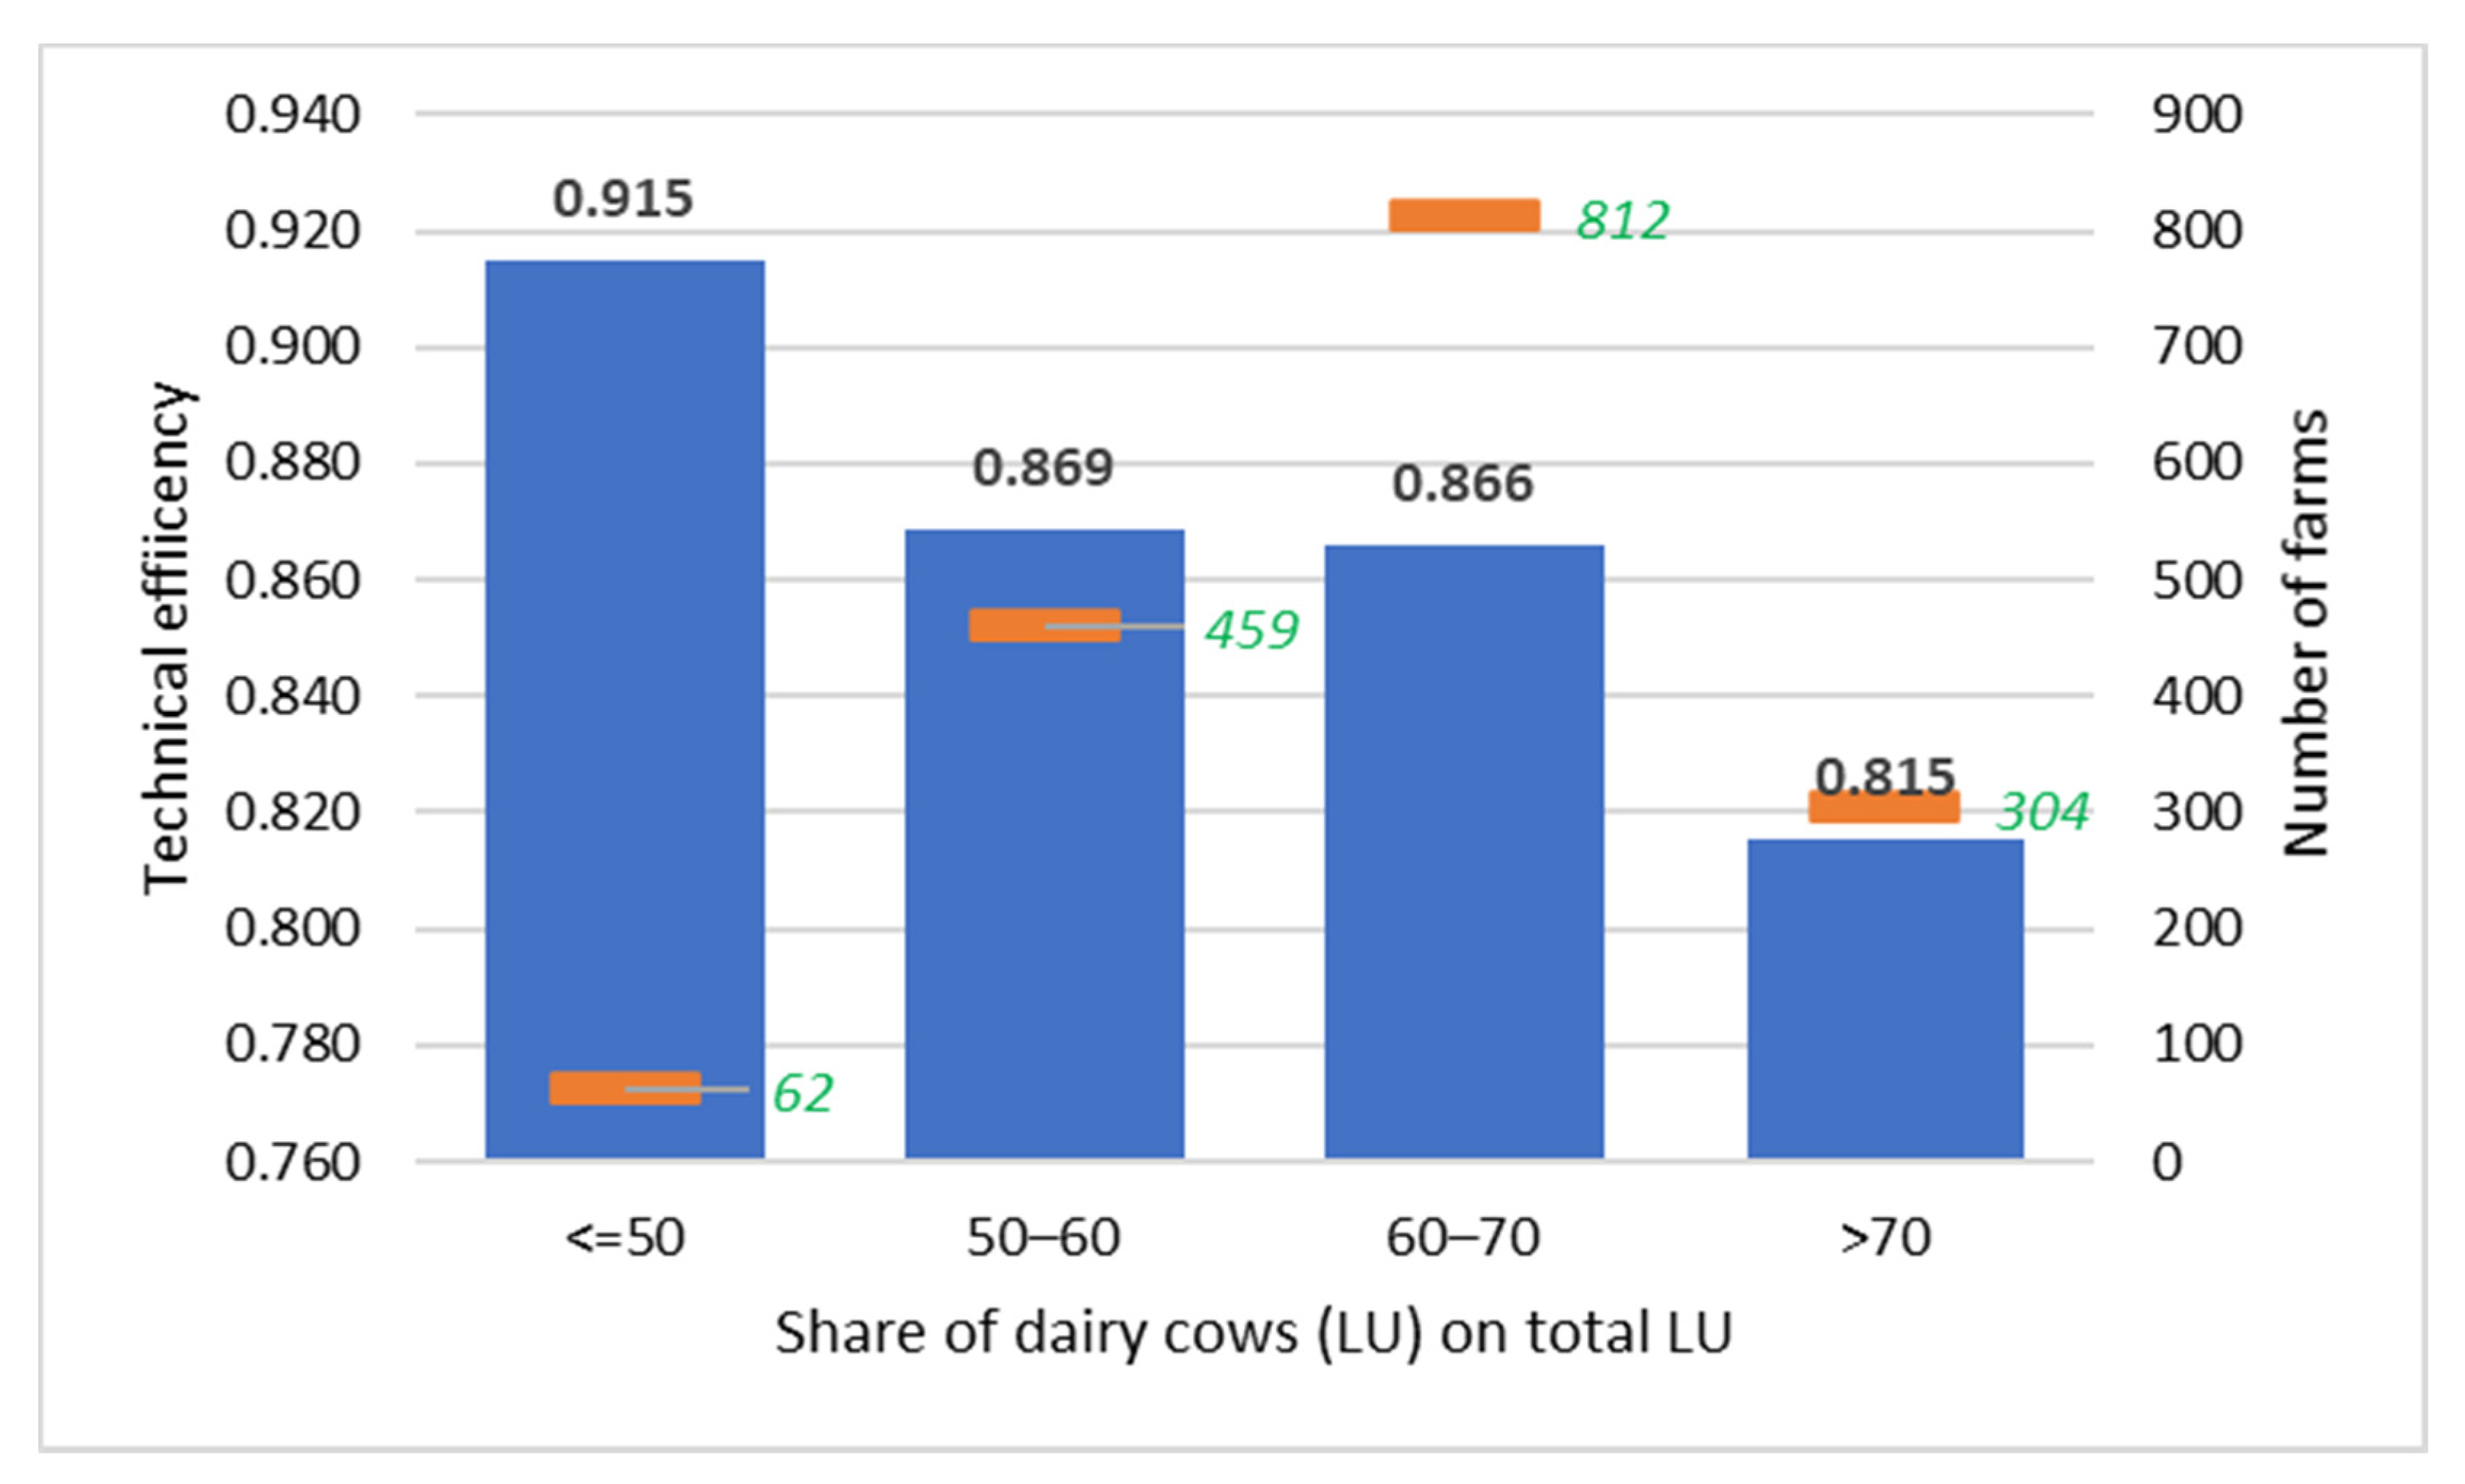
The share of dairy cows (in LU) in the total LU represents the specialisation of dairy farms. The higher the proportion of dairy cows (LU) in the total LU, the more specialized the farm is in milk production. TE increases as specialisation decreases and farm diversification increases (as shown in Figure 6). Assuming that the farm focuses only on milk production (dairy cows), the technical efficiency is the lowest. If the share of dairy cows (in LU) in the total LU is more than 70%, the technical efficiency is low.
4. Discussion
According to the results, only two hypotheses were rejected (H3: the level of milk yield has a significant influence on technical efficiency; H5: influence of the share of milk production on total output). No significant impact on efficiency was found. Provided study confirmed hypothesis H1: the number of cows on the farm has a significant influence on technical efficiency; H2: the level of subsidies per LU has a significant influence on technical efficiency, H4: the specialisation of the farm (share of dairy cows in total Lu) has a significant influence on technical efficiency. Significant impact was found.
Clustering considering physical and economic size showed the heterogeneity of dairy farms in the EU. Several studies have also demonstrated the heterogeneity of different countries and regions in terms of the dairy production sector. Poczta [40] used FADN data to classify dairy farms into five groups in terms of farm characteristics. The authors conclude that the most productive farms are medium and large farms, characterised by high specialisation, high production scale, and intensive production process. These farms are less dependent on subsidies from CAP [40].
In recent years, traditional dairy production has reduced the number of cows [2]. Efficiency is considered as the essential factor that can help dairy farms to survive [41]. Our results show that the return to scale of European dairy farmers is increasing. The scale of farms is not fully optimal and could be increased to achieve better financial results. The existence of increasing returns to scale in dairy production was also confirmed by Žáková Kroupová [26] or Čechura [14]. Žáková Kroupová [26] found that decreasing returns to scale are only in Romania, Hungary, Finland, Estonia, and Spain.
The average technical efficiency of the old (EU-15) and new member states (EU-13) is comparable. The efficiency of the EU-13 (0.897) was lower than the average of the EU-15 (0.903). Moreover, some new member states with a small economic size achieved very good efficiency compared to the most efficient countries of the EU-15. In contrast, Žáková Kroupová [26] calculated the EU-15 average to be 0.9445 and significant differences with the EU-13. In their opinion, the changes in the EU-15 are a harbinger of the development in the EU-13. Other studies have proved that dairy farms’ technical efficiency varies among states (even in relation to new or old member states). According to Čechura [14], there are differences in milk productivity in the EU (at NUTS 2 (regional) level). Productivity is highest in the north-west of the EU, i.e., in the old member states. Only the Czech Republic, Slovakia, and Hungary have achieved sufficient total factor productivity growth to catch up with the more competitive EU-15 member states [14]. The accession of new member states has been associated with side effects for both old and new states. The study also pointed out the lack of studies dealing with the productivity of the new and old member states. Data from the FADN of 24 EU countries up to 2011 were analysed. The highest productivity was found in the old member states. Irz and Jansik [15] analysed the productivity in selected countries in 1995–2010 and found differences and the stable position of older EU member states. The efficiency of dairy farms may also vary from region to region. The Norwegian study of Alem [16] also analysed the technical efficiency of dairy farms from a regional perspective. The results indicate minor regional differences in efficiency and input use. These results can be used for region-specific agricultural policies. Farms from different regions have different production possibilities, use different equipment or technologies. Other differences such as soil quality, temperature, and rainfall can also be expected [16,17]. Regional differences have also been noted by Batha et al. [18].
The TE is higher after the abolition of milk quotas (after April 2015). Some studies addressed the efficiency of dairy in the context of the abolition of quotas. For example, some studies [11] examined the technical efficiency and the change in total factor productivity of dairy farms in the EU. They identified the best-performing countries in relation to quota regimes using Data Envelopment Analysis (DEA) applied to 22 EU countries over the period 2004–2012. The results showed that there is a little scope for improving efficiency through technical input. The evaluation of total factor productivity shows that dairy farms in the EU have suffered a decline in productivity. Areal [12] analysed technical efficiency in relation to milk quotas. The way farmers use the milk quota market is associated with farm efficiency. According to Čechura [13], the main driver of productivity growth is the scale effect, which was strengthened after the abolition of milk quotas and positively impacted farms. They also found a positive effect on productivity after the abolition of milk quotas, as also shown in our study
The paper also analysed the relationship between TE and various indicators. The study found no significant effect of milk yield on technical efficiency. The absence of the relationship can be explained by the fact that the output “cow’s milk and milk products” in the dataset includes buffalo’s milk. The yield of buffaloes is lower than the yield of cows. This is especially relevant for Italy, where the production of buffalo milk has a long tradition. Špička and Smutka [20] came to almost the same results. They found higher milk yields in efficient regions, but the difference was not statistically significant. According to Wilczynski [42], the efficiency of farms increases with a higher milk yield.
Despite the varieties of dairy cow breeds existing in the world and in Europe, the Holstein/Friesian breed with high milk yield is the most prevalent and is becoming a very important breed in the EU in recent years The other breeds include the Normande, the Montbéliarde, the Swiss Brown, the Jersey, the Simmental, and the Ayrshire but these are not so widespread, and the production of milk of these breeds is not so significant [43]. Friesian/Holstein is the most expanded in main milk-producing countries such as Germany, France, Italy, the Netherlands, Belgium, United Kingdom, and Spain [44].
In assessing technical efficiency, several determinants were considered that may affect the level of efficiency. One of them was subsidy per cow. Latruffe [45] analysed the effect of subsidies on TE of dairy farms. The authors considered the following payments: direct payments for areas planted with specific crops and for heads of specific livestock; decoupled subsidies introduced in 2005 (namely the Single Farm Payments); and subsidies provided to farms located in less-favoured areas. They concluded that subsidies had a positive effect in two European countries, while in other countries, subsidies tended to be negative, or the significant effect could not be demonstrated on TE. Our study showed that subsidies significantly affect efficiency, especially when the dairy farm receives more than 300 EUR/cow. The effect of subsidies on farm performance is also an interesting topic for policymakers [46]. It can be concluded that subsidies in the EU have helped dairy farms to achieve better efficiency. The highest is the subsidy per cow, and the highest is the technical efficiency. Some studies evaluate the impact of Common Agricultural Policy on efficiency [46]. Their study showed that a higher level of coupling in farm support negatively affects efficiency. Farmers are less motivated to be efficient because they depend on a higher level of subsidies. Minviel and Latruffe [47] or Marzec and Pisulewksi [48] also found a negative relationship between farm technical efficiency and subsidies. Lakner [19] studied the impact of agricultural subsidies and regional factors that may affect technical efficiency on dairy farms. The results showed that agri-environmental payments did not affect efficiency. Farms with investment subsidies had lower efficiency. Špička and Smutka [20] found that rural development subsidies are significantly higher in inefficient regions.
The results show significant differences in the technical efficiency of farms with respect to herd size. Farms with less than 50 farms and more than 200 cows achieved the highest efficiency. These results can also be related to capital costs, which may be lower on large farms. More efficient farms tend to have more cows and can take advantage of scale [49]. The positive relationship between herd size and efficiency was also confirmed by Demircan [50]. According to Batha et al. [18], technical efficiency increases with an increasing number of cattle. Priyanka et al. [21] showed that technical efficiency was high for all herd size categories. Kovács and Szücs [22] found that farms keeping more than 501 dairy cows were more efficient.
Technical efficiency increases with decreasing specialisation and increasing farm diversification. If the proportion of dairy cows (in LU) in the total number LU is more than 70%, technical efficiency is low. According to Špička and Smutka [20], different livestock intensity was found, but diversification of activities is not a driver of higher efficiency. On the opposite, the ratio of the total number of dairy cows to the total number of cattle is an important factor that positively influences efficiency [23].
5. Conclusions
The paper aimed to evaluate the technical efficiency of dairy farms in the EU using stochastic frontier analysis and to analyse the impact of different factors on technical efficiency.
The first part of the paper dealt with the clustering of EU dairy farms according to their physical and economic size. It was confirmed that there are differences among farms.
Analysis of technical efficiency has shown an increasing return to scale in EU dairy farms. There is potential to achieve better economic results by increasing the size of farms. The EU dairy sector has the opportunity to develop and increase its competitiveness. Technical efficiency between EU-15 and EU-13 is comparable and is not influenced by physical or economic size.
The amount of milk yield did not affect efficiency. The reason is probably the presence of buffalo’ milk with lower yields than cow milk. After the abolition of the milk quota, dairy farms achieved higher efficiency. As herd size increases, TE decreases. However, the average TE of farms with more than 200 cows is higher than TE in other groups. When dairy farms are specialised, they achieve lower efficiency. In this case, diversification helps to obtain better efficiency. Subsidies are a major determinant limiting technical efficiency. Farms with subsidies of more than 300 Eur/cow were the most efficient.
In summary, small and large, highly diversified farms play a crucial role in milk production in the EU. They have a higher level of technical efficiency with an advantageous production potential. The analysis results should help to understand the relationship between the efficiency of EU dairy farms and find factors limiting competitiveness. The analysis can serve as supporting material for stakeholders in policy settings.
Author Contributions
Conceptualisation, T.R. and Z.N.; methodology, T.R.; formal analysis, T.R. and Z.N.; discussion, T.R. and Z.N.; conclusions, T.R. and Z.N. All authors have read and agreed to the published version of the manuscript.
Funding
The research is a part of the solution of the project QK1920398 “Duality in Czech Agriculture: Advantage or Disadvantage for New Generation Agriculture?” supported by the Ministry of Agriculture of the Czech Republic, NAZV—program QK-ZEMĚ.
Institutional Review Board Statement
Not applicable.
Informed Consent Statement
Not applicable.
Data Availability Statement
Data are publicly available; all sources were referenced.
Conflicts of Interest
The authors declare no conflict of interest.
References
- Rasmussen, S. Criteria for optimal production under uncertainty. The state-contingent approach. Aust. J. Agric. Econ. 2003, 44, 447–476. [Google Scholar] [CrossRef] [Green Version]
- Cabrera, V.E.; Solís, D.; Del Corral, J. Determinants of technical efficiency among dairy farms in Wisconsin. J. Dairy Sci. 2010, 93, 387–393. [Google Scholar] [CrossRef] [Green Version]
- OECD/FAO. Agricultural Outlook 2021–2030. Available online: https://www.fao.org/3/CB5332EN/Dairy.pdf (accessed on 29 October 2021).
- EUROSTAT. Milk and Milk Products Statistics. Available online: https://ec.europa.eu/eurostat/statistics-explained/index.php?title=Milk_and_milk_product_statistics#Milk_production (accessed on 1 November 2021).
- Koopmans, T.C. An analysis of production as an efficient combination of activities. In Activity Analysis of Production and Allocation; Koopmans, T.C., Ed.; John Wiley and Sons, Inc.: Hoboken, NJ, USA, 1951. [Google Scholar]
- Debreu, G. The Coefficient of Resource Utilization. Econometrica 1951, 19, 273–292. [Google Scholar] [CrossRef]
- Farrell, M.J. The measurement of productive efficiency. J. R Stat. Soc. 1957, 120, 253–290. [Google Scholar] [CrossRef]
- Färe, R.; Lovell, C.A.K. Measuring the technical efficiency. Econ. Theory 1978, 19, 150–162. [Google Scholar] [CrossRef]
- Aigner, D.J.; Lovell, C.A.K.; Schmidt, P. Formulation and estimation of stochastic frontier production functions. J. Econ. 1977, 6, 1–37. [Google Scholar] [CrossRef]
- Coelli, T.J.; Rao, D.S.P.; O’Donnell, C.J.; Battese, G.E. An Introduction to Efficiency and Productivity Analysis; Springer: New York, NY, USA, 1995. [Google Scholar]
- Madau, F.A.; Furesi, R.; Pulina, P. Technical efficiency and total factor productivity changes in European dairy farm sector. Agric. Food Econ. 2017, 5, 17. [Google Scholar] [CrossRef]
- Areal, F.J.; Tiffin, R.; Balcombe, K. Farm technical efficiency under a tradable milk quota system. J. Dairy Sci. 2012, 95, 50–62. [Google Scholar] [CrossRef] [Green Version]
- Čechura, L.; Žáková Kroupová, Z.; Benešová, I. Productivity and Efficiency in European Milk Production: Can We Observe the Effects of Abolishing Milk Quotas? Agriculture 2021, 11, 835. [Google Scholar] [CrossRef]
- Čechura, L.; Grau, A.; Hockmann, H.; Levkovych, I.; Kroupova, Z. Catching up or falling behind in Eastern European agriculture–the case of milk production. J. Agric. Econ. 2017, 68, 206–227. [Google Scholar] [CrossRef]
- Irz, X.; Jansik, C. Competitiveness of dairy farms in northern Europe: A crosscountry analysis. Agric. Food Sci. 2015, 24, 206–2018. [Google Scholar]
- Alem, H.; Lien, G.; Hardaker, J.B.; Guttormsen, A. Regional differences in technical efficiency and technological gap of Norwegian dairy farms: A stochastic meta-frontier model. Appl. Econ. 2019, 51, 409–421. [Google Scholar] [CrossRef]
- O’Donnell, C.J.; Rao, D.S.P.; Battese, G.E. Metafrontier Frameworks for the Study of Firm-Level Efficiencies and Technology Ratios. Empir. Econ. 2008, 34, 231–255. [Google Scholar] [CrossRef]
- Batha, S.; Omore, A.; Baker, D.; Okike, I.; Gebremedhin, B.; Wanyoike, F. An Analysis of Technical Efficiency in the Presence of Developments toward Commercialization: Evidence from Tanzania´s Milk Producers. Eur. J. Dev. Res. 2020, 33, 502–525. [Google Scholar]
- Lakner, S. Technical efficiency of organic milk-farms in Germany. Agron. Res. 2009, 7, 632–639. [Google Scholar]
- Špička, J.; Smutka, L. The Technical Efficiency of Specialised Milk Farms: A Regional View. Sci. World J. 2014, 2014, 985149. [Google Scholar] [CrossRef] [PubMed] [Green Version]
- Priyanka, L.; Chandel, B.S.; Chauhan, A.K.; Kumari, B. What determines the technical efficiency of dairy farmers in Sirsa cooperative milkshed? Indian J. Dairy Sci. 2020, 76, 600–607. [Google Scholar]
- Kovács, K.; Szücs, I. Exploring efficiency reserves in Hungarian milk production. Stud. Agric. Econ. 2020, 122, 37–73. [Google Scholar]
- Yilmaz, H.; Gelaw, F.; Speelman, S. Analysis of technical efficiency in milk production: A cross-sectional study on Turkish dairy farming. Rev. Bras. Zootec. 2020, 49, 1–10. [Google Scholar] [CrossRef]
- Kroupová Žáková, Z.; Trnková, G. Technical efficiency and economic performance of dairy production in the EU: The role of size. J. Cent. Eur. Agric. 2020, 21, 915–928. [Google Scholar] [CrossRef]
- Gorton, M.; Davidova, S. Farm Productivity and Efficiency in the CEE Applicant Coun-tries: A Synthesis of Results. Agric. Econ. 2004, 30, 1–16. [Google Scholar] [CrossRef]
- Žáková Kroupová, Z.; Hálová, P.; Rumánková, L. Productivity of Czech Milk Production in European Comparison, AGRIS on-line Pap. Econ. Inform. 2020, 12, 115–127. [Google Scholar]
- EUROSTAT. Farm Indicators by Agricultural Area, Type of Farm, Standard Output, Legal Form, and NUTS 2 Regions. Available online: https://appsso.eurostat.ec.europa.eu/nui/show.do?dataset=ef_m_farmleg&lang=en (accessed on 28 August 2021).
- FADN—Farm Accountancy Data Network. Available online: https://agridata.ec.europa.eu/extensions/FADNPublicDatabase/FADNPublicDatabase.html (accessed on 16 September 2021).
- Galluzzo, N. A non-parametric analysis of technical efficiency in Bulgarian farms using the FADN dataset. Euro. Ctry. 2018, 10, 58–73. [Google Scholar] [CrossRef] [Green Version]
- Špička, J.; Machek, O. Change in the production efficiency of European specialised milk farming. Agric. Econ. 2015, 61, 1–13. [Google Scholar]
- Kostlivý, V.; Fuksová, Z. Technical efficiency and its determinants for Czech livestock farms. Agric. Econ. 2019, 65, 175–184. [Google Scholar] [CrossRef] [Green Version]
- Murtagh, F.; Legendre, P. Ward’s Hierarchical Clustering Method: Clustering Criterion and Agglomerative Algorithm. J. Classif. 2014, 31, 274–295. [Google Scholar] [CrossRef] [Green Version]
- Greene, W. Reconsidering heterogeneity in panel data estimators of the stochastic frontier mode. J. Econ. 2005, 126, 269–303. [Google Scholar] [CrossRef]
- Färe, R. Efficiency and the production function. J. Econ. 1975, 35, 317–324. [Google Scholar] [CrossRef]
- Ray, S.; Kumbhakar, S.; Dua, P. Benchmarking for Performance Evaluation. A Production Frontier Approach; Springer: New Delhi, India, 2015. [Google Scholar]
- Jondrow, J.; Lovell, K.; Materov, I.; Schmidt, P. On the Estimation of Technical Inefficiency in the Stochastic Frontier Production Function Model. J. Econ. 1982, 19, 33–238. [Google Scholar] [CrossRef] [Green Version]
- Schmidt, P. Frontier production functions. Econ. Rev. 1985, 4, 289–328. [Google Scholar] [CrossRef]
- Prata, D.M.; Lima, E.L.; Pintoet, J.C. Nonlinear Dynamic Data Reconciliation in Real Time in Actual Processes. Comput. Aided Chem. Eng. 2009, 27, 47–54. [Google Scholar]
- De Menezes, D.Q.F.; Prata, D.M.; Secchi, A.R.; Pinto, J.C. A review on robust M-estimators for regression analysis. Comput. Chem. Eng. 2021, 147, 107254. [Google Scholar] [CrossRef]
- Poczta, W.; Sredzi, J.; Chenczke, M. Economic Situation of Dairy Farms in Identified Clusters of European Union Countries. Agriculture 2020, 10, 92. [Google Scholar] [CrossRef] [Green Version]
- Alvarez, J.A.; del Corral, D.; Pérez, S.J.A. Does intensification improve the economic efficiency of dairy farms? J. Dairy Sci. 2008, 91, 3693–3698. [Google Scholar] [CrossRef]
- Wilczyński, A.; Koloszycz, E.; Świtlyk, M. Technical efficiency of dairy farms: An empirical study of producers in Poland. Eur. Res. Stud. 2020, 23, 117–127. [Google Scholar] [CrossRef] [Green Version]
- Augère-Granier, M.; EPRS|European Parliamentary Research Service. The EU Dairy Sector. 2018. Available online: https://www.europarl.europa.eu/RegData/etudes/BRIE/2018/630345/EPRS_BRI(2018)630345_EN.pdf (accessed on 4 November 2021).
- European Commission. The Welfare of Cattle kept for Beef Production. 2001. Available online: https://ec.europa.eu/food/system/files/2020-12/sci-com_scah_out54_en.pdf (accessed on 4 November 2021).
- Latruffe, L.; Bravo-Ureta, B.; Carpentier, A.; Desjeux, Y.; Moreira, V. Subsidies and Technical Efficiency in Agriculture: Evidence from European Dairy Farms. Amer. J. Agric. Econ. 2017, 99, 783–799. [Google Scholar] [CrossRef] [Green Version]
- Zhu, X.; Demeter, R.M.; Oude Lansink, A. Technical efficiency and productivity differentials of dairy farms in three EU coutries: The role of CAP subsidies. Agric. Econ. Rev. 2012, 13, 66–92. [Google Scholar]
- Minviel, J.J.; Laure Latruffe, L. Effect of public subsidies on farm technical efficiency: A meta-analysis of empirical results. Appl. Econ. 2017, 49, 213–226. [Google Scholar] [CrossRef]
- Marzec, J.; Pisulewski, A. The effect of CAP subsidies on the technical efficiency of polish dairy farms. Cent. Eur. J. Econ. Model. Econ. 2017, 9, 243–273. [Google Scholar]
- Dong, F.; Hennessy, D.A.; Jensen, H.H.; Volpe, R.J. Technical efficiency, herd size, and exit intentions in U.S. dairy farms. Agric. Econ. 2016, 47, 533–545. [Google Scholar] [CrossRef]
- Demircan, V.; Binici, T.; Zulauf, C.R. Assessing pure technical efficiency of dairy farms in Turkey. Agric. Econ. 2010, 56, 141–148. [Google Scholar] [CrossRef] [Green Version]
Figure 1.
Clustering of dairy producers in the EU in 2016 according to their physical and economic size. Note: PS, physical size; ES, economic size.
Figure 1.
Clustering of dairy producers in the EU in 2016 according to their physical and economic size. Note: PS, physical size; ES, economic size.

Figure 2.
The level of technical efficiency in the EU dairy farms (average of 2004–2019). Note: Bulgaria shows an average for 2007–2019, Croatia shows an average for 2013–2019.
Figure 2.
The level of technical efficiency in the EU dairy farms (average of 2004–2019). Note: Bulgaria shows an average for 2007–2019, Croatia shows an average for 2013–2019.

Figure 3.
Development of technical efficiency between 2004–2019 in the EU general, EU-13, and EU-15 member states. Note: The EU-15 are the old member states, EU-13 are new member states.
Figure 3.
Development of technical efficiency between 2004–2019 in the EU general, EU-13, and EU-15 member states. Note: The EU-15 are the old member states, EU-13 are new member states.

Figure 4.
The level of technical efficiency of the EU dairy farms according to the number of cows (average of 2004–2019). Note: Green numbers represent the number of farms, black numbers are the values of TE.
Figure 4.
The level of technical efficiency of the EU dairy farms according to the number of cows (average of 2004–2019). Note: Green numbers represent the number of farms, black numbers are the values of TE.

Figure 5.
The level of technical efficiency of the EU dairy farms according to dairy subsidies per cow (average of 2004–2019). Note: Green numbers represent the number of farms, black numbers are the values of TE.
Figure 5.
The level of technical efficiency of the EU dairy farms according to dairy subsidies per cow (average of 2004–2019). Note: Green numbers represent the number of farms, black numbers are the values of TE.

Figure 6.
Level of the technical efficiency of the EU dairy farms according to the share of dairy cows (in LU) on total LU (average of 2004–2019). Note: Green numbers represent the number of farms, black numbers are the values of TE.
Figure 6.
Level of the technical efficiency of the EU dairy farms according to the share of dairy cows (in LU) on total LU (average of 2004–2019). Note: Green numbers represent the number of farms, black numbers are the values of TE.


Table 1.
The variables used for the empirical analysis.
| Variable | Definition |
|---|---|
| Cluster analysis | |
| Physical size | Number of LU per farm |
| Economic size | Standard output per farm |
| SFA | |
| Output | Cow’s milk production per farm (€) |
| Capital | Depreciation of fixed assets + contract work (€) |
| Labour | Annual work unit (AWU) |
| Land | Total utilised agricultural area (ha) |
| Material | Feed for grazing livestock (€) |
| Linear regression model | |
| TE | Technical efficiency, calculated by SFA |
| H1 | Number of dairy cows (LU) |
| H2 | Subsidies dairying per LU |
| H3 | Milk yield per cow (kg) |
| H4 | Share of dairy cows on total LU |
| H5 | Share of milk production on total output |
Table 2.
The estimated parameters of the production function of the EU milk farms.
| Variables | Coefficient | SE | p > z | Variables | Coefficient | SE | p > z |
|---|---|---|---|---|---|---|---|
| β0 (constant) | −0.138 | 0.016 | 0.000 | β1β2 | −0.191 | 0.040 | 0.000 |
| β1 (land) | 0.256 | 0.026 | 0.000 | β1β3 | −0.128 | 0.028 | 0.000 |
| β2 (labour) | 0.302 | 0.035 | 0.000 | β1β4 | 0.136 | 0.037 | 0.000 |
| β3 (capital) | 0.322 | 0.016 | 0.000 | β2β3 | 0.079 | 0.029 | 0.006 |
| β4 (material) | 0.267 | 0.027 | 0.000 | β2β4 | −0.011 | 0.051 | 0.827 |
| β5 (time) | 0.022 | 0.001 | 0.000 | β3β4 | −0.083 | 0.029 | 0.005 |
| β11 | 0.102 | 0.026 | 0.000 | β1β5 | −0.001 | 0.002 | 0.620 |
| β22 | 0.118 | 0.075 | 0.115 | β2β5 | 0.003 | 0.003 | 0.252 |
| β33 | 0.158 | 0.027 | 0.000 | β3β5 | −0.003 | 0.002 | 0.123 |
| β44 | 0.159 | 0.068 | 0.000 | β4β5 | −0.015 | 0.002 | 0.000 |
| β55 | 0.001 | 0.000 | 0.008 | lambda (λ) | 0.855 | 0.010 | 0.000 |
Table 3.
The hypothesis testing of the relationship between indicators of milk production of the EU milk farm and the calculated technical efficiency.
Table 3.
The hypothesis testing of the relationship between indicators of milk production of the EU milk farm and the calculated technical efficiency.
| Hypothesis | Linear Regression Coefficient | Significance | |
|---|---|---|---|
| H1 | TE and number of cows (LU) | −0.0002932 | 0.000 |
| H2 | TE and subsidies dairying per LU | 0.0000889 | 0.000 |
| H3 | TE and milk yield | 5.31 × 10⁻⁷ | 0.798 |
| H4 | TE and specialisation (share of dairy cows (LU) on total LU) | −0.3009401 | 0.000 |
| H5 | TE and specialisation (share of milk production on total output) | −3.09 × 10⁻⁸ | 0.110 |
Note: significance 0.000–0.0100: the variable has a significant impact on TE; where >0.100, the impact of the variable on TE is considered as insignificant.
Publisher’s Note: MDPI stays neutral with regard to jurisdictional claims in published maps and institutional affiliations. |
© 2021 by the authors. Licensee MDPI, Basel, Switzerland. This article is an open access article distributed under the terms and conditions of the Creative Commons Attribution (CC BY) license (https://creativecommons.org/licenses/by/4.0/).
Share and Cite
MDPI and ACS Style
Náglová, Z.; Rudinskaya, T. Factors Influencing Technical Efficiency in the EU Dairy Farms. Agriculture 2021, 11, 1114. https://0-doi-org.brum.beds.ac.uk/10.3390/agriculture11111114
AMA Style
Náglová Z, Rudinskaya T. Factors Influencing Technical Efficiency in the EU Dairy Farms. Agriculture. 2021; 11(11):1114. https://0-doi-org.brum.beds.ac.uk/10.3390/agriculture11111114
Chicago/Turabian StyleNáglová, Zdeňka, and Tamara Rudinskaya. 2021. "Factors Influencing Technical Efficiency in the EU Dairy Farms" Agriculture 11, no. 11: 1114. https://0-doi-org.brum.beds.ac.uk/10.3390/agriculture11111114
Note that from the first issue of 2016, this journal uses article numbers instead of page numbers. See further details here.