Article

Study on Plant Growth and Nutrient Uptake under Different Aeration Intensity in Hydroponics with the Application of Particle Image Velocimetry

1
United Graduate School of Agricultural Sciences, Tottori University, Tottori 680-8550, Japan
2
Faculty of Agriculture, Tottori University, Tottori 680-8553, Japan
3
Graduate School of Sustainability Science, Tottori University, Tottori 680-8550, Japan
4
Faculty of Agriculture, Yamaguchi University, Yamaguchi 753-8515, Japan
*
Author to whom correspondence should be addressed.
Submission received: 18 October 2021 / Revised: 12 November 2021 / Accepted: 12 November 2021 / Published: 14 November 2021
(This article belongs to the Special Issue Image Analysis Techniques in Agriculture)

Abstract

:
Aeration is considered beneficial for hydroponics. However, little information is available on the effects of aeration, and even less on solutions that use bubble flow and their agronomic effects. In this study, the effects of aeration intensity on plants were studied through cultivation experiments and flow field visualization. It was found that the growth of plants did not increase linearly with an increase in aeration intensity. From the results of this study, when the aeration intensity was within the low range (0.07–0.15 L·L−1 NS·min−1), increasing the aeration intensity increased the plant growth. However, after the aeration intensity reached a certain extent (0.15–1.18 L·L−1 NS·min−1), some indicators did not change significantly. When the aeration intensity continued to increase (1.18–2.35 L·L−1 NS·min−1), growth began to decrease. These results show that for increasing dissolved oxygen and promoting plant growth, the rule is not “the higher the aeration intensity, the better”. There is a reasonable range of aeration intensity within which crops grow normally and rapidly. In addition, increasing the aeration intensity means increasing energy utilization and operating costs. In actual hydroponics production, it is very important to find a reasonable aeration intensity range.

1. Introduction

Soil is recognized as the dominant cultivation substrate for crop production, but it is not always the superior medium due to environmental deterioration and man-made overuse in some areas. This is particularly true in certain arid lands, where problems such as drought and soil degradation occur [1]. For optimal plant growth, the roots need an environment where the necessary nutrients, water, oxygen, and appropriate temperature are provided [2]. Hydroponics was developed as a cultivation system that provides a controllable environment for plant growth in soil. In addition, it can protect crops in areas with soils that are entirely unsuitable for cultivation (coastal dune areas, arid and semi-arid land, etc.), ensuring ordered growth and harvest time, high yield and quality, and efficient use of the water and nutrients [3].
However, hydroponics has more environmental control requirements for cultivation substrates than for soil cultures [4]. It is necessary to make the physical and chemical environment (such as EC, pH, temperature, dissolved oxygen, etc.) of the hydroponic nutrient solution as stable as possible in a certain range to ensure the growth of plants [5]. In particular, for the oxygen supply, the nutrient solution acting as the substrate of the hydroponic culture does not have soil pores that can ensure oxygen for root respiration. In hydroponics, aeration and other means are needed to ensure that the dissolved oxygen content of the nutrient solution is high enough to prevent root browning and rot [6].
Jackson [7] and Morimoto et al. [8] have reported that hydroponics systems sometimes present serious problems via inadequate aeration of the plants, since the immersion of roots in stagnant water reduces the diffusion of oxygen to the roots. In addition, scholars have described the effects of dissolved oxygen of the nutrient solution in hydroponics for some species. Gislerod et al. [9] studied the effects of dissolved oxygen on root development and plant growth, and evaluated the activity of alcohol dehydrogenase in roses. Tachibana [10] studied the effect of dissolved oxygen on mitigating blossom-end rot in the tomato. Yoshida et al. [11] studied the efficiency of aeration on productivity, which they demonstrated in the cucumber. Goto et al. [12] discussed the effect of aeration on lettuce grown in a floating hydroponic system.
From the previous research, it can be seen that there is no doubt that the concentration of dissolved oxygen affects the growth of plants with hydroponics. At the same time, though, aeration not only increases dissolved oxygen, but also promotes the flow and circulation of the nutrient solution by bubble flow. Nutrient solution cycling is considered to be an effective way to prevent nutrient depletion in the root zone [13]. Previous studies have conducted in-depth research on the increase in dissolved oxygen caused by aeration. However, there is no explanation for the effect of nutrient solution flow caused by aeration for plants with hydroponics. Aeration as a means of controlling the environment of a hydroponic nutrient solution, one that can increase dissolved oxygen concentrations and promote solution circulation, needs to be further studied. Reasonable environmental control measures not only increase crop yield, but also save operating costs [5]. For hydroponic production, it is indispensable to study the effect of aeration rate on plant growth.
In this study, a cultivation experiment was carried out under different aeration rates, in order to explore the effects of aeration rate on the growth and nutrient uptake of plants in hydroponics. In addition, in order to investigate the effect of aeration on the flow and circulation of the nutrient solution, particle image velocimetry (PIV) technology was used to visualize the flow field of bubble flow produced by aeration. Combined with cultivation and flow visualization experiments, the effect of aeration on plant growth in hydroponics is explained.

2. Materials and Methods

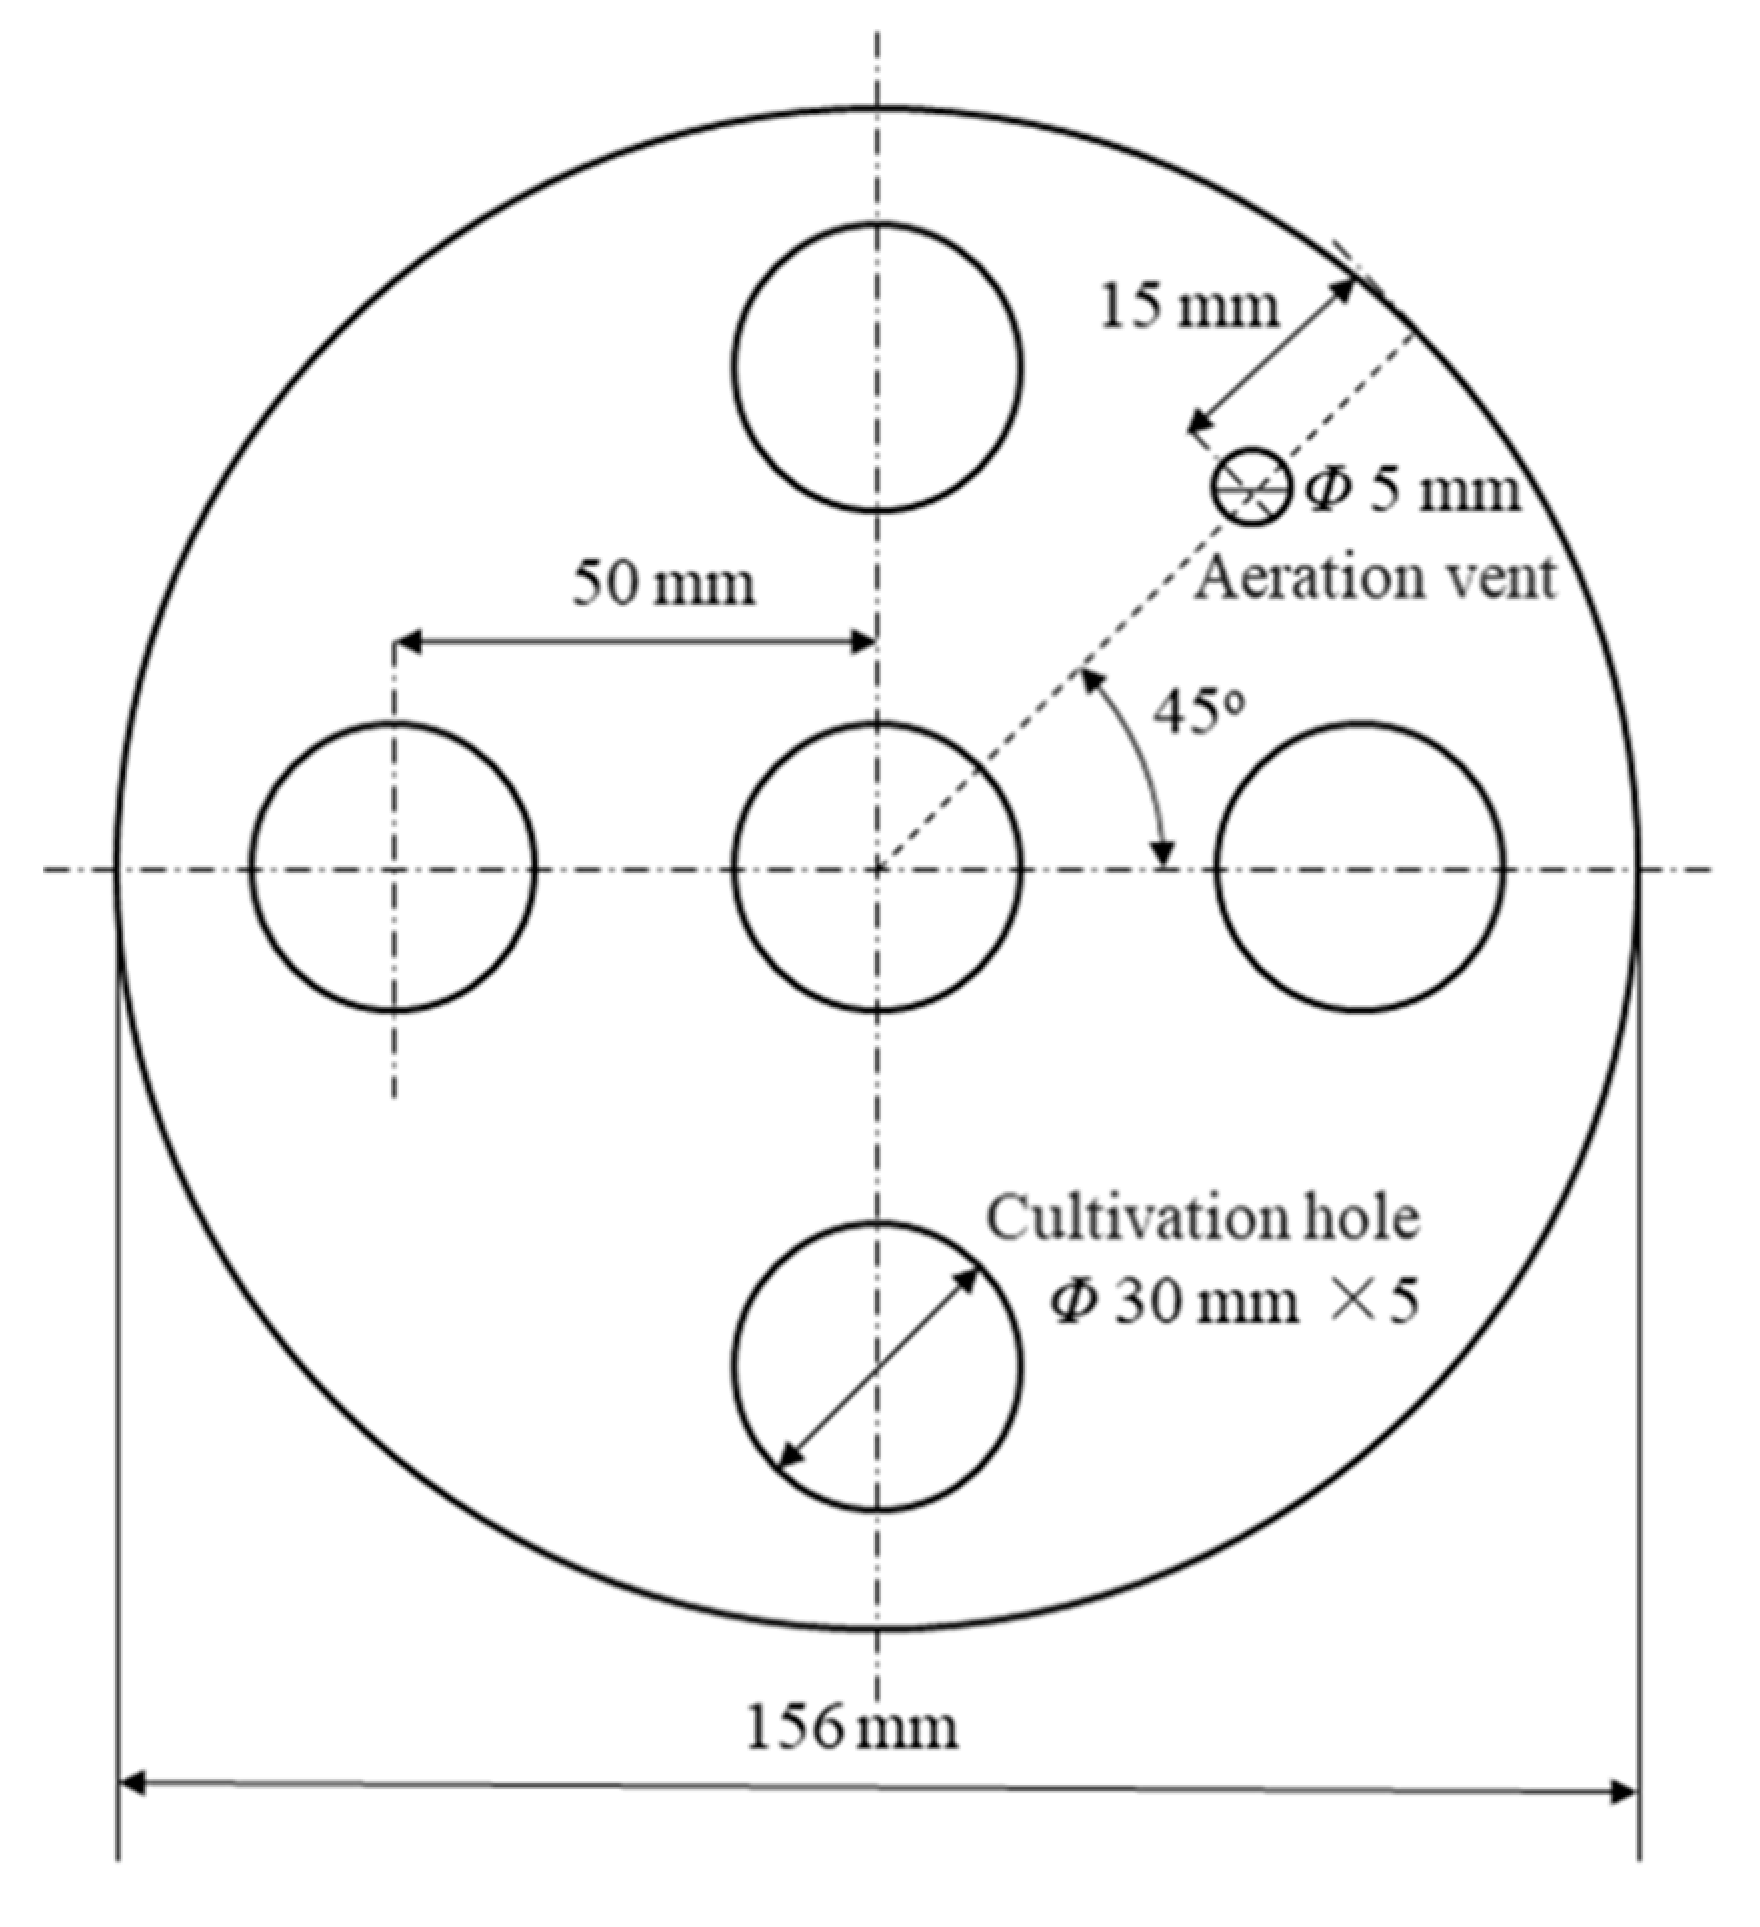
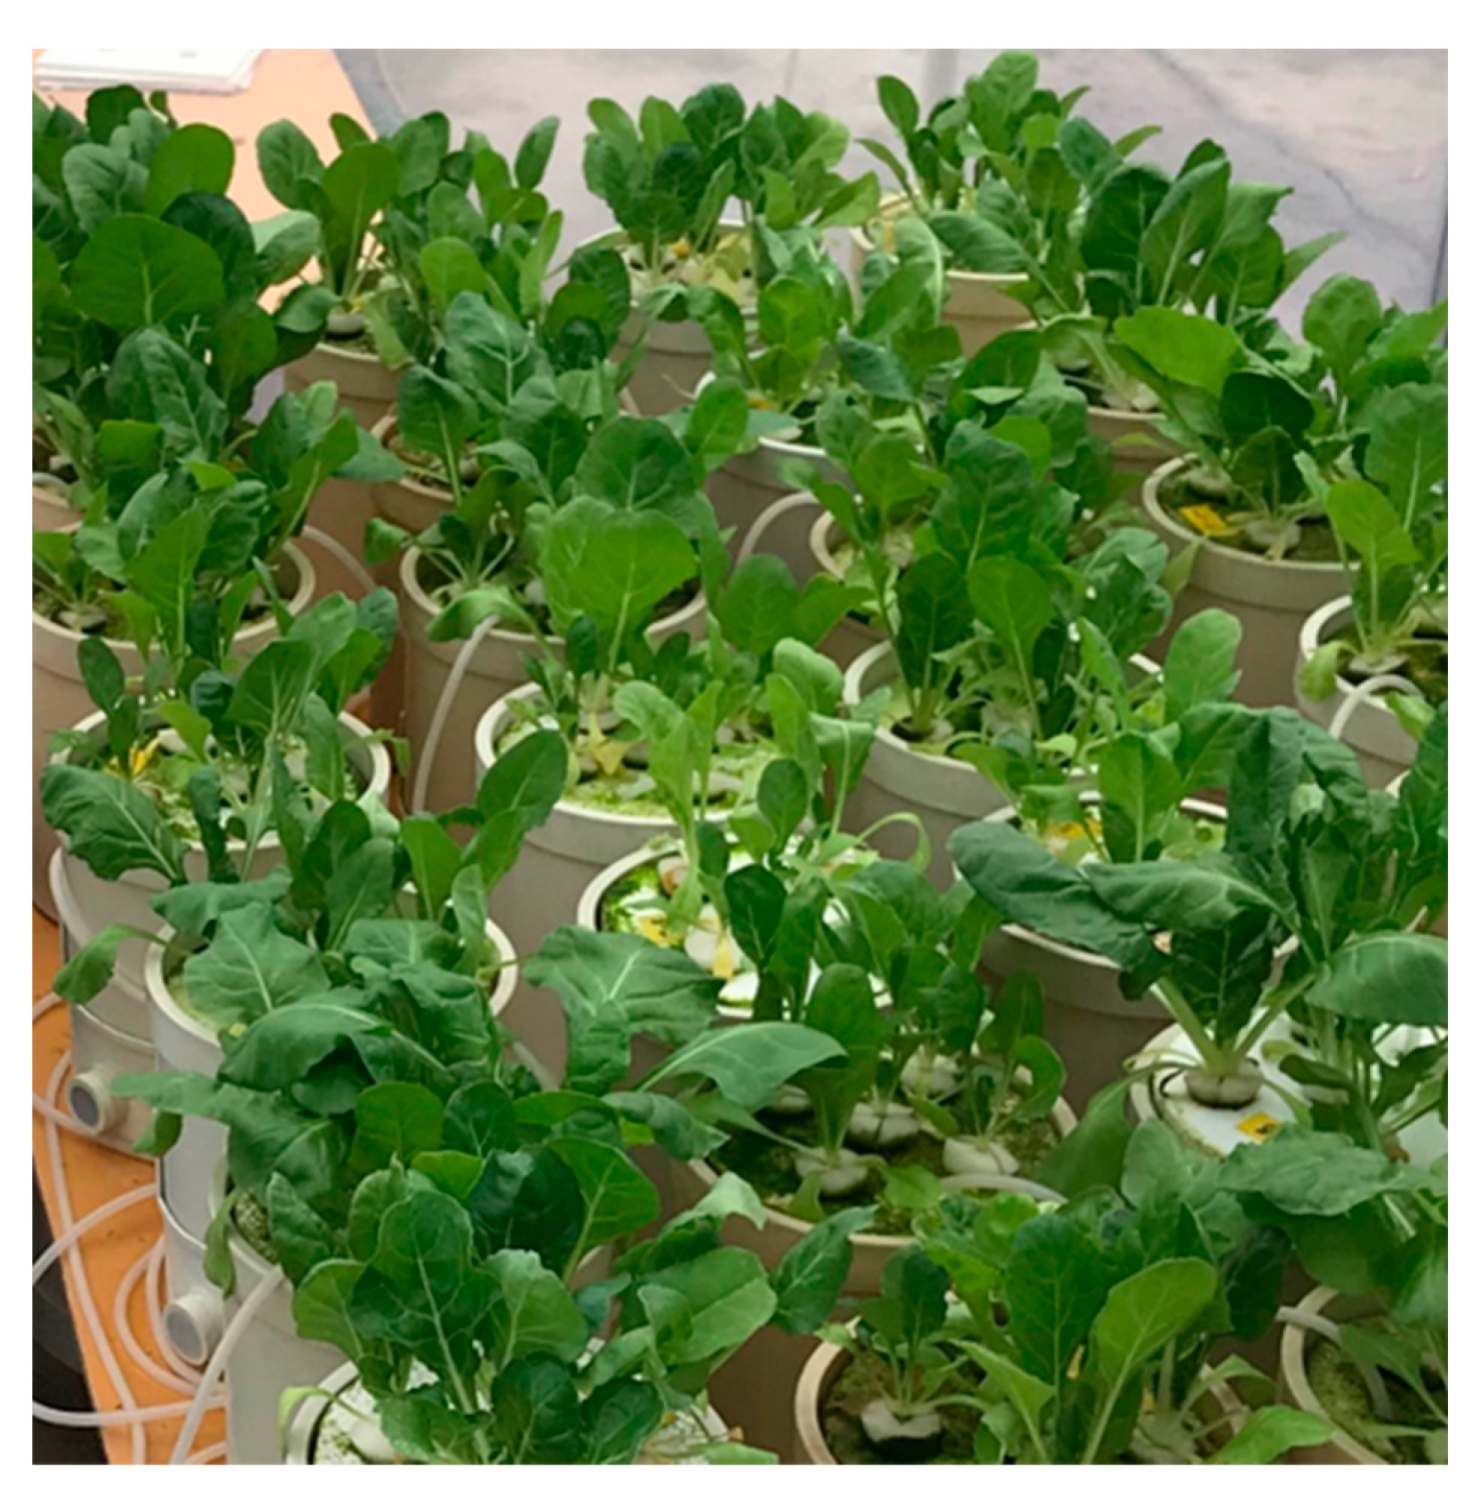
2.1. Cultivation and Measurement

The cultivation experiment was carried out in the indoor natural lighting greenhouse of the Plant Nutrient Laboratory of Tottori University (35.51469° N, 134.17038° E). The greenhouse environmental data (Supplementary Data Table S1) were recorded during the cultivation period from 8 March 2021 to 12 April 2021.
In this study, MINA fertilizer developed by the Plant Nutrient Laboratory of Tottori University was used. The concentration and composition of the standard solution of MINA fertilizer are shown in Table 1. The plants used in this study were Swiss chard (Beta vulgaris L. spp. cicla cv. Seiyou Shirokuki). Seeds of Swiss chard were sown in vermiculite. When the first true leaves appeared, the seedlings were transplanted into plastic containers (580 mm length × 370 mm width × 150 mm height) filled with 30 L of the diluted nutrient solution (i.e., 0.5 concentration of MINA fertilizer solution, and pH was adjusted to 5.0 by adding sulfuric acid (H2SO4) solution). The seedlings were grown for one week. On 8 March, the seedlings were transplanted from the plastic containers into cultivation containers with different aeration rates. The cultivation container was a bucket with a diameter of 160 mm and a depth of 200 mm. Then, 3.4 L of the standard solution of MINA fertilizer was poured (pH was adjusted to 5.0 by adding sulfuric acid (H2SO4) solution) into each cultivation container. A cultivation plate with a depth of 30 mm was placed above the cultivation container. Each cultivation plate had five cultivation holes and one aeration vent, as shown in Figure 1. Then, air pumps (AP-40P, Yasunaga Air Pump Inc., Tokyo, Japan) and spherical aerators (i.e., 25 mm diameter aerator stone) were used to supply different aeration rates of 0.25, 0.50, 1.00, 2.00, 4.00, and 8.00 L·min−1 to each cultivation container. Each treatment (aeration rate) was conducted with four replications (cultivation containers), and five plants were planted in each cultivation container. In order to avoid the influence of temperature, wind speed, and light in different specific areas of the greenhouse on the experimental results, the buckets with different aeration rates were randomly placed in different positions and exchanged with each other irregularly from time to time, and the nutrient solution was changed every 7 days. A picture of the cultivation experiment is shown in Figure 2.
In order to describe the effect of different aeration rates on the dissolved oxygen (DO) content of a nutrient solution in a cultivation container, the dissolved oxygen contents of the nutrient solution under different aeration rates were measured by a DO meter (OM-71-L1, HORIBA, Tokyo, Japan) before cultivation at the greenhouse. It should be mentioned that moving the cultivation plate will disturb the nutrient solution, while opening the cultivation plate will increase the contact area between the nutrient solution and air, affecting the dissolved oxygen concentration. Opening or moving the cultivation plate artificially or irregularly will thus affect the experimental results, because it introduces factors other than aeration rate. Therefore, in order to avoid affecting the results at all, the cultivation plate was not opened, and the sensor was not irregularly inserted into the nutrient solution to measure the physical and chemical properties of the nutrient solution during the cultivation period.
The plants were harvested on 12 April and divided into shoots and roots. Then, according to the method and equipment described in the literature [15], the leaf area, root length and root surface area, dry weight, N (nitrogen) content, and N uptake of the plants grown under different aeration rates were measured and calculated, respectively. N use efficiency was calculated by N uptake divided by the dry weight of a whole plant.

2.2. Data Analysis

Statistical analysis software (SPSS 25, IBM, New York, NY, USA) was used to analyze the data. The statistical analysis methods used in this study were one-way analysis of variance followed by Duncan’s multiple range test at p ≤ 0.05. The statistical results were expressed as means ± standard error.

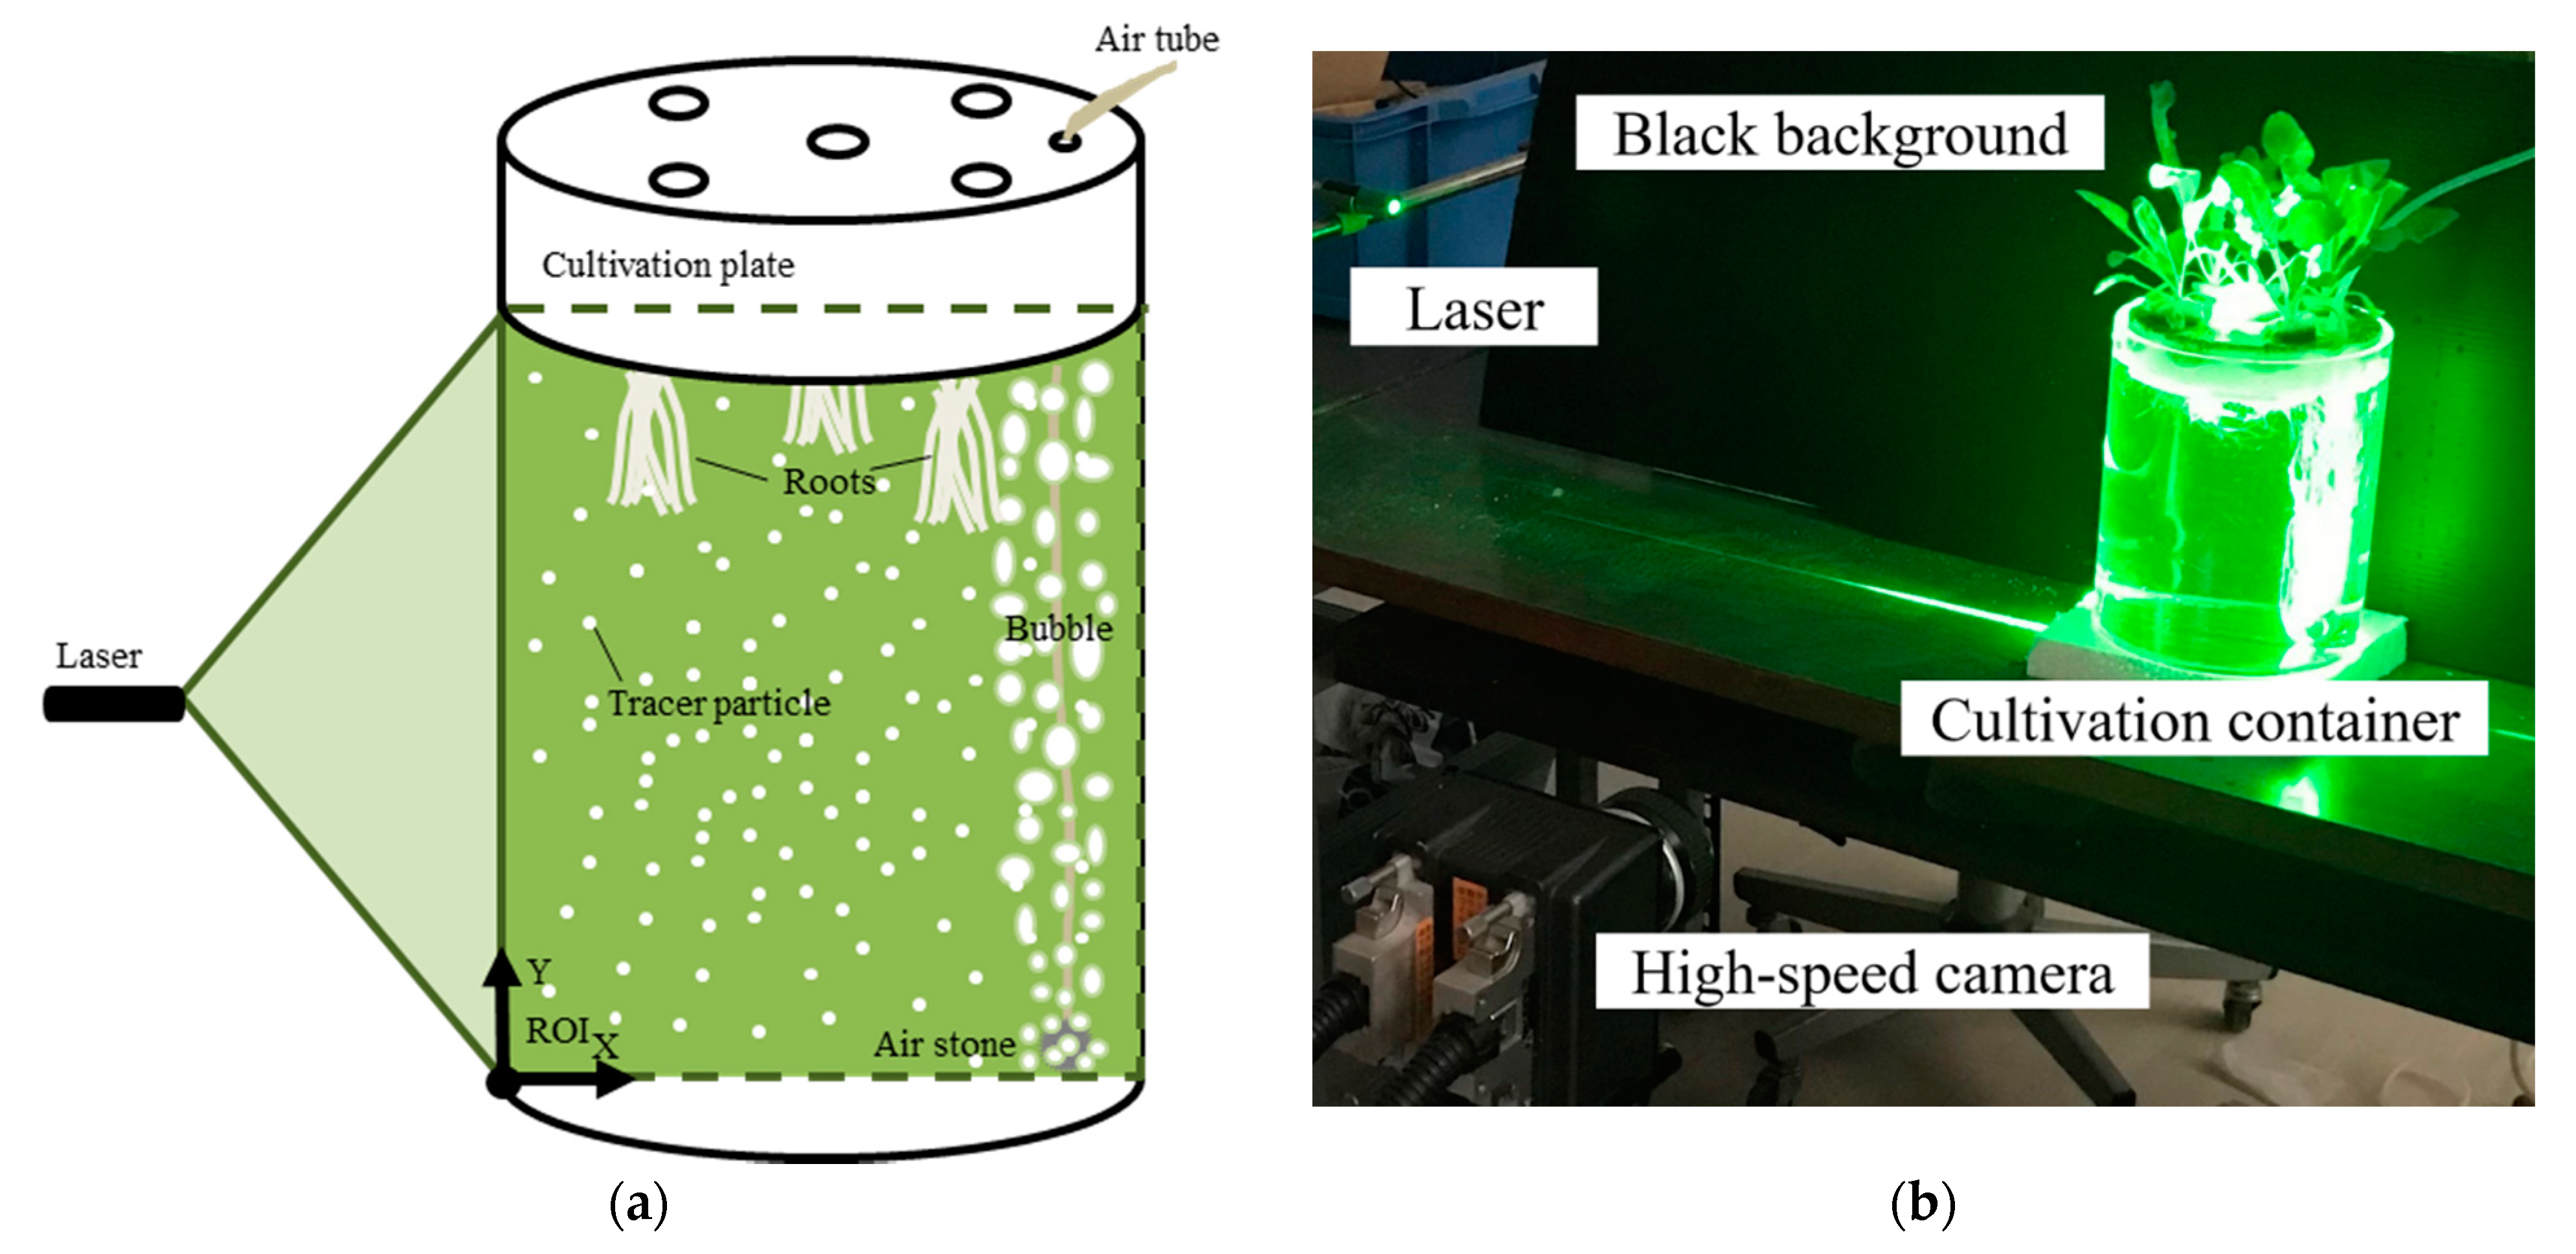
2.3. Visualization of the Bubble Flow Field

Particle image velocimetry (PIV) is a non-intrusive, optical laser measurement technique for flow visualization. In this study, a PIV system [16] was used to accurately observe the flow field of bubble flow in hydroponics. A colorless and transparent acrylic bucket with the same size as the cultivation container described in Section 2.1 was made. The aeration rate in the bucket was supplied by an air pump, and the aeration rate (0.25, 0.50, 1.00, 2.00, 4.00, or 8.00 L·min−1) in the bucket was controlled by the accessory valve. The plants harvested in this study were used to observe the flow field. The plants growing under different aeration rates were placed in the corresponding aeration rate to observe the bubble flow field. As shown in Figure 3, a laser (GPOL-5W, Japan Laser) was arranged on the left side of the acrylic bucket, aimed toward the middle section. A few tracer particles (density: 1.01 g·cm−1, average particle diameter: 0.55 mm) (HP20, DIAION) were added into the bucket, which could be illuminated by the laser light sheet, and the motion of the particles was recorded using a high-speed camera (FASTCAM-MAX 120KC, Photron) with a resolution of 1024 × 1024 pixels at 60 frames per second. The region of interest (ROI) is shown in Figure 3a, and the lower left corner is its coordinate origin. The bubble flow fields with plants under different aeration rates were photographed for 10 s each. The PIV flow field calculation software (PIVlab2.40 [17] built into MATLAB, MathWorks) was used to batch-process the images continuously collected for each condition. Based on the instantaneous picture of 600 continuous bubble flow fields, the mean velocity distribution of each flow field was obtained. Mean velocity distribution maps of different aeration rates and hydroponic cultivation results were used to explain the effect of aeration rate on plant growth and nutrient uptake.

2.4. Definition of Aeration Intensity in This Study

For different sizes of cultivation containers, the effect of the same aeration rate (L·min−1) may be inconsistent. Therefore, considering the generality of the results, the authors introduce a new index to describe the aeration intensity, not only the aeration rate.
A i = Q V
where Ai is the aeration intensity (L·L−1 NS (nutrient solution)·min1), Q is the aeration rate (L·min−1), and V is the volume of the nutrient solution in the cultivation container (L). As shown in Table 2, the aeration rate set in this study was converted to aeration intensity.

3. Results

3.1. Effect of Aeration Intensity on Dissolved Oxygen Concentration and Saturation

In order to describe the effect of aeration intensity on the dissolved oxygen content of a nutrient solution in a cultivation container, the dissolved oxygen content of the nutrient solution under different aeration intensities was measured before cultivation.
The DO concentration under different aeration rates is shown in Figure 4a. There was no significant difference in DO concentration among the 0.07–0.59 L·L−1 NS·min−1 and 2.35 L·L−1 NS·min−1 aeration intensity. For the 0.29 to 0.59 L·L−1 NS·min−1 and the 0.59 to 1.18 L·L−1 NS·min−1 aeration intensity, the DO concentration increased with increasing aeration intensity. There was no significant difference in DO concentration among the 0.59–2.35 L·L−1 NS·min−1 aeration intensity. It can be seen from these results that the DO concentration increased significantly with the increase in aeration intensity in the lower range (0.07–0.59 L·L−1 NS·min−1). However, after reaching a certain range (0.59–2.35 L·L−1 NS·min−1), the effect of increasing aeration intensity on the DO concentration was negligible. The DO saturation under different aeration intensities is shown in Figure 4b. For the 0.07 to 0.15 L·L−1 NS·min−1 aeration intensity, the DO saturation increased with increasing aeration intensity. There was no significant difference in DO saturation between the 0.15 and 0.29 L·L−1 NS·min−1 aeration intensity. For the 0.29–1.18 L·L−1 NS·min−1 aeration intensity, the DO saturation increased with increasing aeration intensity. There was no drastic difference in DO saturation between the 1.18 and 2.35 L·L−1 NS·min−1 aeration intensity.

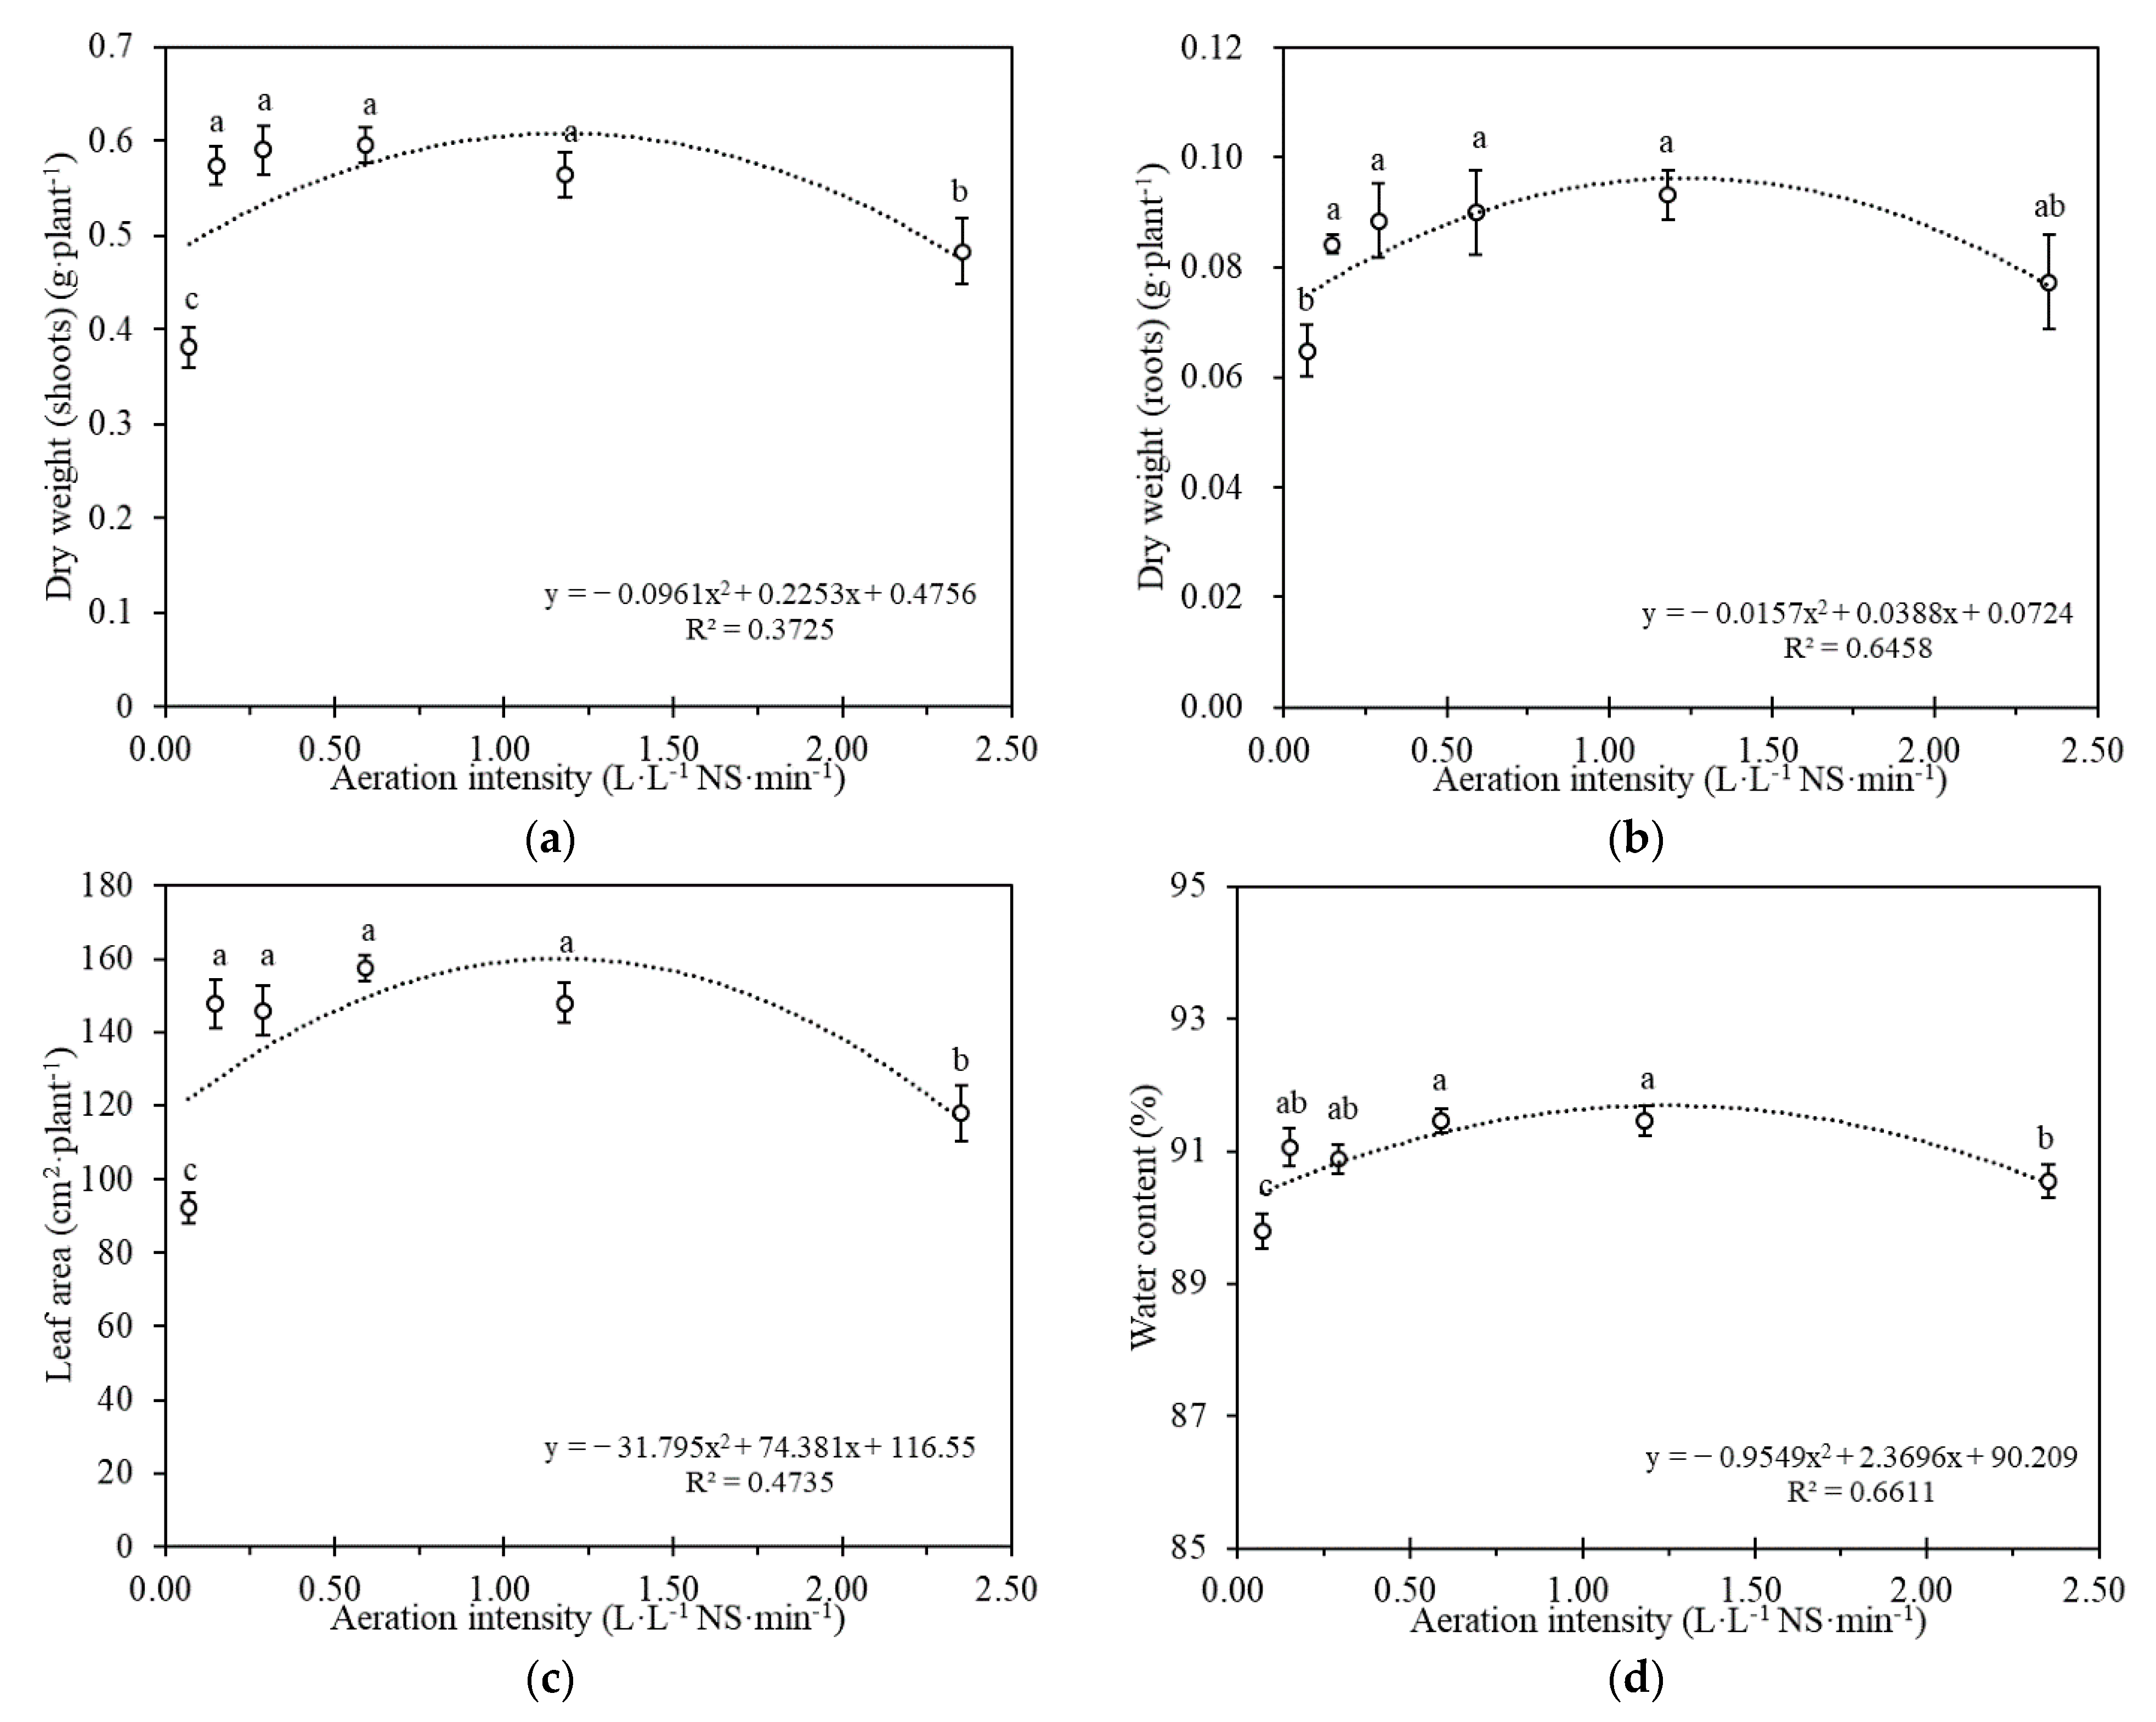
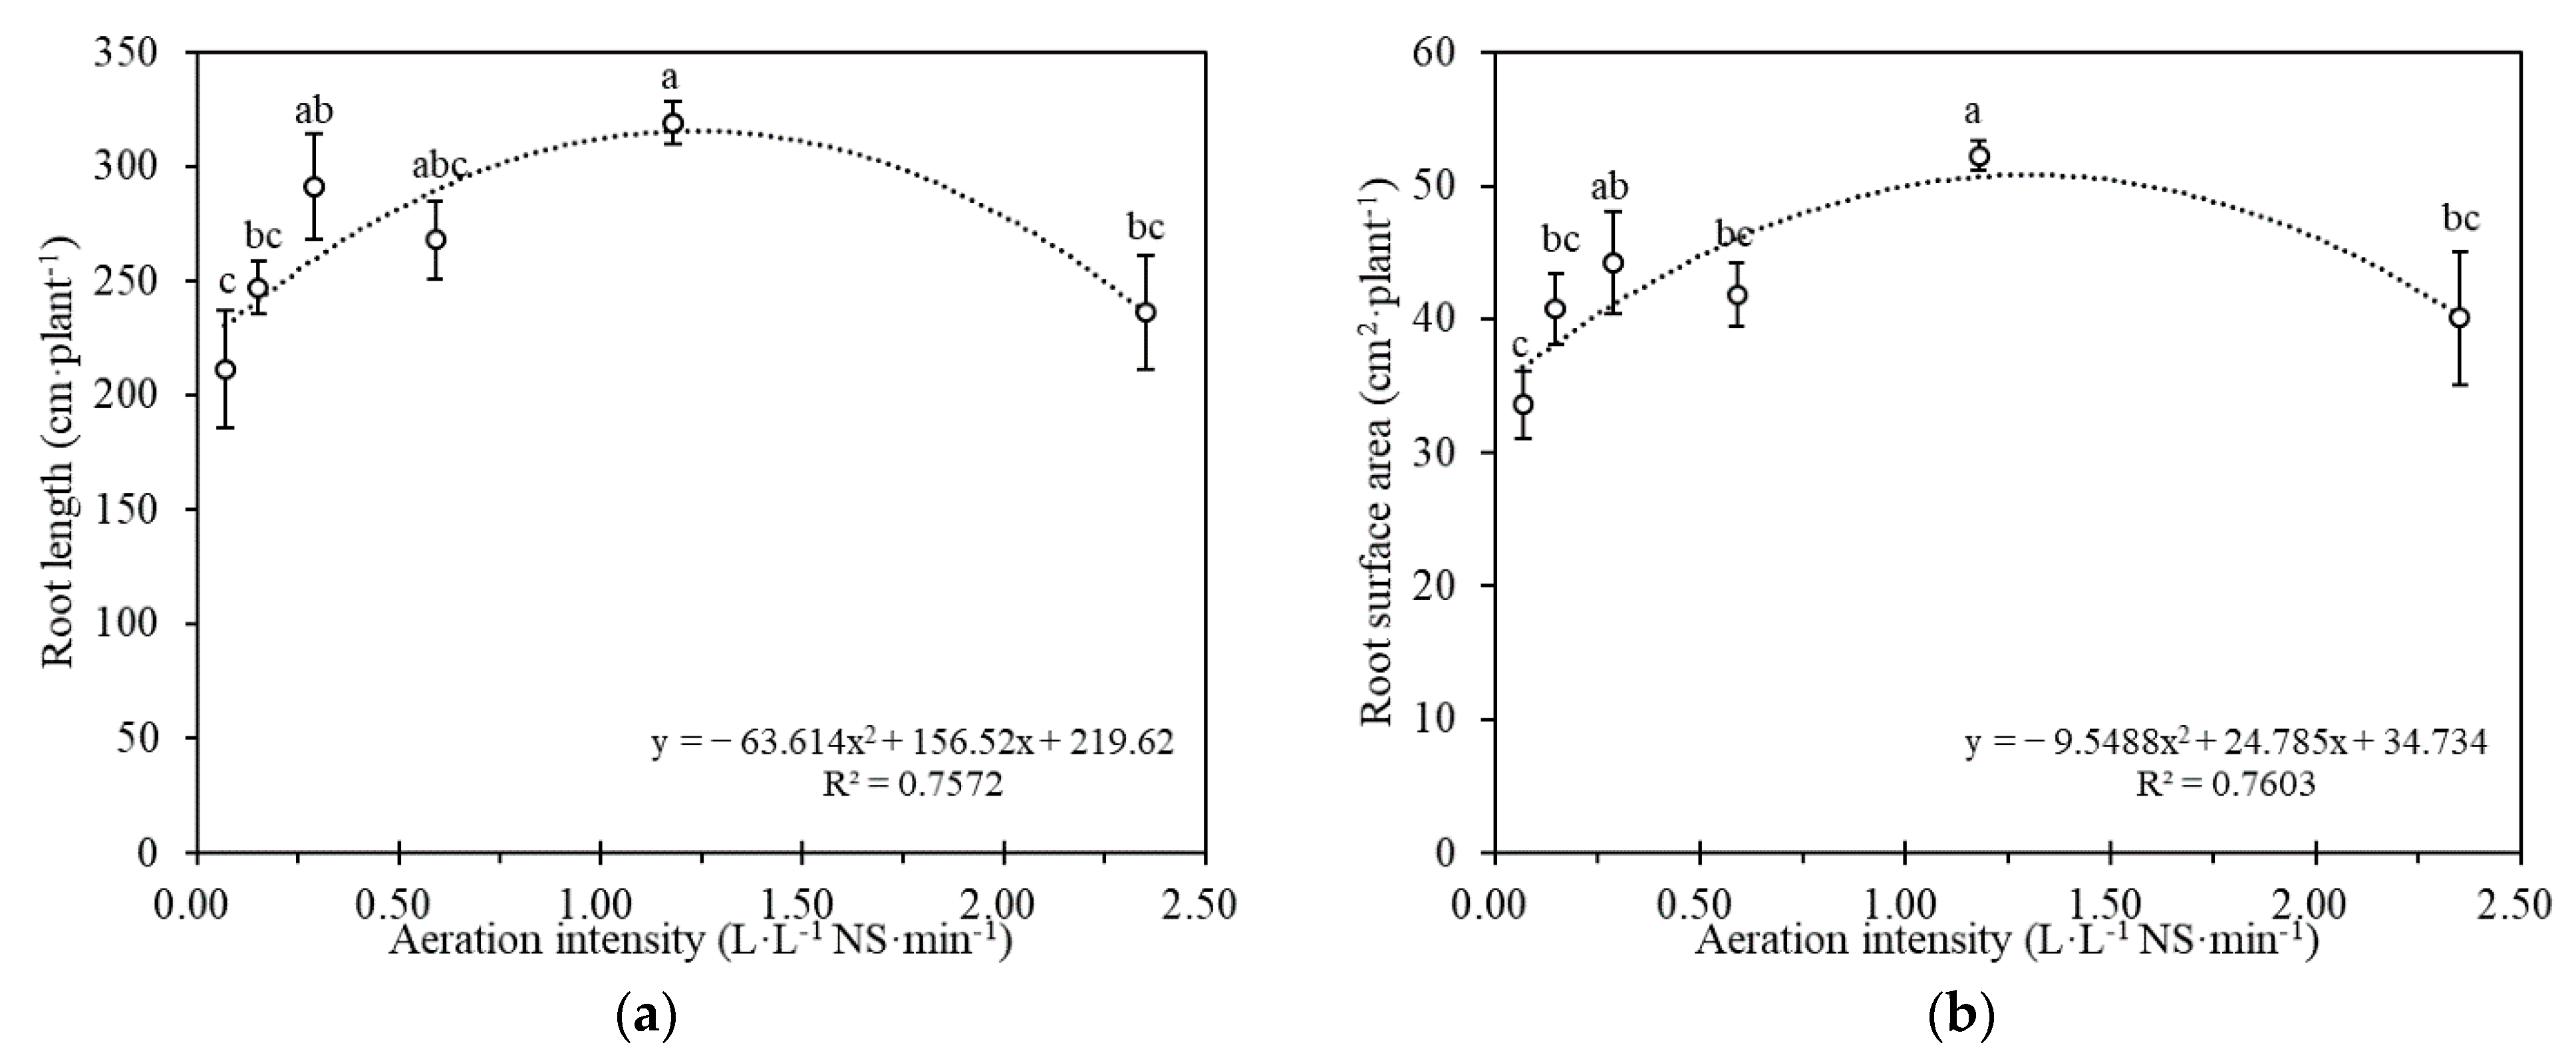
3.2. Effect of Aeration Intensity on Plant Growth and Root Morphology

As basic indexes of plant growth, in discussing whether a treatment has an impact on the growth of plants, it is impossible to ignore the dry weight, leaf area, and water content. The dry weight, leaf area, and water content of plants under different aeration intensities are shown in Figure 5. The changing trend of these growth indexes with the increase in aeration intensity is very similar. For the 0.07–0.15 L·L−1 NS·min−1 aeration intensity, these growth indexes increased with increasing aeration intensity. There was no significant difference in these growth indexes among the 0.15–1.18 L·L−1 NS·min−1 aeration intensity. For the 1.18 to 2.35 L·L−1 NS·min−1 aeration intensity, these growth indexes decreased with increasing aeration intensity. These growth indexes were lowest when the aeration intensity was 0.07 L·L−1 NS·min−1 and highest under 0.59 L·L−1 NS·min−1.
The root lengths and root surface area of plants grown under the different aeration intensities are shown in Figure 6a. Roots are the primary plant part responsible for nutrient uptake. Nutrient uptake depends on the root length and root surface area. For the 0.07 to 1.18 L·L−1 NS·min−1 aeration intensity, the root length and root surface area increased with the increasing aeration intensity. For the 1.18 to 2.35 L·L−1 NS·min−1 aeration intensity, the root length and root surface area decreased with increasing aeration intensity. The root length and root surface area were lowest when the aeration intensity was 0.07 L·L−1 NS·min−1 and highest when it was 1.18 L·L−1 NS·min−1.

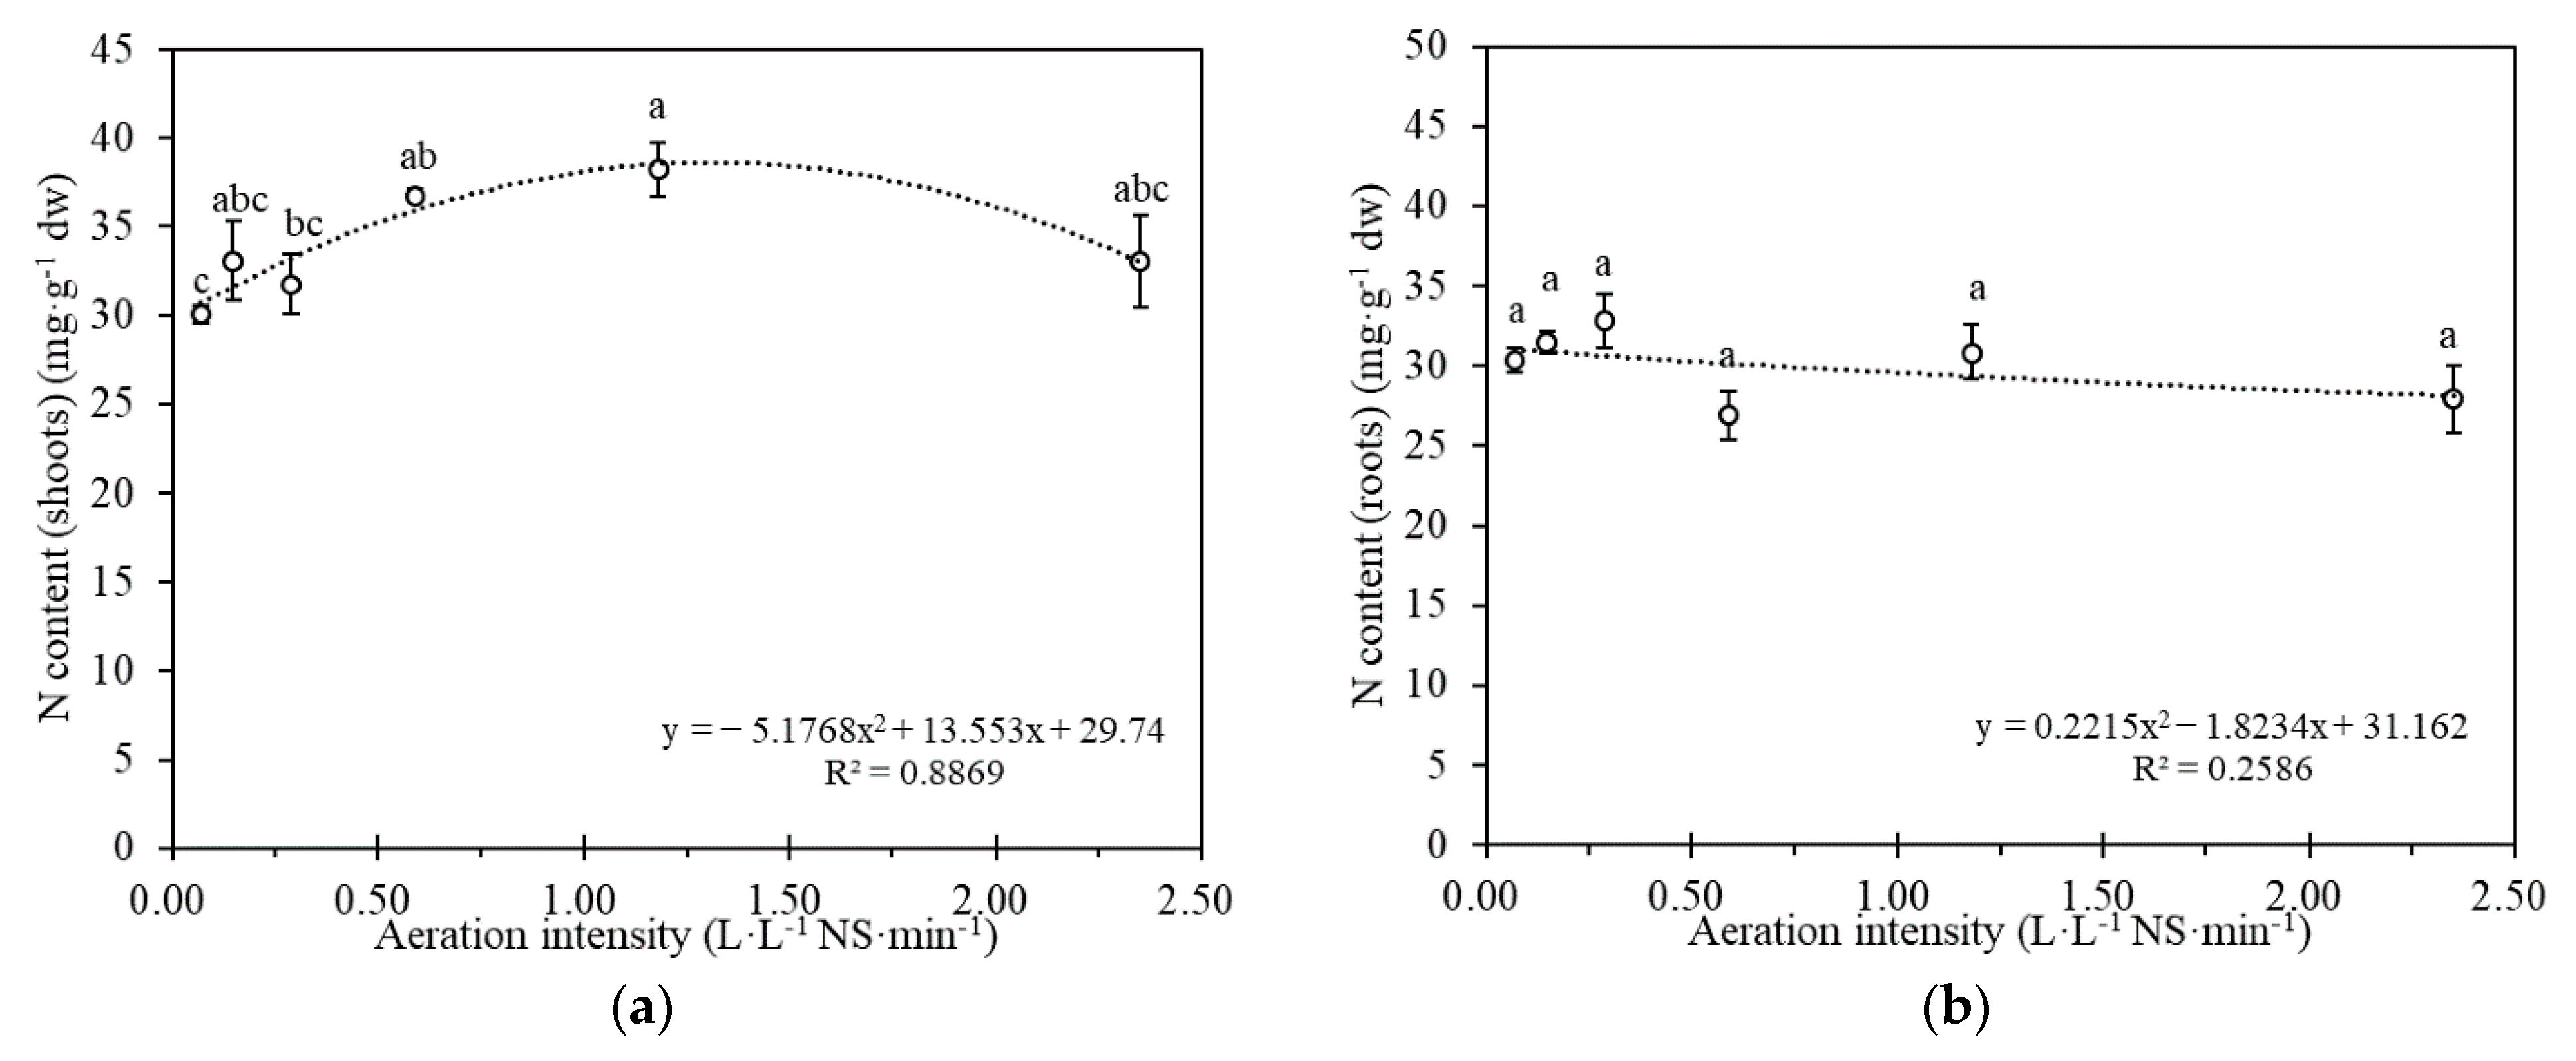
3.3. Effect of Aeration Intensity on N Content, N Uptake, and N Use Efficiency in Plants

N is the most important nutrient, and plants absorb more N than any other element. N is crucial to ensure plant health because it is essential for the formation of proteins. In this study, the effect of aeration intensity on the N content and uptake of plants was investigated. The nitrogen content of the shoots under the different aeration intensities is shown in Figure 7a. For the 0.07 and 1.18 L·L−1 NS·min−1 aeration intensity, the N content of the shoots increased with increasing aeration intensity. The N content of the shoots was lowest when the aeration intensity was 0.07 L·L−1 NS·min−1 and highest when it was 1.18 L·L−1 NS·min−1. For the 1.18 to 2.35 L·L−1 NS·min−1 aeration intensity, the N content decreased with increasing aeration intensity. The N content of the roots under the different aeration intensities is shown in Figure 7b. There was no significant difference in the nitrogen content of the roots according to the aeration intensity in this study.
The N uptake by the plants grown under the different aeration intensities is shown in Figure 7c. For the 0.07–0.15 L·L−1 NS·min−1 aeration intensity, the N uptake increased with the increasing aeration intensity. There was no significant difference in nitrogen uptake between the 0.15–0.29 and 0.59–1.18 L·L−1 NS·min−1 aeration intensity. For the 1.18 to 2.35 L·L−1 NS·min−1 aeration intensity, the N uptake decreased with increasing aeration intensity. The N use efficiency of the plants grown under the different aeration intensities is shown in Figure 7d. For the 0.07–0.15 L·L−1 NS·min−1 aeration intensity, the N use efficiency decreased with the increasing aeration intensity. There was no significant difference in nitrogen uptake between the 0.15–0.29 and 0.59–1.18 L·L−1 NS·min−1 aeration intensity. For the 1.18 to 2.35 L·L−1 NS·min−1 aeration intensity, the N use efficiency increased with increasing aeration intensity.

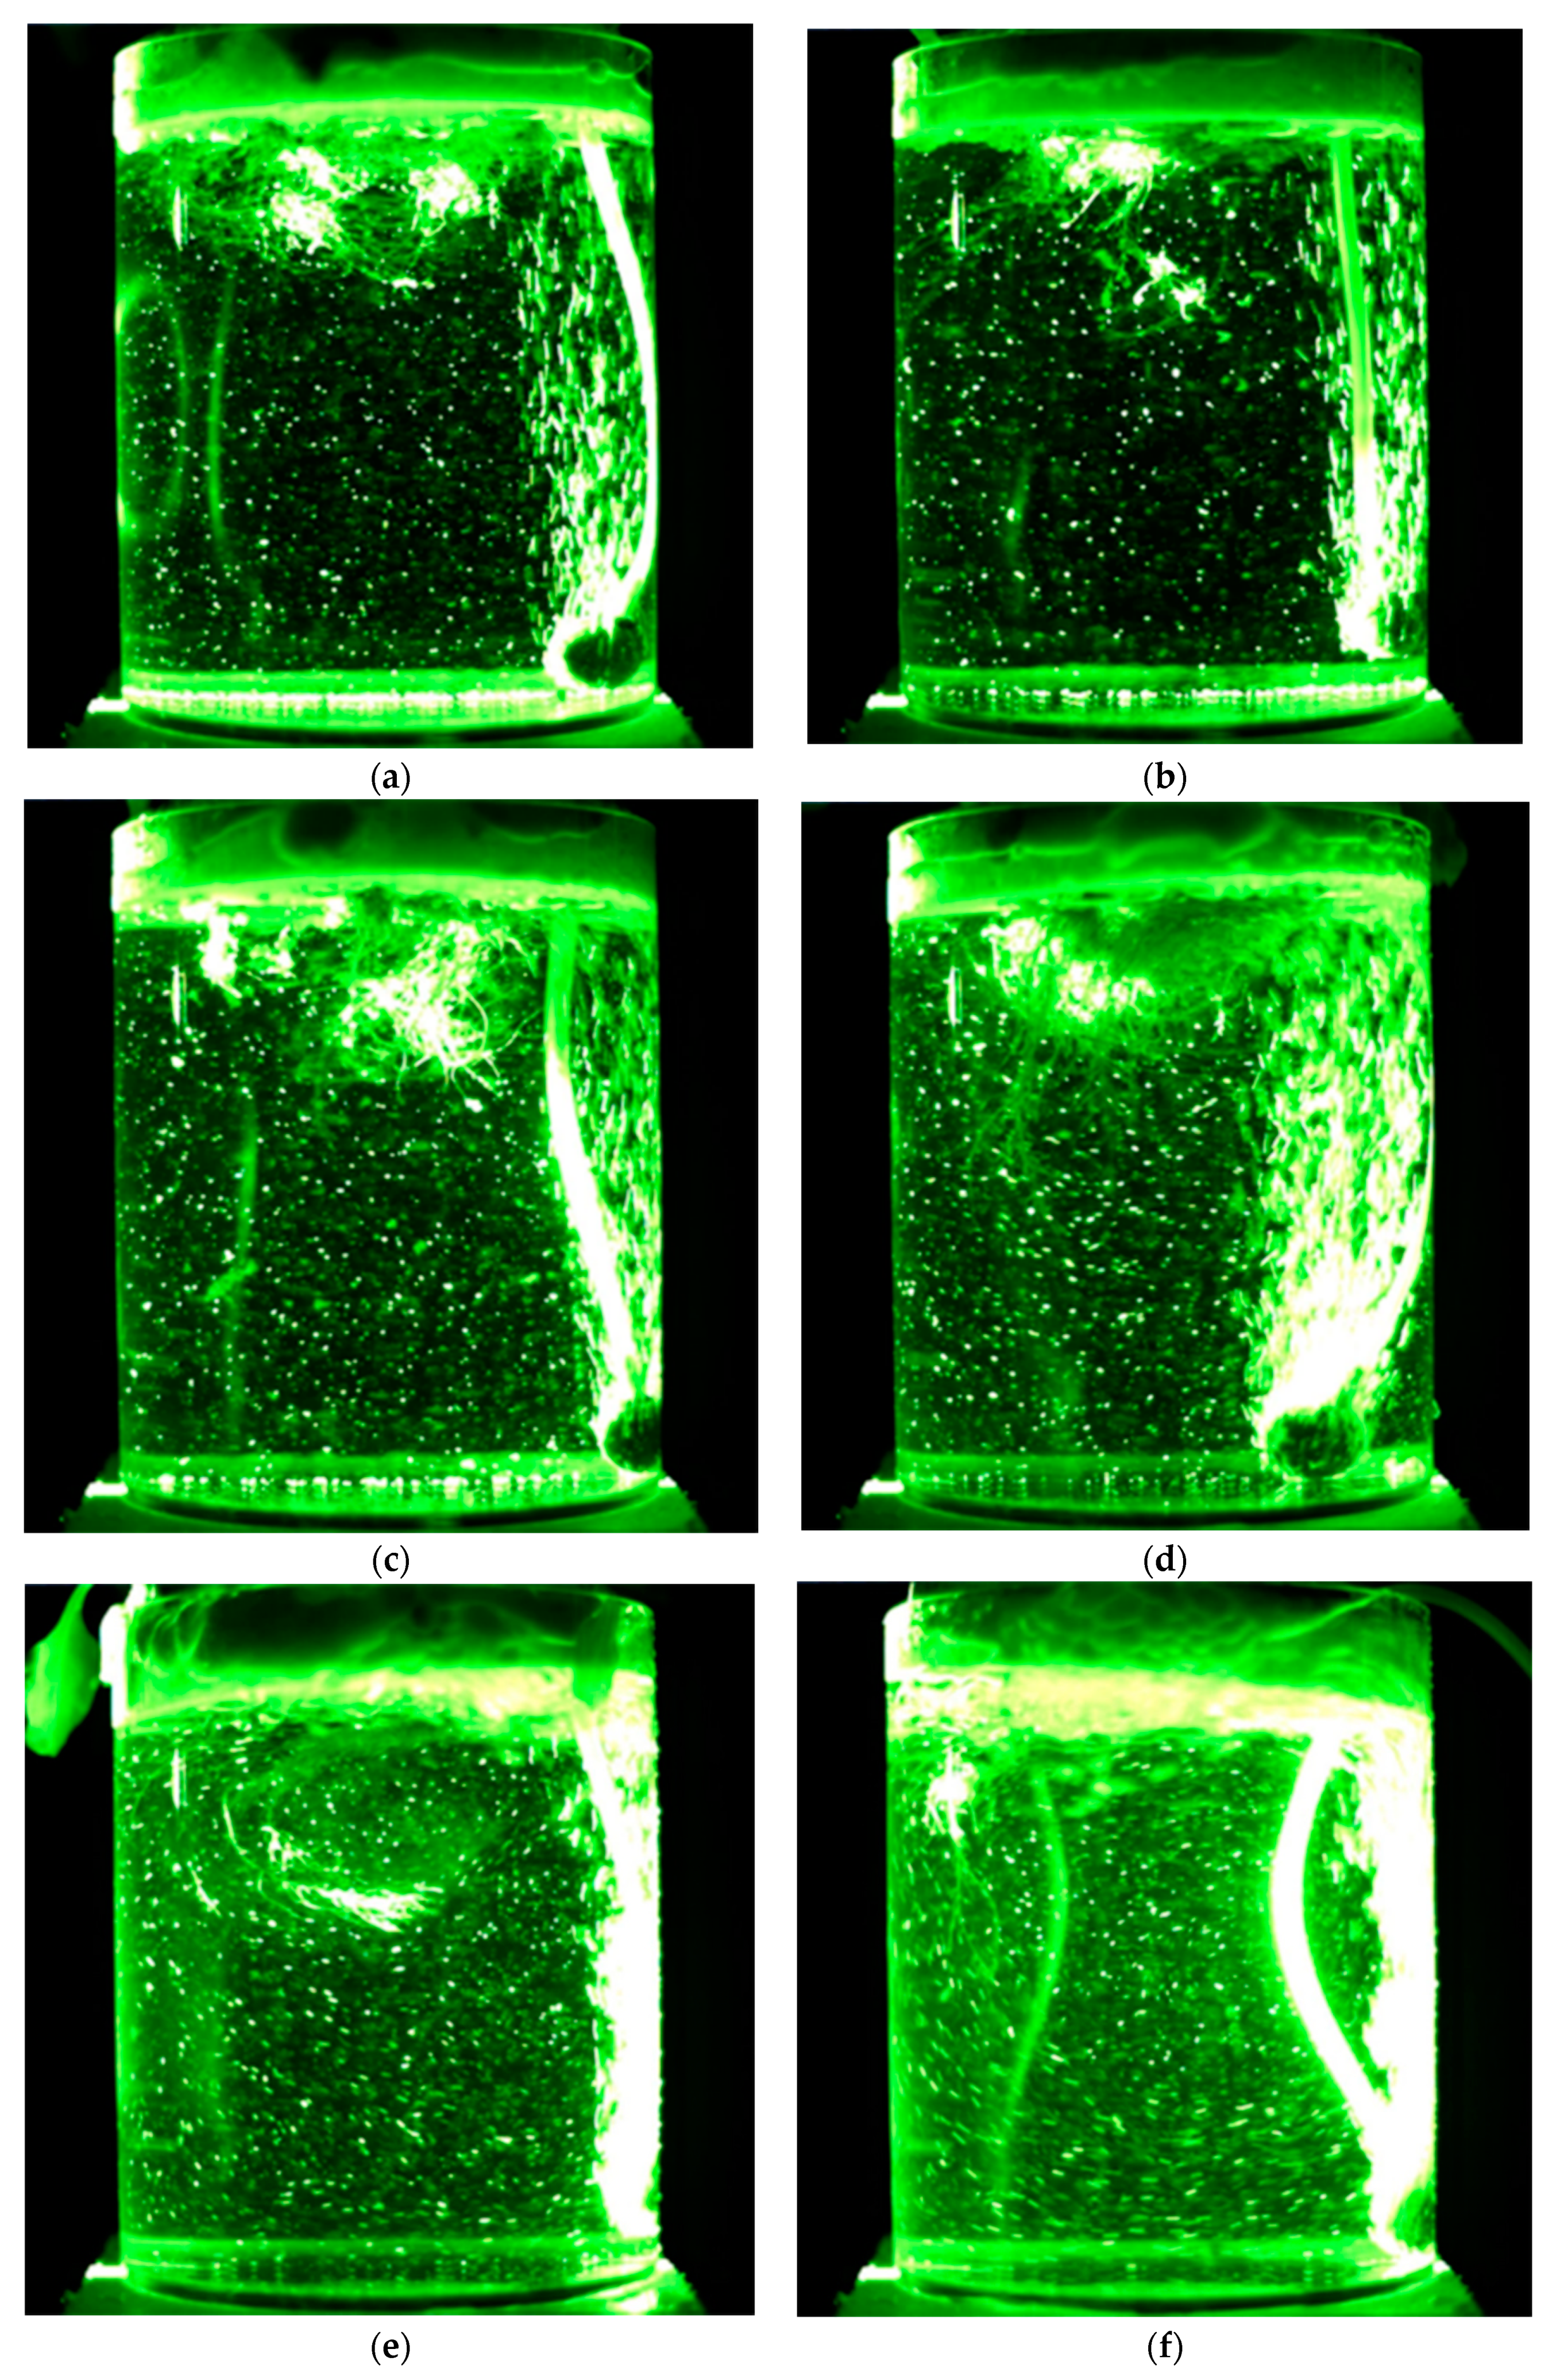
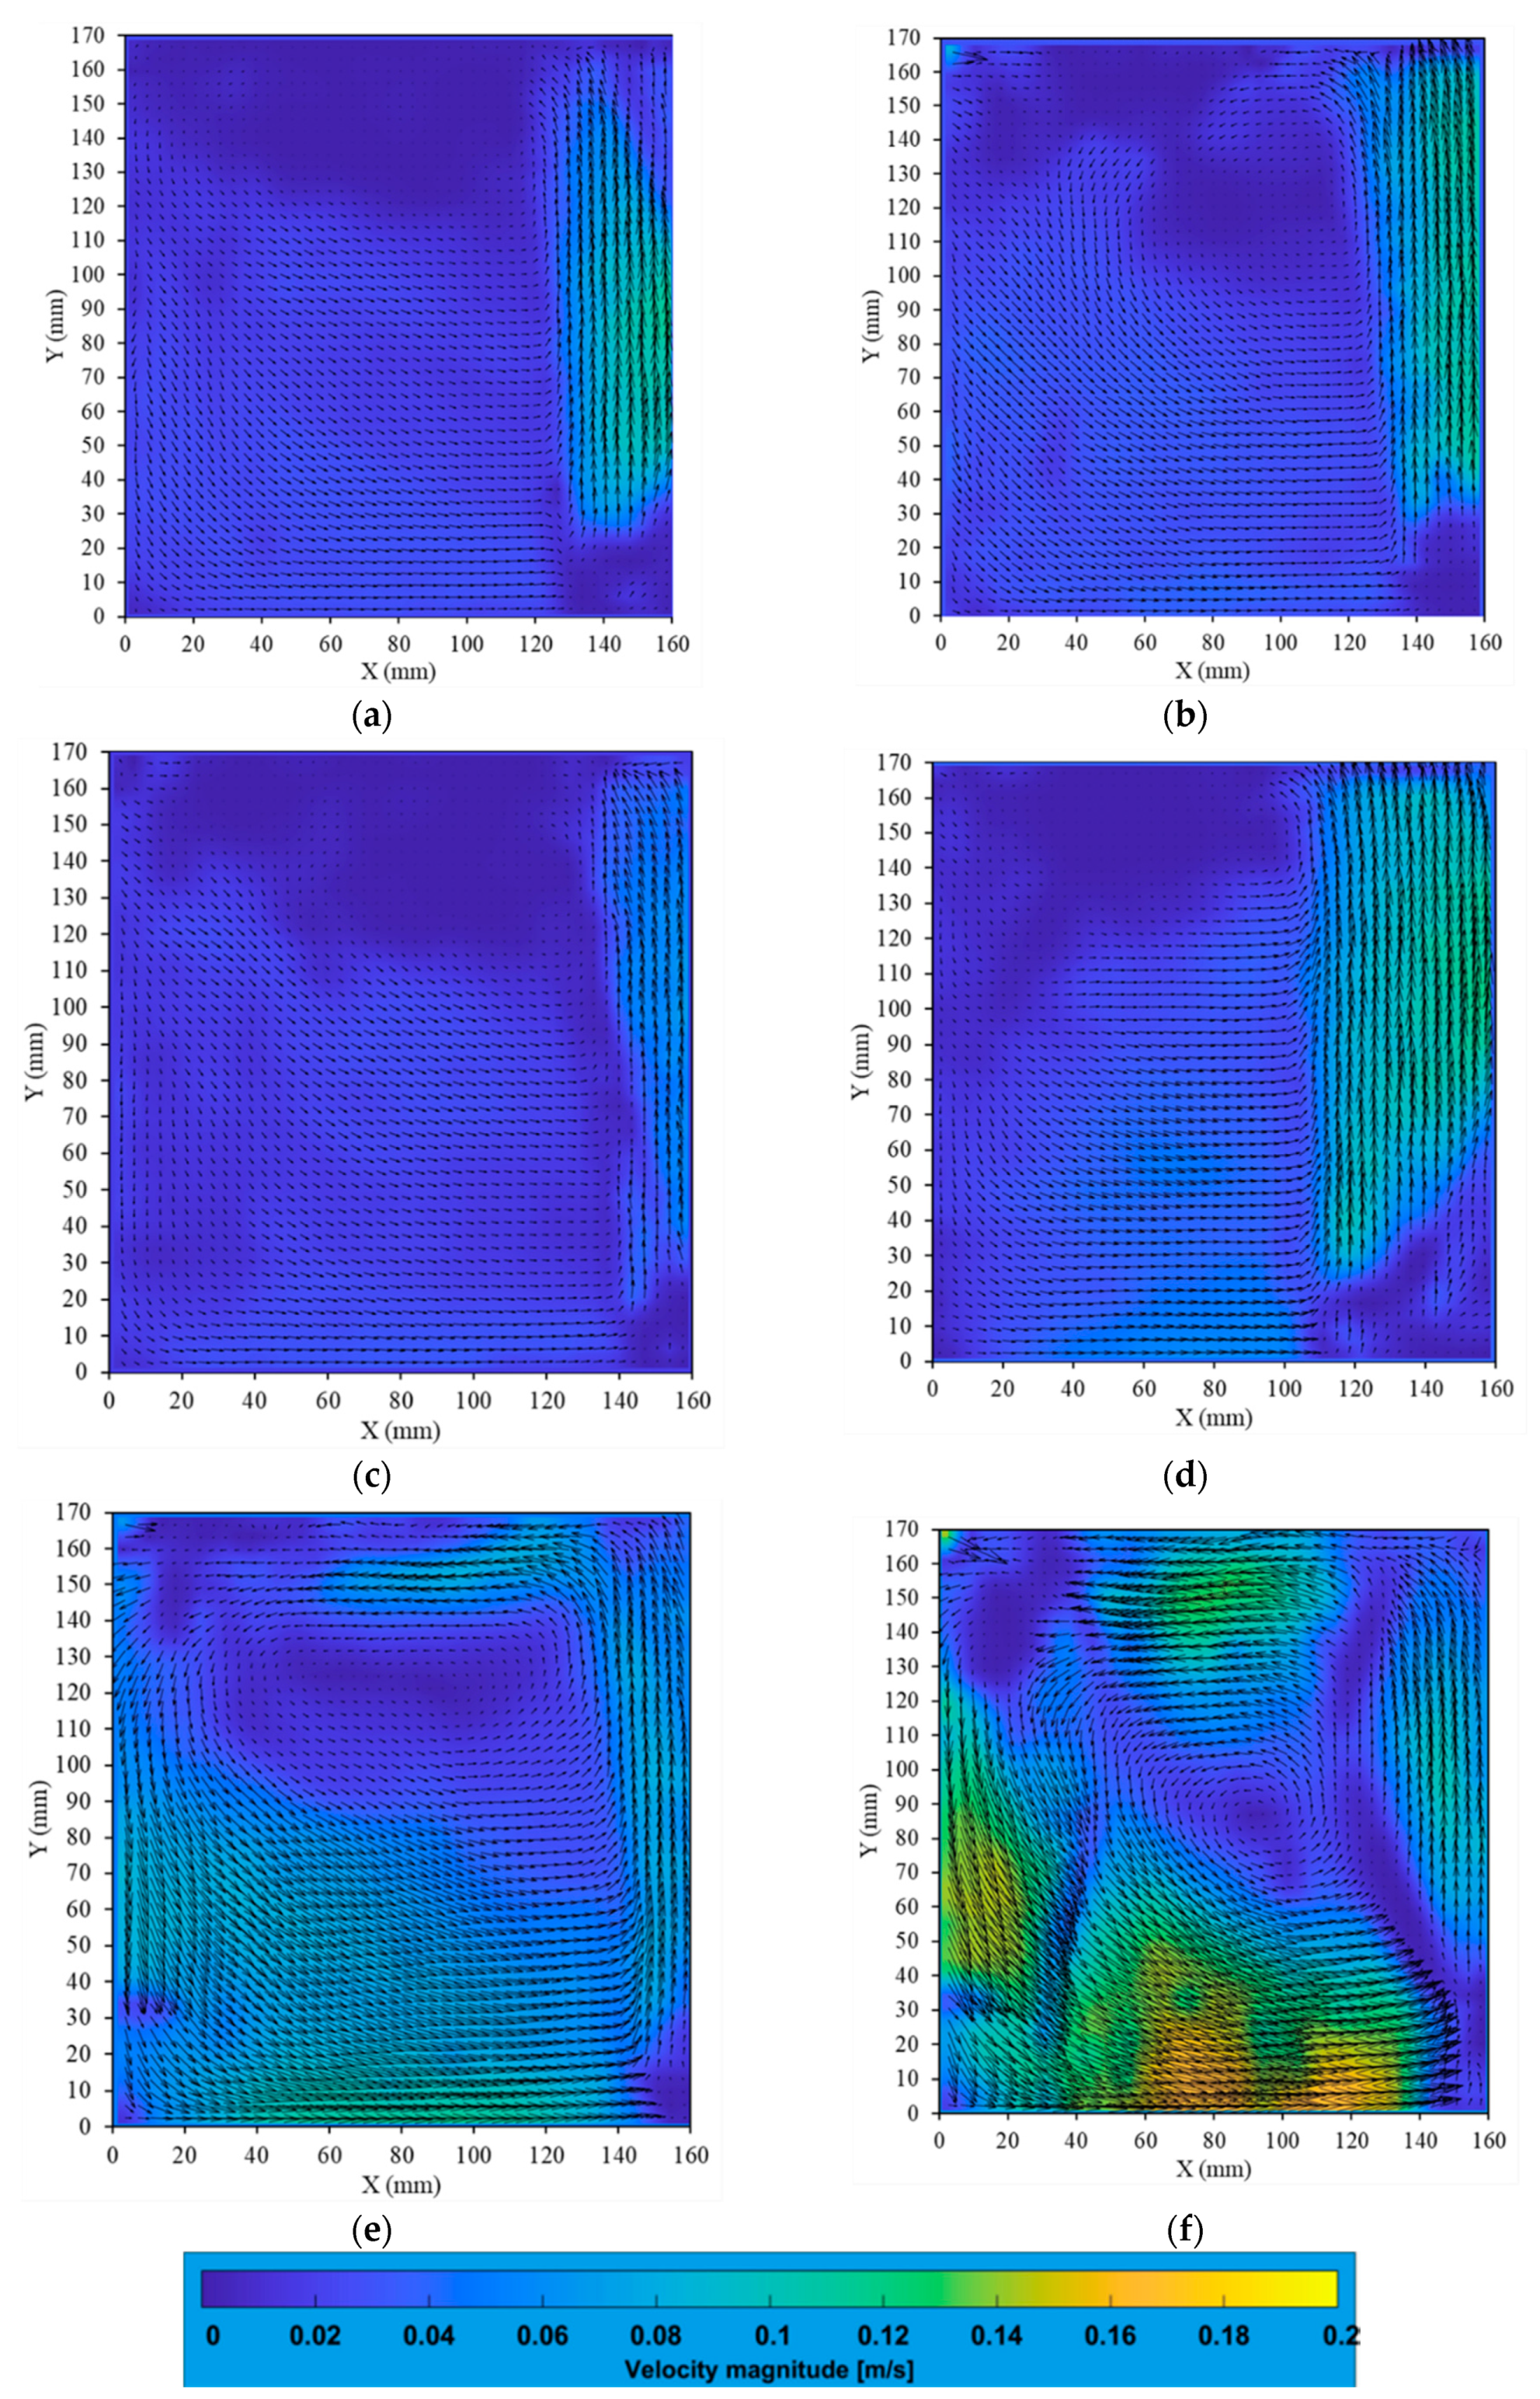
3.4. Flow Field Visualization of Bubble Flow in Nutrient Solution

The bubble flow field under different aeration intensities is depicted in Figure 8, and the video (6 fps) generated from the photos taken at the corresponding aeration rate is attached as (Supplementary Videos S1–S6). The velocity distribution of the bubble flow field under different aeration intensities is shown in Figure 9. The air stone is located at the bottom right corner (X = 120–160 mm, Y = 0–30 mm). On the right side of the container (X = 120–160 mm) is the bubble generation area. The dark blue area at the top (Y = 130–170 mm) is the root domain. It can be seen from Figure 9a,b that the overall flow velocity in the container increases slightly with the increase in aeration intensity. However, compared with Figure 9a,b, the increase in flow velocity is not obvious in Figure 9c,d. This is because the number of roots increased, and the existence of roots hinders part of the kinetic energy from the bubble flow, so with more roots, the flow velocity does not increase significantly. With the increase in the aeration intensity, especially at 1.18 and 2.35 L·L−1 NS·min−1, the flow velocity in the container increased significantly, and the anticlockwise vortex formed in the whole container was more obvious. Moreover, at 2.35 L·L−1 NS·min−1, there was a large flow velocity around the root zone.

4. Discussion

The numerous effects of low dissolved oxygen conditions on plants have been studied in the past. Results [18,19,20] observed from these studies have included plant chlorosis, growth reduction and root browning, a drop in nutrient content, lower yields, etc. The effects of aeration of the nutrient solution in hydroponics have also been described for some species [9,10,11,12]. In hydroponics, particularly in the arid land context, conditions often occur that result in a low dissolved oxygen concentration. These conditions consist of the restriction of cultivation container volume, high root density, and high temperatures. Therefore, adopting technology solutions that can reduce the occurrence of this situation is encouraged. Under hydroponic growing conditions, dissolved oxygen is gradually used up because of root respiration. Moreover, exchanging the oxygen concentration through diffusion is slow, especially when the cultivation substrate (nutrient solution) has no pores. Therefore, when using the deep flow technique and similar cultivation methods, it is recommended to aerate the nutrient solution for oxygenation. The advantages of aerating the nutrient solutions used in hydroponics have already been described by many researchers [21,22].
Aeration methods include nutrient solution stirring and air bubbling. These aeration methods are considered effective when root respiration is active and there is little dissolved oxygen in the nutrient solution, such as when the water temperature is high [23,24]. Although some studies have shown that aerating nutrient solutions can be beneficial in hydroponics, little information is available on the effects of aeration, and even less on the effect of solutions that circulate by bubble flow. Previous studies have suggested that the aeration rate affects the growth of hydroponic crops by affecting the amount of dissolved oxygen concentration. However, what previous researchers have not mentioned is that the increase in aeration rate not only increases the dissolved oxygen, but also affects the solution flow rate.
The most obvious difference between hydroponics and soil culture is that the substrate (liquid) of hydroponics can flow. In hydroponics, nutrient ions move to the root surface for absorption through turbulent diffusion. Bateer et al. [15,16,25] performed a series of studies on the effect of nutrient solution flow on plant growth. They pointed out that the flow of the nutrient solution in hydroponic cultivation is a kind of mechanical stimulation. Reasonable mechanical stimulation causes the roots to elongate and absorb more nutrients, so as to promote plant growth. On the contrary, excessive flow is an environmental pressure that inhibits the growth of plants. It should be mentioned that nutrient solutions can not only be circulated by the pump. Aeration can also cause the flow of nutrient solutions. The bubble flow of aeration causes the solution to flow and promotes turbulent diffusion. Moreover, due to the appropriate physical stimulation provided by the flow, the growth of plant roots is promoted. As shown in Figure 5, a certain degree of aeration can promote plant growth. However, if the aeration intensity is too high, the nutrient solution will flow too quickly, which cannot provide a suitable environment for roots. As shown in Figure 8 and Figure 9, higher aeration intensity caused faster bubble flow; the excessive flow caused excessive mechanical stimulation, which can inhibit plant growth. Thus, plants under high aeration intensity grow poorly compared to plants under an optimal aeration rate. According to the results of this study, when the aeration intensity is within the low range (0.07–0.15 L·L−1 NS·min−1), increasing the aeration intensity increases the plant growth. However, after reaching a certain extent (0.15–1.18 L·L−1 NS·min−1), some indicators of plant growth do not change significantly. Then, if the aeration intensity continues to increase (1.18–2.35 L·L−1 NS·min−1), plant growth not only does not continue to increase but decreases.
It is worth noting that the bubble flow is different from the simple circulation of nutrient solutions. Aeration not only promotes the circulation of the nutrient solution, but also has the function of increasing dissolved oxygen. As shown in Figure 3, to a certain extent, increasing the aeration intensity can improve DO, and an increase in DO is conducive to plant growth. In this study, the DO increased significantly at 0.07–0.59 L·L−1 NS·min−1, but changed little at 0.59–2.35 L·L−1 NS·min−1 aeration intensity. However, compared with the plant growth results, the plant growth does not change linearly with DO or aeration intensity. This implies that aeration intensity increasing in the range of 0.07–0.15 L·L−1 NS·min−1 is effective for oxygenation and promoting plant growth. Increasing the aeration intensity in the range of 0.15–1.18 L·L−1 NS·min−1 has no negative effect on growth, but it is futile. An increase in aeration intensity beyond the range of 1.18 L·L−1 NS·min−1 hinders plant growth. On the other hand, the N use efficiency under 0.07–0.29 and 2.35 L·L−1 NS·min−1 aeration intensity was relatively high.
To sum up, the results of this study show that with regard to increasing dissolved oxygen and promoting plant growth, the rule is not “the higher the aeration intensity, the better”. There is a reasonable supply of gas to allow crops to grow normally and rapidly within a particular aeration range. The plants growing in this aeration intensity range have higher plant height, leaf area, and root length than those growing with aeration intensity that is too low or too high, and can absorb the most nutrients and accumulate the heaviest dry weight. In addition, increasing the aeration intensity means increasing energy utilization and operating costs. In actual hydroponic production, it is very important to find a reasonable aeration intensity range—for example, based on maximizing the production while saving energy and improving the utilization efficiency of fertilizer, 0.15–0.29 L·L−1 NS·min−1 used in this paper is considered to be a reasonable aeration intensity. However, it should be mentioned that the optimal aeration intensity may be different for cultivation systems with planting densities. As a future topic, it is important to not only pay attention to the aeration intensity, but also put forward an index also including cultivation density to guide the regulation of aeration intensity in hydroponics. In addition, for different crops, the sensitivity to dissolved oxygen is different [10,11,12]. The optimal aeration intensity for different crops needs to be further studied. Moreover, the occurrence of bubble flow is also related to the position (middle or sides, suspension or subsidence) and shape (discoid, banded, spherical, etc.) of the aerator. Different aeration methods or bubble sizes will also change the optimal aeration intensity range, and other physical and chemical properties of the nutrient solution (EC, pH, and temperature, etc.) and the cultivation environment (solar radiation, ambient temperature, wind speed, etc.) affect the growth of plants. The coupling effects of other environmental factors and aeration intensity on the various life activities of hydroponic plants should also be studied. The effects of the above factors on the optimal aeration intensity range of hydroponic culture will continue to be studied as future topics.

5. Conclusions

In this paper, the effects of aeration intensity on plants were studied through cultivation experiments. In addition, a fluid visualization method (particle image velocimetry) was used to explain this effect from the perspective of engineering and image analysis technology. It was found that the growth of plants did not increase linearly with the increase in aeration intensity. When the aeration intensity is relatively low, increasing the aeration intensity is more useful for crop growth. However, after exceeding a certain value, increasing the aeration intensity has no obvious promoting effect on the amount of dissolved oxygen and plant growth. There is a reasonable range of aeration intensity that optimizes plant growth. These findings are beneficial both for plant growth and for hydroponics cultivation management, as it prevents the use of aeration intensity that is too high to be beneficial and also avoids the cost increase caused by using an air pump with excessive power.

Supplementary Materials

The following are available online at https://zenodo.org/record/5574666#.YXedpRwRWUl, Table S1: The greenhouse environmental data, Table S2: The data of experimental results in this study. Video S1: The bubble flow field under 0.25 L·min−1 aeration rates, Video S2: The bubble flow field under 0.50 L·min−1 aeration rates, Video S3: The bubble flow field under 1.00 L·min−1 aeration rates, Video S4: The bubble flow field under 2.00 L·min−1 aeration rates, Video S5: The bubble flow field under 4.00 L·min−1 aeration rates, Video S6: The bubble flow field under 8.00 L·min−1 aeration rates.

Author Contributions

Conceptualization, K.T., S.Y. (Satoshi Yamada), and B.B.; methodology, K.T., S.Y. (Satoshi Yamada), and B.B.; software, B.B.; formal analysis, X.W. and B.B.; investigation, X.W. and B.B.; resources, K.T. and S.Y. (Satoshi Yamada); data curation, X.W. and B.B.; writing—original draft preparation, B.B.; writing—review and editing, K.T., B.B., S.Y. (Satoshi Yamada), M.Y., X.W., S.Y. (Sadahiro Yamamoto), and Y.I.; visualization, B.B.; supervision, K.T., S.Y. (Satoshi Yamada), and M.Y.; funding acquisition, K.T. and S.Y. (Satoshi Yamada). All authors have read and agreed to the published version of the manuscript.

Funding

This research was funded by the Japan Science and Technology Agency (JST)/Japan International Cooperation Agency (JICA), grant number JPMJSA1405.

Institutional Review Board Statement

Not applicable.

Informed Consent Statement

Not applicable.

Data Availability Statement

All data generated or analyzed during this study are included in this published article.

Acknowledgments

We thank the Organization for Research Initiative and Promotion of Tottori University for providing us with technical support. We also thank the Arid Land Research Center of Tottori University for supporting us with experimental equipment and at the experimental site. Further, we thank the International Platform for Dryland Research and Education of Tottori University.

Conflicts of Interest

The authors declare no conflict of interest.

References

  1. Dregne, H.E. Soils of Arid Regions; Elsevier: Amsterdam, The Netherlands, 2011. [Google Scholar]
  2. Fageria, N.K.; Moreira, A. The role of mineral nutrition on root growth of crop plants. Adv. Agron. 2011, 110, 251–331. [Google Scholar]
  3. Jensen, M.H. Controlled Environment agriculture in deserts, tropics and temperate regions—A World Review. In Proceedings of the International Symposium on Design and Environmental Control of Tropical and Subtropical Greenhouses, Taichung, Taiwan, 15–18 April 2001; p. 578. [Google Scholar]
  4. Hussain, A.; Iqbal, K.; Aziem, S.; Mahato, P.; Negi, A.K. A review on the science of growing crops without soil (soilless culture)—A novel alternative for growing crops. Int. J. Agric. Crop Sci. 2014, 7, 833. [Google Scholar]
  5. Jones, J.B., Jr. Hydroponics: A Practical Guide for the Soilless Grower; CRC Press: Boca Raton, FL, USA, 2016. [Google Scholar]
  6. Shavrukov, Y.; Genc, Y.; Hayes, J. The Use of Hydroponics in Abiotic Stress Tolerance Research; InTech: Rijeka, Croatia, 2012; pp. 39–66. [Google Scholar]
  7. Jackson, M.B. Aeration in the nutrient film technique of glasshouse crop production and the importance of oxygen, ethylene, carbon dioxide. Acta Hortic. 1980, 98, 61–78. [Google Scholar] [CrossRef]
  8. Masuda, T.; Nonami, H.; Morimoto, T. Oxygen Enrichment in deep hydroponic culture improves growth of spinach. Environ. Control. Biol. 1989, 27, 97–102. [Google Scholar]
  9. Gislerød, H.R.; Baas, R.; Warmenhoven, M.; van der Berg, D. Effect of aeration on rooting and growth of roses (REFEREED). Acta Hortic. 1997, 450, 113–122. [Google Scholar] [CrossRef]
  10. Tachibana, S. The influence of withholding oxygen supply to roots by day and night on the blossom-end rot of tomatoes in water culture. Soil. Cult. 1988, 4, 41–50. [Google Scholar]
  11. Yoshida, S.; Kitano, M.; Eguchi, H. Water uptake and growth of cucumber plants under control of dissolved O2 concentrations in hydroponics. Acta Hortic. 1996, 440, 199–204. [Google Scholar] [CrossRef] [PubMed]
  12. Goto, E.; Both, A.J.; Albright, L.D.; Langhans, R.W.; Leed, A.R. Effect of dissolved oxygen concentration on lettuce growth in floating hydroponics. Acta Hortic. 1996, 440, 205–210. [Google Scholar] [CrossRef] [PubMed]
  13. Lara, L.J.; Egea-Gilabert, C.; Niñirola, D.; Conesa, E.; Fernández, J.A. Effect of aeration of the nutrient solution on the growth and quality of purslane (Portulaca oleracea). J. Hortic. Sci. Biotechnol. 2011, 86, 603–610. [Google Scholar] [CrossRef]
  14. Kaburagi, E.; Morikawa, Y.; Yamada, M.; Fujiyama, H. Sodium enhances nitrate uptake in Swiss chard (Beta vulgaris var. cicla L.). Soil Sci. Plant Nutr. 2014, 60, 651–658. [Google Scholar] [CrossRef] [Green Version]
  15. Baiyin, B.; Tagawa, K.; Yamada, M.; Wang, X.; Yamada, S.; Shao, Y.; An, P.; Yamamoto, S.; Ibaraki, Y. Effect of Nutrient Solution Flow Rate on Hydroponic Plant Growth and Root Morphology. Plants 2021, 10, 1840. [Google Scholar] [CrossRef] [PubMed]
  16. Baiyin, B.; Tagawa, K.; Yamada, M.; Wang, X.; Yamada, S.; Yamamoto, S.; Ibaraki, Y. Effect of the Flow Rate on Plant Growth and Flow Visualization of Nutrient Solution in Hydroponics. Horticulturae 2021, 7, 225. [Google Scholar] [CrossRef]
  17. Thielicke, W.; Stamhuis, E. PIVlab–towards user-friendly, affordable and accurate digital particle image velocimetry in MATLAB. J. Open Res. Softw. 2014, 2, 1. [Google Scholar] [CrossRef] [Green Version]
  18. Sojka, R.E. Stomatal closure in oxygen-stressed plants. Soil Sci. 1992, 154, 269–280. [Google Scholar] [CrossRef] [Green Version]
  19. William, M.; Davies, W.; Malone, M.; Jackson, M. A negative hydraulic message from oxygen deficient roots of tomato plants. Plant Physiol. 1995, 109, 1017–1024. [Google Scholar]
  20. Drew, M.C. Oxygen deficiency and root metabolism: Injury and acclimation under hypoxia and anoxia. Annu. Rev. Plant Physiol. Plant Mol. Biol. 1997, 48, 223–250. [Google Scholar] [CrossRef] [PubMed]
  21. Jackson, M.B.; Blackwell, P.S.; Chrimes, J.R.; Sims, T.V. Poor aeration in NFT and means for its improvement. J. Hortic. Sci. 1984, 59, 439–448. [Google Scholar] [CrossRef]
  22. Marfà, O.; Cáceres, R.; Guri, S. Oxyfertigation: A new technique for soilless culture under Mediterranean conditions. In Proceedings of the International Symposium on Soilless Culture and Hydroponics, Almería, Spain, 14–19 November 2004; p. 697. [Google Scholar]
  23. Rivière, L.M.; Charpentier, S.; Jeannin, B.; Kafka, B. Oxygen concentration of nutrient solution in mineral wools. Acta Hortic. 1993, 342, 93–102. [Google Scholar] [CrossRef]
  24. Schwarz, M. Oxygenation of nutrient solution in normal and stress conditions. Soil. Cult. 1989, 5, 45–53. [Google Scholar]
  25. Baiyin, B.; Tagawa, K.; Yamada, M.; Wang, X.; Yamada, S.; Yamamoto, S.; Ibaraki, Y. Effect of Substrate Flow Rate on Nutrient Uptake and Use Efficiency in Hydroponically Grown Swiss Chard (Beta vulgaris L. ssp. cicla ‘Seiyou Shirokuki’). Agronomy 2021, 11, 2050. [Google Scholar] [CrossRef]
Figure 1. Dimensions of a cultivation plate.
Agriculture 11 01140 g001
Figure 2. The hydroponic cultivation experiment used in this study.
Agriculture 11 01140 g002
Figure 3. PIV system used in this study. (a) Observation method of the bubble flow field and roots in hydroponics. (b) The components of the PIV system.
Agriculture 11 01140 g003
Figure 4. Dissolved oxygen (DO) concentration and saturation under different aeration intensities before cultivation in this study: (a) DO concentration; (b) DO saturation. A total of ten measurements were made at the same time (9:00–10:00 a.m.) on different days (water temperature = 21 °C ± 1 °C). Bars labeled with different letters indicate significant differences (p ≤ 0.05); data are expressed as MSE (n = 10).
Agriculture 11 01140 g004
Figure 5. The plant growth and root morphology under different aeration intensities: (a) dry weight (shoots), (b) dry weight (roots), (c) leaf area, and (d) water content. Bars labeled with different letters indicate significant differences (p ≤ 0.05), and data are expressed as MSE (n = 4).
Agriculture 11 01140 g005
Figure 6. Root morphology under different aeration intensities. (a) Root length and (b) root surface area. Bars labeled with different letters indicate significant differences (p ≤ 0.05); data are expressed as MSE (n = 4).
Agriculture 11 01140 g006
Figure 7. Plant nutrient uptake and nitrogen use efficiency under different aeration intensities. (a) N content (shoots), (b) N content (roots), (c) N uptake, and (d) N use efficiency. Bars labeled with different letters indicate significant differences (p ≤ 0.05); data are expressed as MSE (n = 4).
Agriculture 11 01140 g007aAgriculture 11 01140 g007b
Figure 8. Bubble flow fields under different aeration intensities: (a) aeration intensity = 0.07 L·L−1 NS·min−1, (b) aeration intensity = 0.15 L·L−1 NS·min−1, (c) aeration intensity = 0.29 L·L−1 NS·min−1, (d) aeration intensity = 0.59 L·L−1 NS·min−1, (e) aeration intensity = 1.18 L·L−1 NS·min−1, and (f) aeration intensity = 2.35 L·L−1 NS·min−1.
Agriculture 11 01140 g008
Figure 9. The velocity distribution of bubble flow fields under different aeration intensities: (a) aeration intensity = 0.07 L·L−1 NS·min−1, (b) aeration intensity = 0.15 L·L−1 NS·min−1, (c) aeration intensity = 0.29 L·L−1 NS·min−1, (d) aeration intensity = 0.59 L·L−1 NS·min−1, (e) aeration intensity = 1.18 L·L−1 NS·min−1, and (f) aeration intensity = 2.35 L·L−1 NS·min−1.
Agriculture 11 01140 g009
Table 1. The composition and concentration of the standard solution of MINA fertilizer [14].
CompositionConcentration
Potassium nitrate (KNO3)1.600 mM
Potassium dihydrogen phosphate (KH2PO4)0.400 mM
Calcium nitrate (Ca(NO3)2·4H2O)0.900 mM
Calcium chloride (CaCl2·2H2O)0.100 mM
Magnesium nitrate (Mg(NO3)2·6H2O)0.300 mM
Magnesium sulfate (MgSO4·7H2O)1.700 mM
Ferrous sulfate (FeSO4·7H2O)35.800 µM
Manganese sulfate (MnSO4·5H2O)9.000 µM
Boric acid (B(OH)3)18.400 µM
Zinc sulfate (ZnSO4·7H2O)1.500 µM
Copper sulfate (CuSO4·5H2O)0.200 µM
Ammonium molybdate ((NH4)6Mo7O24·4H2O)0.004 µM
Table 2. The conversion of aeration rate to aeration intensity.
Aeration Rate (L·min−1)0.250.501.002.004.008.00
Aeration Intensity (L·L−1 NS min−1)0.070.150.290.591.182.35
Publisher’s Note: MDPI stays neutral with regard to jurisdictional claims in published maps and institutional affiliations.

