Article

Effects of Composts Made from Broiler Chicken Residues and Blended with Biochar on the Minerals and Phenolic Compounds in Parsley (Petroselinum crispum Mill.)

by
Francielly T. Santos
1,
Henrique Trindade
2,
Mônica S. S. M. Costa
1,
Luiz A. M. Costa
1 and
Piebiep Goufo
2,*
1
Universidade Estadual do Oeste do Paraná, University Street, 2069, Cascavel 85819-110, Brazil
2
CITAB–Centro de Investigação e Tecnologias Agroambientais e Biológicas, Departamento de Agronomia, Universidade de Trás-os-Montes e Alto Douro, Quinta de Prados, 5000-801 Vila Real, Portugal
*
Author to whom correspondence should be addressed.
Submission received: 26 October 2021 / Revised: 17 November 2021 / Accepted: 17 November 2021 / Published: 19 November 2021
(This article belongs to the Special Issue From Waste to Fertilizer in Sustainable Agriculture)

Abstract

:
Soil amendments, such as composts and biochar, are currently widely used as substrates in container gardening. Although different types of wastes have been used in composting, formulating growing mediums for specific plants using different materials is necessary. In the present study, organic substrates comprising mixtures of (a) broiler chicken wastes composted with sugar bagasse, sawdust, urban tree, napier grass, or cotton residues, and (b) five different proportions of biochar (0%, 15%, 30%, 45%, and 60%) were used to produce mineral and flavonoid-rich parsley plants. The sawdust-based substrate led to the highest yields (27.86 g pot−1 on average), regardless of the amount of biochar added; however, this substrate resulted in plants with no appreciable antioxidant activities. Plants grown using the tree-based substrate had moderate yields (16.95 g pot−1), and the highest phenolic levels (e.g., 7.93 mg GAE g−1) and antioxidant activities (DPPH scavenging activity over 11.17 g TE g−1). Such activities were better described by the presence of apigenin-7-apiosylglucoside and diosmetin-apiosylglucoside. Moderate yields were also obtained with the cotton-based substrate; however, such yields were only obtained at biochar proportions greater than 30%; this substrate led to the highest K contents (47.19 g kg−1). The lowest yields (3.20 g pot−1) and N (20.96 g kg−1), P (1.33 g kg−1), K (33.26 g kg−1), and flavonoid (13.63 mg CE g−1) contents were obtained with the napier-based substrate. However, this substrate led to the production of parsley plants with the highest levels of anthocyanins (0.40 mg CGE g−1), which may have accumulated as stress sensors and defense components. The bagasse-based substrate also led to high yields and appreciable flavonoid contents with 60% biochar. In most cases, no linear relationship was found between the biochar amount and the chemical parameters evaluated. Overall, the substrates formulated using urban tree residues had higher suitability for parsley development than those formulated using sugar bagasse, sawdust, napier grass, or cotton residues.

1. Introduction

In organic agriculture, the final yield of plants is mainly dependent on the suitability of the growing medium [1,2]. Plants grown in a greenhouse are more sensitive to nutrients than field-grown crops. As a result, the composition of the growing medium of greenhouse-grown plants must be optimized to sustain and nourish the plants. Several organic media/substrates for growing plants, including composts, peat, expanded clay, bark, coir, perlite, and vermiculite have been evaluated by different researchers [3,4,5,6]. Composting aids in the recovery of nutrients and other organic compounds from organic wastes, thereby increasing their availability to plants. Accordingly, compositing helps to add value to municipal wastes by converting them into organic substrates, as well as minimizing negative environmental impacts by employing these substrates as alternatives to synthetic chemicals in crop fertilization [7].
The effectiveness of organic substrates not only depends on their nutrient content and other chemicals formed during the humification process, but also on their physical structure. A feasibility study of organic production using wastes of agro-industrial origin must consider the pH and the electrical conductivity (EC) of the substrates and their effectiveness at retaining both water and water-soluble nutrients [8]. In general, substrates with high EC, and hence, high salinity, can prevent seed germination through the toxicity of a specific ion or prevent efficient water absorption by the plant by increasing osmotic pressure around the roots [8]. A high concentration of nutrients in the stabilized material obtained at the end of the composting process can lead to increased EC [9]. Further, the high organic load of some compounds in organic substrates, such as polyphenols, may compromise the development of potted plants [5].
Although agro-industrial wastes of animal origin, such as broiler chicken wastes, are particularly rich in nutrients, these materials require pH or nutrient adjustment before use in most cases. Animal waste-based composts generally consist of fine particles that may compromise their physical properties in relation to plant growth [9,10]. Plant residues provide varying C:N ratios [2] and could work well in adjusting the chemical composition and stabilizing the physical properties of animal wastes. Biochar has also been suggested as a suitable material for stabilizing the physical properties of animal wastes [4]. Biochar is charcoal produced through pyrolysis by exposing plant matter to elevated temperatures in a low-oxygen environment [11]. Because biochar is a high-carbon material that has several interesting physical and chemical characteristics, such as low EC [11], it has been proposed as an alternative or supplement to organic substrates with high salt concentrations or high organic loads in the production of horticultural crops. The supplementation of animal and plant-based organic substrates with biochar might result in improvements in the chemical, physical, and biological properties of these substrates owing to the porous nature of biochar [12,13].
Besides providing the physical and chemical properties needed for the proper development of plants, organic substrates should ensure the production of crops that are rich in nutrients and bioactive compounds. Among bioactive compounds with potential beneficial effects on human health, phenolics have received remarkable attention [14]. Phenolics are a heterogeneous class of chemicals characterized by the presence of hydroxyl groups bonded directly to an aromatic hydrocarbon group [15,16]. These compounds have both antioxidant and antiradical properties and act as protective agents against free radicals in the body [17,18,19].
Phenolics are particularly abundant in fruits and vegetables. Parsley (Petroselinum crispum Mill.), which is commonly used in European, Middle Eastern, western Asia, and American cuisines as a spice and garnish is one such vegetable [20]. For decades, parsley has been recognized to possess characteristic components for healthy dietary patterns. A major flavonoid detected in parsley is apin (apigenin-7-apiosylglucoside) [20,21,22]. In addition to their well-documented antioxidant activities, apigenin and its derivatives have been linked to the prevention and attenuation of risks and diseases associated with oxidative stress, such as cancer, cell aging, diabetes, and elevated blood pressure [23].
Studies are urgently needed to better characterize substrates and other factors that may positively impact the yield and antioxidant composition of parley. The objectives of the present study were to: (1) test the suitability of different formulations of broiler chicken wastes/plant residue-based composts and biochar as organic substrate for potted parsley growth, and (2) evaluate the influence of the organic substrates on the contents of minerals (N, P, and K), phenolic compounds, and antioxidant activities in parsley. The use of organic substrates has become widespread in containerized ornamental and nursery crop production systems [9]; the results of the greenhouse experiment reported in this study using pots for plant growth could be relevant to these areas of commercial horticulture.

2. Materials and Methods

2.1. Production of Organic Substrates

Broiler chicken wastes were obtained from the poultry processing company BRF in the western region of the state of Paraná in Brazil. These wastes were essentially mixtures of litter from the rearing of laying hens, hatchery wastes, floating sludge, cellulose gut, and charcoal. Charcoal was obtained via the combustion of wood as a source of heat for boiler stoves and central heating in agroindustry operations. Before composting, chicken wastes were mixed with one of the following plant residues as the main carbon source: ground sugarcane bagasse, sawdust, materials resulting from the pruning of urban trees, shredded forage from napier grass (Pennisetum purpureum), and remnants from the defibrillation of cotton. These wastes were thoroughly blended in a M1 mixing machine (Pyro Inc., Giza, Egypt) and then sieved using a 5 mm mesh.
The composting materials were prepared by adding the same volume of chicken waste to different volumes of plant residues to create piles with a C:N ratio of ca. 30. Preliminary experiments showed that C:N ratios higher than 30 made the composting process slow, as has also been reported in other studies [4,5]. No bulking agent was added to the mixes. For each plant residue, five composting lines were assembled in a M4800 windrow turner (Jinjia Machinery Co., Ltd., Baoding, China). The air was supplied continually with an automated built-in pump at a rate of 20 L h−1 kg−1 dry weight. The piles were periodically turned over and their temperatures were monitored. The composts were considered stable when the temperature inside the lines was close to ambient temperature. At such temperature, the composting process was terminated. The composting stabilization times using sugarcane bagasse, sawdust, urban trees, napier grass, and cotton were 91, 145, 91, 91, and 84 days, resulting in composts with final C:N ratios of 15, 23, 15, 16, and 11, respectively. Composting periods of 90 days with the addition of natural zeolite [4], 75 to 180 days without any addition [9], and 147 days with the addition of urea [5] have been reported by other authors.

2.2. Treatments and Parsley Growing Conditions

In this study, chicken-based composts and biochar were employed in various proportions for the organic production of parsley. Commercially available biochar derived from the pyrolysis of eucalyptus woods was obtained from Biocarvão do Brasil, Curitiba, Paraná, Brazil. The bagasse–chicken compost (B), sawdust–chicken compost (S), tree–chicken compost (T), napier–chicken compost (N), and cotton–chicken compost (C) were mixed with five different amounts of biochar (0, 15, 30, 45, and 60%), resulting in 25 organic substrates. To define the treatments, the first letter of the plant residue used as the main source of carbon during composting and the proportion of biochar in the substrate were considered, as shown in Table 1.
The parsley growth experiment was carried out in a 30% Aluminet® greenhouse (15 m × 7 m) at an average temperature of 25 °C under 8 h of solar radiation at the Universidade Estadual do Oeste do Paraná. The university is situated in the city of Cascavel (Brazil), latitude 24°54′01′′ S, longitude 53°32′01′′ W, altitude 781 m, and has a humid subtropical climate [24].
Thirty-day old parsley seedlings were purchased from a local market and transplanted into 1 L plastic pots (10.5 cm high, 12.5 cm diameter at the upper base, and 10 cm diameter at the lower base) filled with the organic substrates (compost–biochar mixtures). The pots were arranged on a wooden table in rows (0.80 × 2.20 m), with one plant per pot and four replicate pots per treatment, resulting in a total of 100 experimental units. Watering was carried out daily based on the weight of the pot; the pot was replenished with the volume of water lost. No fertilizer or pesticide was applied. The pots were occasionally rotated between the rows to avoid border effects on plant development.

2.3. Determination of Fresh and Dry Matter Yield

Aerial parts of the plants (leaves + stems) were harvested 50 days after transplanting by separating them from the roots. The samples were washed with tap water, dry-blotted, and immediately weighed for fresh matter measurement using a fine scale. After lyophilization for 18 h, the dry weight was recorded by weighing, and the moisture content was calculated.

2.4. Determination of P, K, and N Contents in the Organic Substrates and Parsley

The compost-biochar mixtures and the lyophilized parsley samples were pulverized into powder using a Artisan K400 blender (KitchenAid, Greenville, OH, USA) and analyzed to determine their P and K contents, following nitropercloric digestion of samples, as described previously [25]. P was quantified by UV/vis spectrophotometry (700 Plus, Femto, São Paulo, Brazil) at 725 nm, while K was quantified by flame photometry using a DM-62 flame photometer (Digimed Analytical Instruments, Pembroke Pines, FL, USA) [26]. The N content was obtained following sulfuric acid digestion of samples and distillation using a TE-0364 Kjeldahl analyzer (Tecnal, São Paulo, Brazil) [27].

2.5. Determination of Total Phenolics (TPC), Total Flavonoids (TFC), and the Antioxidant Activity of Parsley Samples

Phenolic compounds were extracted from a 40 mg sample with 2.0 mL of 70% methanol at 75 °C for 30 min; during the extraction, vortexing was performed for 5 s every 10 min. The extract was later centrifuged at 3500 rpm for 15 min at 27 °C, and the supernatant was collected through a 0.45 μM polyvinylidene difluoride filter with a syringe and used as the phenolic extract. All chemicals used in the analyses were of the highest grade available and were purchased from Sigma-Aldrich agencies (Buchs, Switzerland; Steinheim, Germany; or Madrid, Spain).
The antioxidant status of the samples was estimated by the 2,2-diphenyl-1-picrylhydrazyl (DPPH) radical scavenging activity, according to a methodology used previously [28]. A 3.0 mL volume of the reaction mixture (0.1 mL phenolic extract + 2.9 mL DPPH in methanol) was prepared and incubated in the dark at room temperature (ca. 27 °C) for 20 h with stirring. The decrease in absorbance was measured versus that of methanol as a blank at 515 nm using a UV/vis spectrophotometer. The ability of the extracts to scavenge DPPH is quantitatively expressed as a percentage of free radical sequestration: % DPPH = ((absorbance of the blank − absorbance of the sample) ÷bsorbance of blank) × 100. The results are also expressed as mg trolox equivalent per g of freeze-dried sample (mg TE g−1 FW) using a trolox standard curve (R2 ≥ 0.937).
The TPC was determined by a modified Folin–Ciocalteu method [29]. The phenolic extract was mixed with diluted Folin–Ciocalteu reagent (1:10 in water; 100 µL) and 7.5% sodium carbonate (80 µL), and the mixture was incubated at 45 °C for 15 min in a water bath protected from light. The absorbance was measured at 750 nm and results are expressed as mg gallic acid equivalent per g of freeze-dried sample (mg GAEg−1 DW), using a gallic acid standard curve (R2 ≥ 0.972).
A spectrophotometric method based on a previously described method [28] was used for the determination of the TFC. Water (100 µL) was added to a tube, followed by 10 µL of 5% sodium nitrite and 25 µL of the phenolic extract. After 5 min, 15 µL of 10% aluminum chloride was added to the mixture, and after 6 min, 50 µL of sodium hydroxide (1 M) and 50 µL of water were added. The tubes were shaken for approximately 30 s, and the absorbance was measured at 520 nm, with catechin as a reference. The results are expressed as mg catechin equivalent per g of freeze-dried sample (mg CAE g−1 DW), using a catechin standard curve (R2 ≥ 0.995).

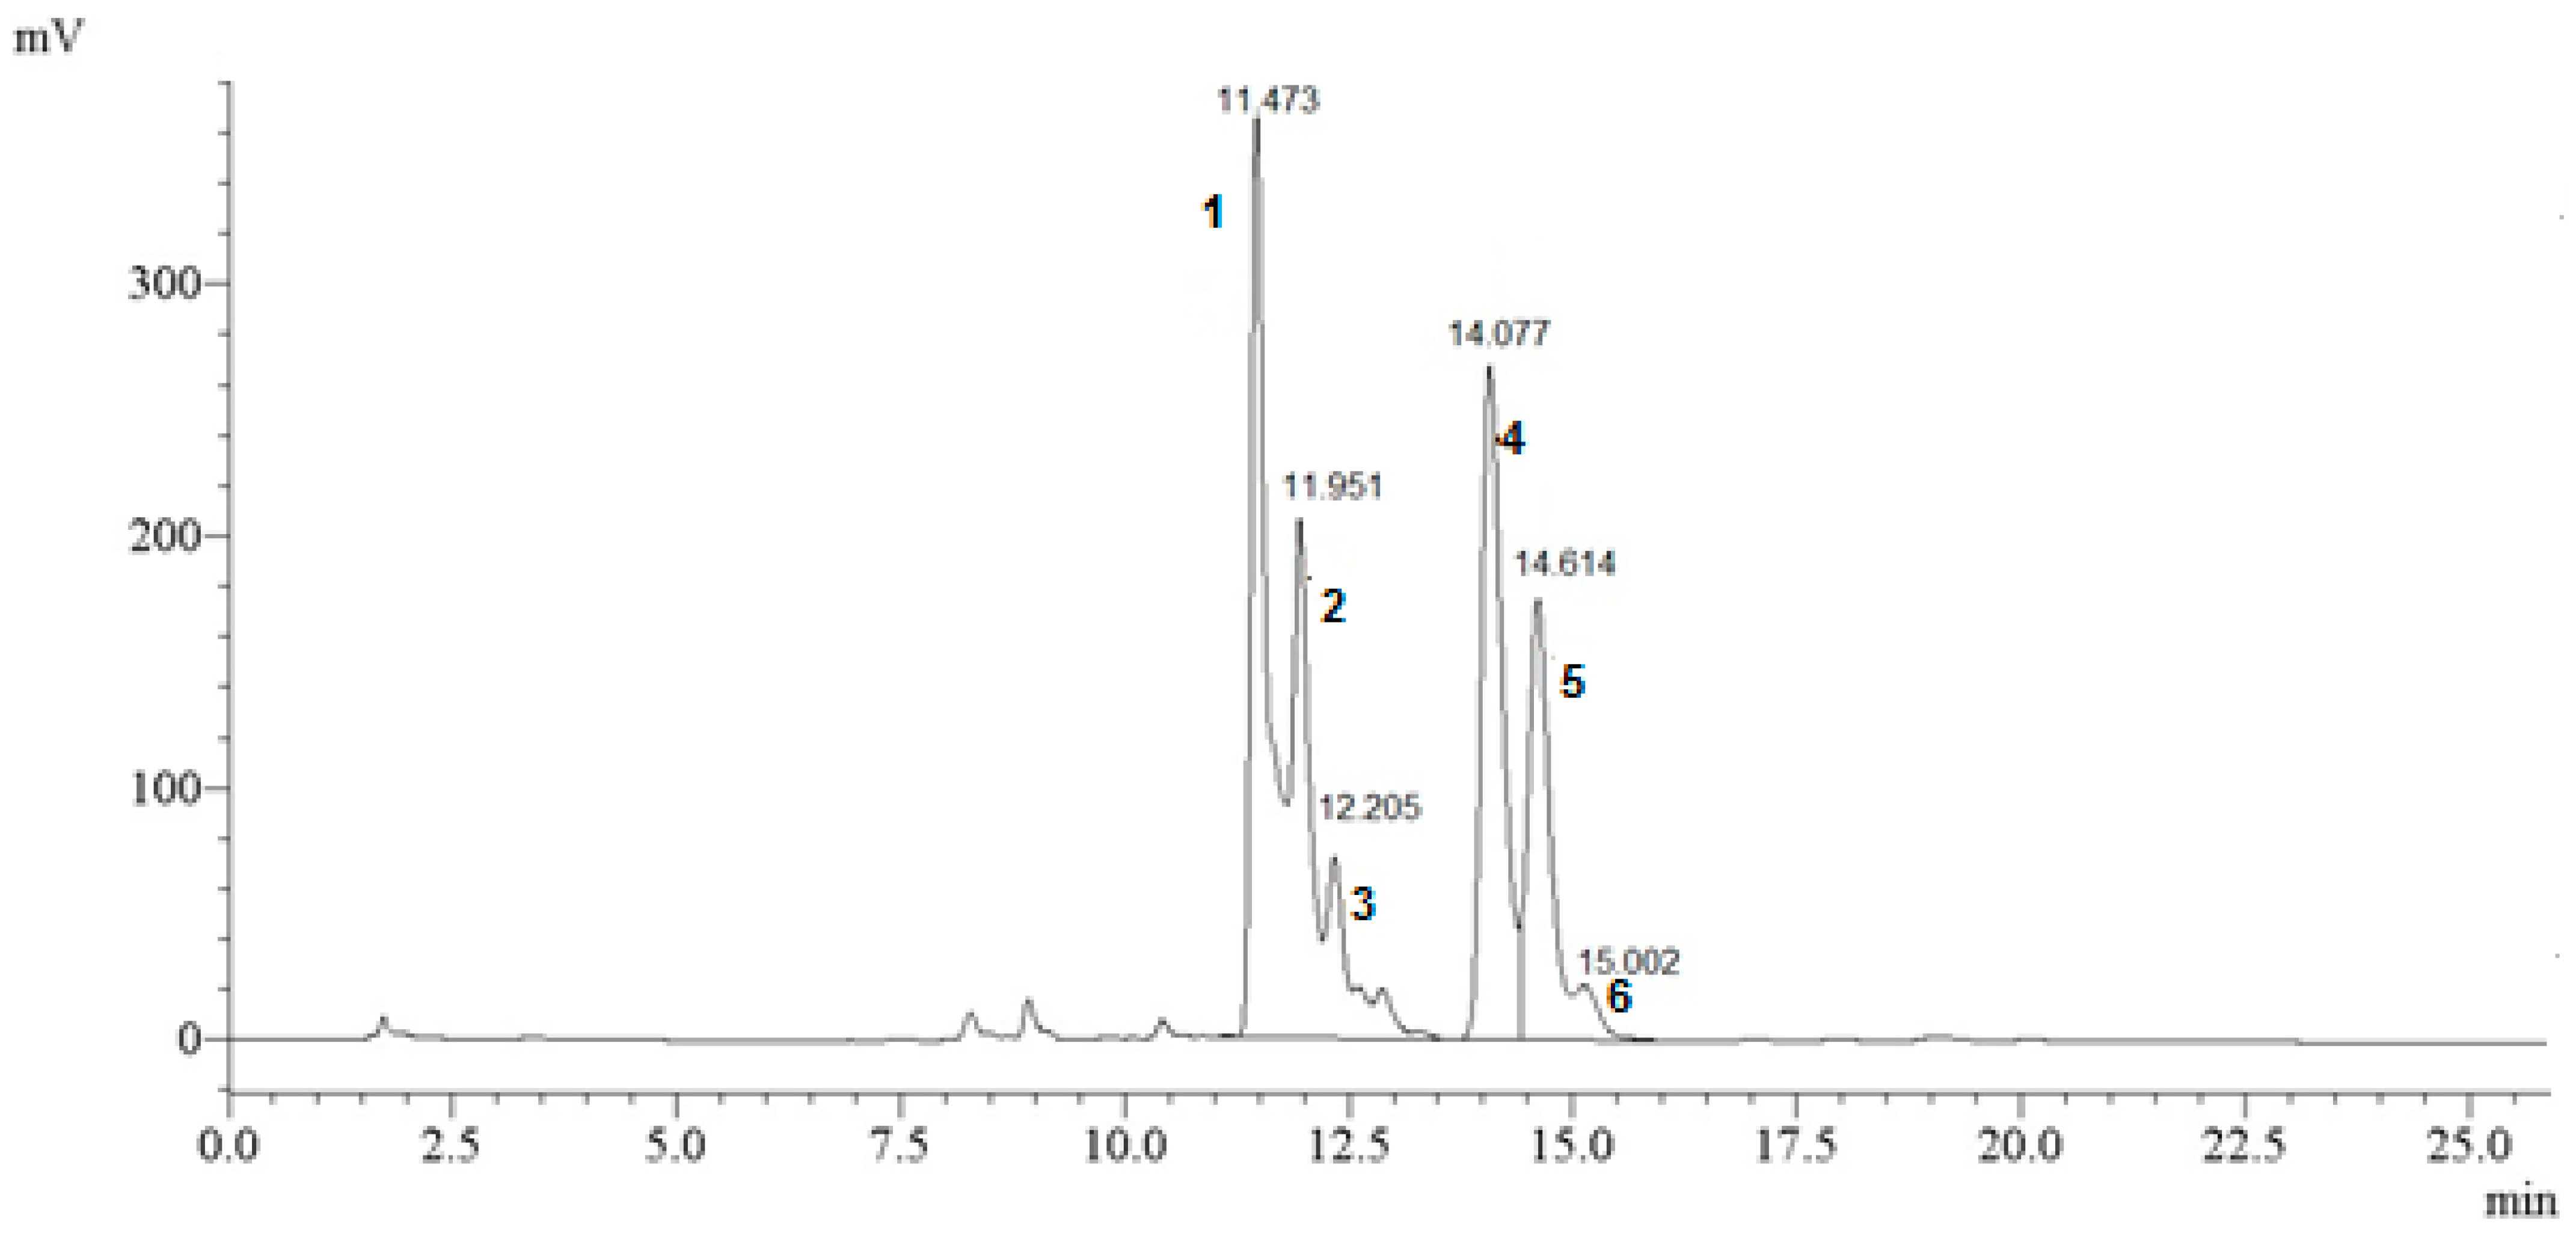
2.6. Separation and Identification of Individual Phenolic Compounds

A LC-20 HPLC system (Shimadzu, Kyoto, Japan) consisting of a Sigma-Aldrich Kromasil C18 column (25 cm × 4.6 mm, 5 μm particle size) maintained at 40 °C, and a diode array detector was used to separate and identify phenolic compounds in the phenolic extract described above. Each sample was analyzed in duplicate and 20 μL was injected into the system using an auto sampler. The binary mobile phase consisted of methanol acidified with 0.3% phosphoric acid (A) and water (B). The following 25 min gradient elution program was used for all analyses: 20% A to 45% A at 5 min, 48% A at 17 min, 20% A at 20 min, followed by 5 min of re-equilibration of the column before the next run. Data were collected and calculated using the LC solution software (Shimadzu, Kyoto, Japan). The detection wavelength on the diode array detector was set at 370 nm. The chromatographic peaks obtained were identified by comparing the elution profiles to those reported by [21], under the same conditions of extraction and using the same instrumentations, and those reported by [30], who studied phenolics in parsley grown on a tree–chicken compost supplemented with biochar, similar to treatment T45 in this study. Using these criteria, the following six compounds were identified with some certainty: apigenin-7-apiosylglucoside (apin) (1), diosmetin-apiosylglucoside (2), diosmetin-apiosylglucoside isomer (3), apigenin-malonyl-apiosylglucoside (malonyl apin) (4), diosmetin-malonyl-apiosylglucoside (5), and apigenin-malonylglucoside (6). The compounds were quantified using a regression curve of six concentrations of apigenin (R2 ≥ 0.962). The content of each individual flavonoid is expressed in mg apigenin equivalent per g of freeze-dried sample (mg g−1 DM).

2.7. Determination of Total Anthocyanins (TAC) in Parsley Samples

The TAC was determined by the pH differential assay [31]. Freeze-dried samples (1 g) were extracted in 5.0 mL of 1% HCl in methanol in the dark for 1 h at 4 °C, with intermittent agitation. The liquid fraction was separated by centrifugation at 3500 rpm for 15 min at 45 °C. For each sample, 1.0 mL aliquots of the liquid fraction were diluted to 6.0 mL with two different buffer solutions: potassium chloride buffer (0.025 M, pH 1.0) and sodium acetate buffer (0.4 M, pH 4.5). After 15 min of the reaction, both solutions were filtered through a Whatman No.4 paper. Thereafter, the absorbance of the solutions was measured at 530 nm (corresponding to the maximum absorption of cyanidin 3-O-glucoside), as well as at 700 nm to compensate for the contribution of chlorophylls. Absorbance (A) was calculated using (A530–A700) pH 1.0–(A530–A700) pH 4.5. The TAC is expressed as mg cyanidin 3-O-glucoside equivalent per g of freeze-dried sample (mg CGE g−1 DW) and was calculated using the equations (A × molecular weight of cyanidin 3-O-glucoside i.e., 449.2 g/mol × dilution factor × 100 × volume) ÷extinction coefficient of cyanidin 3-O-glucoside i.e., 26,900 × dilution volume × sample weight).

2.8. Statistical Analysis

The experimental design was a completely randomized block design in a 5 × 5 factorial scheme (25 treatments), with four biological replicates per treatment. Each replicate was analyzed in duplicate (technical replicates), and the average values were used for the statistical analyses. All data were subjected to principal component analysis (PCA) and analysis of variance (ANOVA). PCA was performed to summarize the nutritional and phenolic variables (six phenolic compounds, TPC, TFC, TAC, % DPPH, trolox DPPH, N, P, and K) by identifying variables that strongly differ across treatments, and to define linear combinations that best explained the relationships between the treatments. The main components were extracted from an unaltered correlation matrix and then orthogonally rotated using Varimax criteria. To satisfy modelling assumptions and owing to measurements with a mean value of 0 and a variance of more than 1, all data were square root transformed and mean scaled before PCA analysis. Two components were selected based on the amount of explained variance (at least 80%), as well as a conservative approach where all components that contained eigenvalues higher than the eigenvalue randomly generated using the broken-stick method were retained [32]. Phenolic and nutritional value data as well as yield data were analyzed using ANOVA. The assumptions of normal distribution and homogeneity were first verified, and the Duncan test was used for the comparison of means. A difference of p < 0.001 was considered to indicate significance.

3. Results and Discussion

3.1. Chemical Characteristics of the Composts and the Organic Substrates (Compost-Biochar Mixtures)

The compost–biochar mixtures were analyzed to determine their N, P, and K contents. Nutrient levels were higher with the cotton–chicken compost than with the other composts (e.g., 53.41 g kg−1 N, 3.43 g kg−1 P, and 13.34 g kg−1 K for C00), followed by the napier−chicken compost N00 (40.67 g kg−1 N, 2.30 g kg−1 P and 10.95 g kg−1 K) (Table 1). The nutrient composition of composts varies with the chemical properties of the raw materials and the composting temperature, but other factors may also be important such as moisture, C:N, aeration, and pH [4,5,9]; these factors could help explain the variations in nutrients among different types of organic substrates. The quantity of biochar added to soil is expected to have an impact on the extent to which nutrient levels and soil processes are affected [11]. Based on Table 1, the higher the amount of biochar added to the compost-biochar mixture, the lower the N content in the mixtures. N is the main nutrient that limits crop growth [2]. Thus, in order to sustain high crop yields in intensive crop production systems, N fertilization is required. However, low N levels as found with the compost-biochar mixtures my produce high nitrogen use efficiencies and result in good yields depending on crop species and biotic and abiotic factors. In fact, the physiological nitrogen use efficiency of some agro-food wastes (e.g., rapeseed waste) was reported to be twice as high as that of inorganic fertilizers [2].
The addition of biochar to the composts similarly lowered the P contents of the substrates, with the highest contents obtained for C00 (3.43 g kg−1), B00 (3.07 g kg−1), and S00 (3.00 g kg−1). Biochar addition to soil is known to decrease P sorption capacity, presumably because inorganic P desorbed from biochar resorbed onto the mineral soil [3]. The content of K decreased with increased amounts of biochar for the napier and cotton-based substrates, but increased for the bagasse, sawdust, and the tree-based substrates (Table 1).
Most composts cannot be used directly as container media constituents because they contain high salt or nutrient levels [9,12]. In this study, biochar was added to the composts to decrease their EC values. Based on Table 1, a higher amount of biochar in the substrates significantly decreased their EC, with the highest value of 18.30 dS m−1 obtained with C00. The average EC values appeared in the order C > N > B > T > S. The pH values ranged from 6.85 (B00) to 8.94 (T60), with no significant differences (p < 0.05) found among the organic substrates. Soil pH is a major factor that influences the growth of crops. Organic amendments such as composts have been used as a mean of acid soil correction with various outcomes [9]. The results from this study show that biochar addition to the composts tended to stabilize pH. The ability of composts or biochar to increase and stabilize soil pH is attributable to the presence of basic cations released during the mineralization process or upon microbial decarboxylation [3,11].

3.2. Parsley Yield as Affected by the Different Organic Substrates

On a fresh and dry weight basis, the highest parsley yields were obtained with the sawdust-based substrate, regardless of the amount of biochar added to the substrates: 36.80 g pot1 (S15), 27.10 g pot1 (S45), 26.95 g pot1 (S30), and 26.13 g pot1 (S00), and 21.05 g pot1 (Table 2). High yields were obtained with the bagasse-chicken substrates; however, these yields were only obtained at high biochar proportions: B45 (27.91 g pot1), B30 (25.26 g pot1), and B60 (25.12 g pot1). A key physical feature of biochar is its highly porous structure and large surface area [3,6,12]. This structure can provide for efficient diffusion of nutrients. In the presence of biochar, the compost made from sawdust and bagasse might release their nutrients for plant uptake and utilization more rapidly than with the other substrates. Despite their high levels of N (Table 1), the tree and cotton-based substrates led to moderate yields, ranging from 12.70 (T45) to 19.20 (C30) g. pot−1 FW, depending on the amount of biochar added (Table 2). The discrepancy between the substrate nutrient content and parsley yield could be explained by the fact that nutrient availability is influenced by the quantity and quality of carbon [2,9]. Indeed, the availability of N and other essential nutrients is reported to be low, with substrates with high C:N ratio [2,11,12]. Carbon-based lignocellulosic compounds (cellulose, hemicellulose, and lignin) were particularly high in the cotton-chicken substrates and might have lowered the degree of humification [5]. Lignin, in particular, is a carbon fraction whose degradation is very slow and correlated with the generation of pH [5]. There is also evidence that biochar inhibits mineralization of soil organic C [11]. Therefore, the management of both N and C resources is important, as this affects basic physiological functions associated with biomass production and grain yield.
Increased yield with increasing proportions of biochar was observed with the napier and cotton-based substrates, but not with the other substrates (Table 2). Compared to the other treatments, the napier-based substrate was less suitable for the development of seedlings. In fact, seed emergence was totally inhibited with N15 and N00. Napier grass has been extensively studied in relation to its allelopathic effects [33]. The grass has been reported to exert its allelopathic effect by destroying the chlorophyll of neighboring plants using N-containing compounds [33,34]. However, several authors have reported the unsuitability of napier grass as a composting material for horticultural crops. For instance, in one study [35], a napier grass-based compost led to poorer development of lettuce, beet, and tomato seedlings than a brown hemp (Crotalaria juncea)-based compost. An increase in plant yield has been reported with the application of different organic amendments e.g., hazelnut husk-based compost on garden cress [10], dairy manure on parsley [1], liquid organic fertilizers on potted gerbera [7], and green waste-derived biochar on the ornamental plant Calathea rotundifola. Some composts even show physical and chemical characteristics similar to peat, making them suitable as peat substitutes [9]. All these data and those reported in this study demonstrate that there are thresholds at which the application of compost or biochar to soil has an effect on yield, and that these thresholds are different for different organic substrates.

3.3. Nutritional Quality of Parsley Based on the Different Organic Substrates

It has been suggested that the optimization of crop nutrition with organic amendments is essential to ensure the production of high-quality foods [10]. In this study, parsley plants obtained from the different treatments had N, P, and K contents of 25.49, 1.33, and 30.79 g kg−1 on average, respectively (Table 2). Plants grown in organic systems reportedly have superior nutritional quality relative to those from conventional fertilization [10]. Such a result was not found in this study, as the N, P, and K values were within the range of those reported for conventionally-grown parsley in the state of Paraná in Brazil. Trani et al. [36] reported N contents between 30.00 and 50.00 g kg−1, P contents between 4.00 and 8.00 g kg−1, and K contents between 25.00 and 40.00 g kg−1, for parsley grown in São Paulo.
The highest N contents were measured in plants grown on sawdust-chicken and bagasse-chicken substrates, in particular SOO (35.37 g kg−1) and B15 (35.48 g kg−1). The addition of 45% and 60% biochar to the composts did not significantly affect parsley N content (Table 2). The composts used in this study have also been reported to increase the level of N in gerbera [7,8].
When the same amount of biochar was added to the substrates, the P content in parsley followed the order T > B > S > C > N. On average, the highest P contents were obtained with 0% biochar (3.28, 3.03, and 3.03 g kg−1 for S00, T00, and B00, respectively) (Table 2). According to a previous study [37], the absorption of P decreases with increasing pH and ceases at pH 9. Thus, the organic substrates did not favor P absorption based on their high pH (Table 1). However, a positive relationship was found between the substrate P and the parsley P contents for B00, S00, and T00 (Table 1; Table 2). These results could be explained by the relative proportions of the different types of P present in the substrates, which determines the overall availability of phosphorus [6,38,39].
With respect to K, the highest content was obtained with T45 (48.25 g kg−1) (Table 2). Two noticeable differences were observed: (a) mixtures with the cotton–chicken compost consistently led to parsley with high K levels (e.g., 45.19 g kg−1 for C30, C15, and C00); (b) K increased as the biochar amount added to the napier–chicken compost increased, from 6.80 g kg−1 (N30) to 47.88 g kg−1 (N60) (Table 2). Malavolta [27] noted that N, P, and K are taken up by plants at different rates. Generally, N and P uptake continue until near maturity, but K absorption is largely completed by flowering time. All these kinetics might also influence the actions of composts and biochar.

3.4. Antioxidant Activity of Parsley Based on the Different Organic Substrates

The antioxidant capacity of the extract was evaluated using the DPPH radical scavenging assay. Although the method does not measure the inhibition of the entire oxidation process, it gives information on the ability of the compounds present in the extract to react with radicals in a single free radical reaction, which can be used as a reasonable screen for the ability to maintain redox status in tissues [16]. As depicted in Table 3, with the exception of the napier-based substrate, treatments with increased proportion of biochar in the substrates tended to result in parsley plants with increased antioxidant activities. The relative contribution of biochar to improved antioxidant activity was generally higher with the tree-based substrate than the other substrates: T60 (47.63%), T45 (50.65%), T30 (47.61%), T15 (41.48%) (Table 3). Further, although the highest % DPPH was observed with N45 (62.26%), on a trolox equivalent basis, T45 still showed the highest antioxidant activity (21.79 g TE g−1). A high antioxidant activity was also observed with B60 (48.49%), and the lowest activities were with B00 (27.41%), B15 (28.77%), and S30 (26.14%). The effect of organic amendments on plant antioxidants could occur via a number of mechanisms. Currently, there is little direct evidence on the actual mechanisms and their relative importance.
The antioxidant capacity of plant tissues is associated with the activity of antioxidative enzymes and the content of antioxidant compounds, such as phenolic acids, flavonoids, and anthocyanins [20,22,40]. In this study, a strong correlation was found between the antioxidant activity and the TFC, but not between the antioxidant activity and the TPC or the TAC (data not shown).
Similar to % DPPH, the tree-based substrate had the most positive impact on the TFC, with 24.48, 22.76, 23.50, 20.03, and 24.27 mg CE g−1 for T60, T45, T30, T15, and T00, respectively (Table 3). The free hydroxyl group on the phenolic ring is responsible for the antioxidant property of phytochemicals [16,41]. Flavonoids present in the parsley extracts may have had a greater ability to donate their hydrogen atom to reactive oxygen species than phenolic acids and anthocyanins, thereby reducing and neutralizing these free radicals. The highest TFC was obtained with S60 (27.18 mg CE g−1); however, this was considered an outlier when all data were compared.
The highest TPC was obtained with B60 (9.22 mg GAE g−1). Parsley plants grown on the napier-based substrate had the lowest TFC and TPC, despite the added proportion of biochar to the substrates (Table 3). Such findings might be because allelopathic substances released by the grass inhibited absorption from soil or biosynthesis of polyphenols by plants. Interestingly, the napier-based substrate led to parsley plants with high TAC, at 0.34, 0.40, and 0.48 mg CGE g−1 for N60, N45, and N30, respectively (Table 3). There is strong evidence that anthocyanins act as stress indicators in plants [14,31] and strengthen the defense system of the plants by fighting free radicals [42]. Given their low yield, mineral contents (Table 2), and accumulation of phenolic acids and flavonoids, parsley plants grown on the napier-based substrate might have been more nutritionally stressed or exposed to pest and pathogen pressures [17,33,43] that might have stimulated anthocyanin production. Appreciable TACs were also obtained with C00 (0.46 mg CGE g−1), T15 (0.45 mg CGE g−1), and S30 (0.40 mg CGE g−1) (Table 3). The effect of organic amendments on food quality has received less attention than crop yield [10]. The data from this study support the hypothesis that organic substrates have a high value for improving both the yield and quality of horticultural crops. The properties of both the composts and biochar are likely to be vital for determining the direction and magnitude of these improvements.

3.5. Individual Flavonoids in Parsley Based on the Different Organic Substrates

In this study, six flavonoids were identified in the leaves and stems of parsley grown using different organic substrates (Figure 1). The treatments affected the contents, but did not change the composition of flavonoids or their relative abundances when ranked. In all samples, apigenin-7-apiosylglucoside (1) was the major compound (average 15.95 mg g−1), accounting for approx. 62.41% of the six flavonoids detected. This finding was in agreement with that of previous studies [35,44,45,46]. Although growth conditions significantly affect the contents of flavonoids in plants, making it difficult to compare literature data, the contents of (1) found in this study (10.72 to 25.21 mg g−1) were within the range of those reported previously (21.80 to 36.01 mg g−1) [45]. Luthria [21] also found that (1) was abundant in parsley, followed by apigenin-malonyl-apiosylglucoside (4). In this study, diosmetin-apiosylglucoside (2) (average 5.58 mg g−1) exhibited a higher content than (4) (average 2.81 mg g−1), followed by diosmetin-apiosylglucoside isomer (3) (average 1.73 mg g−1) and diosmetin-malonyl-apiosylglucoside (5) (average 1.68 mg g−1). Apigenin-malonylglucoside (6) was only detected in some samples, with contents ˂ 0.64 mg g−1 (Table 4).
Generally, increasing the amount of biochar in the substrates did not result in increased flavonoid contents, with (3) for the bagasse, tree, napier, and cotton-based substrates being the only exception (Table 4). The napier-based substrate proved less effective for the production of parsley with high flavonoid contents. The tree-based substrate had a significantly positive influence on the accumulation of all individual flavonoids in parsley, compared to the other treatments, except (1) in parsley grown on T60. This finding aligned with the high levels of TFC, TPC, and DPPH in parsley grown with the tree-based substrate (Table 3). The highest levels of (2) (9.98 mg g−1), (3) (7.35 mg g−1), (4) (5.39 mg g−1), (5) (5.25 mg g−1), and (6) (1.45 mg g−1) were obtained with T30, T60, T45, T60, and T60, respectively. Furthermore, although the highest levels of (1) was with S45 (25.21 mg g−1), the second highest level was with T30 (24.35 mg g−1) (Table 4). For compounds (1) and (2), the second-best treatments were the sawdust and cotton-based substrate. Parsley grown on B60 and C60 had appreciable levels of the two compounds: 18.69 and 23.43 mg g−1 for (1), and 6.96 and 8.10 mg g−1 for (2). The six flavonoids assessed in this study have been extensively evaluated for their health effects. Several studies attest to the beneficial effects of apigenin-derived compounds on human health, such as inhibition of cancer cell growth [47]. Therefore, parsley grown on the tree-based substrate or B60, when consumed, could lead to better health effects in humans. These beneficial effects could be even more important if one considers the potential conversion of malonyl derivatives by endogenous esterases into apigenin-7-apiosylglucoside [48,49].

3.6. PCA of Data

In the organic substrates, N, P, and EC decreased with increased biochar proportion. Furthermore, K tended to decrease with increased biochar proportion for the napier and cotton-based substrates. However, no clear relationship was found between the mineral contents of the substrates, the mineral content of parsley, and parsley yield. All parsley data were subjected to PCA to identify the relationships between the measured variables. The score plot of PCA showed that the plant residue used as a carbon source in the preparation of the composts, and not the amount of biochar added to the substrates as depicted in some other studies [11,50], was the main source of variance in the data. Based on Figure 2, tree-based substrates, as well as the sawdust and napier-based substrates, tended to cluster on the PCs.
When only antioxidants variables were included in the analyses, the first two components of the PCA explained 93.73% of the total data variance. PC1 accounted for 86.49% of the variance and was mostly influenced by TFC, DPPH, and flavonoids (1) and (2). These parameters were all positioned on the negative coordinates of the axes and were associated with the tree-based substrates. Although moderate yields were observed with the tree-based substrates (T00 to T45), the substrates led to higher flavonoids contents and antioxidant activities (Table 2, Table 3 and Table 4). Appreciable flavonoid contents were also obtained with the bagasse-based compost, especially B60, which was well separated from the other treatments on the plot. PC2 accounted for 7.24% of the variance in the data and was associated with chemical responses in parsley grown on the napier-based substrate. The main parameter contributing to the separation of samples on the PC2 was the TAC. Although the lowest yields were obtained with the napier-based substrate (as well as lowest N, P, K, and flavonoid contents), N30 and N45 led to high levels of anthocyanins in the parsley plants (Table 2, Table 3 and Table 4).
The impact of minerals on the overall variance in parsley was also visualized in the loading plots (94.10% of total variance with 88.17% for PC1 and 5.93% for PC2). The model predictor revealed that parsley nutritional quality was better described by the tree-based substrates. Higher N contents were obtained with the bagasse-based substrate, the highest K contents with the cotton-based substrate, and the highest P contents with B00, S00, and T00, with moderate contents for all minerals obtained with the tree-based substrates (Table 2, Table 3 and Table 4).

4. Conclusions

Overall, the data of this study revealed that antioxidant and nutrient responses were highest in parsley plants grown on the tree–chicken composted substrates and supplemented with 15, 30, 45, and 60% biochar (T15, T30, T45, T60), bagasse–chicken composted substrate supplemented with 60% biochar (B60), and napier–chicken composted substrate supplemented with 45% biochar (N45). However, the highest yields were obtained with the sawdust-chicken composed substrate. These data demonstrate that the ability to manipulate composts and biochar, as well as cultivation parameters, can help meet specific yield and quality goals [6]. Related to quality, there is a clear need to generate a robust understanding of the mechanisms by which organic amendments affect nutrients and bioactive compounds in crops. The potential benefits to crop growth of compost and biochar mixtures can be harnessed for container and greenhouse-grown crops [12]. However, physicochemical properties of organic substrates in containers are different from those founds on farms. Therefore, field experiments are needed in order to extrapolate the findings of this study to field-grown crops.

Author Contributions

Conceptualization, M.S.S.M.C.; methodology, F.T.S., P.G., L.A.M.C., M.S.S.M.C. and H.T.; validation, P.G. and M.S.S.M.C.; formal analysis, F.T.S. and P.G.; investigation, F.T.S., M.S.S.M.C. and L.A.M.C.; resources, M.S.S.M.C.; data curation, P.G.; writing—original draft preparation, F.T.S.; writing—review and editing, F.T.S., P.G., L.A.M.C., M.S.S.M.C. and H.T.; supervision, M.S.S.M.C. and P.G.; project administration, M.S.S.M.C.; funding acquisition, M.S.S.M.C. and P.G. All authors have read and agreed to the published version of the manuscript.

Funding

This work was supported by the Fundação para a Ciência e a Tecnologia (grant number UIDB/04033/2020). The authors are grateful to the PhD scholarship awarded to Francielly T. Santos by the Coordenação de Aperfeiçoamento de Pessoal de Nível Superior (CAPES sandwich mode PSDE, no. 6547-14-1).

Institutional Review Board Statement

Not applicable.

Informed Consent Statement

Not applicable.

Acknowledgments

The authors are grateful to the Agricultural Engineering Graduate Program PGEAGRI of Universidade Estadual do Oeste do Paraná (Brazil).

Conflicts of Interest

The authors declare no conflict of interest. The funders had no role in the design of the study; in the collection, analyses, or interpretation of data; in the writing of the manuscript; or in the decision to publish the results.

References

  1. Escobar, A.C.N.; Nascimento, A.L.; Gomes, J.G.; Borba, R.V.; Alves, C.C.; Costa, C.A. Avaliação da produtividade de três cultivares de salsa em função de diferentes substratos. Hortic. Bras. 2010, 28, S2671–S2676. [Google Scholar]
  2. Tamele, R.A.; Ueno, H.; Toma, Y.; Morita, N. Nitrogen recoveries and nitrogen use efficiencies of organic fertilizers with different C/N ratios in maize cultivation with low-fertile soil by 15N method. Agriculture 2020, 10, 272. [Google Scholar] [CrossRef]
  3. Morales, M.M.; Comerford, N.B.; Behling, M.; de Abreu, D.C.; Guerrini, I.A. Biochar chemistry in a weathered tropical soil: Kinetics of phosphorus sorption. Agriculture 2021, 11, 295. [Google Scholar] [CrossRef]
  4. Šubová, E.; Sasáková, N.; Zigo, F.; Mindžáková, I.; Vargová, M.; Kachnič, J.; Laktičová, K.V. Amendment of livestock manure with natural zeolite-clinoptilolite and its effect on decomposition processes during composting. Agriculture 2021, 11, 980. [Google Scholar] [CrossRef]
  5. Santos, C.; Goufo, P.; Fonseca, J.; Pereira, J.; Ferreira, L.; Coutinho, J.; Trindade, H. Effect of lignocellulosic and phenolic compounds on ammonia, nitric oxide and greenhouse gas emissions during composting. J. Clean. Prod. 2018, 171, 548–556. [Google Scholar] [CrossRef]
  6. Frišták, V.; Pipíška, M.; Turčan, V.; Bell, S.M.; Laughinghouse, H.D., IV; Ďuriška, L.; Soja, G. Preparation and characterization of novel magnesium composite/walnut shells-derived biochar for as and P sorption from aqueous solutions. Agriculture 2021, 11, 714. [Google Scholar] [CrossRef]
  7. Santos, F.T.; Ludwig, F.; Costa, L.A.M.; Costa, M.S.S.M. Nutrition and growth of potted gerbera according to mineral and organic fertilizer. Rev. Bras. Hortic. Ornam. 2015, 21, 251–258. [Google Scholar] [CrossRef]
  8. Santos, F.T.; Ludwig, F.; Costa, L.A.M.; Costa, M.S.S.M.; Remor, M.B.; Silva, P.E.R. Growth analysis of potted gerbera conducted with mineral fertilization and organic fertigation. Cienc. E Investig. Agraria 2016, 43, 111–120. [Google Scholar] [CrossRef] [Green Version]
  9. Fornes, F.; Carrión, C.; García de la Fuente, R.; Puchades, R.; Abad, M. Leaching composted lignocellulosic wastes to prepare container media: Feasibility and environmental concerns. J. Environ. Manag. 2010, 91, 1747–1755. [Google Scholar] [CrossRef]
  10. Karaal, G.; Ugur, A. Lepidium sativum cultivation in organic fertilizer added hazelnut husk compost. Ekoloji Derg. 2014, 23, 33–39. [Google Scholar] [CrossRef]
  11. Prayogo, C.; Jones, J.E.; Baeyens, J.; Gary, D. Impact of biochar on mineralisation of C and N from soil and willow litter and its relationship with microbial community biomass and structure bending. Biol. Fertil. Soils 2014, 50, 695–702. [Google Scholar] [CrossRef]
  12. Dumroese, R.K.; Heiskanen, J.; Englund, K.; Tervahauta, A. Pelleted biochar: Chemical and physical properties show potential use as a substrate in container nurseries. Biomass Bioenergy 2011, 35, 2018–2027. [Google Scholar] [CrossRef]
  13. Tian, Y.; Suna, X.; Li, S.; Wang, H.; Wang, L.; Cao, J.; Zhang, L. Biochar made from green waste as peat substitute in growth media for Calathea rotundifola cv. Fasciata. Sci. Hortic. 2012, 143, 15–18. [Google Scholar] [CrossRef]
  14. Goufo, P.; Singh, R.K.; Cortez, I. A Reference list of phenolic compounds (including stilbenes) in grapevine (Vitis vinifera L.) roots, woods, canes, stems, and leaves. Antioxidants 2020, 9, 398. [Google Scholar] [CrossRef]
  15. Crozier, A.; Jaganath, I.B.; Clifford, M.N. Dietary phenolics: Chemistry, bioavailability and effects on health. Nat. Prod. Rep. 2009, 26, 1001–1043. [Google Scholar] [CrossRef]
  16. Goufo, P.; Henrique, H. Factors influencing antioxidant compounds in rice. Crit. Rev. Food Sci. Nutr. 2017, 57, 893–922. [Google Scholar] [CrossRef]
  17. Naczk, M.; Shahidi, F. Extraction and analysis of phenolics in food. J. Chromatogr. A 2004, 1054, 95–111. [Google Scholar] [CrossRef]
  18. Deng, J.; Cheng, W.; Yang, G. A novel antioxidant activity index (AAU) for natural products using the DPPH assay. Food Chem. 2011, 125, 1430–1435. [Google Scholar] [CrossRef]
  19. Oliveira, G.L.S. Determination in vitro of the antioxidant capacity of natural products by the DPPH•method: Review study. Rev. Bras. Plant. Med. 2015, 17, 36–44. [Google Scholar] [CrossRef]
  20. Liberal, Â.; Fernandes, Â.; Polyzos, N.; Petropoulos, S.A.; Dias, M.I.; Pinela, J.; Petrović, J.; Soković, M.; Ferreira, I.C.F.R.; Barros, L. Bioactive properties and phenolic compound profiles of turnip-rooted, plain-leafed and curly-leafed parsley cultivars. Molecules 2020, 25, 5606. [Google Scholar] [CrossRef]
  21. Luthria, D. Influence of experimental conditions on the extraction of phenolic compounds from parsley (Petroselinum crispum) flakes using a pressurized liquid extractor. Food Chem. 2008, 107, 745–752. [Google Scholar] [CrossRef]
  22. Epifanio, N.M.M.; CavalcantI, L.R.I.; Santos, K.F.; Duarte, P.S.C.; Kachlicki, P.; Ożarowski, M.; Riger, C.J.; Chaves, D.S.A. Chemical characterization and in vivo antioxidant activity of parsley (Petroselinum crispum). Food Funct. 2020, 11, 5346–5356. [Google Scholar] [CrossRef]
  23. Vora, S.R.; Patil, R.B.; Pillai, M.M. Oxidative stress associated alterations in lysosomal enzymes and modulatory effect of Petroselinum crispum (Mill) Nyman Ex. A.W. hill leaf extract on mouse brain. Int. J. Sci. Res. 2012, 7, 64–68. [Google Scholar]
  24. Nitsche, P.R.; Caramori, P.H.; Ricce, W.S.; Pinto, L.F.D. Atlas Climático do Estado do Paraná, 1st ed.; Instituto Agronomico Do Paraná (IAPAR): Londrina, Brazil, 2019; pp. 1–216. [Google Scholar]
  25. Lana, M.C.; Fey, R.; Francoloso, J.F.; Richart, A.; Fontaniva, S. Análise Química de Solo e Tecido Vegetal: Práticas de Laboratório, 1st ed.; Edunioeste: Cascavel, Brazil, 2010; pp. 1–130. [Google Scholar]
  26. Silva, C.F. Manual de Análises Químicas de Solos, Plantas e Fertilizantes, 2nd ed.; Embrapa (Empresa Brasileira de Pesquisa Agropecuária) Agricultura Digital e Embrapa Solos: Brasília, Brazil, 2009; pp. 1–627. [Google Scholar]
  27. Malavolta, E. ABC da Adubação, 5th ed.; Agronômica Ceres: São Paulo, Brazil, 1989; pp. 1–292. [Google Scholar]
  28. Li, Z.; Zhao, X.; Sandhu, A.K.; Gu, L. Effects of exogenous abscisic acid on yield, antioxidant capacities, and phytochemical contents of greenhouse grown lettuces. J. Agric. Food Chem. 2010, 58, 6503–6509. [Google Scholar] [CrossRef]
  29. Singleton, V.L.; Rossi, J.A., Jr. Colorimetry of total phenolics with phosphomolybdic phosphotungstic acid reagents. Am. J. Enol. Vitic. 1965, 16, 144–158. [Google Scholar]
  30. Huber, L.S.; Rodriguez-Amaya, D.B.; Rodrigues, M.I. Optimization and validation of HPLC methodology for determining flavonols and flavones in vegetables. Rev. Inst. Adolfo Lutz 2007, 66, 142–151. [Google Scholar]
  31. Rodriguez-Saona, L.E.; Giusti, M.M.; Wrolstad, R.E. Anthocyanin pigment composition of red-fleshed potatoes. J. Food Sci. 1998, 63, 458–465. [Google Scholar] [CrossRef]
  32. Jackson, D.A. Stopping rules in principal components analysis: A comparison of heuristical and statistical approaches. Ecology 1993, 74, 2204–2214. [Google Scholar] [CrossRef]
  33. Norhafizah, M.Z.; Ismail, B.S.; Chuah, T.S. Herbicidal activity of Pennisetum purpureum (Napier grass). Afr. J. Biotechnol. 2012, 11, 6269–6273. [Google Scholar] [CrossRef] [Green Version]
  34. Nascimento, R.; Nascimento, D.A.M.; Silva, D.A.; Alves, A.G. Alterações nos teores de clorofilas em plantas de feijão-caupi cultivadas sob diferentes fontes de nitrogênio. Rev. Educ. Agrícola Superior 2012, 27, 94–96. [Google Scholar] [CrossRef]
  35. Lechtenberg, M.; Zumdick, S.; Gerhards, C.; Schmidt, T.J.; Hensel, A. Evaluation of analytical markers characterising different drying methods of parsley leaves (Petroselinum crispum L.). Die Pharm. 2007, 62, 949–954. [Google Scholar] [CrossRef] [PubMed]
  36. van Raij, B.; Cantarella, H.; Quaggio, J.A.; Furlani, A.M.C. Boletim Técnico 100: Recomendações de Adubação e Calagem Para o Estado de São Paulo, 2nd ed.; Instituto Agronômico & Fundação IAC: Campinas, Brazil, 1997; pp. 1–285. [Google Scholar]
  37. Malavolta, E. O Fósforo na planta e interações com outros elementos. In Fósforo na Agricultura Brasileira, 1st ed.; Yamada, T., Abdalla, S.R.S., Eds.; Associacao Brasileira para Pesquisa da Potassa e do Fosfato (Piracicaba, SP): Piracicaba, Brazil, 2004; pp. 35–98. [Google Scholar]
  38. Wei, Y.; Zhao, Y.; Xi, B.; Wei, Z.; Li, X.; Cao, Z. Changes in phosphorus fractions during organic wastes composting from different sources. Bioresour. Technol. 2015, 189, 349–356. [Google Scholar] [CrossRef]
  39. Rheinheimer, D.R.S.; Gatibonil, L.C.; Kaminskil, J. Factors affecting the phosphorus availability and the fertilization management in no-tillage system. Cienc. Rural 2008, 38, 576–586. [Google Scholar]
  40. Cavar, S.; Vidic, D.; Maksimovic, M. Volatile constituents, phenolic compounds, and antioxidant activity of Calamintha glandulosa (Req.) Bentham. J. Sci. Food Agric. 2012, 93, 1758–1764. [Google Scholar] [CrossRef] [PubMed]
  41. Kumaran, A.; Karunakaran, R.J. In vitro antioxidant activities of methanol extracts of five Phyllanthus species from India. Food Sci. Technol. 2007, 40, 344–352. [Google Scholar] [CrossRef]
  42. Olsson, M.E.; Andersson, C.S.; Oredsson, S.; Berglund, R.H.; Gustavsson, K.E. Antioxidant levels and inhibition of cancer cell proliferation in vitro by extracts from organically and conventionally cultivated strawberries. J. Agric. Food Chem. 2006, 54, 1248–1255. [Google Scholar] [CrossRef]
  43. Naczk, M.; Shahidi, F. Phenolics in cereals, fruits and vegetables: Occurrence, extraction and analysis. J. Pharm. Biomed. Anal. 2006, 41, 1523–1542. [Google Scholar] [CrossRef]
  44. Meyer, H.; Bolarinwa, A.; Wolfram, G.; Linseisen, J. Bioavailability of apigenin from apiin-rich parsley in humans. Ann. Nutr. Metab. 2006, 50, 167–172. [Google Scholar] [CrossRef]
  45. Kaiser, A.; Carle, R.; Kammerer, D.R. Effects of blanching on polyphenol stability of innovative paste-like parsley (Petroselinum crispum (Mill.) Nym ex A. W. Hill) and marjoram (Origanum majorana L.) products. Food Chem. 2013, 138, 1648–1656. [Google Scholar] [CrossRef]
  46. El-Zaeddi, H.; Calín-Sánchez, H.; Nowicka, P.; Martínez-Tomé, J.; Noguera-Artiaga, L.; Burló, F.; Wojdyło, A.; Carbonell-Barrachina, A.A. Preharvest treatments with malic, oxalic, and acetylsalicylic acids affect the phenolic composition and antioxidant capacity of coriander, dill and parsley. Food Chem. 2017, 226, 179–186. [Google Scholar] [CrossRef]
  47. Farzaei, M.H.; Abbasabadi, Z.; Assdekani, M.R.S.; Rahimi, R.; Farzaei, F. Parsley: A review of ethnopharmacology, phytochemistry and biological activities. J. Tradit. Chin. Med. 2013, 6, 815–826. [Google Scholar] [CrossRef] [Green Version]
  48. Hostetler, G.L.; Riedl, K.M.; Schwatz, S.L. Endogenous enzymes, heat, and pH affect flavone profiles in parsley (Petroselinum crispum var. neapolitanum) and celery (Apium graveolens) during juice processing. J. Agric. Food Chem. 2012, 11, 1–19. [Google Scholar] [CrossRef] [PubMed] [Green Version]
  49. Boldizsár, I.; Fuzfaib, Z.; Molnár-Perlb, I. Characterization of the endogenous enzymatic hydrolyses of Petroselinum crispum glycosides: Determined by chromatography upon their sugar and flavonoid products. J. Chromatogr. A 2013, 1293, 100–106. [Google Scholar] [CrossRef] [PubMed]
  50. Kocsis, T.; Kotroczó, Z.; Kardos, L.; Biró, B. Optimization of increasing biochar doses with soil–plant–microbial functioning and nutrient uptake of maize. Environ. Technol. Innov. 2020, 20, 101191. [Google Scholar] [CrossRef]
Figure 1. Chromatogram of flavonoids in parsley grown on different organic substrates: (1) apigenin-7-apiosylglucoside (apin), (2) diosmetin-apiosylglucoside, (3) diosmetin-apiosylglucoside isomer, (4) apigenin-malonyl-apiosylglucoside (malonyl apin), (5) diosmetin-malonyl-apiosylglucoside, (6) apigenin-malonylglucoside.
Agriculture 11 01168 g001
Figure 2. Score and loading biplots of PCA of 11 antioxidant variables (a1,a2), and of 3 nutritional and 11 antioxidant variables (b1,b2) evaluated in parsley grown in 25 organic substrates. B: bagasse–chicken compost, S: sawdust–chicken compost, T: tree–chicken compost, N: napier–chicken compost, C: cotton–chicken compost. The number following the compost letters corresponds to the proportion of biochar in the organic substrates.
Agriculture 11 01168 g002
Table 1. Organic substrates used for the cultivation of parsley and their main chemical characteristics 1.
Organic SubstrateProportion of Compost + Proportion of BiocharN (g kg−1)P (g kg−1)K (g kg−1)EC (dS m−1)pH
B6040% of bagasse–chicken compost + 60% of biochar21.52 ± 0.87 g1.72 ± 0.25 ef7.35 ± 0.28 d5.07 ± 0.26 g8.16 ± 0.21 a
B4555% of bagasse–chicken compost + 45% of biochar25.13 ± 1.06 f2.13 ± 0.25 cde6.76 ± 0.44 ef5.71 ± 0.74 f7.64 ± 0.46 a
B3070% of bagasse–chicken compost + 30% of biochar28.69 ± 3.12 ej2.77 ± 0.23 b6.09 ± 0.51 def6.75 ± 1.32 f7.31 ± 0.63 a
B1585% of bagasse–chicken compost + 15% of biochar29.98 ± 1.88 e2.75 ± 0.26 b5.67 ± 0.64 f8.45 ± 0.75 def6.87 ± 1.18 a
B00100% of bagasse–chicken compost + 0% of biochar31.18 ± 0.88 e3.07 ± 0.18 a5.40 ± 1.04 f10.40 ± 0.93 d6.85 ± 0.14 a
S6040% of sawdust–chicken compost + 60% of biochar14.56 ± 0.98 h1.62 ± 0.07 fg6.17 ± 1.03 ef2.67 ± 0.14 i8.69 ± 0.37 a
S4555% of sawdust–chicken compost + 45% of biochar19.83 ± 1.50 g1.99 ± 0.24 de5.89 ± 0.46 ef3.18 ± 0.50 hi8.36 ± 0.44 a
S3070% of sawdust–chicken compost + 30% of biochar20.63 ± 1.60 g2.25 ± 0.13 cd5.64 ± 0.49 f3.62 ± 0.36 h8.04 ± 0.12 a
S1585% of sawdust–chicken compost + 15% of biochar23.63 ± 0.78 fg2.59 ± 0.19 bc4.57 ± 0.27 fg5.03 ± 0.51 g7.43 ± 0.48 a
S00100% of sawdust–chicken compost + 0% of biochar26.23 ± 1.34 ef3.00 ± 0.15 a3.88 ± 0.21 g5.37 ± 0.42 g7.30 ± 0.75 a
T6040% of tree–chicken compost + 60% of biochar21.50 ± 1.93 g1.29 ± 0.22 g7.43 ± 0.34 d3.44 ± 0.58 h8.94 ± 0.53 a
T4555% of tree–chicken compost + 45% of biochar21.54 ± 1.26 g1.41 ± 0.24 g7.63 ± 0.15 d3.79 ± 0.47 h8.79 ± 1.17 a
T3070% of tree–chicken compost + 30% of biochar29.58 ± 2.25 e1.72 ± 0.12 ef7.16 ± 1.10 de4.53 ± 0.73 gh8.25 ± 0.75 a
T1585% of tree–chicken compost + 15% of biochar36.33 ± 1.10 cde1.88 ± 0.30 de7.25 ± 0.71 d6.40 ± 0.62 f7.64 ± 0.48 a
T00100% of tree–chicken compost + 0% of biochar38.81 ± 2.11 cd2.15 ± 0.29 cde6.85 ± 0.94 de6.28 ± 0.73 f7.59 ± 0.41 a
N6040% of napier–chicken compost + 60% of biochar21.18 ± 2.54 g1.16 ± 0.21 g9.61 ± 0.78 c5.56 ± 0.64 fg8.94 ± 1.62 a
N4555% of napier–chicken compost + 45% of biochar25.43 ± 0.73 f1.75 ± 0.22 ef9.74 ± 0.67 c6.72 ± 0.35 f8.75 ± 1.04 a
N3070% of napier–chicken compost + 30% of biochar27.74 ± 1.93 ef2.17 ± 0.66 cd9.72 ± 0.85 c8.35 ± 0.61 ef8.31 ± 0.17 a
N1585% of napier–chicken compost + 15% of biochar34.42 ± 3.21 d2.34 ± 0.24 bc10.17 ± 0.82 bc9.82 ± 0.40 de8.39 ± 0.81 a
N00100% of napier–chicken compost + 0% of biochar40.67 ± 2.92 c2.30 ± 0.41 cd10.95 ± 0.48 bc11.70 ± 0.52 d7.60 ± 0.69 a
C6040% of cotton–chicken compost + 60% of biochar24.42 ± 2.59 f1.79 ± 0.30 ef10.54 ± 0.24 bc6.55 ± 0.24 f8.61 ± 0.50 a
C4555% of cotton–chicken compost + 45% of biochar32.89 ± 1.57 de2.30 ± 0.30 bc10.74 ± 0.21 bc7.94 ± 0.58 ef8.25 ± 0.07 a
C3070% of cotton–chicken compost + 30% of biochar39.76 ± 0.90 c2.64 ± 0.16 b12.15 ± 0.50 ab13.20 ± 0.78 c7.81 ± 0.27 a
C1585% of cotton–chicken compost + 15% of biochar44.96 ± 0.91 b2.99 ± 0.23 ab 12.13 ± 0.90 ab15.52 ± 0.94 b7.79 ± 0.25 a
C00100% of cotton–chicken compost + 0% of biochar53.41 ± 2.54 a3.43 ± 0.21 a13.34 ± 0.44 a18.30 ± 0.82 a7.38 ± 0.13 a
1 Means within a column followed by the same lower-case letter are not significantly different at p ˂ 0.001 (ANOVA; Duncan test); B: bagasse–chicken compost, S: sawdust–chicken compost, T: tree–chicken compost, N: napier–chicken compost, C: cotton–chicken compost; the number following the compost letter corresponds to the proportion of biochar in the organic substrate.
Table 2. Yield, moisture, and N, P, and K contents of parsley grown on different organic substrates 1.
Organic
Substrate
Fresh Matter Yield
(g pot−1 FW)
Dry Matter Yield
(g pot−1 DW)
N Content
(g kg1)
P Content
(g kg1)
K Content
(g kg1)
B6025.12 ± 1.40 bc4.33 ± 0.35 b22.89 ± 2.34 de2.11 ± 0.29 cd26.06 ± 1.21 ef
B4527.91 ± 2.09 b3.88 ± 0.41 bc32.38 ± 1.65 bc2.60 ± 0.14 bc30.35 ± 3.78 cd
B3025.26 ± 4.90 bc3.80 ± 0.82 bc34.40 ± 1.14 ab2.84 ± 0.23 ab27.03 ± 1.03 def
B1519.01 ± 2.87 cd2.74 ± 0.40 de35.48 ± 0.64 a2.23 ± 0.21 bcd34.25 ± 4.31 bc
B0019.00 ± 1.90 de2.34 ± 0.34 def33.82 ± 2.95 bc3.03 ± 0.24 a25.28 ± 1.21 f
S6021.05 ± 1.55 cd3.11 ± 0.07 cd21.73 ± 1.36 de2.07 ± 0.16 cd28.31 ± 2.12 de
S4527.10 ± 1.19 b4.38 ± 0.10 b23.31 ± 2.53 cde1.99 ± 0.16 cde29.24 ± 0.31 cd
S3026.95 ± 2.10 bc4.33 ± 0.28 b29.81 ± 1.40 bcd2.33 ± 0.11 bc26.76 ± 2.30 ef
S1536.83 ± 2.58 a5.65 ± 0.32 a28.57 ± 0.27 bcd2.38 ± 0.14 bc26.11 ± 2.70 ef
S0026.13 ± 4.11 bc3.85 ± 0.68 bc35.37 ± 1.40 a3.28 ± 0.23 a29.89 ± 2.01 cd
T609.84 ± 0.20 f1.61 ± 0.04 fg15.21 ± 0.43 e2.29 ± 0.05 bcd28.98 ± 0.89 de
T4512.70 ± 0.66 ef1.82 ± 0.16 ef25.43 ± 1.57 cd1.68 ± 0.25 de48.25 ± 2.15 a
T3016.46 ± 0.80 de2.64 ± 0.11 de26.85 ± 0.65 cd2.25 ± 0.20 bcd45.97 ± 3.26 a
T1517.05 ± 0.40 de2.49 ± 0.13 de30.76 ± 0.38 bc2.95 ± 0.04 ab26.35 ± 0.66 ef
T0013.87 ± 0.27 def1.79 ± 0.07 fg30.03 ± 1.13 bc3.03 ± 0.45 a28.98 ± 2.02 de
N603.46 ± 1.07 g1.18 ± 0.44 g23.32 ± 2.47 cde1.12 ± 0.10 ef47.88 ± 1.63 a
N459.60 ± 2.90 f1.26 ± 0.50 fg30.41 ± 1.85 bc1.88 ± 0.05 cde45.10 ± 1.56 a
N302.94 ± 1.86 g0.41 ± 0.26 h9.17 ± 5.17 f1.00 ± 1.00 f6.80 ± 3.80 g
N150.00 ± 0.00 h0.00 ± 0.00 iNANANA
N000.00 ± 0.00 h0.00 ± 0.00 iNANANA
C6016.31 ± 3.14 de2.81 ± 0.59 cde26.18 ± 0.48 cd1.64 ± 0.19 def36.40 ± 2.46 b
C4515.50 ± 2.90 de2.81 ± 0.60 cde31.14 ± 3.06 bc1.64 ± 0.29 def36.18 ± 2.18 b
C3019.20 ± 0.75 cd3.24 ± 0.06 cd31.18 ± 0.55 bc1.75 ± 0.08 de45.19 ± 1.86 a
C153.22 ± 1.22 g0.41 ± 0.17 h29.82 ± 0.60 bcd1.75 ± 0.07 de45.19 ± 1.85 a
C002.00 ± 0.49 g0.27 ± 0.08 h29.82 ± 0.60 bcd1.75 ± 0.07 de45.19 ± 1.40 a
1 Means within a column followed by the same lower case letter are not significantly different at p ˂ 0.001 (ANOVA, Duncan test); B: bagasse–chicken compost, S: sawdust–chicken compost, T: tree–chicken compost, N: napier–chicken compost, C: cotton–chicken compost; the number following the compost letter corresponds to the proportion of biochar in the organic substrates; NA: not applicable because seeds did not germinate.
Table 3. Antioxidant activity (percentage DPPH and trolox equivalent DPPH), total phenolics, total flavonoids, and total anthocyanins of parsley grown on different organic substrates 1.
Organic
Substrate
DPPH Scavenging
Activity (%)
DPPH Scavenging
Activity (g TE g−1)
Total Flavonoids
(mg CE g−1)
Total Phenolics
(mg GAE g−1)
Total Anthocyanins
(mg CGE g−1)
B6048.49 ± 2.56 bc17.08 ± 1.00 b20.44 ± 2.05 e9.22 ± 0.42 a0.34 ± 0.02 cd
B4538.61 ± 4.07 e13.60 ± 1.63 d15.14 ± 1.49 gh6.95 ± 0.64 cde0.26 ± 0.01 ef
B3030.07 ± 2.34 gh16.32 ± 3.52 bc16.84 ± 0.79 e6.54 ± 0.35 cde0.25 ± 0.00 efg
B1528.77 ± 2.79 gh9.70 ± 1.17 g13.70 ± 0.60 f6.24 ± 0.40 de0.32 ± 0.01 de
B0027.41± 2.42 gh9.34 ± 0.91 g15.88 ± 1.50 e6.29 ± 0.69 cde0.35 ± 0.04 bc
S6034.73 ± 2.94 f12.19 ± 1.25 ef27.18 ± 1.16 a7.39 ± 0.88 bc0.34 ± 0.05 cd
S4535.49 ± 1.00 f12.49 ± 0.30 e20.97 ± 1.40 ef7.31 ± 0.96 bc0.28 ± 0.00 def
S3026.14 ± 0.58 h9.47 ± 0.74 g19.01 ± 1.41 d5.30 ± 0.26 def0.40 ± 0.03 b
S1529.52 ± 2.49 gh14.64 ± 2.19 c19.75 ± 0.87 cd6.69 ± 1.03 cd0.36 ± 0.02 bc
S0034.81 ± 2.35 f12.32 ± 0.93 e9.71 ± 0.58 h6.69 ± 0.51 cd0.22 ± 0.01 g
T6047.63 ± 0.94 c17.57 ± 0.28 b24.48 ± 0.79 b7.93 ± 0.49 b0.32 ± 0.05 de
T4550.65 ± 5.72 b21.79 ± 4.04 a22.76 ± 1.16 bc6.96 ± 0.93 bcd0.20 ± 0.01 g
T3047.61 ± 2.19 c17.17 ± 0.79 b23.50 ± 1.99 bc8.20 ± 0.40 b0.23 ± 0.01 fg
T1541.48 ± 1.98 de14.96 ± 0.64 c20.03 ± 2.23 cd7.23 ± 0.46 bc0.45 ± 0.07 ab
T0032.62 ± 0.65 g11.17 ± 0.26 f24.27 ± 1.52 b6.92 ± 0.52 bcd0.23 ± 0.01 fg
N6032.90 ± 1.94 g11.44 ± 0.85 f15.70 ±0.30 fg3.74 ± 0.02 fg0.34 ± 0.00 cd
N4562.26 ± 5.44 a20.52 ± 3.65 a13.64 ± 1.05 f6.34 ± 0.61 cde0.40 ± 0.04 b
N3034.62 ± 7.82 f13.89 ± 2.21 cd11.55 ± 1.30 g2:12 ± 0.09 g0.48 ± 0.00 a
N15NANANANANA
N00NANANANANA
C6047.08 ± 6.95 c13.27 ± 0.41 d8.43 ± 0.54 h8.58 ± 0.96 ab0.28 ± 0.02 def
C4542.78 ± 2.30 d15.30 ± 0.99 c11.53 ± 1.80 g8.53 ± 1.51 ab0.37 ± 0.05 bc
C3034.26 ± 3.24 f13.86 ± 0.73 d13.85 ± 0.84 f8.40 ± 0.77 ab0.32 ± 0.01 de
C1537.21 ± 1.82 ef13.02 ± 0.79 de13.01 ± 0.75 f5.19 ± 0.28 ef0.26 ± 0.00 ef
C0038.48 ± 1.17 e13.94 ± 0.65 cd13.68 ± 0.38 f6.57 ± 0.87 cd0.46 ± 0.03 a
1 Means within a column followed by the same lower case letter are not significantly different at p ˂ 0.001 (ANOVA; Duncan test); B: bagasse–chicken compost, S: sawdust–chicken compost, T: tree–chicken compost, N: napier–chicken compost, C: cotton–chicken compost; the number following the compost letter corresponds to the proportion of biochar in the organic substrates; NA: not applicable because seeds did not germinate; GAE: gallic acid equivalent, CE: catechin equivalent, CGE: cyanidin 3-O-glucoside equivalent, TE: trolox equivalent.
Table 4. Individual flavonoids in parsley grown on different organic substrates 1.
Organic SubstrateApigenin-7-apiosylglucoside (1)Diosmetin-apiosylglucoside (2)Diosmetin-apiosylglucoside Isomer (3)Apigenin-malonyl-apiosylglucoside (4)Diosmetin-malonyl-apiosylglucoside (5)Apigenin-malonylglucoside (6)
B6018.69 ± 1.20 cd6.96 ± 0.56 c1.75 ± 0.14 d3.51 ± 0.15 e2.15 ± 0.25 f0.15 ± 0.05 f
B4513.96 ± 1.78 ef6.96 ± 0.60 c1.49 ± 0.20 ef1.21 ± 0.48 i0.79 ± 0.07 jND
B3013.82 ± 2.10 ef5.19 ± 0.16 efg1.47 ± 0.07 ef4.01 ± 0.58 d2.63 ± 0.18 d0.15 ± 0.00 f
B1512.96 ± 0.24 fg3.55 ± 0.85 i1.16 ± 0.09 g4.62 ± 0.16 c2.44 ±0.32 de0.14 ± 0.01 f
B0018.32 ± 1.97 cd4.83 ± 0.55 fg1.31 ± 0.16 efg1.35 ± 0.80 ijk0.69 ± 0.06 jkND
S6020.08 ± 1.43 b6.16 ± 0.68 cde1.50 ± 0.16 ef2.96 ± 0.63 f1.37 ± 0.15 g0.44 ± 0.17 c
S4525.21 ± 1.75 a6.96 ± 0.38 c2.35 ± 0.38 b3.53 ± 0.30 e1.69 ± 0.16 g0.26 ± 0.10 de
S3016.30 ± 1.19 de5.39 ± 0.95 def1.24 ± 0.08 fg2.02 ± 0.42 hi1.20 ± 0.10 ghND
S1519.74 ± 1.36 bc6.61 ± 0.35 cd1.66 ± 0.28 def2.99 ± 0.00 f1.42 ± 0.02 fgND
S0017.67 ± 0.86 cde6.46 ± 0.62 cd1.65 ± 0.27 d4.42 ± 0.83 c2.29 ± 0.03 efND
T6012.95 ± 0.74 fg5.20 ± 0.46 defg7.35 ± 0.20 a5.15 ± 0.11 b5.25 ± 0.43 a1.45 ± 0.12 a
T4521.50 ± 0.99 b7.52 ± 1.41 bc2.34 ± 0.32 b5.39 ± 0.37 a3.44 ± 0.09 b0.47 ± 0.05 c
T3024.35 ± 2.88 a9.98 ± 0.52 a2.46 ± 0.25 b3.96 ± 0.46 d2.34 ± 0.42 e0.43 ± 0.07 c
T1521.22 ± 2.94 b6.95 ± 0.71 c1.98 ± 0.12 c5.22 ± 0.47 ab3.09 ± 0.25 c0.36 ± 0.06 d
T0018.38 ± 1.51 cd6.18 ± 0.55 cde1.66 ± 0.15 def3.76 ± 0.02 de2.35 ± 0.18 e0.12 ± 0.01 f
N6012.30 ± 0.03 fg4.87 ± 0.51 fg1.28 ± 0.27 fg0.82 ± 0.09 j0.40 ± 0.00 k0.01 ± 0.00 e
N4515.57 ± 1.34 def5.87 ± 0.60 de1.27 ± 0.05 fg0.63 ± 0.00 j0.79 ± 0.07 jk0.01 ± 0.00 c
N3010.72 ± 1.18 g4.43 ± 0.54 gh0.42 ± 0.06 h0.07 ± 0.00 k0.00 ± 0.00 l0.01 ± 0.00 c
N15NANANANANANA
N00NANANANANANA
C6023.34 ± 1.66 ab8.10 ± 0.79 b2.15 ± 0.29 bc2.14 ± 0.40 gh1.58 ± 0.19 fg0.64 ± 0.02 b
C4515.30 ± 1.05 def5.61 ± 0.56 de1.62 ± 0.09 def4.56 ± 0.34 c3.06 ± 0.14 c0.20 ± 0.05 e
C3015.04 ± 0.78 def6.29 ± 1.18 cde1.41 ± 0.22 ef3.83 ± 0.37 de2.17 ± 0.25 f0.22 ± 0.03 e
C1513.29 ± 0.79 efg4.08 ± 0.22 h1.09 ± 0.08 g2.39 ± 0.59 fg1.02 ± 0.15 iND
C0017.96 ± 0.24 cde5.38 ± 0.53 def1.38 ± 0.17 efg1.68 ± 0.18 i1.18 ± 0.12 hiND
1 Means within a column followed by the same lower case letter are not significantly different at p ˂ 0.001 (ANOVA, Duncan test); B: bagasse–chicken compost, S: sawdust–chicken compost, T: tree–chicken compost, N: napier–chicken compost, C: cotton–chicken compost; the number following the compost letter corresponds to the proportion of biochar in the organic substrates; NA: not applicable because seeds did not germinate; ND: not detected.
Publisher’s Note: MDPI stays neutral with regard to jurisdictional claims in published maps and institutional affiliations.

