Article

Enhancement of Interplanting of Ficus carica L. with Taxus cuspidata Sieb. et Zucc. on Growth of Two Plants

1
Key Laboratory of Forest Plant Ecology, Ministry of Education, Northeast Forestry University, Harbin 150040, China
2
College of Chemistry, Chemical Engineering and Resource Utilization, Northeast Forestry University, Harbin 150040, China
3
Engineering Research Center of Forest Bio-Preparation, Ministry of Education, Northeast Forestry University, Harbin 150040, China
4
Collaborative Innovation Center for Development and Utilization of Forest Resources, Harbin 150040, China
5
Heilongjiang Provincial Key Laboratory of Ecological Utilization of Forestry-Based Active Substances, Northeast Forestry University, Harbin 150040, China
*
Author to whom correspondence should be addressed.
Submission received: 24 November 2021 / Revised: 14 December 2021 / Accepted: 14 December 2021 / Published: 15 December 2021

Abstract

:
Medicinal-agroforestry systems are one of the multi-functional medicinal plant production systems, gaining attention as a sustainable alternative to traditional monoculture systems. In this study, three planting patterns were established which included: (1) monoculture F. carica (MF); (2) monoculture T. cuspidata (MT); and (3) interplanting F. carica with T. cuspidata (IFT). The differences of growth biomass, photosynthesis, soil nutrients, soil enzyme activities, soil microorganisms, and main secondary metabolites of F. carica and T. cuspidata under the above three models were investigated. Compared with the MF and MT patterns, IFT pattern for 5 months significantly increased the plant growth biomass, photosynthesis, soil organic carbon, total nitrogen, and secondary metabolites content. The activities of acid phosphatase, sucrase, protease, polyphenol oxidase, urease, dehydrogenase, and catalase in soil of IFT were significantly higher than MF and MT patterns. Results showed that IFT pattern is preferred compared to the MF and MT patterns. Our result will help to provide a feasible theoretical basis for the large-scale establishment of F. carica and T. cuspidata mixed forests and obtain high-quality medicine sources for extracting important active ingredients, psoralen and paclitaxel, which are crucial to the long-term sustainable development and production of medicinal plants.

Graphical Abstract

1. Introduction

Ficus carica L. is a species of Ficus plant in the Moraceae family. It is a perennial deciduous shrub with rapid growth and broad leaves [1,2]. F. carica is a robust and highly productive traditional medicinal plant that can adapt well to weather changes. The most important secondary metabolite in F. carica is psoralen [3]. Because of its strong physiological activity, F. carica is considered to have anti-bacterial, anti-viral, anti-tumor, and blood sugar lowering effects [4,5]. F. carica is cultivated widely in China, primarily distributed in Xinjiang, Fujian, Shandong, and other places.
Taxus cuspidata Sieb. et Zucc. is a species of Taxus in the Taxaceae family, which is a national first-level key protected wild plant that grows slowly and prefers a moist and cool environment [6,7]. T. cuspidata is in an endangered state due to its reproductive characteristics, habitat conditions, man-made destruction, and other factors, as well as the need for moderate shade treatment in the early growth period (1 to 3 years). Paclitaxel is contained in the roots, stems, and leaves of T. cuspidata, which has a broad-spectrum anti-cancer effect and is considered to be the most promising new anti-cancer drug, so its demand is increasing with each passing year [8]. T. cuspidata resources in China account for most of the worldwide T. cuspidata resources, but from the perspective of the worldwide demand for raw materials for paclitaxel extraction, its resource reserves are still far from sufficient. Therefore, it is urgent to adopt appropriate methods for large-scale cultivation of T. cuspidata plantation.
A medicinal-agroforestry system is a traditional way of land use which combines different plants according to the different suitable environments and the characteristics of spatial location, such as deep and shallow roots, growth rate, etc., thus forming a stable and efficient artificial compound ecosystem that promotes itself [9]. In addition, the medicinal-agroforestry system is a multi-functional medicinal plant production system and is gaining attention as a sustainable alternative to traditional monoculture systems. Compared to monoculture patterns, the medicinal-agroforestry system is considered to be a more beneficial land use practice, contributing to improved soil quality and soil biodiversity [10,11]. Medicinal-agroforestry systems, which promote ecological diversity and sustainability while also providing social, economic, and environmental benefits, deserve to be vigorously pursued.
There are no reports on interplanting F. carica with T. cuspidata. In this study, according to the characteristics of slow growth, deep root system, and shade-loving growth characteristics of T. cuspidata, the heliophilous plant F. carica with medium shallow root system and fast growth was selected for interplanting. In the cultivation practice of T. cuspidata, due to the slow growth rate of T. cuspidata seedlings and intolerance to strong light, it is often necessary to build shade sheds to block part of the sunlight. The F. carica seedlings grow rapidly and can be quickly uplifted in the year of the transplanting and grow larger leaves [1]. F. carica are interplanted with the T. cuspidata, so that the crowns of the F. carica and T. cuspidata are located on the upper and lower layers, respectively. F. carica not only decreases the damage on T. cuspidata caused by strong light but also reduces the cost of building shade sheds.
This study investigated the effects of different planting patterns on the growth of two plants. Indicators for proving the effects on plant growth include the growth biomass, photosynthesis, soil nutrients, soil microbial communities, and secondary metabolites. It is expected to provide a feasible theoretical basis for formulating a high-efficiency interplanting patterns of F. carica with T. cuspidata and realizing sustainable land use.

2. Materials and Methods

2.1. Location of the Experiment and Plant Materials

This study was performed from April to September 2020 at the Xiazhuang experimental field located in Rongcheng City, Shandong Province, China (37°23’ N; 122°52’ E) (Figure 1). The study area has a warm temperate monsoon humid climate with the annual average temperature of 12.4 °C, the annual average precipitation of 800 mm, and the annual average humidity of 89%. It has an annual average sunshine of 2600 h, the annual evaporation of 1930.7 mm, and the frost-free period was 208 days. Compared with the inland areas at the same latitude, it is characterized by abundant rainfall, moderate annual temperature, and mild climate. The soil was classified as typical brown soil and has a paddy soil type with topsoil (0–20 cm) that the soil nutrient content was as follows: pH 5.5; contained organic matter 55.2 mg·kg−1; total nitrogen 4.6 g·kg−1; alkali nitrogen 61.8 mg·kg−1; available phosphorus 38.2 mg·kg−1; and available potassium 319.7 mg·kg−1.
A F. carica annual cutting seedling was selected and seedling height was 40–50 cm. The selected T. cuspidata were four-year-old seedlings and the seedling height was 25–35 cm. They were all grown at the Xiazhuang experimental field located in Rongcheng City, Shandong Province, China (37°23’ N; 122°52’ E).

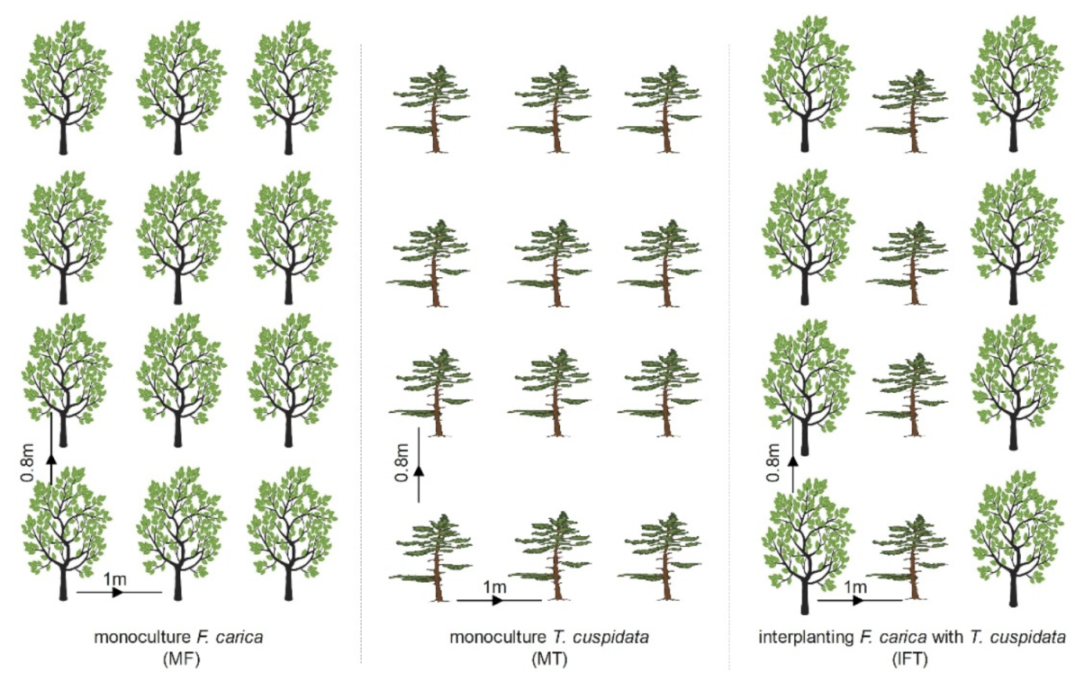
2.2. Experimental Design and Treatments

In this study, three planting patterns were established, which included: (1) monoculture F. carica (MF); (2) monoculture T. cuspidata (MT); and (3) interplanting F. carica with T. cuspidata (IFT) (Figure 2). All systems adopt the same agronomic management practices. The experiment was arranged in plots in a randomized design. Four plots were randomly set up for each pattern in this experiment. The area of each plot was 20 × 50 m2, and the distance between adjacent plots was at least 10 m. In MF, F. carica was planted with a row and plant spacing of 0.8 m × 1.0 m. In MT, T. cuspidata was planted with a row and plant spacing of 0.8 m × 1.0 m. In IFT, a T. cuspidata was planted between every two adjacent F. carica, and the spacing between the adjacent T. cuspidata and F. carica was 0.8 m; the row spacing was 1.0 m.
F. carica and T. cuspidata were transplanted after a period of slow seedling and the plants began to grow normally. The following experimental indicators were measured on the 15th day of each month from May to September 2020.

2.3. Determination of Plant Biomass

F. carica growth measurement: We used a tape measure to measure the length of all the branches of the current year. We used a traveling caliper to measure the diameter of the base, base to end, and at the end position of the current year branches. The branch is approximately regarded as composed of several circular truncated cones whose height does not exceed 5 cm. By calculating the volume of each circular truncated cone, the current year branch volume of F. carica can be calculated. The total volume (cm3) of F. carica branch in the current year was used as an index to evaluate the growth of F. carica.
T. cuspidata growth measurement: The plant height and base diameter were measured by measuring tape and vernier caliper, respectively, and these indicators were used as the evaluation indexes of T. cuspidata growth.

2.4. Determination of Plant Photosynthesis

When the temperature and humidity were suitable on a sunny day, the apical mature leaves of F. carica and T. cuspidata with good growth and consistent leaf orientation were selected to ensure that the tested leaves received good light. The photosynthetic parameters such as the net photosynthetic rate (Pn, μmol·m−2·s−1), stomatal conductance (Gs, mmol·m−2·s−1), and intercellular carbon dioxide concentration (Ci, μmol·mol−1) were measured using a Yaxin-1102 portable photosynthesis apparatus at the same time every month.

2.5. Soil Sampling and Soil Chemical Analysis

2.5.1. Soil Sampling

Soil samples from the depth of 0–20 cm were randomly collected from the three patterns (MF, MT, and IFT). Each pattern consisted of four sub-samples, repeated four times. After collection, the soil samples were sealed in labeled vacuum plastic bags and sent to the laboratory as early as possible. Each soil sample was divided into two parts: one was air drying, grinding, and 0.20 mm sieving to determine soil organic carbon (SOC), total nitrogen (TN), and enzyme activity analysis, and the other was stored in a refrigerator at 4 °C for microbial determination.

2.5.2. Determination of Soil Organic Carbon and Total Nitrogen

In short, SOC was measured using the hydrated potassium thermo-dichromate oxidation method [12], while the Kjeldahl digestion method was used to determine TN [13].

2.5.3. Determination of Soil Microbial Community

The abundance of soil microbial community was calculated by conventional plate colony counting. Bacteria were cultured on beef extract-peptone medium (beef extract, 3.0 g; peptone,10.0 g; NaCl, 5.0 g; agar, 15–25 g; metalaxyl and propamocarb 1.25 g; water, 1000 mL; pH 7.4–7.6 for 1 L) [14], while fungi were cultured on Martin medium (KH2PO4·3H2O, 0.1 g; MgSO4·7H2O, 0.05 g; 0.1% Bengal red solution, 0.33 mL; distilled water, 100 mL; natural pH 2%; sodium deoxycholate solution, 2 mL; streptomycin solution (10,000 units·mL−1) 0.33 mL for 1 L) [15]. For the cultivation of bacteria and fungi, we took 50 μL 10−6 and 10−4 soil suspension, respectively, and added them to the corresponding medium. Each treatment was repeated 4 times. After solidification, they were placed in a 28 °C constant temperature incubator. Bacteria and fungi were cultured for 3–4 days and 3–5 days, respectively.

2.5.4. Dynamic Changes of Soil Enzyme Activities

Seven kinds of soil enzyme activities (acid phosphatase, sucrase, protease, polyphenol oxidase, urease, dehydrogenase, and catalase) were detected. Acid phosphatase activity was determined by the disodium phosphate benzene colorimetric method [16], and the 3,5-dinitrosalicylic acid method was applied to assay the sucrase activity [17]. Protease activity was assayed according to ninhydrin colorimetric method [18]. The activity of polyphenol oxidase in the soil was determined by spectrophotometry [19]. Urease activity, dehydrogenase activity, and catalase were measured by colorimetric analysis of sodium phenate-sodium hypochlorite [20], the triphenyl tetrazolium chloride reduction [21], and the potassium permanganate titration method [22], respectively.

2.6. Determination of Secondary Metabolites Content

2.6.1. Determination of Psoralen in F. carica

The fresh leaves were collected from the sample plot and dried at 60 °C for 24 h, then ground into powder. Dried powder samples were weighed (1 g) and dissolved in 25 mL of methanol. Each sample was extracted for 40 min by an ultrasonic cleaner. After filtration, the filtrate residue was ultrasonic with 25 mL methanol for 40 min, repeated twice. The filtrate was combined and evaporated to dryness, redissolved with methanol to 10 mL, and centrifuged to obtain the supernatant at 1200 rpm for 20 min, which was injected into a high-performance liquid chromatography (HPLC) system. Chromatographic conditions: The mobile phase was A: methanol and B: ACN-water (15:85, v/v), injection volume was 20 μL, the flow rate was 1.0 mL min−1, detection wavelength was 310 nm, and an analysis cycle was 30 min [23].

2.6.2. Determination of Paclitaxel in T. cuspidata

The preparation method of the T. cuspidata extract is the same as 2.6.1. Chromatographic conditions: The mobile phase was methanol/acetonitrile/water (25:35:40, v/v/v) run over a period of 30 min at flow rate was 1.0 mL min−1. Injection volume was 20 μL, detection wavelength was 232 nm [24].

2.7. Statistical Analysis

All experiments were conducted as completely randomized design in four replications. All of the data were analyzed using SPSS 22.0; one-way ANOVA and Duncan’s multiple range test (p < 0.01) were used to further deal with the experimental data differences between treatments. Figures were created with Origin Pro 9.0.

3. Results

3.1. Variation of Plant Biomass in Different Planting Patterns

3.1.1. Variation of F. carica Growth in Different Planting Patterns

Variation of total volume of F. carica new branch under different planting patterns are shown in Table 1. The new branch total volume of IFT for 1–5 months was significantly (p < 0.01) higher than MF. The biomass of IFT for 5 months in the same year was 96.8 cm3, which was 23.5% higher than that of MF. In terms of the total volume of F. carica new branch, the IFT pattern was better than MF.

3.1.2. Variation of T. cuspidata Growth in Different Planting Patterns

Variation of T. cuspidata plant height under different planting patterns is shown in Table 2. Regardless of the planting pattern, the plant height of T. cuspidata increased significantly monthly (p < 0.01), and there was no significant difference in the growth rate of plant height between MT and IFT planted for 1 month (p > 0.01). The growth rate of plant height of IFT planted for 2–5 months was significantly (p < 0.01) higher than MT. The growth rate of plant height of IFT for 5 months was 121.7%, which was 1.2 times the growth rate of MT.
Variation of T. cuspidata basal diameter under different planting patterns is shown in Table 3. The growth rate of basal diameter of IFT planted for 2–5 months was significantly (p < 0.01) higher than that of MT. The growth rate of basal diameter of IFT for 5 months was 45.3%, which was 2.1 times the growth rate of MT. Considering the growth of plant height and basal diameter of T. cuspidata, IFT pattern is better than MT.

3.2. Variation of Plant Photosynthesis in Different Planting Patterns

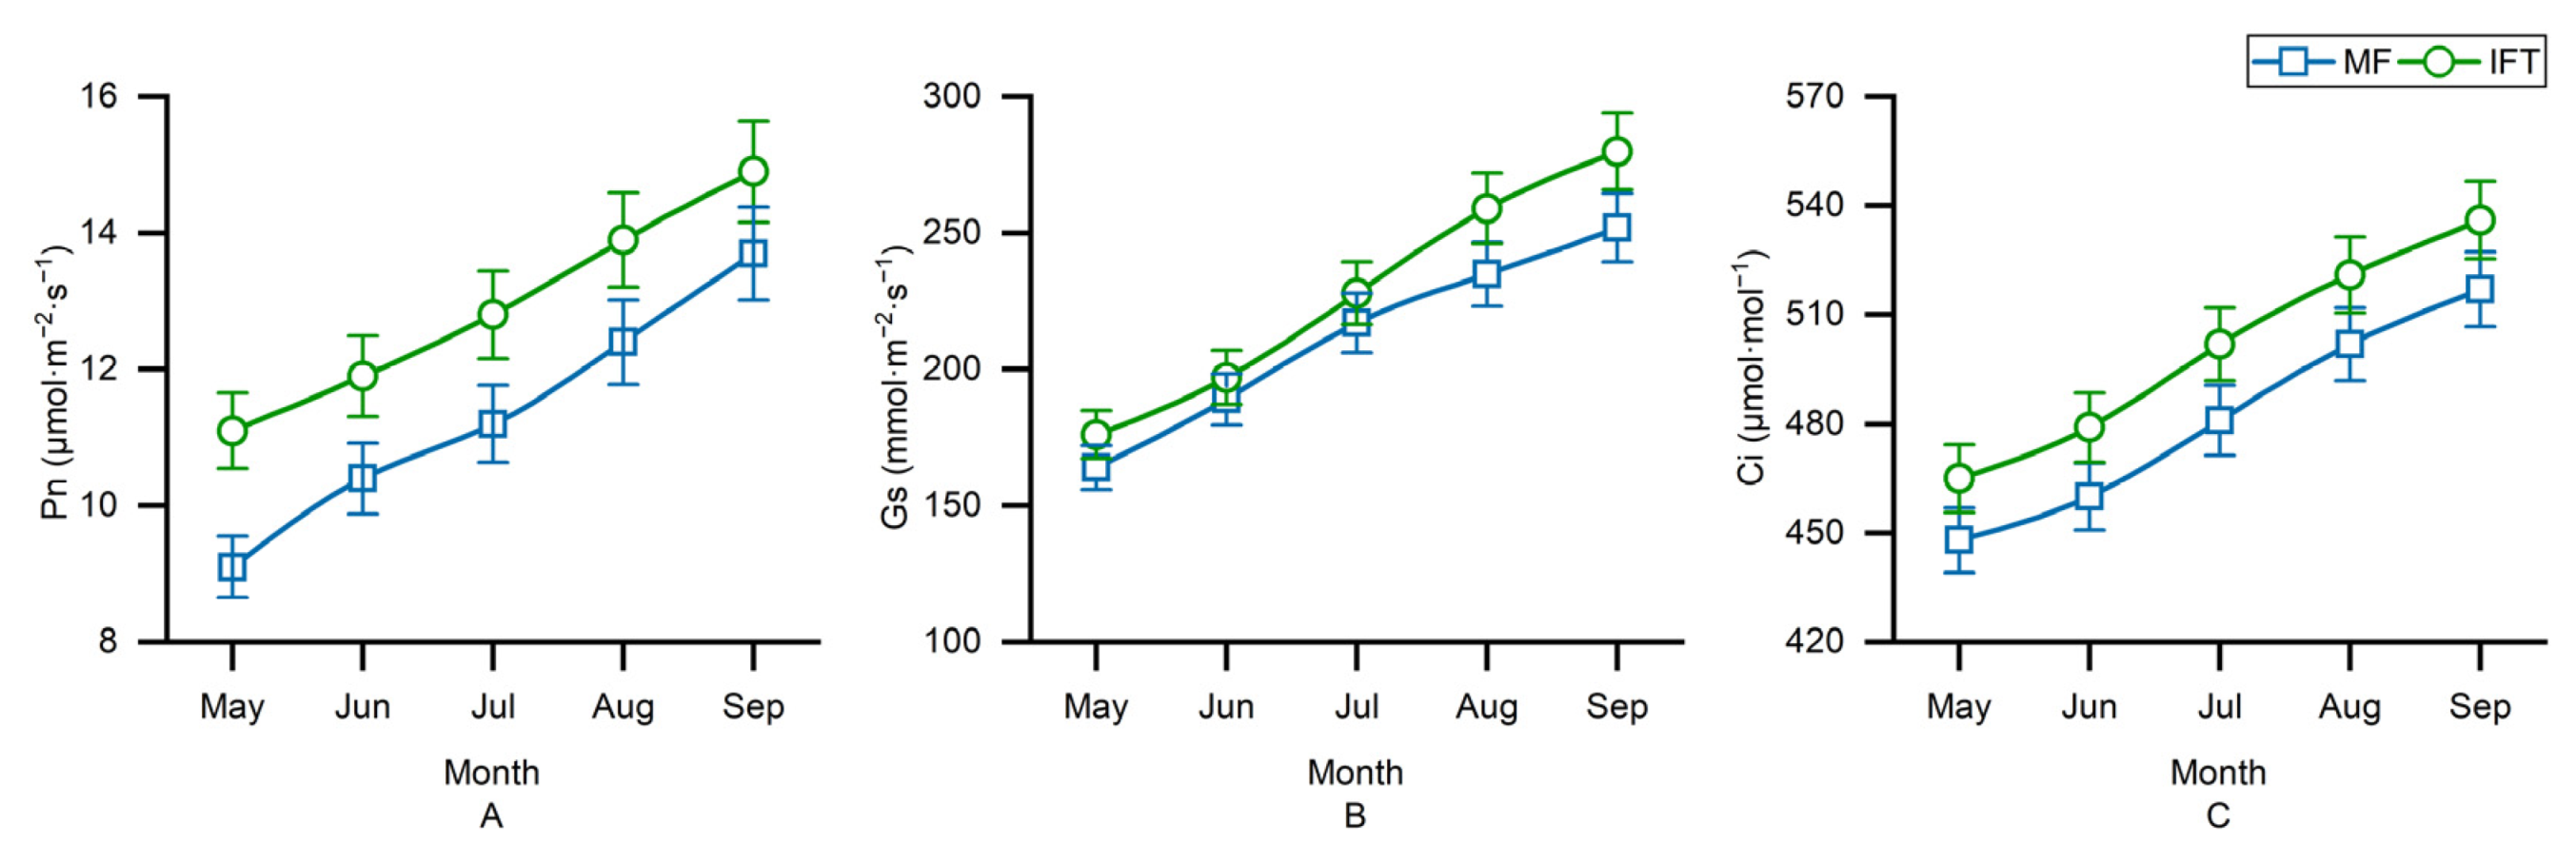
3.2.1. Variation of F. carica Photosynthesis in Different Planting Patterns

Variation of F. carica Pn, Gs, and Ci in different planting patterns was investigated and results were shown in Figure 3. The Pn in the IFT pattern was better than MF, which increased significantly (p < 0.01) by 22.0%, 14.4%, 14.3%, 12.1%, and 8.8% from May to September. Compared with MF, the Gs of IFT was significantly increased (p < 0.01) by 10.2% and 11.1% from August to September, but there was no significant difference from May to July. The Ci of IFT pattern was 3.8%, 4.1%, 4.4%, 3.8%, and 3.7% (significantly, p < 0.01) higher than those of the MF from May to September, respectively. These results indicated that the IFT pattern had the advantage of enhancing the photosynthesis of F. carica.

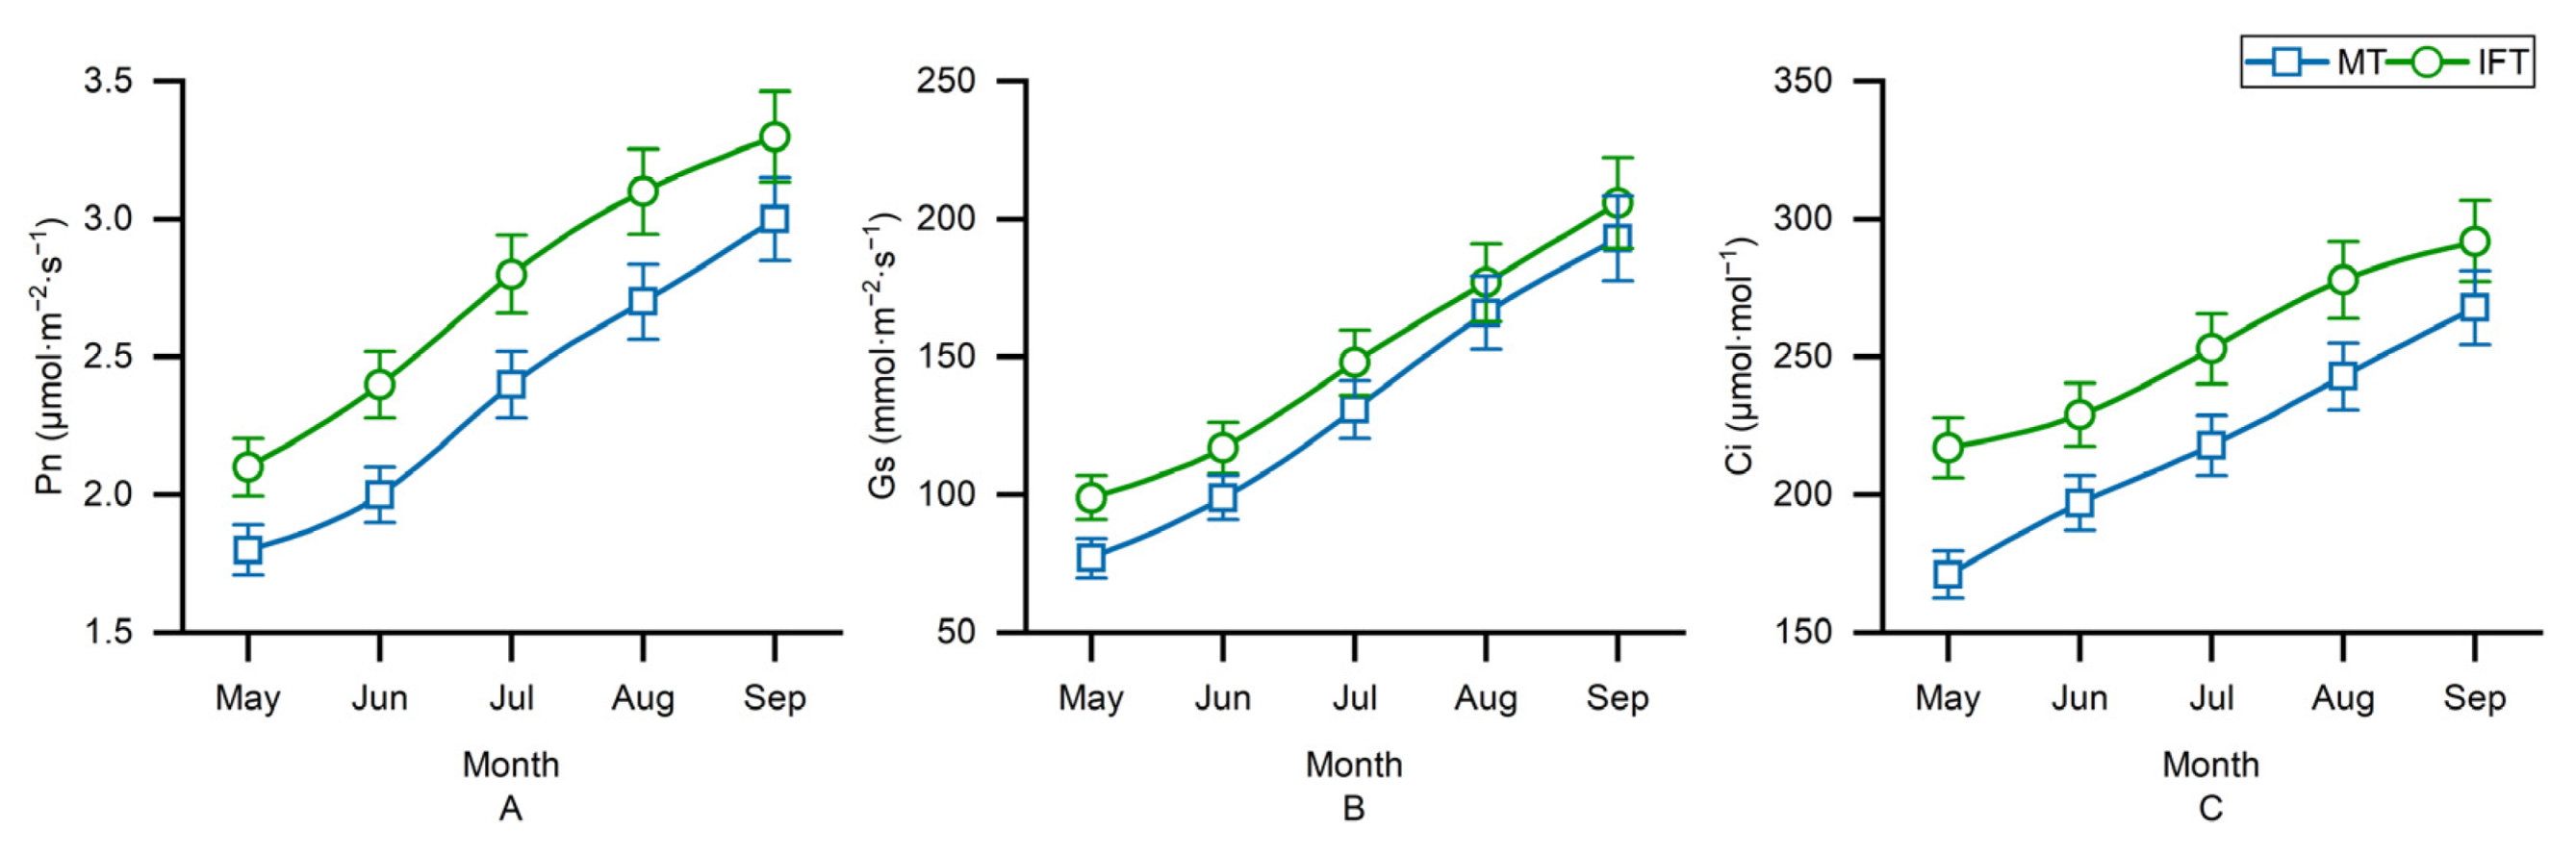
3.2.2. Variation of T. cuspidata Photosynthesis in Different Planting Patterns

Figure 4 shows that the variation of Pn, Gs, and Ci of T. cuspidata under different planting patterns. Regardless of the planting pattern, the Pn, Gs, and Ci of T. cuspidata increased significantly monthly and reached the highest point in September. Compared with MT, the Pn, Gs, and Ci of IFT were significantly (p < 0.01) increased by 10.0%, 6.7%, and 9.0% in September, respectively. In terms of photosynthesis, the IFT pattern was better than MT.

3.3. Variation of Soil Chemical Analysis in Different Planting Patterns

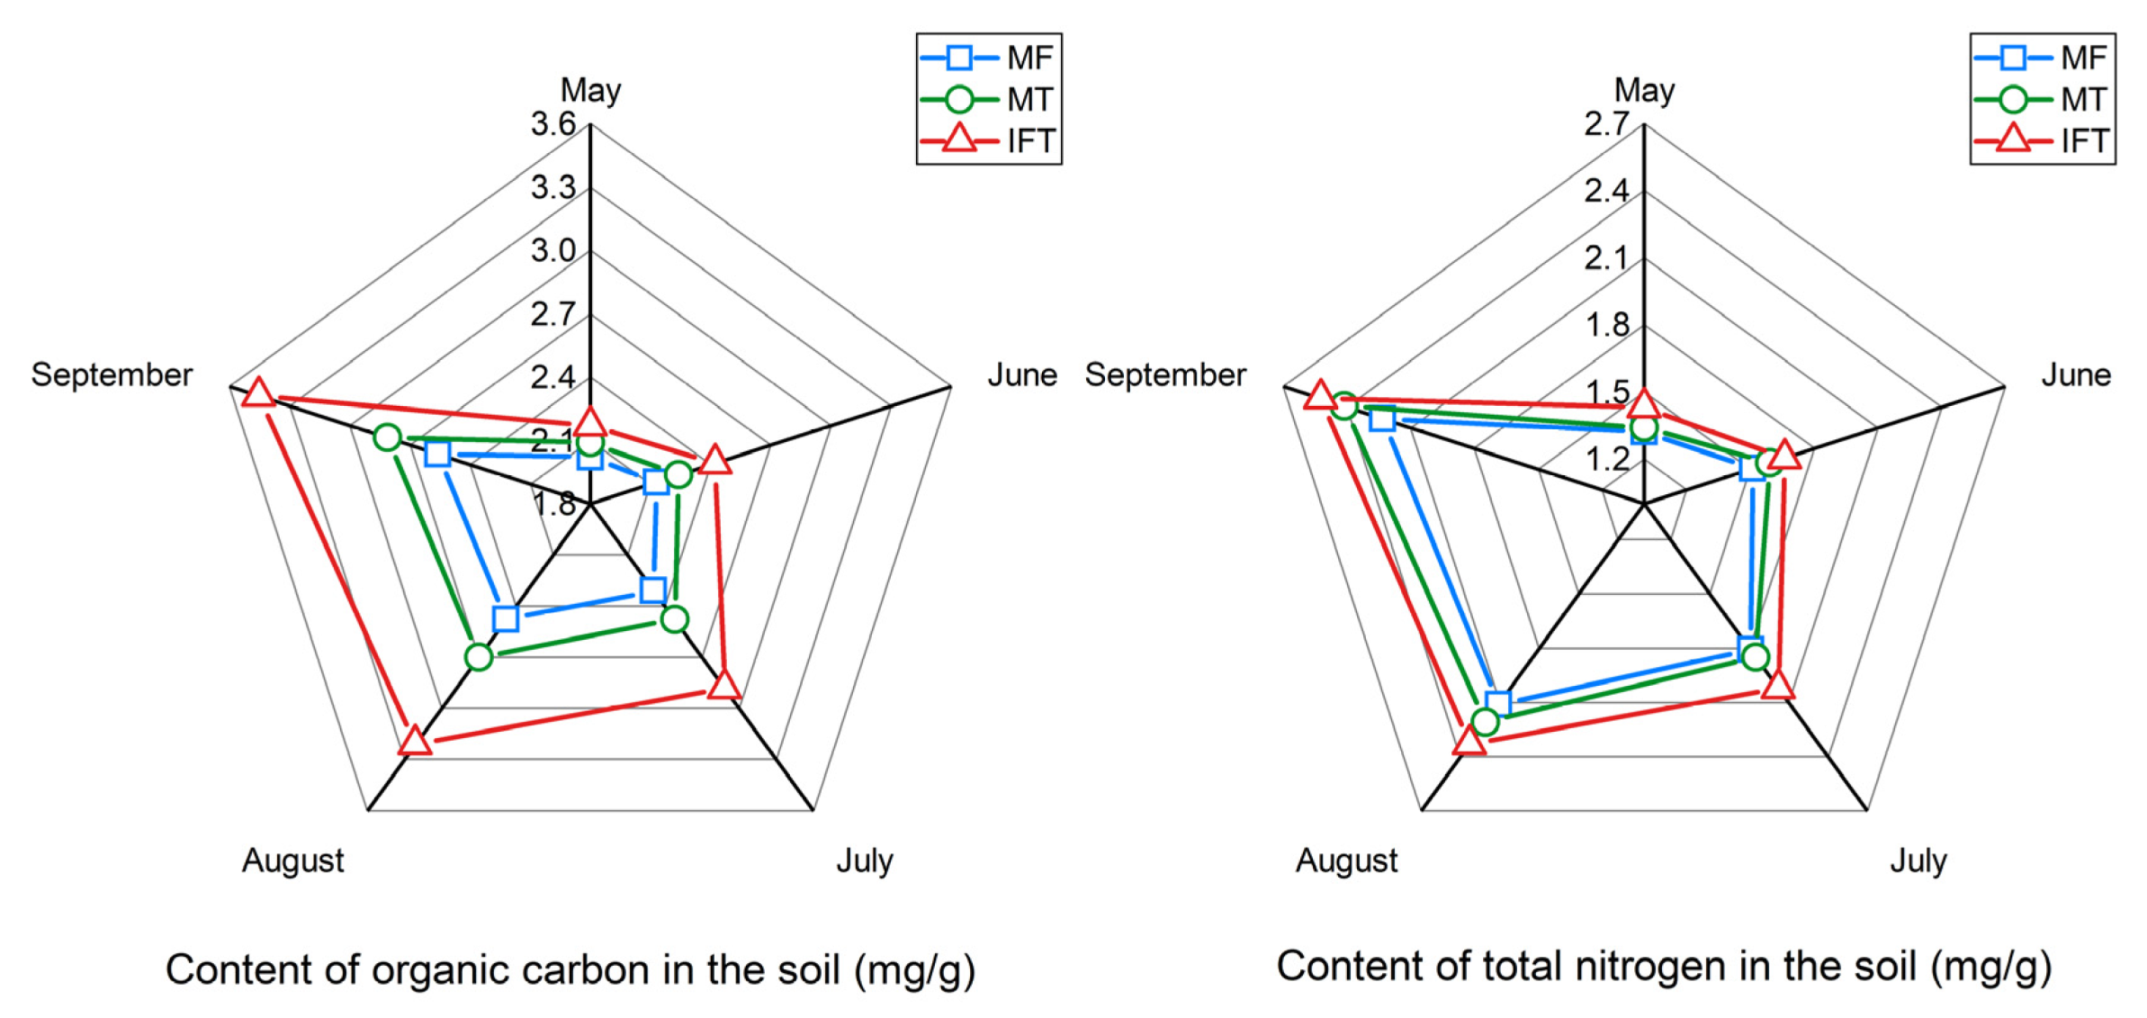
3.3.1. Variation of Soil Organic Carbon and Total Nitrogen in Different Planting Patterns

Both monoculture and interplanting patterns had significant effects on the contents of SOC and TN (Figure 5). The SOC content ranged from 2.02 mg g−1 to 3.45 mg g−1 among all planting patterns and SOC content increased as time increase, where it was observed as the highest in September. For SOC content, IFT had the highest content among all planting patterns. Overall, the SOC contents among all planting patterns were in the order of IFT > MT > MF (Figure 5A).
Similar results compared with SOC, the TN showed the same trend between the monoculture and interplanting patterns. The TN content ranged from 1.13 mg g−1 to 2.52 mg g−1 among all planting patterns. For TN content, IFT had the highest content among all planting patterns. Overall, the TN contents among all planting patterns were in the order of IFT > MT > MF (Figure 5B). In terms of SOC and TN content, the IFT pattern was better than MF and MT.

3.3.2. Variation of Soil Microbial Community in Different Planting Patterns

Variability in bacteria, fungus, and bacteria/fungus in soil under different planting patterns is shown in Figure 6. Regardless of the planting pattern, the number of bacteria increased significantly monthly and reached the highest point in September. Overall, the number of bacteria were in the order of MT > MF > IFT (Figure 6A). The amount of fungus in the IFT pattern was 13.8% significantly higher than MF in September. Compared with MT, the amount of fungus in IFT was significantly increased (p < 0.01) by 22.2% in September. Overall, the amount of fungus was in the order of IFT > MF > MT (Figure 6B). The ratio of bacteria/fungus reached the lowest value under IFT pattern in August, which was 0.89. Overall, the ratio of bacteria/fungus was in the order of IFT > MT > MF (Figure 6C).

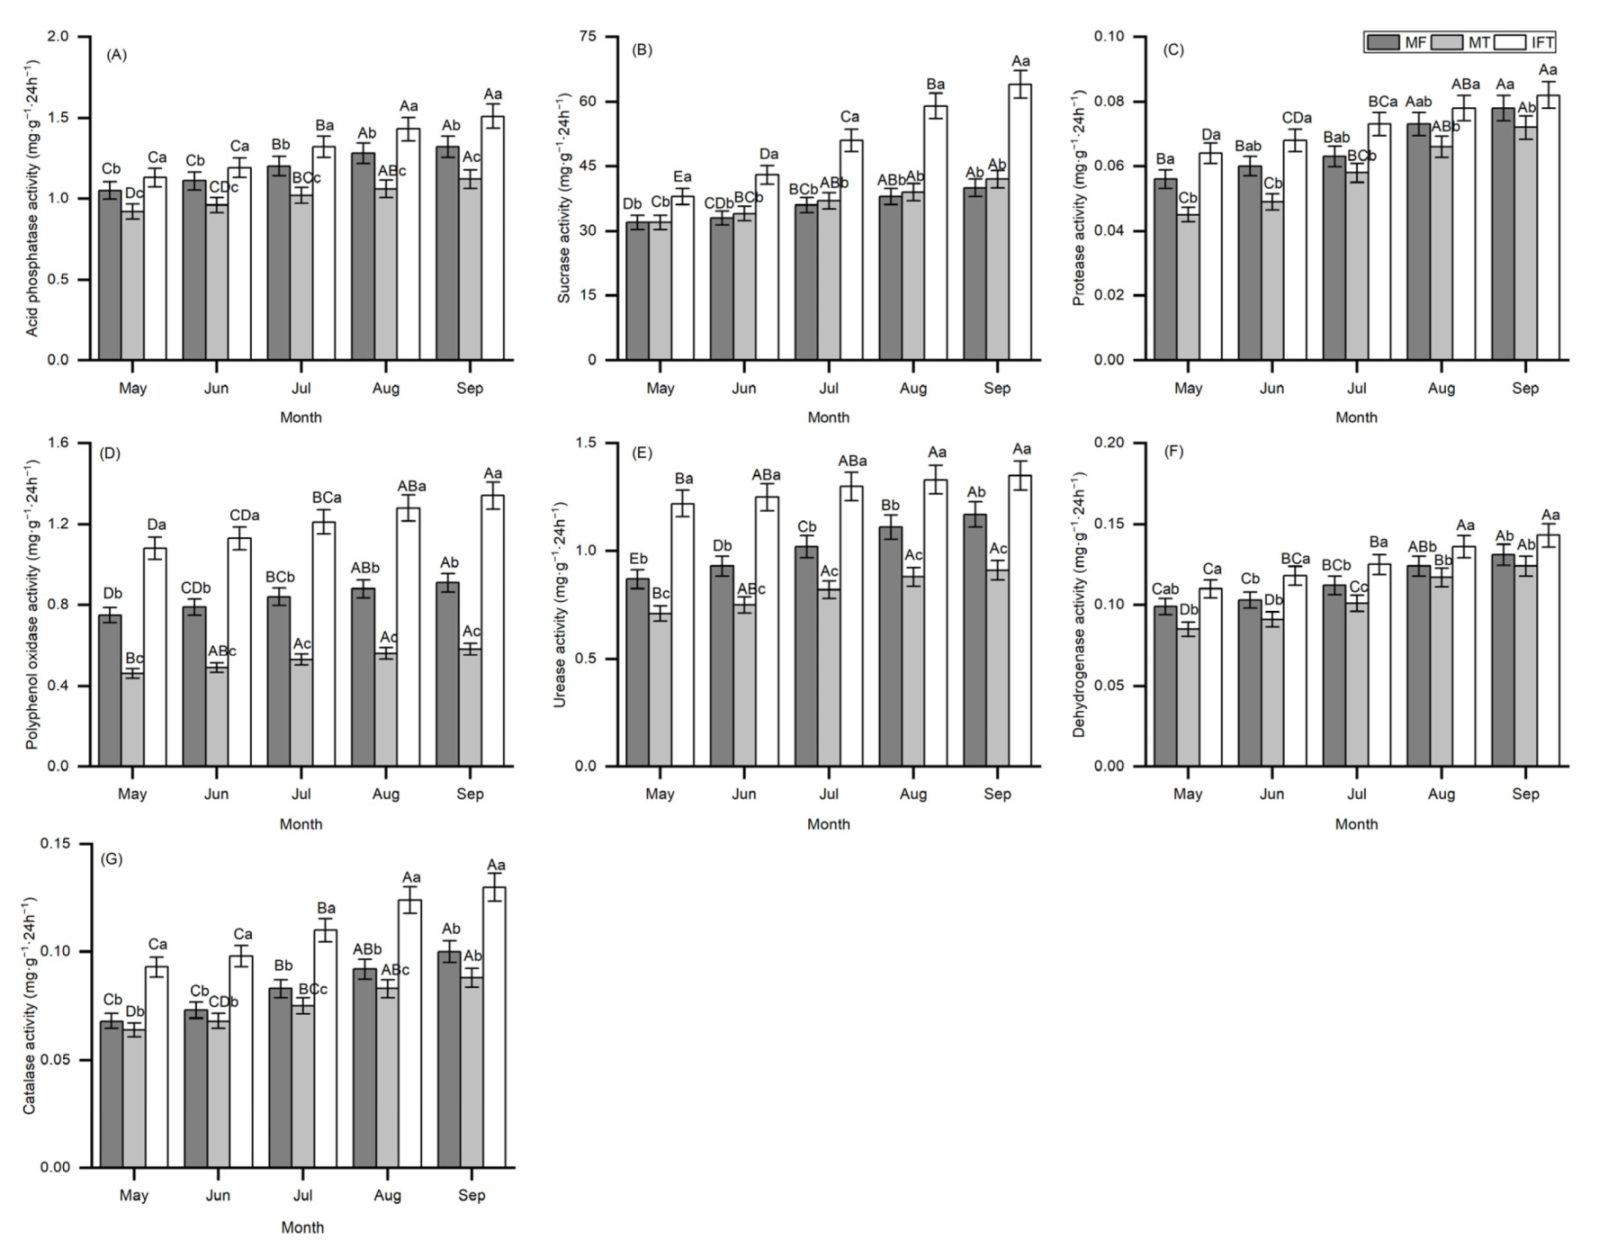
3.3.3. Variation of Soil Enzyme Activities in Different Planting Patterns

Figure 7 shows the variability in soil enzyme activities of acid phosphatase, sucrase, protease, polyphenol oxidase, urease, dehydrogenase, and catalase with time under three planting patterns. Regardless of the planting pattern, seven soil enzyme activities increased significantly monthly and were observed to be the highest in September. The seven enzyme activities of IFT pattern were 14.4%, 60.0%, 5.1%, 47.3%, 15.4%, 9.2%, and 30.0% higher than that of MF in September, respectively. Compared with MT, the soil corresponding enzyme activities of IFT were significantly increased (p < 0.01) by 34.8%, 52.4%, 13.8%, 131.0%, 48.4%, 15.3%, and 47.7% in September, respectively. In terms of soil enzyme activities, the IFT pattern was better than MF and MT.

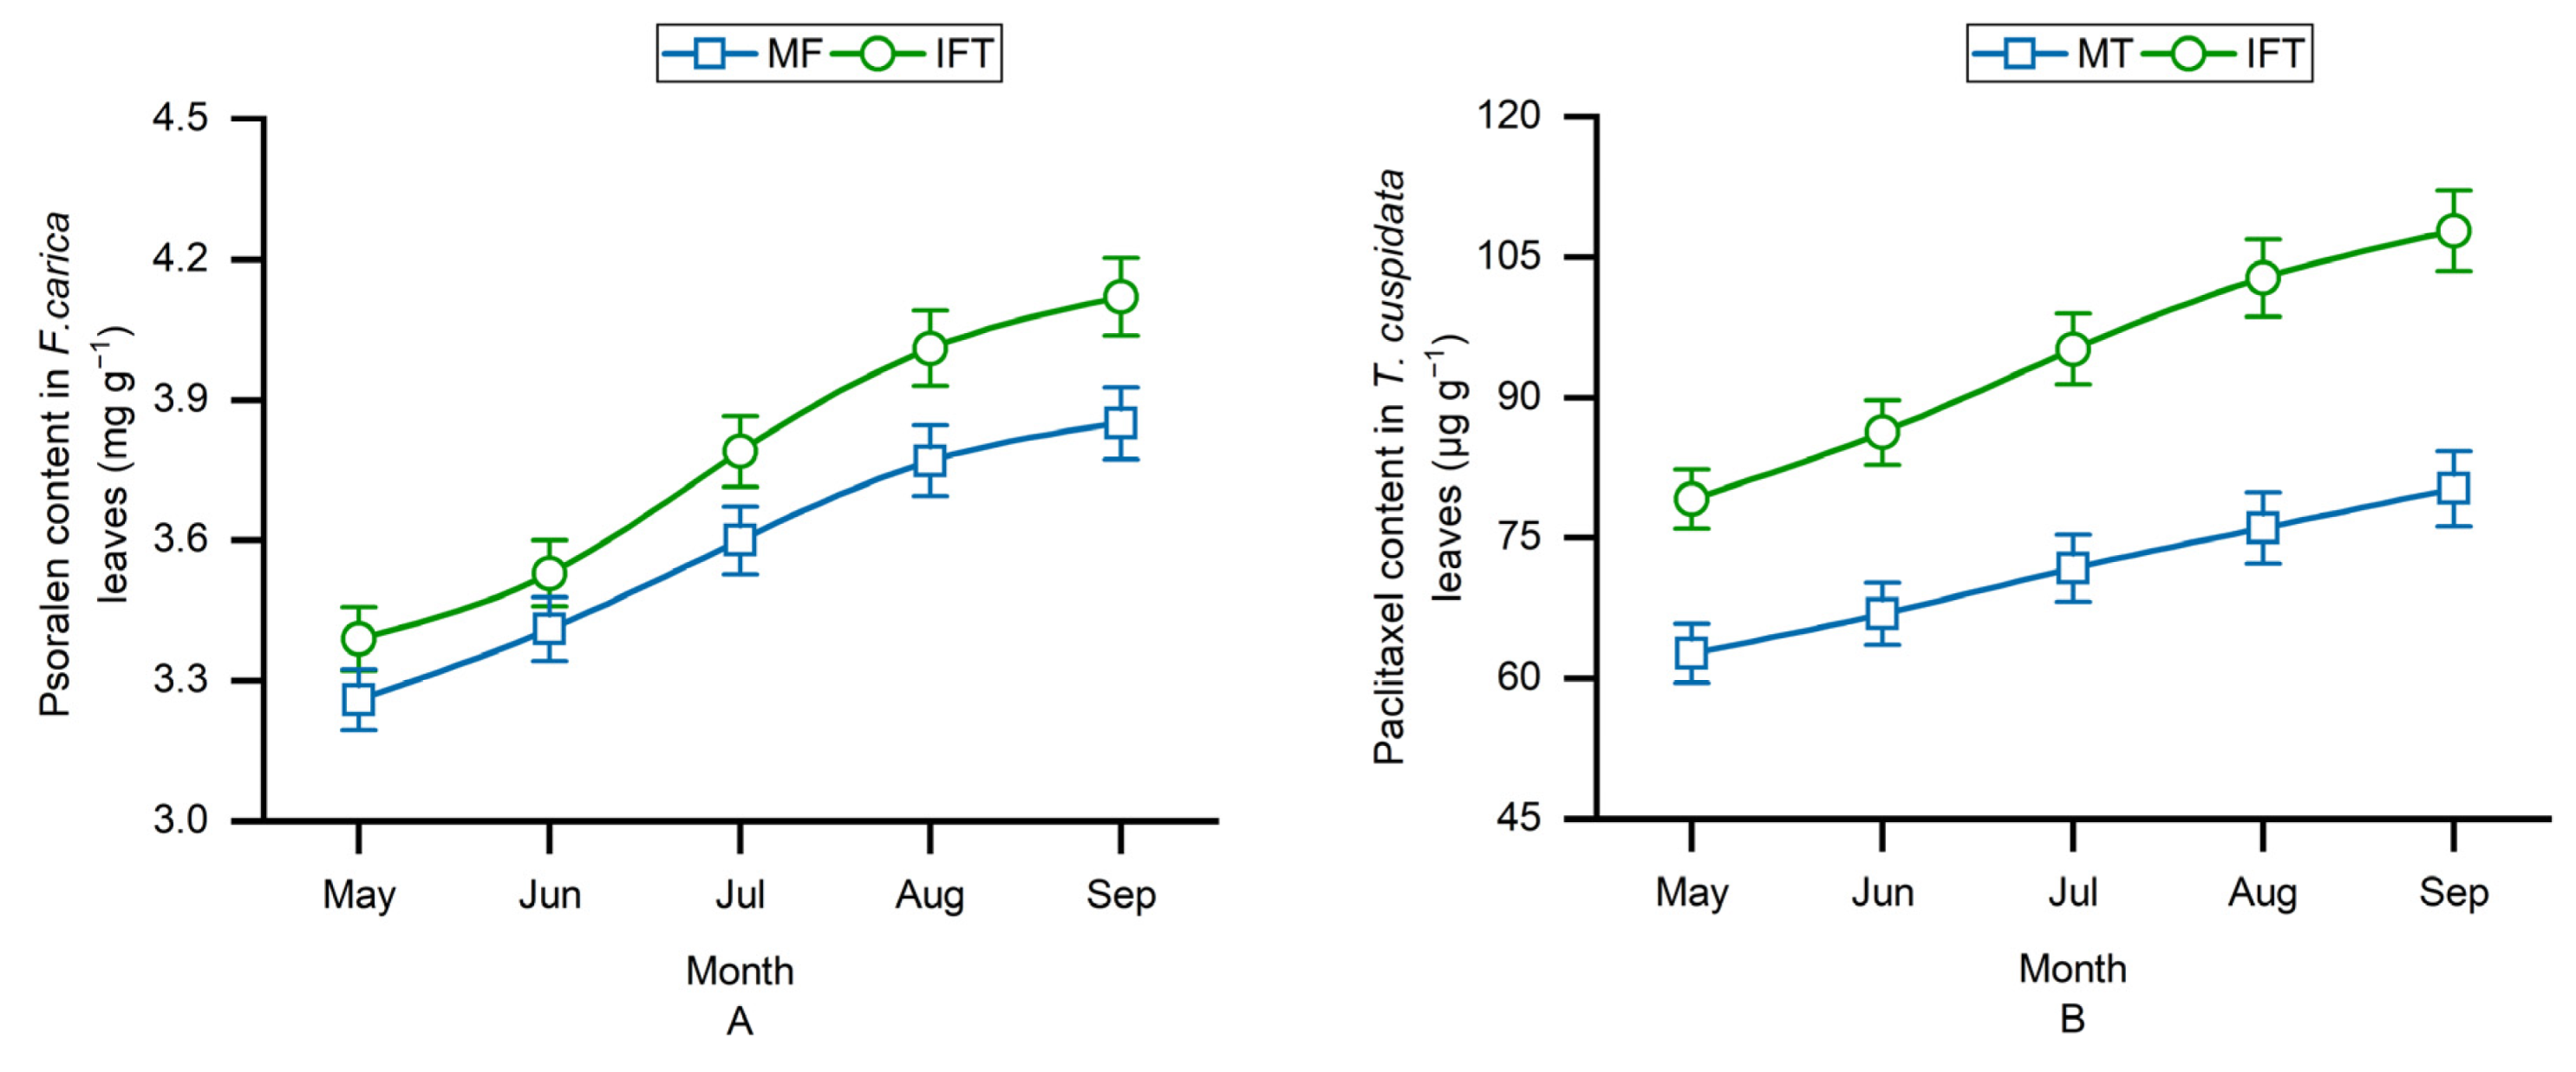
3.4. Variation of Secondary Metabolites Content in Different Planting Patterns

The psoralen content in F. carica and paclitaxel content in T. cuspidata under different planting patterns are shown in Figure 8. The psoralen content in F. carica planted for 1–5 months in IFT was significantly (p < 0.01) higher than that of MF. The psoralen content in F. carica of IFT pattern for 5 months was 4.12 mg g−1, which was 1.1 times of MF (Figure 8A).
The paclitaxel content in T. cuspidata planted for 1–5 months was significantly (p < 0.01) higher than that of MT. The paclitaxel content significantly increased as time increased, where it was observed as the highest in September. In addition, the paclitaxel content of IFT was 34.3% higher than that of MT in September (Figure 8B). These results indicated that IFT pattern had the advantage of improving the secondary metabolites content.

4. Discussion

Compared with the monoculture pattern, the growth biomass of F. carica and T. cuspidata under interplanting pattern were significantly improved. It was reported that interplanting can effectively improve the growth of some plants [25,26]. F. carica could weaken the damage of strong light to T. cuspidata under IFT pattern, which could partly explain the promoting effect of F. carica on T. cuspidata growth under the interplanting pattern. The photosynthetic index under IFT pattern was significantly higher than that of MF, which indicated that there was more dry matter accumulation in the interplanting pattern [27]. In theory, interplanting did not significantly change the light, temperature, water, air, or other ecological factors that might affect the growth of F. carica, so it was speculated that the change of soil factors caused by interplanting pattern was the important factor promoting the growth of F. carica and T. cuspidata.
In our study, we found that the most significant effect of IFT was the increase of SOC and TN contents. Great SOC accumulation in the presence of the interplanting pattern was ascribed to enhance SOC input from higher plant biomass production [28]. The higher SOC and TN contents in the interplanting pattern might be a sign of improved soil nutrient cycling and accumulation [29,30,31]. The presence of high diversity interplanting pattern promoted soil fertility and storage of SOC and TN contents compared to monoculture pattern. Another possible reason was that interplanting can provide more comprehensive ground coverage and better water use efficiency [32,33]. The combination of different plant species affects the composition of the soil nutrient; in particular, plant diversity has a significantly higher impact on soil nutrients than any other factor, which is likely due to the more developed roots of the IFT pattern and the surrounding soil and results in more favorable nutrients for root development [34,35,36]. Thus, it was speculated that the IFT pattern increases the soil nutrient conversion cycle and might help the suppression of plant disease.
Our research suggests that the amount of bacteria in soil tends to be lower than that of the monoculture pattern following the IFT while the amount of fungus tends to be higher. Moreover, the total number of microorganisms showed an increasing trend. Combined with the growth indicators of the two kinds of plants, a decrease in bacteria and an increase in fungi allowed the plants to grow more luxuriantly. The number of microorganisms in soil plays an important role in plant growth [37]. Interplanting can significantly increase the number of soil microorganisms, thus promoting the release of soil nutrients, so that plants absorb nutrients more conducive to growth [38,39,40]. The IFT pattern enhanced the relative number of potentially beneficial microorganisms in the soil, which is crucial to decreasing the prevalence of soil-borne diseases and keeping soil healthy. To some level, it may be attributed to complex interactions between plants, such as allelopathy. Plant roots can release chemicals into the soil affecting the soil microbial community and can thus affect soil properties in many ways [41].
Soil enzymes are a kind of special metabolite in soil, and also an indicator of relatively stable and sensitive soil biological activity [42]. A superior understanding of the soil enzymatic activity in different planting patterns with a profundity effect can lead to a better knowledge about how interplanting patterns enhance soil microbial activity and soil fertility. Soil enzyme activity can affect soil physical and chemical properties, thus affecting plant growth. Acid phosphatase is the main enzyme in the cycle of phosphorus in soil and can catalyze the transformation of soil organic phosphorus into inorganic phosphorus available to plants [43,44,45]. Sucrase is an important catalytic enzyme for carbon cycling and its activity can reflect soil ripening degree and fertility level [46,47]. Protease enzyme plays a crucial role in the catalysis of nitrogen minerals and nitrogen cycling [48] while polyphenol oxidase could protect roots from bacteria and viruses as they grow [49]. Urease’s primary function is to catalyze the transformation of soil amide nitrogen into ammonium nitrogen that can be absorbed directly by plants and its activity is closely related to nitrogen use efficiency [50]. It has been reported that dehydrogenase activity participates in the biological oxidation of soil organic matter, proteolytic activity, and respiration [51]. To some level, catalase activity is a critical factor that prevents the oxidation of nutrients in root protoplasts [52,53].
In our present study, a very significant improvement in seven soil enzymatic activities was observed in the interplanting pattern compared to in the monoculture pattern. F. carica and T. cuspidata in interplanting pattern could absorb more nutrients, make more direct use of ammonium nitrogen, protein, and inorganic phosphorus in the soil, and can protect from the threat of bacteria and viruses in the soil, allowing the plant to grow more smoothly. These results indicated that an interplanting pattern can improve the level of soil fertility and increase the utilization rate of nitrogen and phosphorus [54], which may be another important reason for the increase of the growth biomass of these two plants, especially F. carica. Nutrients, enzymes, and microorganisms work together to achieve a dynamic balance and have a positive impact on plant growth. Therefore, from the perspective of soil enzyme activity index, the IFT pattern was superior to that of MF and MT.
Psoralen is a secondary metabolite in F. carica and paclitaxel a secondary metabolite in T. cuspidata. In our study, the IFT pattern significantly increased the psoralen content in F. carica. This is similar to the result of where the IFT pattern could increase the paclitaxel content in T. cuspidata. As an agrotechnical approach, interplanting normally has a crucial factor in the production and accumulation of plant secondary metabolites [55,56]. Secondary metabolites secreted can also have a wide range of biological activities that either protect the plant against pests and pathogens or act as plant growth promotors which can be beneficial for the agricultural crops [57,58]. This study forms the theoretical basis for a sustainable way to optimize medicinal-agroforestry systems. F. carica provides shade for the T. cuspidata, reducing the cost of building shade sheds. Thus, medicinal-agroforestry systems enhance land utilization, realize a joint increase in production, and enhance economic benefits. In addition, further long-term monitoring is needed to confirm the usefulness of such a plant combination for human health.

5. Conclusions

In conclusion, the IFT pattern can enhance the ecological environment of soil and soil quality by increasing plant biomass, photosynthesis, soil enzyme activities, number of potentially beneficial microorganisms, and secondary metabolite content, hence improving the yield and quality of F. carica and T. cuspidata. The results of our study can provide a feasible theoretical basis for the large-scale establishment of F. carica and T. cuspidata mixed forests and obtain high-quality medicine sources for extracting psoralen and paclitaxel. The IFT pattern is an excellent example of a new strategy for ecological medicinal plants planting, which plays a crucial role in long-term sustainable development and production of medicinal plants. Future management should be cognizant of medicinal-agroforestry interplanting patterns, as they have multiple benefits over monoculture patterns.

Author Contributions

C.Z. and C.L. conceived the underlying ideas of the study; X.Y. and Y.L. contributed to the practical aspects of the research work; Q.L., B.Q. and S.S. analyzed the data; X.Y. and Y.L. wrote the manuscript. All authors have read and agreed to the published version of the manuscript.

Funding

This research was funded by the Fundamental Research Fund for Central Universities (2572019CZ01), the National Natural Science Foundation (31870609), Heilongjiang Touyan Innovation Team Program (Tree Genetics and Breeding Innovation Team), and the 111 Project of China (B20088).

Institutional Review Board Statement

Not applicable.

Informed Consent Statement

Not applicable.

Data Availability Statement

Data are contained within the article.

Acknowledgments

The authors thank the Rongcheng healthy group Co., Ltd. for supplying the seedlings of F. carica and T. cuspidata.

Conflicts of Interest

The authors have declared no conflict of interest.

References

  1. Barolo, M.I.; Ruiz Mostacero, N.; López, S.N. Ficus carica L. (Moraceae): An ancient source of food and health. Food Chem. 2014, 164, 119–127. [Google Scholar] [CrossRef]
  2. Li, C.; Yu, M.; Li, S.; Yang, X.; Qiao, B.; Shi, S.; Zhao, C.; Fu, Y. Valorization of Fig (Ficus carica L.) Waste Leaves: HPLC-QTOF-MS/MS-DPPH System for Online Screening and Identification of Antioxidant Compounds. Plants 2021, 10, 2532. [Google Scholar] [CrossRef]
  3. Sun, R.; Sun, L.; Jia, M. Analysis of psoralen and mineral elements in the leaves of different fig (Ficus carica) cultivars. Acta Hortic. 2017, 1173, 293–296. [Google Scholar] [CrossRef]
  4. Wojdyło, A.; Nowicka, P.; Carbonell-Barrachina, Á.A.; Hernández, F. Phenolic compounds, antioxidant and antidiabetic activity of different cultivars of Ficus carica L. fruits. J. Funct. Foods 2016, 25, 421–432. [Google Scholar] [CrossRef]
  5. Abdel-Rahman, R.; Ghoneimy, E.; Abdel-Wahab, A.; Eldeeb, N.; Salem, M.; Salama, E.; Ahmed, T. The therapeutic effects of Ficus carica extract as antioxidant and anticancer agent. S. Afr. J. Bot. 2021, 141, 273–277. [Google Scholar] [CrossRef]
  6. Jiang, P.; Zhao, Y.J.; Xiong, J.; Wang, F.; Xiao, L.J.; Bao, S.Y.; Yu, X.D. Extraction, Purification, and Biological Activities of Flavonoids from Branches and Leaves of Taxus cuspidata S. et Z. Bio. Resources 2021, 16, 2655–2682. [Google Scholar] [CrossRef]
  7. Bajpai, V.K.; Sharma, A.; Moon, B.; Baek, K.H. Chemical Composition Analysis and Antibacterial Mode of Action of Taxus Cuspidata Leaf Essential Oil against Foodborne Pathogens. Ital. J. Food Saf. 2014, 34, 9–20. [Google Scholar] [CrossRef]
  8. Rozendaal, E.V.; Lelyveld, G.P.; Beek, T.V. Screening of the needles of different yew species and cultivars for paclitaxel and related taxoids. Phytochemistry 2000, 53, 383–389. [Google Scholar] [CrossRef]
  9. Sollen-Norrlin, M.; Ghaley, B.B.; Rintoul, N.L.J. Agroforestry Benefits and Challenges for Adoption in Europe and Beyond. Sustainability 2020, 12, 7001. [Google Scholar] [CrossRef]
  10. Ilany, T.; Ashton, M.S.; Montagnini, F.; Martinez, C. Using agroforestry to improve soil fertility: Effects of intercropping on Ilex paraguariensis (yerba mate) plantations with Araucaria angustifolia. Agrofor. Syst. 2010, 80, 399–409. [Google Scholar] [CrossRef]
  11. Pala, N.A. Soil Microbial Characteristics in Sub-Tropical Agro-Ecosystems of North Western Himalaya. Curr. Sci. 2018, 115, 1956–1959. [Google Scholar]
  12. Yeomans, J.C.; Bremner, J.M. A rapid and precise method for routine determination of organic carbon in soil. Commun. Soil Sci. Plant Anal. 1988, 19, 1467–1476. [Google Scholar] [CrossRef]
  13. Gallaher, R.N.; Weldon, C.O.; Boswell, F.C. A semiautomated procedure for total nitrogen in plant and soil samples. Soil Sci. Soc. Am. J. 1976, 40, 887–889. [Google Scholar] [CrossRef]
  14. Gu, L.; Xu, B.; Liang, Q.; Yin, T. Impact and colonisation ability of on lawn soil microflora. Acta Prataculturae Sin. 2013, 22, 321–326. [Google Scholar]
  15. Tang, X.; Jiang, J.; Huang, Z.; Wu, H.; Wang, J.; He, L.; Xiong, F.; Zhong, R.; Liu, J.; Han, Z. Sugarcane/peanut intercropping system improves the soil quality and increases the abundance of beneficial microbes. J. Basic Microbiol. 2021, 61, 165–176. [Google Scholar] [CrossRef]
  16. Zhang, Q.; Liu, X.; Ma, X.; Fang, J.; Fan, T.; Wu, F.; An, L.; Feng, H. Microcalorimetric study of the effects of long-term fertilization on soil microbial activity in a wheat field on the Loess Plateau. Ecotoxicology 2014, 23, 2035–2040. [Google Scholar] [CrossRef] [PubMed]
  17. Tang, X.; Zhong, R.; Jiang, J.; He, L.; Huang, Z.; Shi, G.; Wu, H.; Liu, J.; Xiong, F.; Han, Z. Cassava/peanut intercropping improves soil quality via rhizospheric microbes increased available nitrogen contents. BMC Biotechnol. 2020, 20, 13. [Google Scholar] [CrossRef] [PubMed] [Green Version]
  18. Guan, S.Y.; Zhang, D.; Zhang, Z. Soil Enzyme and Its Research Methods; Agriculture Press: Beijing, China, 1986. [Google Scholar]
  19. Cordero, I.; Snell, H.; Bardgett, R.D. High throughput method for measuring urease activity in soil. Soil Biol. Biochem. 2019, 134, 72–77. [Google Scholar] [CrossRef]
  20. Zhang, J.; Yu, X.; Xu, B.; Yagoub, A.E.G.A.; Mustapha, A.T.; Zhou, C. Effect of intensive pulsed light on the activity, structure, physico-chemical properties and surface topography of polyphenol oxidase from mushroom. Innov. Food Sci. Emerg. Technol. 2021, 72, 102741. [Google Scholar] [CrossRef]
  21. Wyk, D.A.B.v.; Adeleke, R.; Rhode, O.H.J.; Bezuidenhout, C.C.; Mienie, C. Ecological guild and enzyme activities of rhizosphere soil microbial communities associated with Bt-maize cultivation under field conditions in North West Province of South Africa. J. Basic Microbiol. 2017, 57, 781–792. [Google Scholar] [PubMed]
  22. Friedel, J.K.; Mölter, K.; Fischer, W.R. Comparison and improvement of methods for determining soil dehydrogenase activity by using triphenyltetrazolium chloride and iodonitrotetrazolium chloride. Biol. Fertil. Soils 1994, 18, 291–296. [Google Scholar] [CrossRef]
  23. Mueller, S.; Riedel, H.D.; Stremmel, W. Determination of catalase activity at physiological hydrogen peroxide concentrations. Anal. Biochem. 1997, 245, 55–60. [Google Scholar] [CrossRef]
  24. Kazemipoor, M.; Lorestani, M.A.; Ansari, M. Extraction and determination of biomarkers in Ficus carica L. leaves from various species and different cultivars by HPLC. J. Liq. Chromatogr. Relat. Technol. 2012, 35, 2831–2844. [Google Scholar] [CrossRef]
  25. Gill, H.; Vasundhara, M. Isolation of taxol producing endophytic fungus Alternaria brassicicola from non-Taxus medicinal plant Terminalia arjuna. World J. Microbiol. Biotechnol. 2019, 35, 74. [Google Scholar] [CrossRef]
  26. Kinoshita, T.; Yamazaki, H.; Inamoto, K. Effects of interplanting on fruit yield and dry matter production in greenhouse-grown tomato by integratingtwo different crop periods. JARQ Jpn. Agr. Res. Q. 2019, 53, 295–304. [Google Scholar] [CrossRef] [Green Version]
  27. Wang, X.; Zhang, R.; Wang, J.; Di, L.; Sikdar, A. The Effects of Leaf Extracts of Four Tree Species on Amygdalus pedunculata Seedlings Growth. Front Plant Sci. 2021, 11, 587579. [Google Scholar] [CrossRef] [PubMed]
  28. Pandey, M.; Singh, T. Effect of Intercropping Systems and Different Levels of Nutrients on Dry Matter Accumulation and Physiological Growth Parameters of Bed Planted Wheat (Triricum aestivum L.). Indian. J. Sci. Technol. 2015, 8, 11. [Google Scholar] [CrossRef]
  29. Marconi, L.; Armengot, L. Complex agroforestry systems against biotic homogenization: The case of plants in the herbaceous stratum of cocoa production systems. Agric. Ecosyst. Environ. 2020, 287, 106664. [Google Scholar] [CrossRef]
  30. Szw, A.; Fsc, A.; Xfh, B.; Yang, Z.A.; Xmf, A. Urbanization aggravates imbalances in the active C, N and P pools of terrestrial ecosystems—ScienceDirect. Glob. Ecol. Conserv. 2020, 21, e00831. [Google Scholar]
  31. Loveland, P.; Webb, J. Is there a critical level of organic matter in the agricultural soils of temperate regions: A review. Soil Tillage Res. 2003, 70, 1–18. [Google Scholar] [CrossRef]
  32. Jiang, F.; Drohan, P.J.; Cibin, R.; Preisendanz, H.E.; Veith, T.L. Reallocating crop rotation patterns improves water quality and maintains crop yield. Agric. Syst. 2021, 187, 103015. [Google Scholar] [CrossRef]
  33. Jensen, E.S. Grain yield, symbiotic N2 fixation and interspecific competition for inorganic N in pea-barley intercrops. Plant Soil 1996, 182, 25–38. [Google Scholar] [CrossRef]
  34. Jensen, E.S.; Carlsson, G.; Hauggaard-Nielsen, H. Intercropping of grain legumes and cereals improves the use of soil N resources and reduces the requirement for synthetic fertilizer N: A global-scale analysis. Agron. Sustain. Dev. 2020, 40, 5. [Google Scholar] [CrossRef] [Green Version]
  35. Zhang, F.; Shen, J.; Zhang, J.; Zuo, Y.; Chen, X. Rhizosphere Processes and Management for Improving Nutrient Use Efficiency and Crop Productivity. Adv. Agron. 2010, 107, 1–32. [Google Scholar]
  36. Shen, J.; Li, C.; Mi, G.; Li, L.; Yuan, L.; Jiang, R.; Zhang, F. Maximizing root/rhizosphere efficiency to improve crop productivity and nutrient use efficiency in intensive agriculture of China. J. Exp. Bot. 2013, 64, 1181–1192. [Google Scholar] [CrossRef] [PubMed]
  37. Ehrmann, J.; Ritz, K. Plant: Soil interactions in temperate multi-cropping production systems. Plant Soil 2014, 376, 1–29. [Google Scholar] [CrossRef] [Green Version]
  38. Li, Y.; Li, Z.; Arafat, Y.; Lin, W.; Jiang, Y.; Weng, B.; Lin, W.X. Characterizing rhizosphere microbial communities in long-term monoculture tea orchards by fatty acid profiles and substrate utilization—ScienceDirect. Eur. J. Soil Biol. 2017, 81, 48–54. [Google Scholar] [CrossRef]
  39. Langenberger, G.; Cadisch, G.; Martin, K.; Min, S.; Waibel, H. Rubber intercropping: A viable concept for the 21st century? Agrofor. Syst. 2017, 91, 577–596. [Google Scholar] [CrossRef]
  40. Qin, X.; Wei, C.; Li, J.; Chen, Y.; Chen, H.S.; Zheng, Y.; Nong, Y.; Liao, C.; Chen, X.; Luo, Y.; et al. Changes in Soil Microbial Community Structure and Functional Diversity in the Rhizosphere Surrounding Tea and Soybean. J. Agri. Sci. Sri Lanka 2017, 12, 1. [Google Scholar] [CrossRef] [Green Version]
  41. Mortimer, P.E.; Gui, H.; Xu, J.; Zhang, C.; Barrios, E.; Hyde, K.D. Alder trees enhance crop productivity and soil microbial biomass in tea plantations. Appl. Soil Ecol. 2015, 96, 25–32. [Google Scholar] [CrossRef]
  42. Schandry, N.; Becker, C. Allelopathic Plants: Models for Studying Plant–Interkingdom Interactions. Trends Plant Sci. 2020, 25, 176–185. [Google Scholar] [CrossRef] [Green Version]
  43. Zhao, J.; Wu, X.; Nie, C.; Wu, T.; Dai, W.; Liu, H.; Yang, R. Analysis of unculturable bacterial communities in tea orchard soils based on nested PCR-DGGE. World J. Microbiol. Biotechnol. 2012, 28, 1967–1979. [Google Scholar] [CrossRef] [PubMed]
  44. Chen, L.; Rossi, F.; Deng, S.; Liu, Y.; Wang, G.; Adessi, A.; Philippis, R.D. Macromolecular and chemical features of the excreted extracellular polysaccharides in induced biological soil crusts of different ages. Soil Biol. Biochem. 2014, 78, 1–9. [Google Scholar] [CrossRef]
  45. Wang, Y.; Dong, J.; Zheng, X.; Zhang, J.; Zhou, P.; Song, X.; Song, W.; Wang, S. Wheat straw and biochar effect on soil carbon fractions, enzyme activities, and nutrients in a tobacco field. Can. J. Soil Sci. 2021, 101, 1–12. [Google Scholar] [CrossRef]
  46. Rashid, M.; Tigabu, M.; Chen, H.; Farooq, T.H.; Wu, P. Calcium-mediated adaptive responses to low phosphorus stress in Chinese fir. Trees 2020, 34, 825–834. [Google Scholar] [CrossRef]
  47. Kwiatkowski, C.A.; Harasim, E.; Feledyn-Szewczyk, B.; Antonkiewicz, J. Enzymatic Activity of Loess Soil in Organic and Conventional Farming Systems. Agriculture 2020, 10, 135. [Google Scholar] [CrossRef] [Green Version]
  48. Jan, M.T.; Roberts, P.; Tonheim, S.K.; Jones, D.L. Protein breakdown represents a major bottleneck in nitrogen cycling in grassland soils. Soil Biol. Biochem. 2009, 41, 2272–2282. [Google Scholar] [CrossRef]
  49. Roohi, M.; Arif, M.S.; Yasmeen, T.; Riaz, M.; Bragazza, L. Effects of cropping system and fertilization regime on soil phosphorous are mediated by rhizosphere-microbial processes in a semi-arid agroecosystem. J. Environ. Manag. 2020, 271, 111033. [Google Scholar] [CrossRef] [PubMed]
  50. Li, Y.; Wang, C.; Gao, S.; Wang, P.; Shang, S. Impacts of simulated nitrogen deposition on soil enzyme activity in a northern temperate forest ecosystem depend on the form and level of added nitrogen. Eur. J. Soil Biol. 2021, 103, 103287. [Google Scholar] [CrossRef]
  51. Uren, N.C. Types, Amounts, and Possible Functions of Compounds Released into the Rhizosphere by Soil-Grown Plants. Rhizosph. Biochem. Org. Subst. Soil Plant Interface 2007, 2, 1–21. [Google Scholar]
  52. Farhangi-Abriz, S.; Ghassemi-Golezani, K.; Torabian, S. A short-term study of soil microbial activities and soybean productivity under tillage systems with low soil organic matter. Appl. Soil Ecol. 2021, 168, 104122. [Google Scholar] [CrossRef]
  53. Wen, F.; Vanetten, H.D.; Tsaprailis, G.; Hawes, M. Extracellular proteins in pea root tip and border cell exudates. Plant Physiol. 2007, 143, 773–783. [Google Scholar] [CrossRef] [PubMed] [Green Version]
  54. Mobley, H.; Hu, L.T.; Foxal, P.A. Helicobacter pylori Urease: Properties and Role in Pathogenesis. Scand. J. Gastroenterol. 2009, 26, 39–46. [Google Scholar] [CrossRef]
  55. Bainard, L.D.; Koch, A.M.; Gordon, A.M.; Klironomos, J.N. Growth response of crops to soil microbial communities from conventional monocropping and tree-based intercropping systems. Plant Soil 2013, 363, 345–356. [Google Scholar] [CrossRef]
  56. Ngwene, B.; Neugart, S.; Baldermann, S.; Ravi, B.; Schreiner, M. Intercropping Induces Changes in Specific Secondary Metabolite Concentration in Ethiopian Kale (Brassica carinata) and African Nightshade (Solanum scabrum) under Controlled Conditions. Front. Plant Sci. 2017, 8, 1700. [Google Scholar] [CrossRef] [PubMed]
  57. Figueiredo, A.C.; Barroso, J.G.; Pedro, L.G.; Scheffer, J.J.C. Factors affecting secondary metabolite production in plants: Volatile components and essential oils. Flavour. Fragr. J. 2008, 23, 213–226. [Google Scholar] [CrossRef]
  58. Keswani, C.; Singh, H.B.; García-Estrada, C.; Caradus, J.; Sansinenea, E. Antimicrobial secondary metabolites from agriculturally important bacteria as next-generation pesticides. Appl. Microbiol. Biotechnol. 2020, 104, 1013–1034. [Google Scholar] [CrossRef] [PubMed]
Figure 1. Location of medicinal-agroforestry system in Xiazhuang County, Rongcheng City, Shandong Province, China.
Agriculture 11 01276 g001
Figure 2. Experimental design of three planting patterns.
Agriculture 11 01276 g002
Figure 3. Variation of net photosynthetic rate (A), stomatal conductance (B), and intercellular carbon dioxide concentration (C) of F. carica under different planting patterns. Values are reported as Mean ± SD, n = 4.
Agriculture 11 01276 g003
Figure 4. Variation of net photosynthetic rate (A), stomatal conductance (B), and intercellular carbon dioxide concentration (C) of T. cuspidata under different planting patterns. Values are reported as mean ± SD, n = 4.
Agriculture 11 01276 g004
Figure 5. Variability in (A) soil organic carbon (SOC) and (B) total nitrogen (TN) in different planting patterns. Values are reported as mean ± SD, n = 4.
Agriculture 11 01276 g005
Figure 6. Variability in (A) bacteria, (B) fungus, and (C) bacteria /fungus in soil under different planting pat terns. Values are reported as mean ± SD, n = 4. Different uppercase letters indicate significant differences between different treatments time at p < 0.01, while different lowercase letters indicate significant differences in different planting patterns p < 0.01.
Agriculture 11 01276 g006
Figure 7. Variability in (A) acid phosphatase, (B) sucrase, (C) protease, (D) polyphenol oxidase, (E) urease, (F) dehydrogenase, and (G) catalase bacteria soil enzyme activities under different planting patterns. Values are reported as mean ± SD, n = 4. Different uppercase letters indicate significant differences between different treatments time at p < 0.01, while different lowercase letters indicate significant differences in different planting patterns p < 0.01.
Agriculture 11 01276 g007
Figure 8. Variability in (A) psoralen content in F. carica and (B) paclitaxel content in T. cuspidata under different planting patterns. Values are reported as mean ± SD, n = 4.
Agriculture 11 01276 g008
Table 1. Variation of total volume of F. carica new branch under different planting patterns.
MonthPlanting Patterns
Interplanting (cm3)Monoculture (cm3)
545.8 ± 1.1 Ea40.5 ± 2.0 Eb
663.4 ± 1.3 Da56.1 ± 1.9 Db
775.9 ± 1.7 Ca67.2 ± 2.1 Cb
885.7 ± 1.8 Ba73.8 ± 1.4 Bb
996.8 ± 2.1 Aa78.4 ± 1.8 Ab
Different uppercase letters indicate significant differences between different treatments time at p < 0.01, while different lowercase letters indicate significant differences in different planting patterns p < 0.01.
Table 2. Variation of T. cuspidata plant height under different planting patterns.
MonthInterplantingMonoculture
Plant Height (cm)Growth Rate of Plant Height (%)Plant Height (cm)Growth Rate of Plant Height (%)
434.1 ± 1.9 Fa30.2 ± 1.5 Fb
540.9 ± 1.7 Ea19.9 ± 1.9 Ea34.7 ± 2.4 Eb14.9 ± 2.4 Ea
647.4 ± 2.1 Da39.0 ± 1.6 Da40.2 ± 1.3 Db33.1 ± 0.4 Db
757.9 ± 1.8 Ca69.8 ± 1.8 Ca48.7 ± 1.7 Cb61.3 ± 0.7 Cb
868.5 ± 2.4 Ba100.8 ± 1.3 Ba57.5 ± 1.6 Bb90.4 ± 1.8 Bb
975.6 ± 1.6 Aa121.7 ± 1.2 Aa61.8 ± 1.3 Ab104.6 ± 0.9 Ab
Different uppercase letters indicate significant differences between different treatments time at p < 0.01, while different lowercase letters indicate significant differences in different planting patterns p < 0.01.
Table 3. Variation of T. cuspidata basal diameter under different planting patterns.
MonthInterplantingMonoculture
Basal Diameter (mm)Growth Rate of Basal Diameter (%)Basal Diameter (mm)Growth Rate of Basal Diameter (%)
414.54 ± 0.11 Fa14.46 ± 0.17 Fa
515.38 ± 0.32 Ea5.8 ± 2.1 Ea14.98 ± 0.14 Eb3.6 ± 7.8 Eb
616.89 ± 0.28 Da16.2 ± 5.4 Da15.71 ± 0.24 Db8.6 ± 5.7 Db
718.53 ± 0.23 Ca27.4 ± 2.2 Ca16.63 ± 0.33 Cb15.0 ± 8.0 Cb
820.23 ± 0.37 Ba39.1 ± 3.2 Ba17.35 ± 0.26 Bb20.0 ± 4.1 Bb
921.13 ± 0.25 Aa45.3 ± 1.2 Aa17.63 ± 0.22 Ab21.9 ± 7.3 Ab
Different uppercase letters indicate significant differences between different treatments time at p < 0.01, while different lowercase letters indicate significant differences in different planting patterns p < 0.01.
Publisher’s Note: MDPI stays neutral with regard to jurisdictional claims in published maps and institutional affiliations.

