1. Introduction
Cultivated peanut (
Arachis hypogaea L.) is an important annual legume worldwide. The planting regions cover tropical, subtropical, and warm temperate areas [
1,
2]. Peanut seeds contain high nutritional value, including 45–55% fatty acid, 20–30% protein, vitamin C, thiamin, niacin, riboflavin, vitamin D, vitamin K, calcium, phosphorous, copper, and magnesium. In addition, the seeds also contain functional compounds (resveratrol, phenolics, and flavonoids) that are beneficial for human health [
3]. Peanut originated in South America and is allotetraploid, originating from two ancestors,
Arachis duranensis and
Arachis ipaënsis [
4]. Hybridization likely occurred 9400 years ago and chromosome doubling followed 3500–4500 years ago [
4,
5]. Because of the difference in ploidy, peanuts have a narrow genetic background [
6].
Germplasms play a critical role in breeding prospects. The main objective of peanut breeding is to increase the genetic potential of qualitative and quantitative traits [
7]. In addition to the naturally narrow genetic base in peanuts, very few elite breeding lines/varieties have been utilized, leading to a decrease in peanut genetic variation [
8]. Germplasms provide a good resource for increasing the genetic diversity in peanuts and improving the quality of desired traits, such as disease resistance [
9,
10].
There are several important peanut germplasm collection centers. The International Crops Research Institute for the Semi-Arid Tropics (ICRISAT) possesses most of the peanut germplasm, including 15,466 accessions from 92 countries (
https://www.icrisat.org/, accessed on 4 November 2021). The United States Department of Agriculture (USDA) collection includes 9833 accessions from 102 countries and is the second largest peanut germplasm center (
https://www.usda.gov/, accessed on 4 November 2021). Frankel et al., (1984) [
9] proposed the concept of a core collection, and the first peanut core collection study was published in 1993 [
11]. The authors used 7432 peanut accessions from the USDA and divided them into nine groups according to country origin and plant morphology. The core collection was built by taking 10% of accessions from each group, and consisted of a total of 831 accessions. Several core collection studies have been conducted [
11,
12,
13,
14,
15,
16,
17,
18]. Ten percent of accessions are randomly sampled from the original collection to build the core collection. The Shannon–Weaver diversity index can be used to estimate the composition and distribution of certain populations. It is a common index and can be used to compare the diversity between the original collection and core collection after sampling [
19].
Evaluation of germplasms can be conducted through phenotyping or genotyping. Phenotyping is a traditional method to classify germplasms into different groups based on morphological and agronomic traits [
20,
21]. Principal component analysis (PCA) and cluster analysis are common analysis tools used to describe the pattern of variation in a germplasm population and to organize similar genotypes into a group. Peanuts can be classified into four market types (Valencia, Spanish, Runner, and Virginia). They belong to different subspecies (spp.
hypogaea and
fastigiata) and have distinct growth habits. The accessions in germplasms can also be classified into different market types, and the grouping results by PCA or cluster analysis should be related to market types. The genotype × trait (GT) biplots provide an easy way to visualize the correlation among traits and germplasm accessions. This is a good tool to help breeders rapidly choose the desired genotypes under different conditions.
Genotyping of germplasm assisted by molecular markers is another method to analyze the genetic structure and population diversity. Simple sequence repeat (SSR) and single nucleotide polymorphism (SNP) markers are two popular marker types. SSR markers were used to evaluate the US minicore and core collections to evaluate germplasm diversity [
22,
23]. Pandey et al. (2017) [
24] genotyped 300 peanut accessions from ICRISAT, using the Axiom Arachis SNP array. Similarly, a mixed population (100 samples from South Korea and 284 samples from USDA) was genotyped by SNP array to understand the genetic diversity of the mixed population [
25].
Rust is a peanut foliar disease and is caused by
Puccinia arachidis. It is one of the most severe peanut diseases, and the main peanut production areas suffer from yield loss [
26,
27]. Many linkage maps related to rust resistance have been constructed [
28,
29,
30] and molecular markers linked to rust resistance quantitative trait loci (QTLs) have also been identified [
31,
32,
33,
34,
35,
36]. These markers can be used to screen potential rust-resistant germplasms.
Peanuts can grow under different weather conditions and in tropical and subtropical areas, they can be planted twice a year. The top three peanut production countries are China, India, and Nigeria (FAO database,
https://www.fao.org/statistics/en/, accessed on 4 Novermber 2021). All three countries have two planting seasons per year; however, the growing conditions are very distinct in the different seasons based on temperature and rainfall. Therefore, the evaluation of germplasms should be conducted under these circumstances. For agronomic trait phenotyping and rust resistance screening, seasonal variation has to be taken into account. Otherwise, the germplasm application will be limited, even in the same planting area.
Germplasm studies have rarely focused on the seasonal differences. In Taiwan, peanut has the third largest production area, just behind rice (
Oryza sativa) and corn (
Zea mays) (FAO database,
https://www.fao.org/statistics/en/, accessed on 4 Novermber 2021). In Taiwan, peanuts are planted in the spring and fall. The two-season planting pattern is similar to that of China, India, and Nigeria. In this study, the entire peanut germplasm collection from the Taiwan germplasm database was evaluated by phenotyping. Random sampling (10%) was conducted, and a core collection was evaluated by phenotyping and genotyping in both the spring and fall seasons. The objectives of this study were to compare the seasonal differences in the core collection under a two-season cropping system and to identify suitable accessions for breeding purposes in Taiwan. In addition, the germplasms were screened using rust resistance markers to validate the potential rust resistance genotypes in multiple seasons for future breeding use.
2. Materials and Methods
2.1. Germplasm
Peanut seeds were obtained from the National Plant Genetic Resources Center (NPGRC) in Taiwan. The germplasms were collected from different countries, including Taiwan’s commercial varieties and landraces. A total of 1495 accessions comprised the entire collection, including 657 Spanish, 345 Virginia, 262 Runner, and 230 Valencia market type peanuts (
Table S1). The medium collection contained 498 accessions, selected from among the 1495 accessions using random stratified sampling based on the four market types, and included 218 Spanish (33.2%), 77 Valencia (33.5%), 87 Runner (33.2%), and 116 Virginia (33.6%) market type peanuts (
Table S1). A core collection (152 accessions) was built from the 1495 accessions similar to the medium collection, using stratified sampling with a selection intensity of approximately 10%. This collection contained 75 Spanish (11.4%), 21 Valencia (9.1%), 31 Runner (11.8%), and 24 Virginia (7.0%) market type peanuts (
Table S1).
2.2. Field Experiment
The experiment was conducted at two locations, Taiwan Agricultural Research Institute, Taichung main station (TARI-T, 24°01′48.6″ N 120°41′47.3″ E) and Taiwan Agricultural Research Institute, Chiayi branch station (TARI-C, 23°29′04″ N, 120°28′04″ E). For the TARI-T experiment, the entire collection (1495 accessions) was planted in 2000, and the medium collection (498 accessions) was planted in 2019. For the TARI-C experiment, the core collection (152 accessions) was planted in the spring and fall seasons of 2019. Historically, both locations showed medium levels of disease incidence in terms of rust, late leaf spot, stem rot and Witches’ broom disease, and thus this study was relied on natural inoculation. Based on two-season field results in 2019, rust-resistant accessions were selected and planted in spring 2020, fall 2020, and spring 2021. All experiments were performed in accordance with the standard peanut recommendations in Taiwan.
2.3. Agronomic Traits Phenotyping and Disease Evaluation
For the entire collection, the agronomic trait phenotyping in 2000 included 12 quantitative traits (plant height, days to flowering, pod length, pod width, seed length, seed width, 100-pod weight, 100-seed weight, shelling percentage, seed oil content, seed protein content, and yield) and six qualitative traits (growth habit, number of seeds per pod, pod constriction, pod reticulation, seed color, and leaflet shape). For the medium collection, phenotyping in 2019 included plant height, yield, rust evaluation, and late leaf spot evaluation. For the core collection, phenotyping in the spring and fall of 2019 included pod length, pod width, 100-pod weight, 100-seed weight, shelling percentage, yield, rust evaluation, late leaf spot evaluation, stem rot evaluation, and witches’ broom disease evaluation.
Four diseases were evaluated in this study. The rust and late leaf spot evaluation guidelines followed Subrahmanyam et al., (1995) [
37]. The rating is classified on a scale of 1 to 9, where scale 1 indicates no symptoms and scale 9 indicates almost all leaves wilted with only the stem remaining. The stem rot and witches’ broom disease are also classified into nine scales. For stem rot, the guideline modified from Luo et al., (2020) [
38] is used, where 1 = no disease symptoms; 2 = one or two small lesions (less than 0.7 cm in length) in crown area; 3 = one or more elongated, larger lesions (larger than 0.7 cm) in crown area; 4 = the entire crown area is girdled by lesions; 5 = the entire crown area is girdled and one branch is killed by the disease; 6 = up to 25% of the entire plant (stem, leaves, crown area, roots, pegs and pods) is colonized by the disease; 7 = 26–50% of the entire plant is colonized by the disease; 8 = 51–75% of the entire plant is colonized by the disease; and 9 = 76–100% of the entire plant is colonized by the disease. For witches’ broom disease, 1 = no disease symptoms; 2 = rosette leaves observed on one branch; 3 = rosette leaves observed on two branches; 4 = rosette leaves observed on more than two branches; 5 = 25–40% of the entire plant is covered by rosette leaves; 6 = 41–55% of the entire plant is covered by rosette leaves; 7 = 56–70% of the entire plant is covered by rosette leaves; 8 = 71–85% of the entire plant is covered by rosette leaves; and 9 = 86–100% of the entire plant is covered by rosette leaves.
2.4. Genotyping
DNA from all accessions in the core collection was extracted. Leaf tissues were collected and ground. The Genomic DNA Isolation kit (GeneDireX
®, Taoyuan City, Taiwan) was used according to the manufacturer’s protocol. Kompetitive Allele-Specific PCR (KASP) was performed for SNP marker genotyping [
39,
40]. The primers were designed by the Crop Science Division of TARI-T and there were 16 primers used in this experiment (
Table S2). Real-time PCR (StepOne, Applied Biosystems
®, Waltham, MA, USA) was performed to detect the florescence in 10 µL samples containing 5 μL of KASP master mix, 0.14 μL of KASP assay mix, and 25 ng of DNA template. The touchdown PCR program was set with a pre-read stage at 30 °C for 1 min; hold stage 94 °C for 15 min; PCR stage 1: 10 cycles of amplification at 94 °C for 20 s, 61 to 55 °C for 20 s (every cycle drops 0.6 °C until reaching 55 °C); PCR stage 2: 26 cycles of amplification at 94 °C for 20 s, 55 °C for 1 min; and a post-read stage at 30 °C for 1 min. The fluorescent signal HEX was labelled Allele 1/Allele 1 and FAM was labelled Allele 2/Allele 2. Heterozygotes were also detected.
Rust disease resistance–related SSR markers were selected from different reference papers [
3,
31,
32,
33,
34,
35,
36,
41,
42] and a total of 30 primers were selected (
Table S3). PCR was conducted in 10 µL samples containing 5 μL of 2X Master Mix, 1 μL of forward and reverse primers (2 mM), 1 μL of DNA template (10 ng/μL), and 3 μL of distilled deionized water. The PCR program was operated using a touchdown program with an initial denaturation at 94 °C for 3 min; 10 cycles of amplification at 94 °C for 30 s, 65 °C to 55 °C for 20 s (every cycle drops 1 °C until reaching 55 °C), 72 °C for 40 s; 30 cycles of amplification at 94 °C for 30 s, 55 °C for 20 s, 72 °C for 40 s; and a final extension at 72 °C for 7 min. The PCR products were separated on a 6% non-denatured polyacrylamide gel electrophoresis matrix at 125 V for 45 min in 0.5× TBE buffer with the MGV-202-33 gel screen system (C.B.S. Scientific
®, San Diego, CA, USA). The gels were stained with SYBR
® Safe DNA Gel Stain (Invitrogen, Thermo Fisher Scientific, Waltham, MA, USA) and were visualized under UV light (365 nm).
2.5. Statistical Analysis
The Shannon–Weaver diversity index (
H′) was calculated for all three collections (entire, medium, and core) for quantitative and qualitative traits using the formula:
Data were analyzed using R software (version 4.0.5). For PCA, the PCA function in the FactoMineR package was used to calculate the principal components among all agronomic traits. The fviz_pca_biplot function was used to draw the biplot, and the fviz_dend function was used to draw the dendrogram. Analysis of variance (ANOVA) was performed using the aov function in the stats package and the Tukey HSD test was performed using the HSD.test function in the agricolae package. Pearson correlation was calculated among different agronomic traits with the rcorr function using the Hsmisc package. The GGEBiplotGUI package was used for the GT biplot analysis and genotype + genotype × environment interaction (GGE) analysis. The rust resistance phenotypic variance explained (PVE) of molecular markers was calculated using a regression model, and the lm function in the stats package was utilized. The KASP genotyping data were utilized to obtain the population structure of the core collection using Structure (2.3.4).
3. Results
The data for different agronomic traits in the three collections are shown in
Table 1. In 2000, the entire germplasm collection (1495 accessions) was planted at TARI-T. In 2019, the medium germplasm (498 accessions) and core germplasm (152 accessions) collections were planted at TARI-T and TARI-C, respectively. Data on the medium and core populations in 2000 were from the original entire germplasm, but only the accessions belonging to the medium and core populations were analyzed. According to the data from 2000, although the population size decreased, the population means and the coefficient of variation did not change much (
Table 1).
PCA was conducted for the data from 2000 under different population sizes (
Table 2). The results showed that the PCA components were very similar among the three populations. The variances in PC1 in the three populations were similar. They accounted for 32.3%, 33.1%, and 31.3% of the entire, medium, and core populations, respectively. In addition, the main variables on PC1 for the three populations were the same: 100-pod weight, 100-seed weight, seed length, and pod length.
The Shannon–Weaver diversity index was estimated for different populations (
Table 3). For data from 2000, the diversity index was very similar for both quantitative and qualitative traits. For most traits, the entire collection possessed the highest values (plant height, pod width, seed length, 100-pod weight, pod yield, growth habit, number of seeds per pod, pod contraction, pod reticulation, and late leaf spot); however, it showed the lowest values for some traits (flowering days, seed width, and shelling percentage).
In 2019, the medium collection was planted at TARI-T and the core collection was planted at TARI-C. In addition to data from 2000,
Table 1 shows the trait values on the medium and core collections for 2019. All the values evaluated in 2019 increased, including plant height, flowering, pod length, pod width, 100-pod weight, 100-seed weight, shelling percentage, and yield. Almost all of the traits are related to the yield directly and the yield in 2019 was two times more than that in 2000, indicating that crop management has greatly improved over the past 20 years. In general, the Shannon–Weaver diversity index for 2019 was smaller than that in 2000, but for some traits (plant height, pod width, yield, and rust rating), the index was higher in 2019 (
Table 3).
Two seasons (spring and fall) were planted in 2019 for the core collection. The different market types (Spanish, Valencia, Runner, and Virginia) showed very different results (
Table 4). In the Spanish market type, in both the spring and fall seasons, a good yield and shelling percentage was obtained, but it was highly susceptible to rust and had a short pod width. The Valencia market type had the highest 100-pod weight and good shelling percentage. It was more susceptible to rust and late leaf spot than Runner and Virginia during the fall season. Runner and Virginia market types showed a lower shelling percentage, but more resistance to disease and longer days to flowering than Spanish and Valencia.
Comparing the fall season to the spring season (
Table 4), the Spanish market type was highly susceptible, and the yield and pod length decreased. In Valencia, the difference between the two seasons was not significant; considering Runner, the 100-pod weight, 100-seed weight, and shelling percentage were significantly decreased; and in Virginia, the value of the 100-pod weight decreased. The witches’ broom disease rating was very different between spring and fall seasons and a lower rating was showed in fall.
PCA was performed during the spring season, including four disease ratings and six agronomic traits. The fall season followed the same evaluation process but with the addition of days to flowering as the seventh agronomic trait.
Table 5 shows the contributors to the top three principal components. PC1 accounted for 32.43% of variance in the spring season and the four variables on PC1 were all related to pod and seed size, including seed width (0.868), seed length (0.805), 100-pod weight (0.797), and 100-seed weight (0.785). There were three variables for PC2 (17% variance): yield (0.707), shelling percentage (0.646), and stem rot disease (−0.322).
In the fall season, PC1 accounted for 40.87% of the variance, and the four main variables were the shelling percentage (0.919), days to flowering (−0.887), rust disease (0.871), and yield (0.670). The components were very different from those for PC1 in the spring. However, for PC2, which accounted for 24.89% of the variance, the four variables were the same as the PC1 variables in spring. They were seed width (0.854), 100-pod weight (0.804), 100-seed weight (0.751), and pod length (0.654).
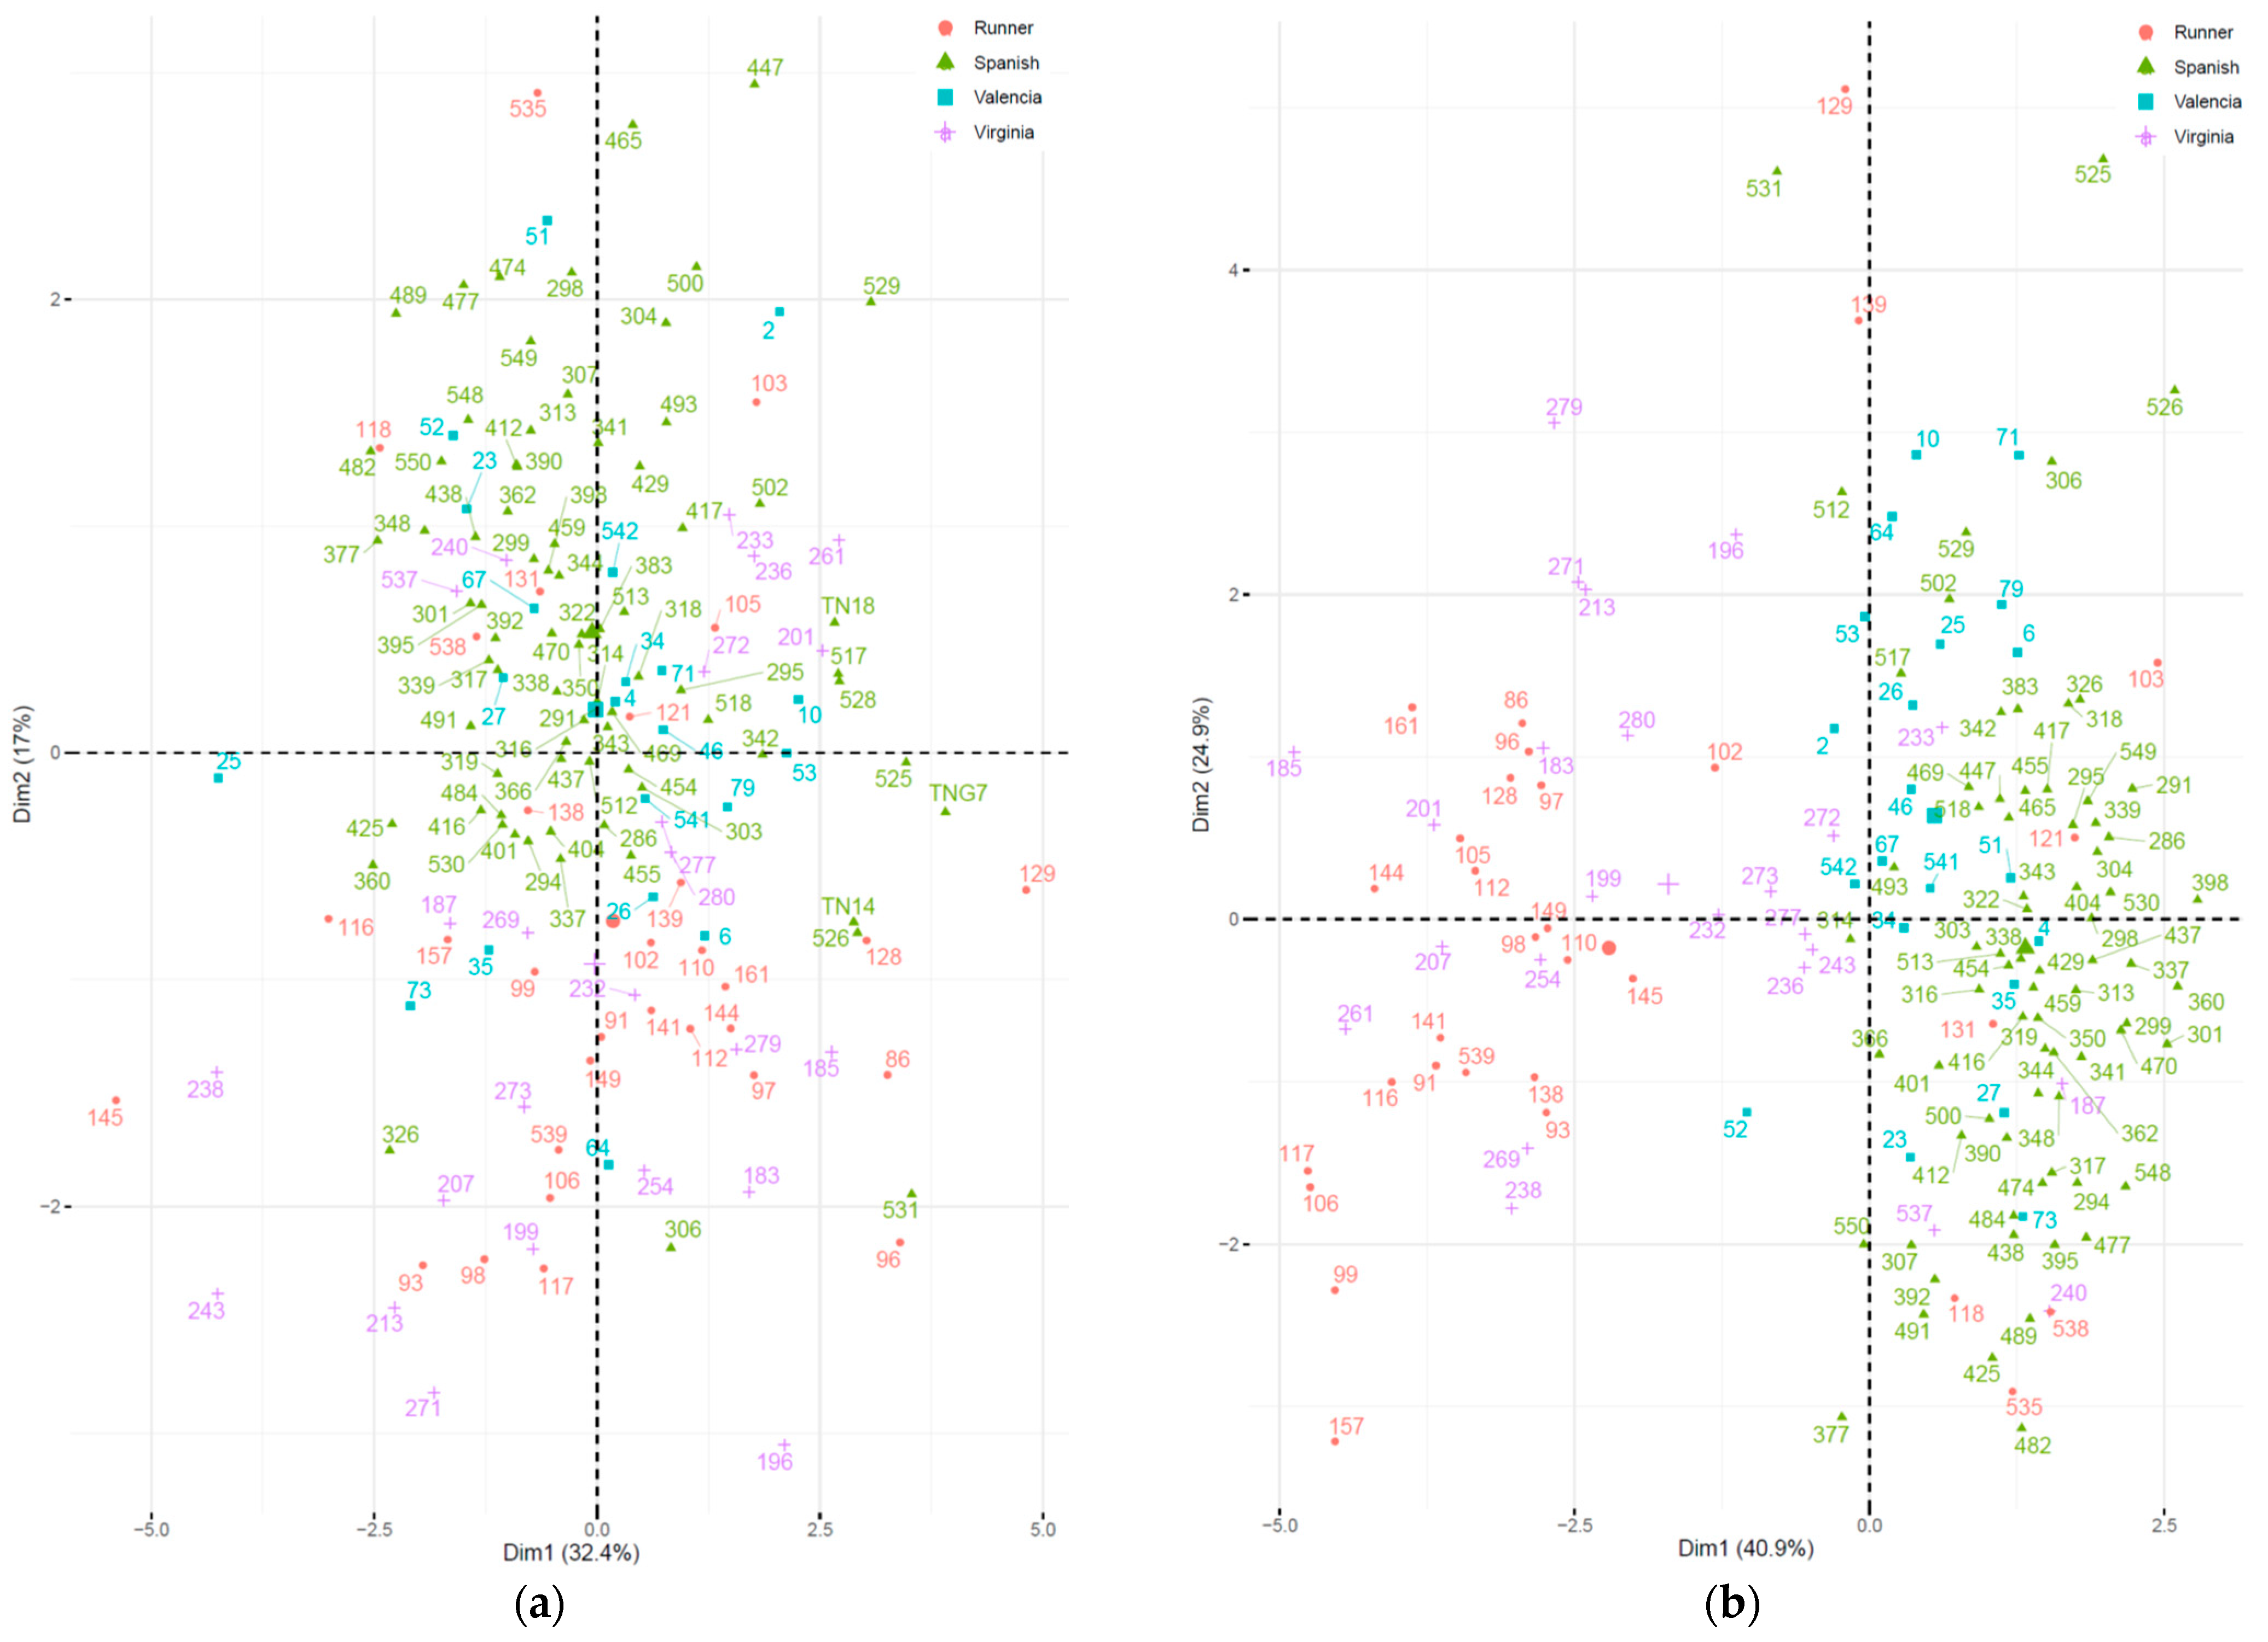
PCA biplots were created for the spring (
Figure 1a) and fall (
Figure 1b). All accessions are labelled with different colors according to their market types. For the spring season (
Figure 1a), most of the Spanish and Valencia accessions are plotted on the upper part and those for Virginia and Runner are on the lower part, which indicates that the
y-axis (PC2) can better separate the market types. In the fall season (
Figure 1b), the market types can be mainly separated by the
x-axis (PC1). Spanish and Valencia are plotted on the right, and Virginia and Runner are on the left. Compared to the spring season, the accessions were highly dispersed in fall and the grouping outcome was improved, although the biplots could not distinguish the differences between Spanish and Valencia, or between Runner and Virginia for both seasons. Shelling percentage was the only variable appearing on PC2 in the spring and on PC1 in the fall. This indicates that it is an important variable of the germplasms that separates the two main market types. Spanish and Valencia tend to have a better shelling percentage than Runner and Virginia in Taiwan’s environment.
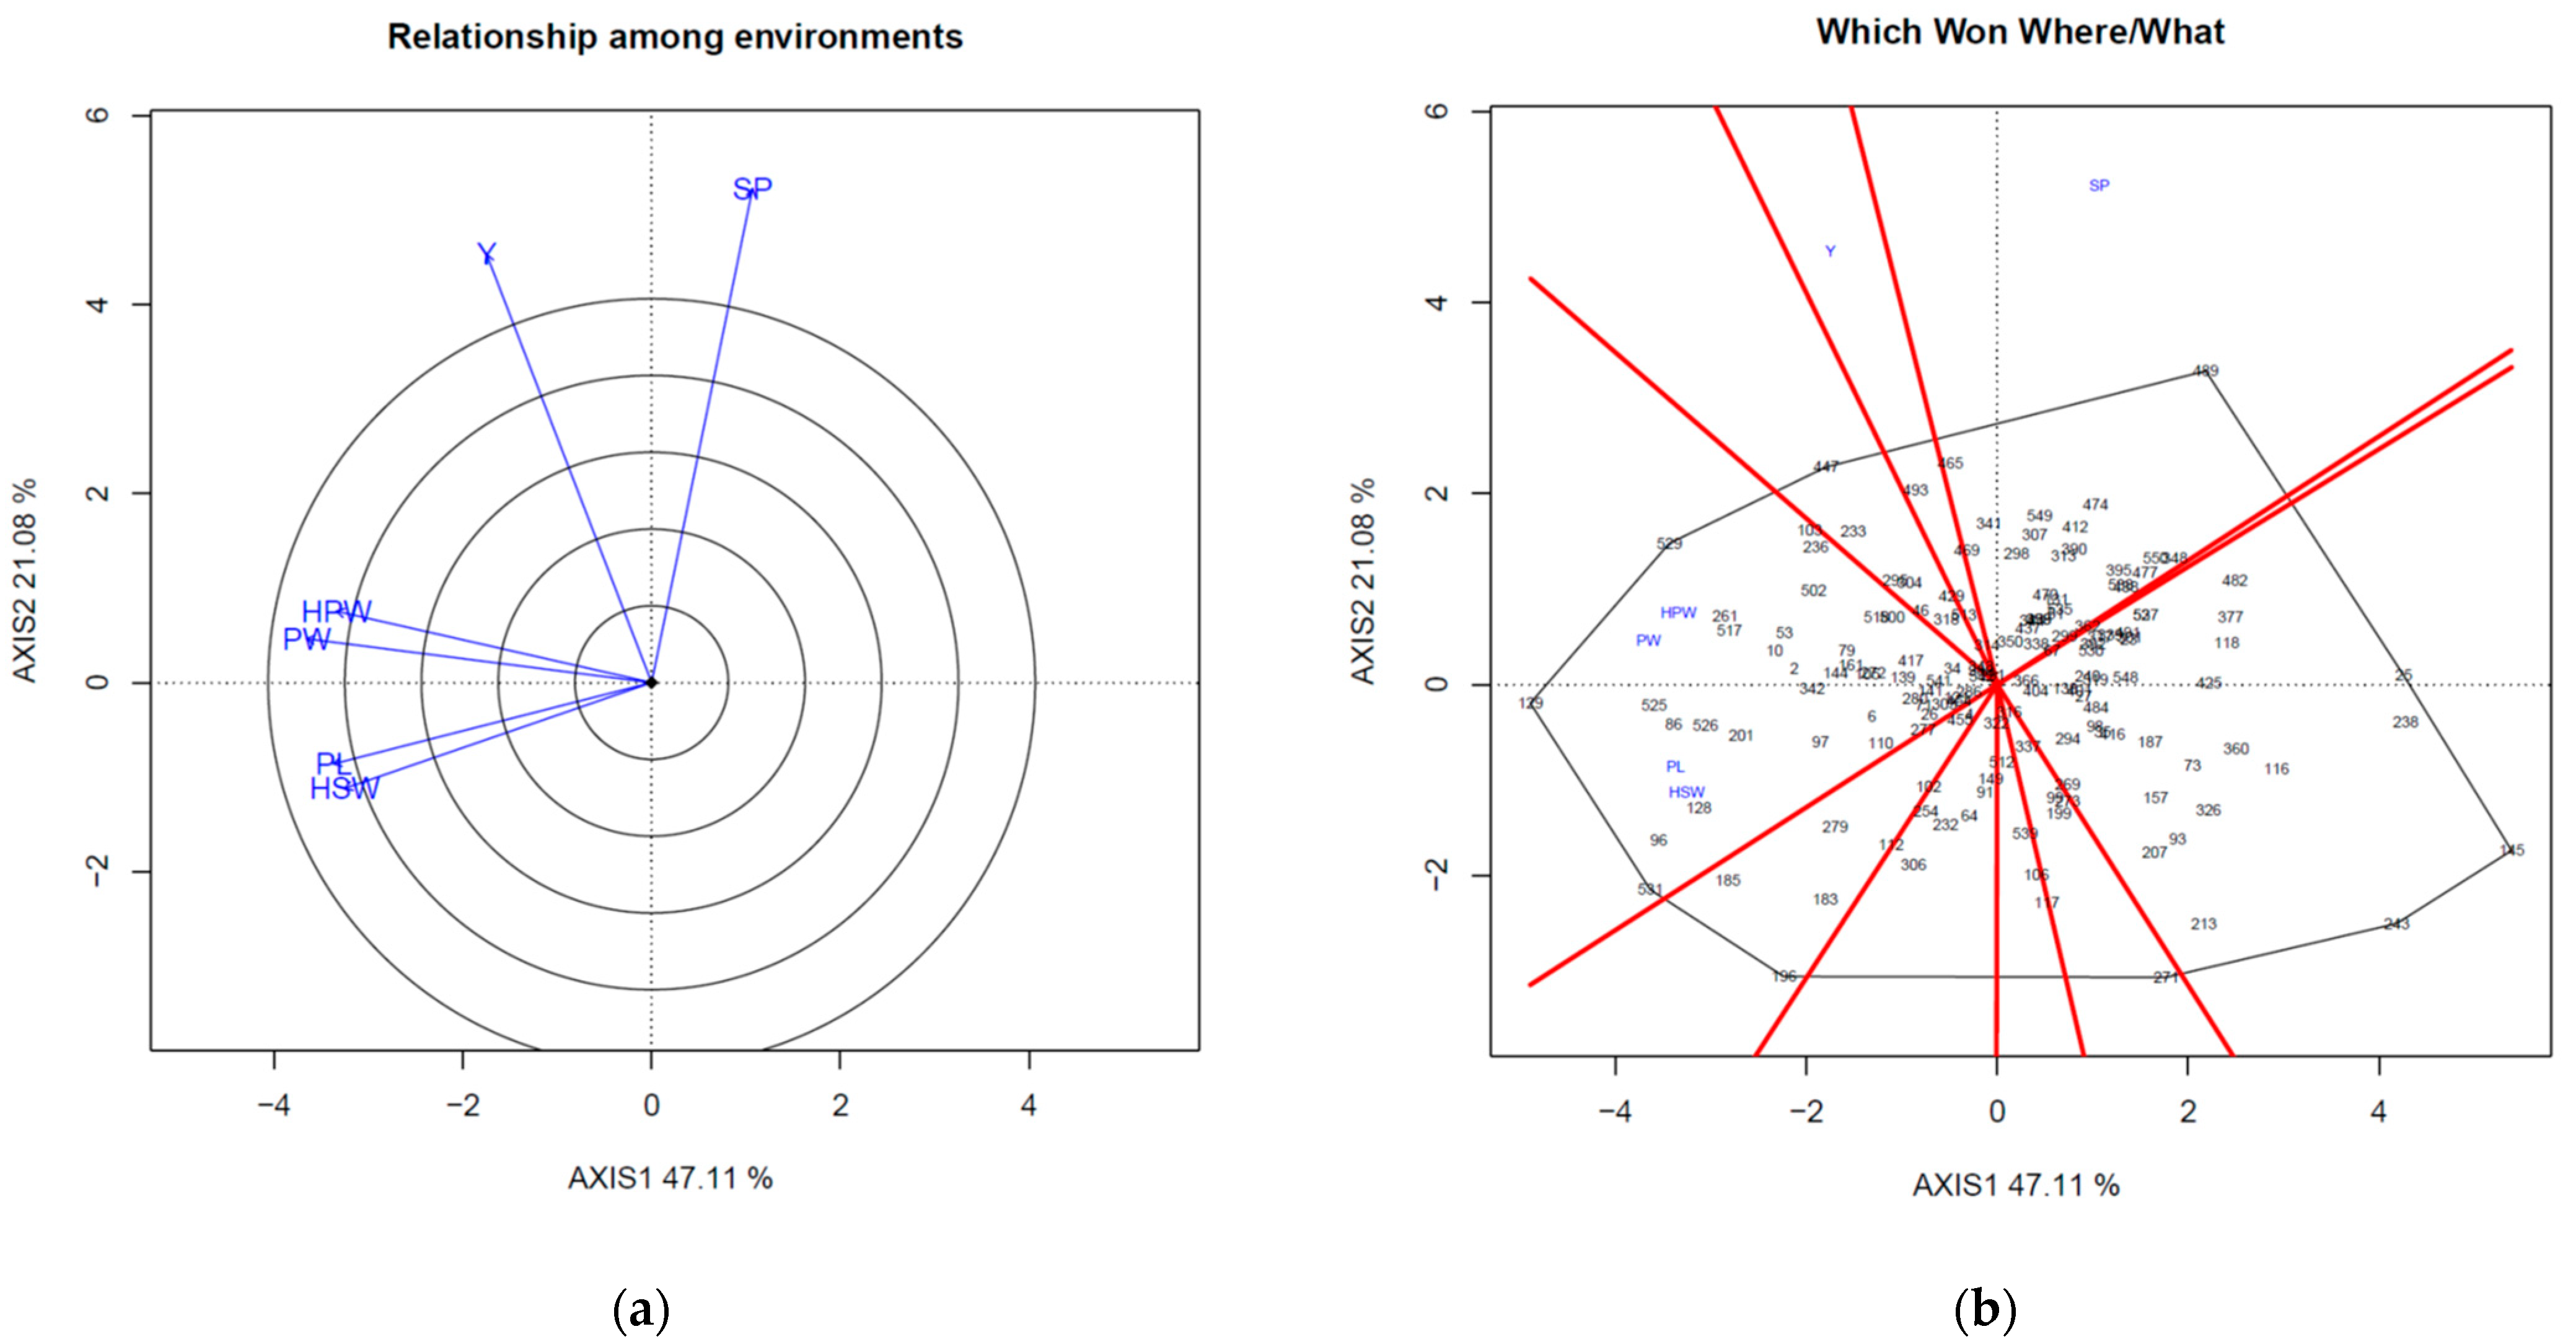
Figure 2 shows the GT biplots for all agronomic traits during the spring and fall seasons. The goodness of fit of the biplots were 68.19 and 78.82 in spring (
Figure 2a,b) and fall (
Figure 2c,d), respectively, and both values were good. The yield and shelling percentage were positively correlated (angle < 90°). In addition, pod width, pod length, 100-pod weight, and 100-seed weight were positively correlated; however, shelling percentage was negatively correlated with pod length and 100-seed weight in spring (
Figure 2a). The vector length indicates how well the trait is represented, and the yield and shelling percentage showed better representation in the biplot (
Figure 2a).
The angle between a genotype and trait indicates the relative level of the genotype for the trait. An angle smaller than 90° indicates that the genotype is above average for the trait. The which-won-where/what figure helps to define the relationship between trait and genotype. Accessions on the vertex of the sector under certain traits indicate the best genotype for that trait. In this case, accession 489 had the highest shelling percentage in spring (
Figure 2b). In the fall season, yield and shelling percentage still showed a positive correlation, and both were negatively correlated with days to flowering (
Figure 2c). Yield, 100-seed weight, and 100-pod weight were classified into the same sector in fall, and accession 525 had the best performance (
Figure 2d).
Cluster analysis was performed, and in both seasons, three groups were classified (
Figure S1). The three groups are labeled with different colors. A summary of the agronomic traits and disease ratings among the three groups is shown in
Table S4. In the fall season, the differences among groups were more significant than in spring. It is more effective to select larger diversity accessions based on the dendrogram in fall.
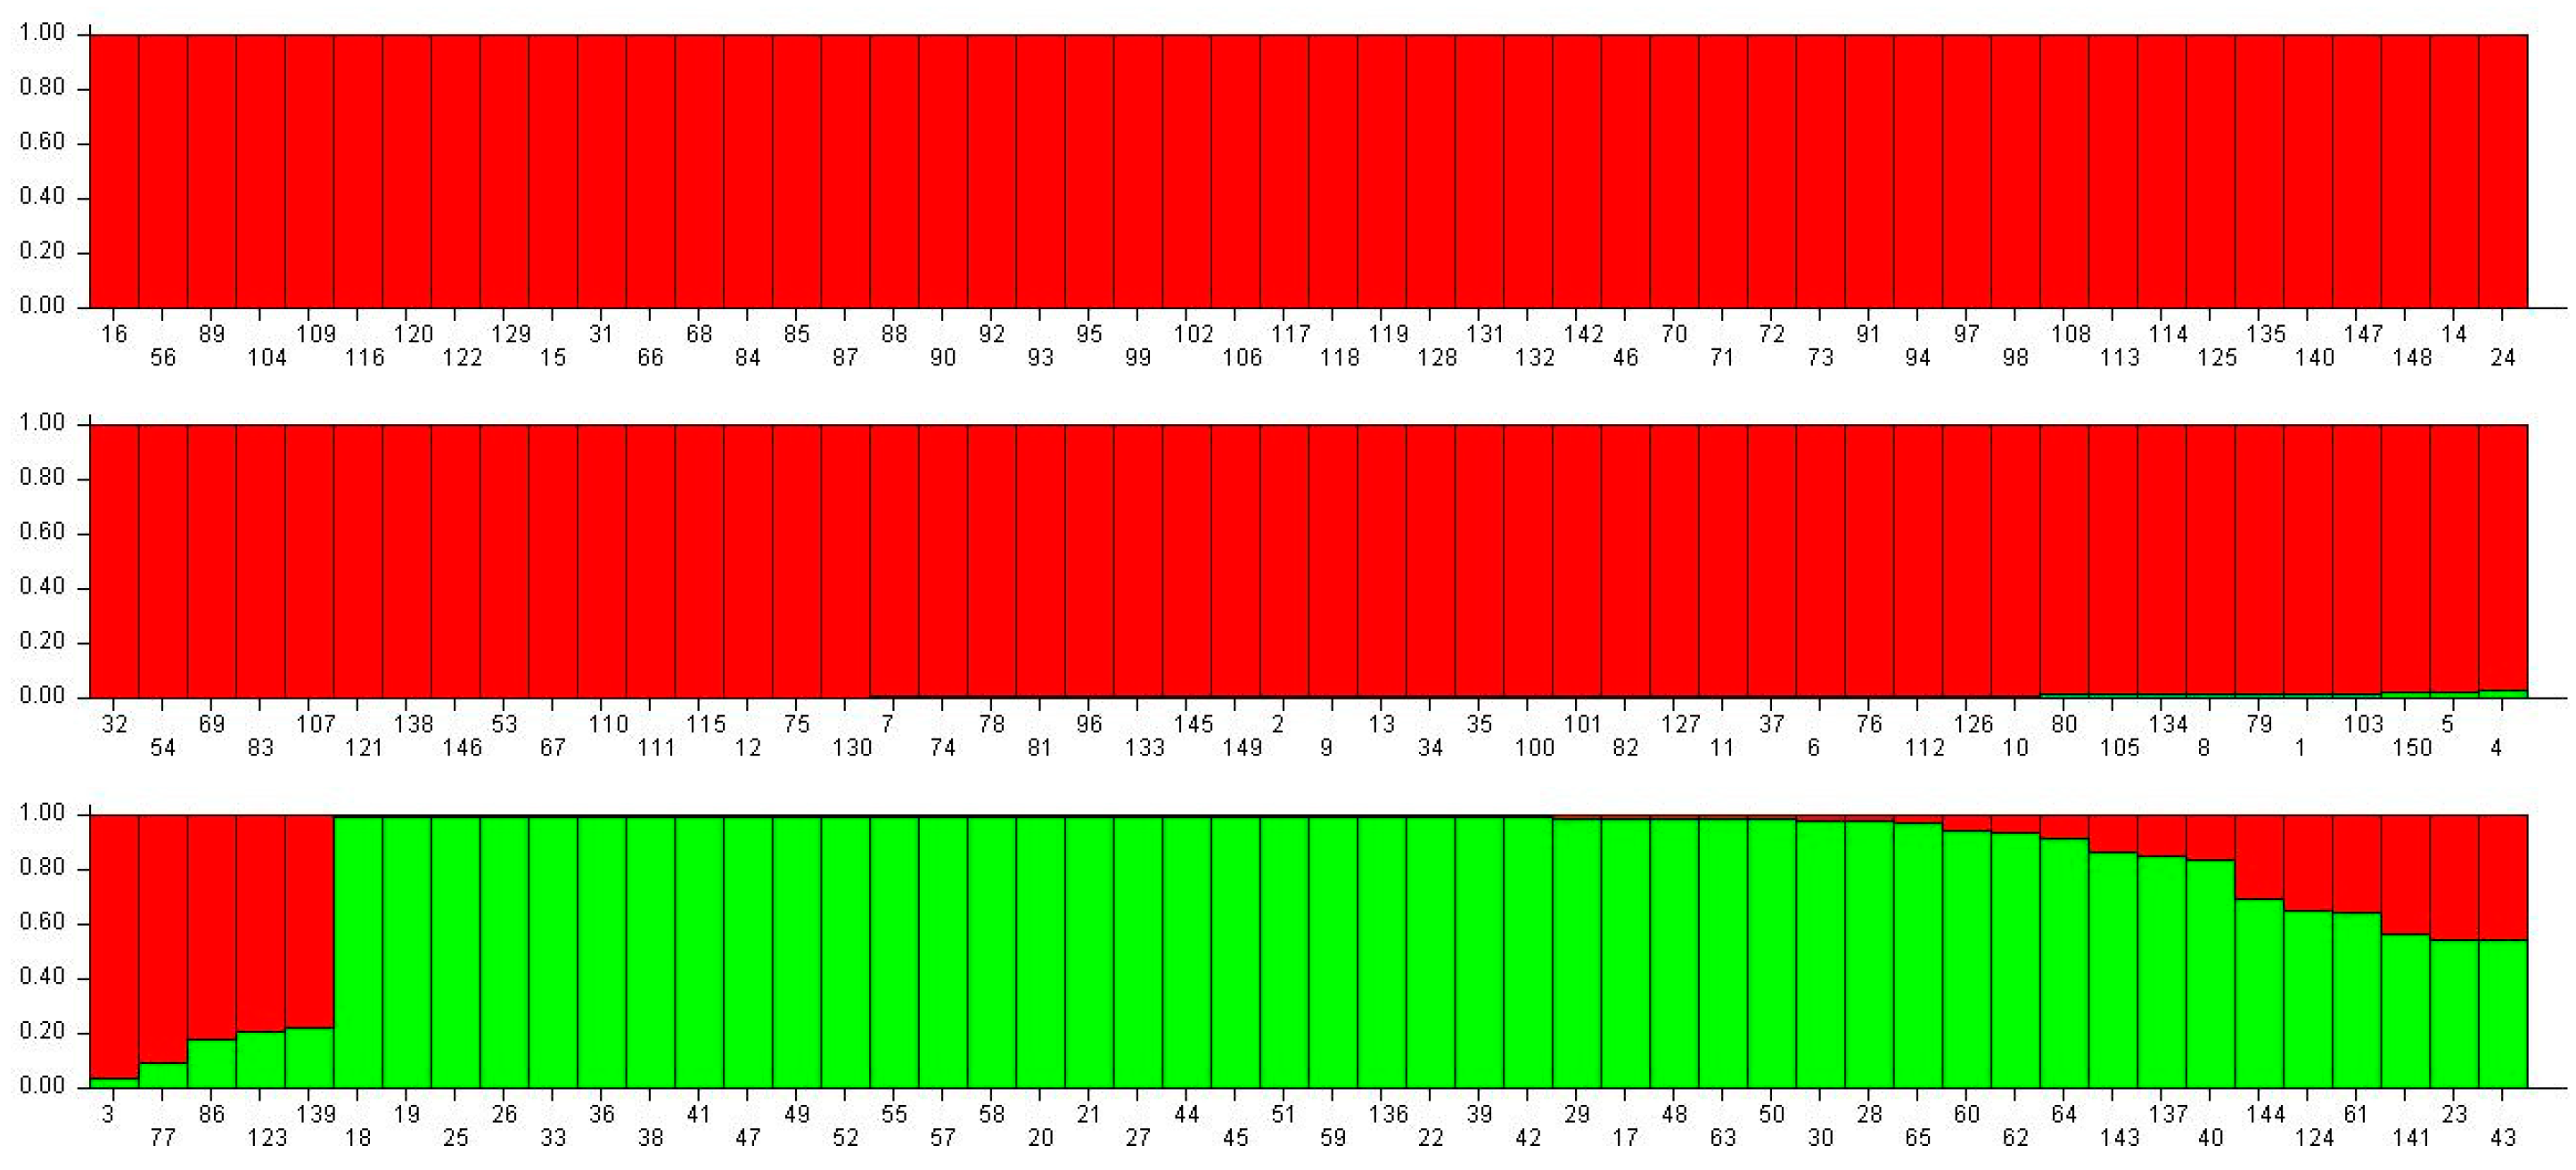
Using multi-locus genotype data (16 KASP markers and 21 SSR markers,
Tables S2 and S3), the population structure was investigated using Structure software. After calculation, the optimum K = 2 indicated that the best estimating subpopulation number is.
Group 1 (red color) contained 105 accessions, and 87.6% (92/105) belonged to the Spanish/Valencia type (
Figure 3). Group 2 (green color) contained 45 accessions, and 93.3% (43/45) were Runner/Virginia type (
Figure 3). Genotyping results fit the botanical taxonomy.
The rust resistance-related markers were screened on all accessions from the core collection. The genotyping results combined with rust phenotyping results and linear regression models were built, and the adjusted R-square values were estimated. These values can be used as indicators to illustrate the fitness between phenotypes and genotypes. Unfortunately, in spring, all the markers showed poor fitness with phenotyping results, and the PVE was very low in all cases. In fall, the fitness was improved and some markers (GM1954, GM2009, PM375, pPGPseq5D5, and pPGPseq8E12) showed medium PVE (50.3–68.7%) (
Table 6). Although all the markers were selected from the literature to ensure that they are related to rust resistance, the band patterns did not show reliable corresponding results on the germplasm to reflect the rust resistance in Taiwan’s environment.
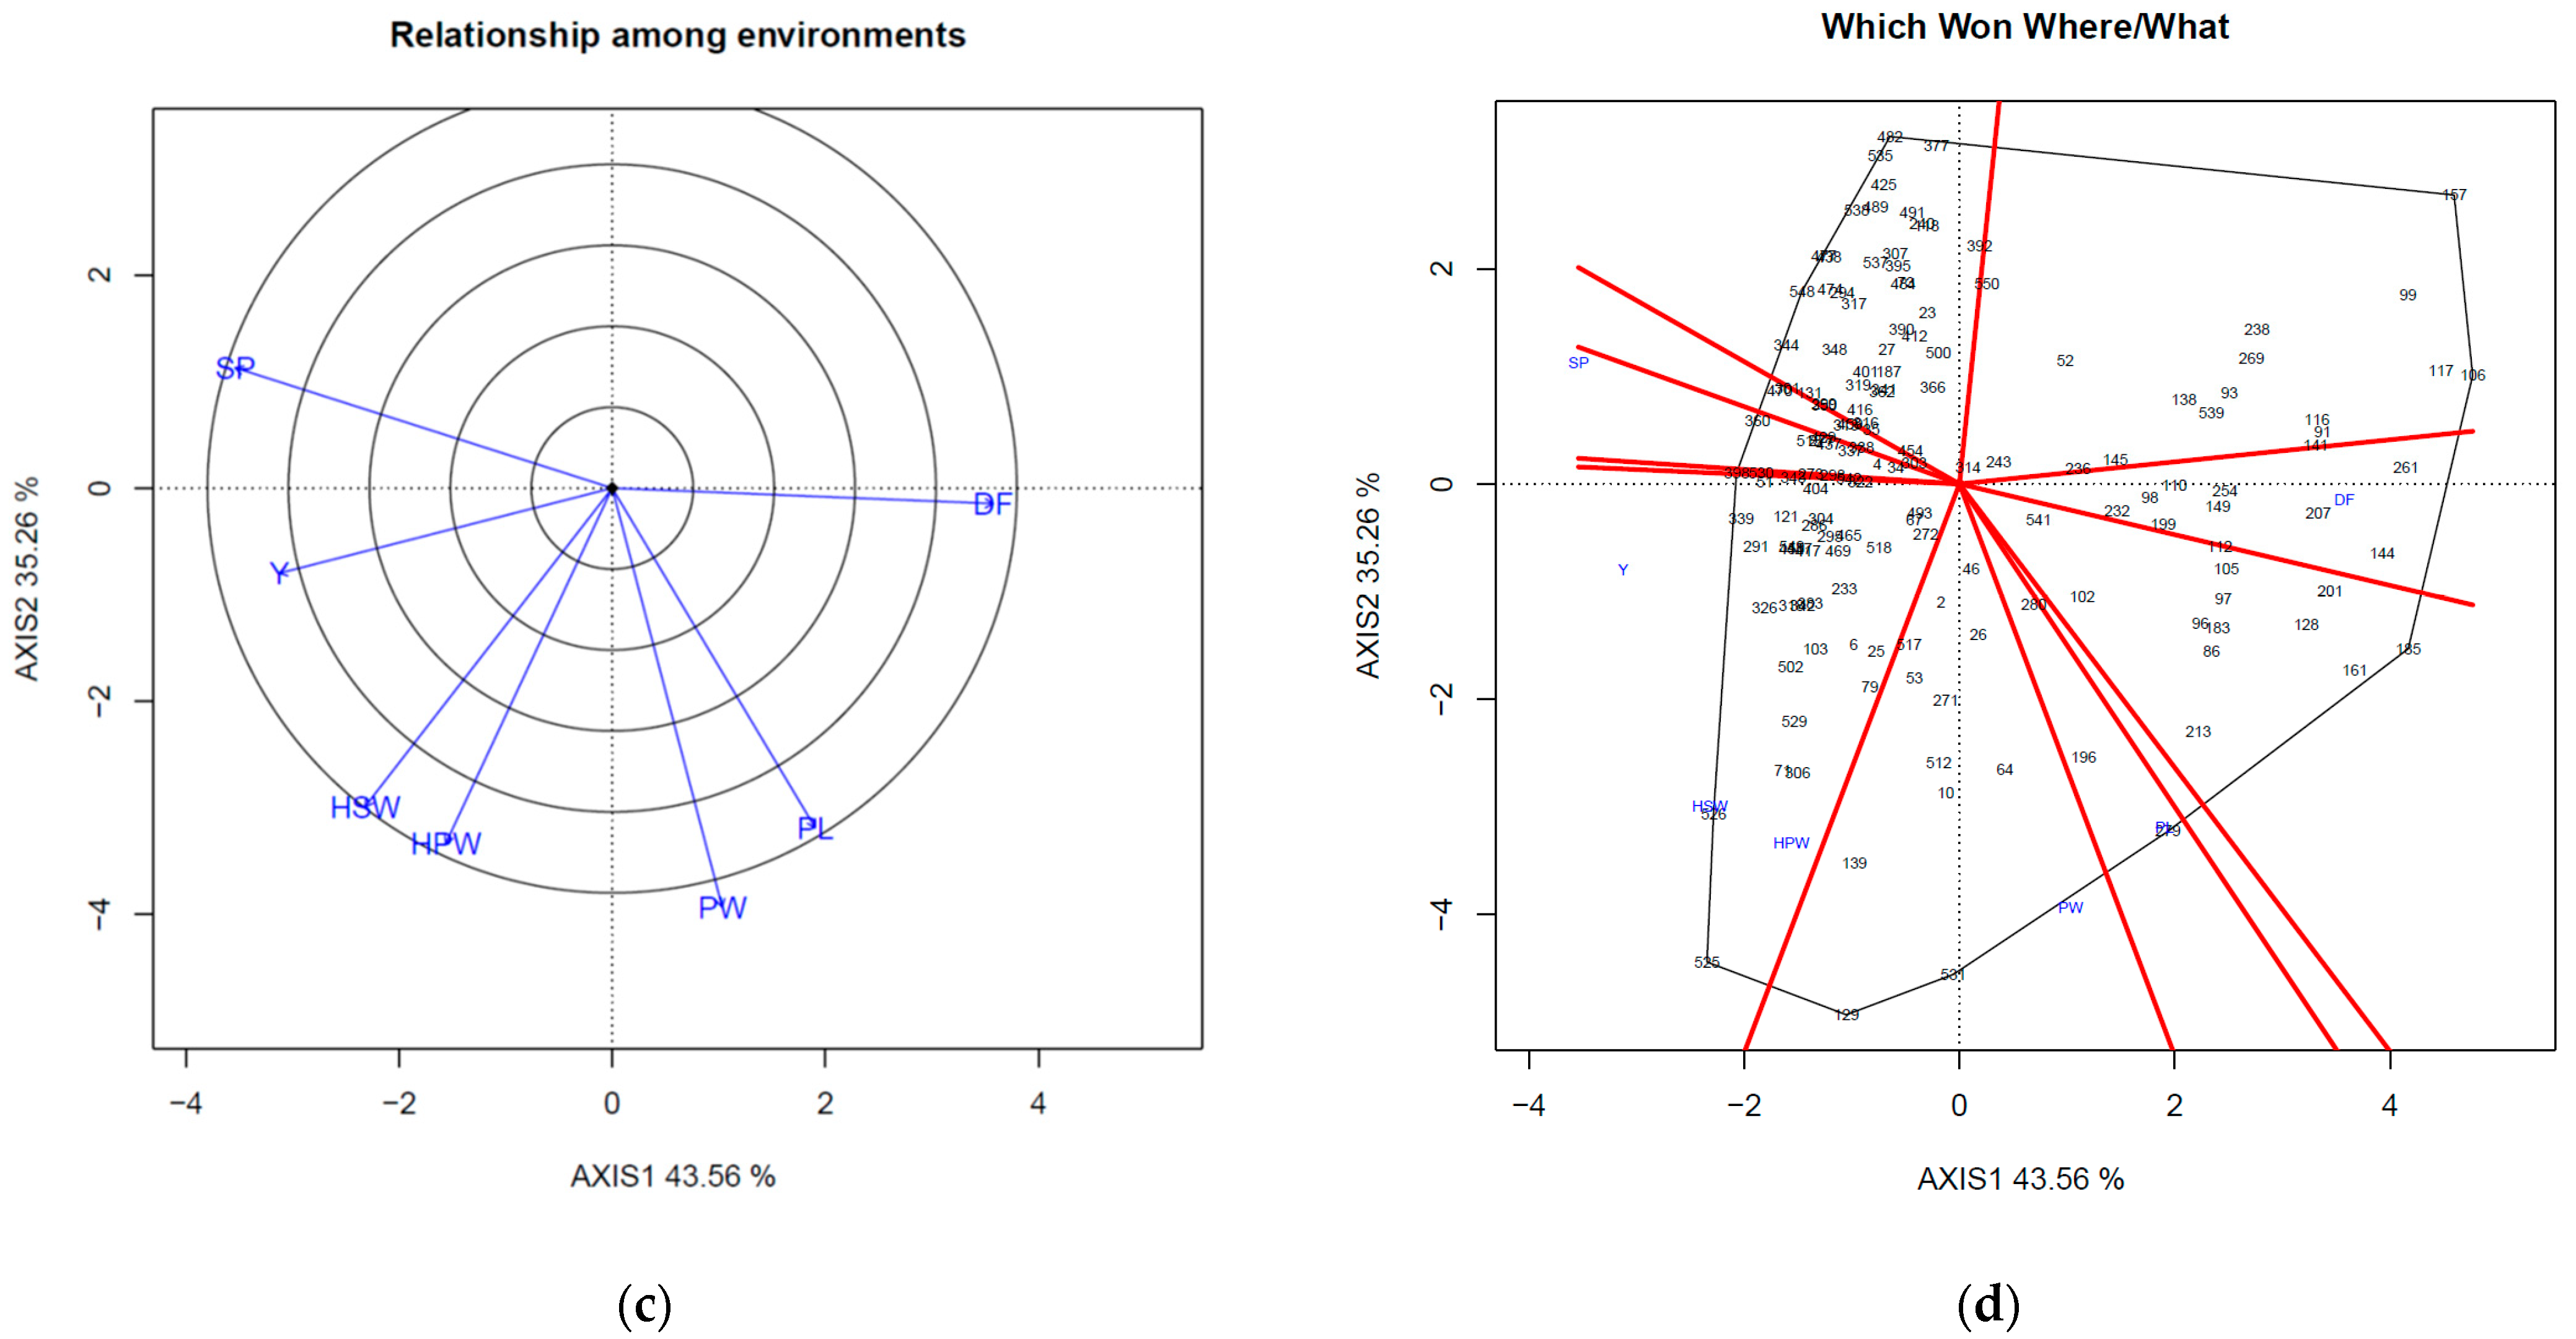
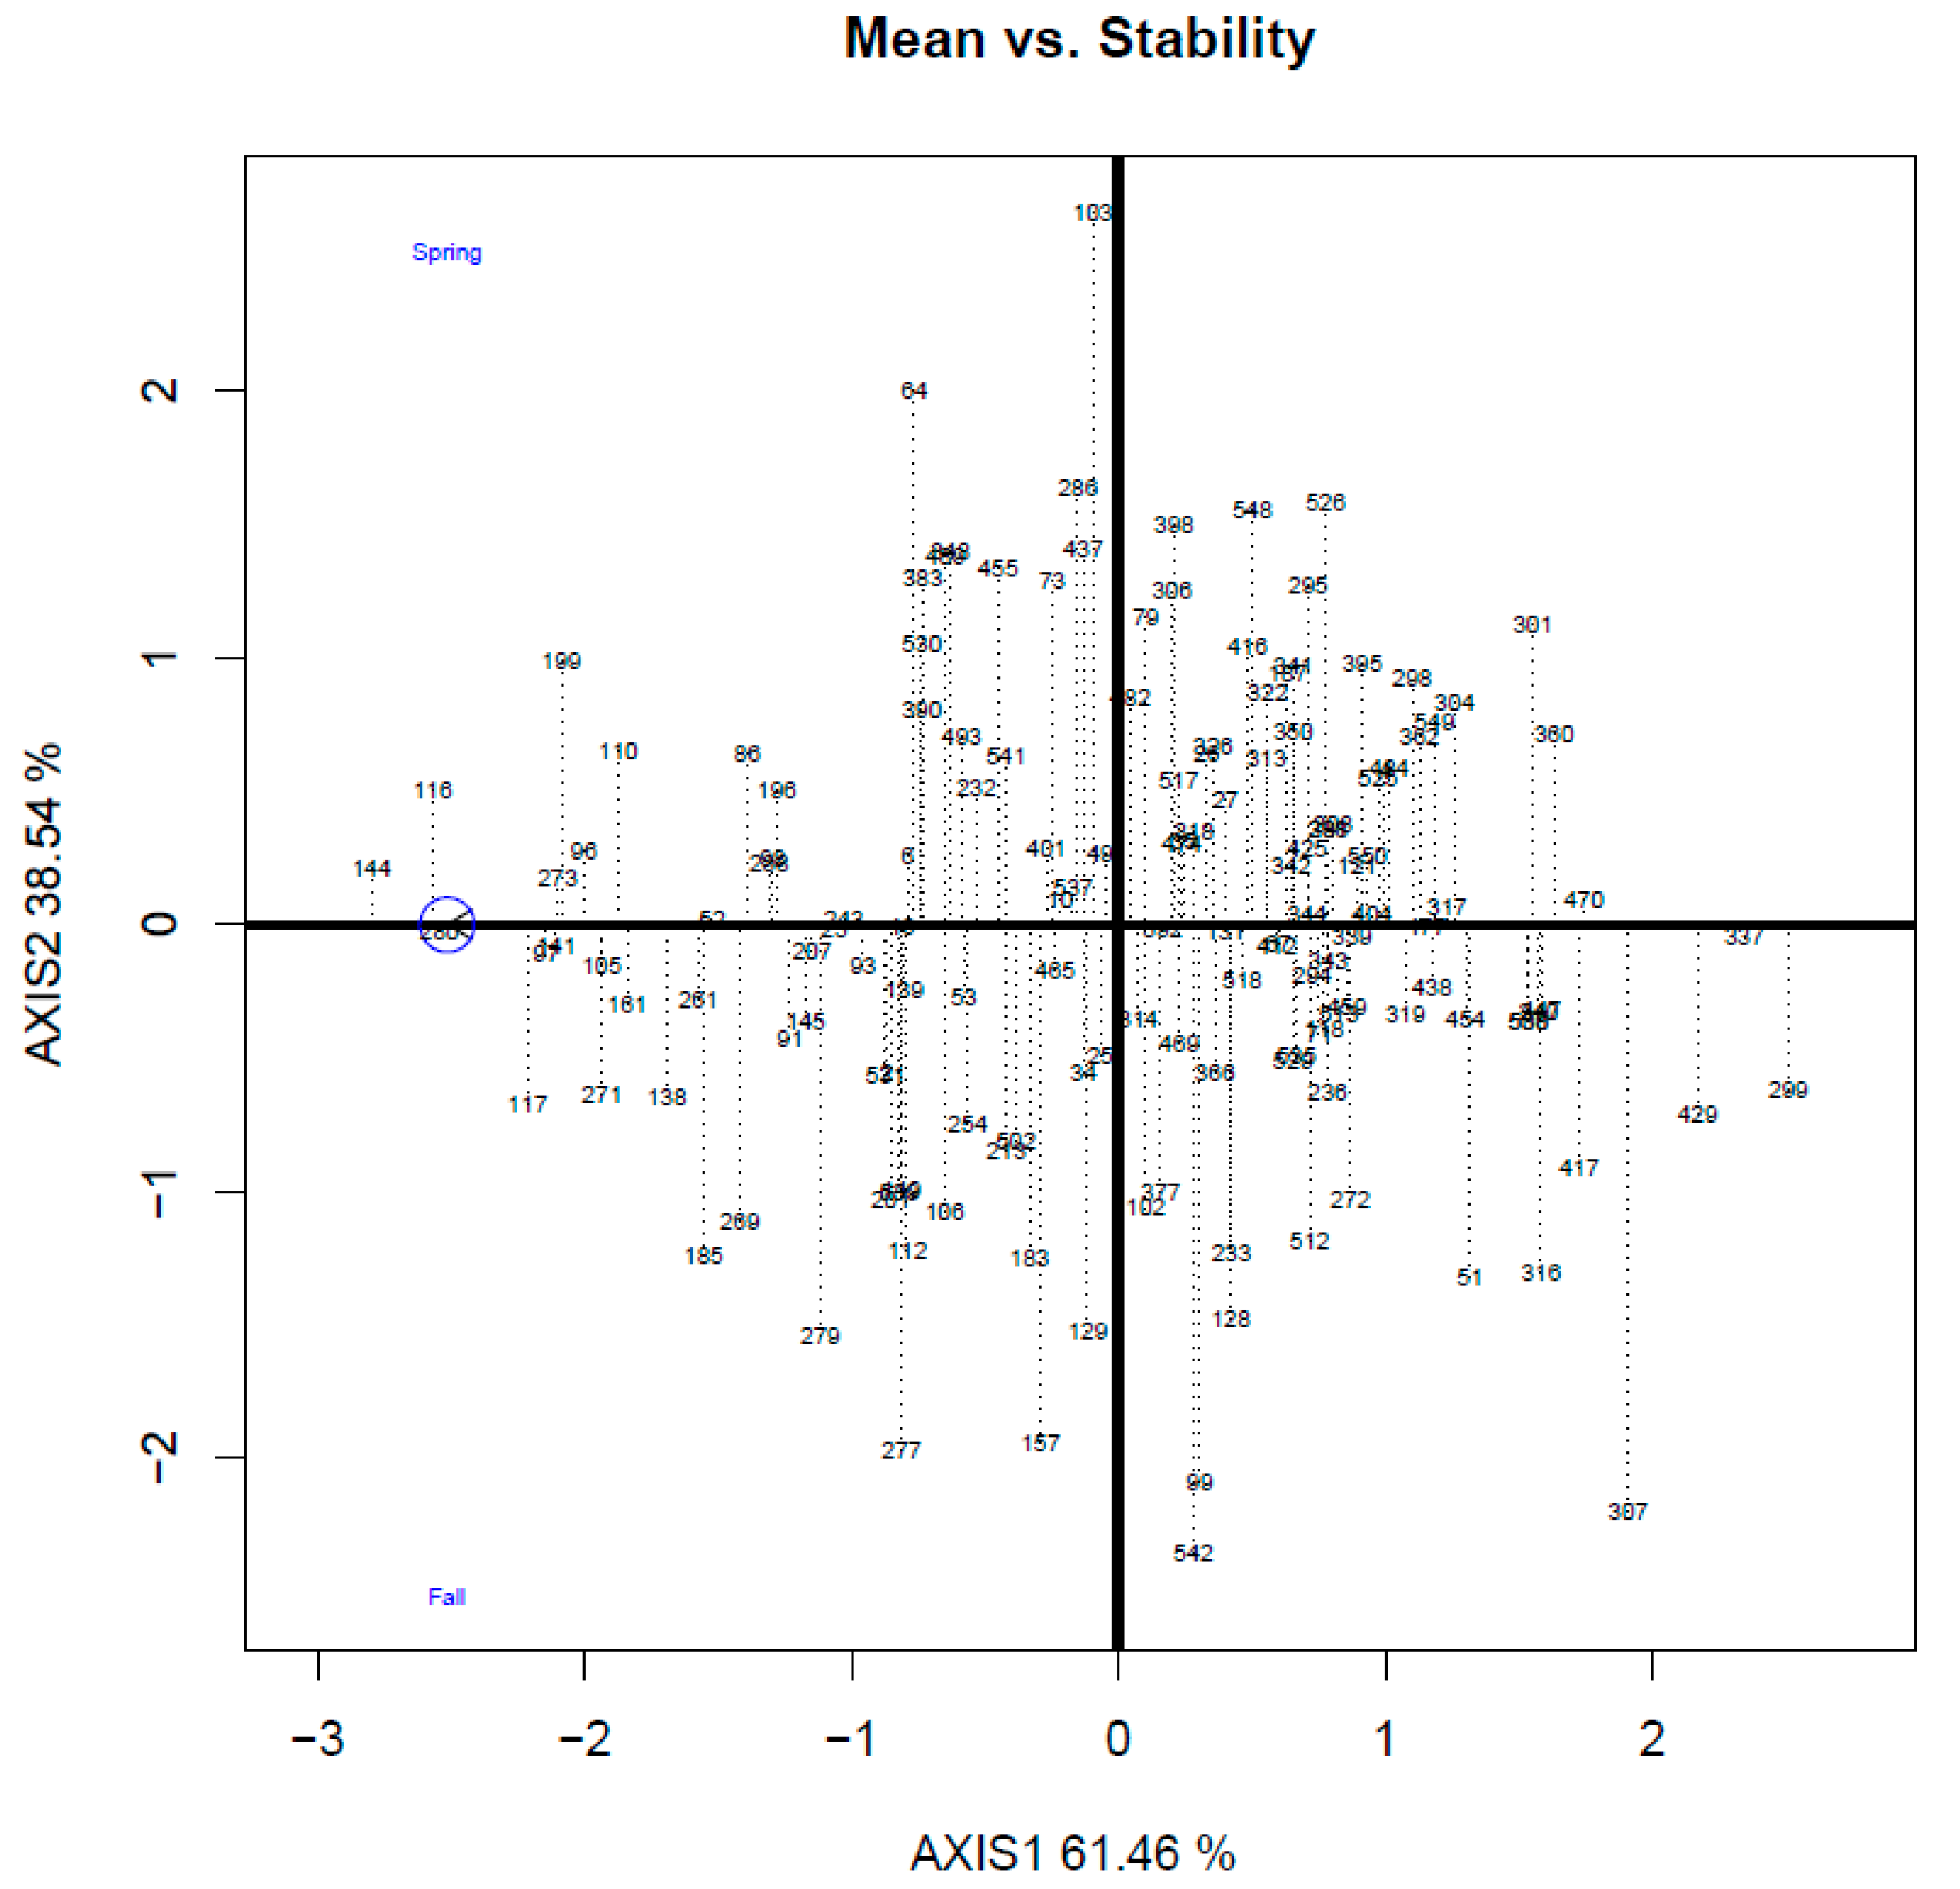
Rust resistance in all accessions was further analyzed using GT biplots in the two seasons (
Figure 4). The
y-axis represents the mean axis of rust resistance. The accessions in the arrow direction are the desirable genotypes with improved rust resistance. The
x-axis is the stability axis, and the accessions close to the
x-axis (shorter projection) indicate that they have highly stable phenotyping results in different seasons.
For each market type, the two best genotypes were selected and planted in the spring of 2020. Susceptible genotypes (two genotypes in each market type) and commercial cultivars were also planted as controls (
Table 7). After the field trial in spring 2020, four accessions were eliminated. The rest of four resistant accessions were selected and planted in fall 2020 and spring 2021 to evaluate the disease again. The following two seasons (2020 fall and 2021 spring) results indicate that CR116, CR144, CR271, and CR531 have stable and desirable rust resistances across different planting seasons and years. However, for the Valencia market type, there were no ideal accessions showing good rust resistance.
4. Discussion
Since Frankel (1984) [
9] proposed the concept of a core collection, a subset of the entire germplasm collection has become a useful tool for efficient utilization of germplasm resources. The sampling strategy is similar for various crops, such as corn, chickpea, peanut, quinoa, and perennial ryegrass. To represent the diversity of the whole germplasm, the selection parameters usually include the country of origin and morphological traits [
11,
12,
43,
44,
45,
46]. In this study, market type was chosen as the selection parameter, and stratified sampling was conducted. The peanut market types are classified mainly based on morphological traits, and according to botanical taxonomy, different market types belong to different subspecies.
According to our results, based on different selection intensities (33% intensity for the medium collection and 10% for the core collection), the agronomic trait performances (means and coefficients of variation) were similar to those of the entire collection (
Table 1) in 2000. The advanced analysis results (PCA and Shannon–Weaver diversity) in 2000 also supported the sampling strategy (
Table 2 and
Table 3). This indicates that random selection based on market type (stratified sampling) is a concise and efficient method to conduct such analysis. Charmet and Balfourier (1995) [
43] used four sampling strategies: random sampling and three other stratified cluster sampling methods based on agronomic traits, regions of origin, and agronomic traits with geographic contiguity constraints. The results showed that stratified sampling is always more efficient than random sampling. Several sampling strategies have been proposed; however, stratified random sampling has been recommended in different studies because it can ensure the conservation of common localized alleles [
10,
43,
47,
48]. Market type-based selection is a type of stratified sampling that is clustered with morphological and agronomic traits.
Compared to the 2000 data, almost all values increased in 2019 (
Table 1). Phenotype (P) is the result of the genotype (G) effect plus the environmental (E) effect (P = G + E). In some cases, management (M) is also considered a factor that is involved in phenotypic performance (P = G + E + M) [
49,
50]. The improved phenotype values of each trait could originate from the better crop management that is currently followed. Thus, germplasm potential can be achieved as evidenced by the better performance in 2019 than in 2000.
The two-season planting strategy is a common and well-developed cropping system in tropical and subtropical areas. Peanuts are mainly cultivated in these regions.
Figure S2 lists the two-season weather data during the peanut planting seasons in India, Nigeria, and Taiwan. The data show considerable weather differences between the two seasons. In some regions, such as India and Nigeria, the temperature remains stable; however, the rainfall is diverse and can be separated into dry and wet seasons.
In India, agronomic traits were evaluated in germplasms in two different seasons (rainy and post-rainy seasons), and most traits showed interactions between genotype and seasonal effects [
51]. In Taiwan, two-season weather conditions are even more complicated. In spring, both temperature and rainfall increase throughout the season; however, in fall, both temperature and rainfall decrease over time. The distinct weather pattern makes peanut breeding in Taiwan challenging.
The spring planting period (130 days) is usually longer than that in the fall (110 days) in Taiwan. The fall season planting period begins in July, which is also the typhoon season. If the weather delays the planting, it postpones the harvest time to December and limits the reproductive growth, mainly at the pod-filling stage. The growth degree day (GDD) is another common method to determine the optimum digging day [
52]; however, even when the GDD reaches the optimum values, the yields in fall are low, which could be due to the low solar irradiance in fall. The flowering day, pegging time, and yield are all related to GDD and solar irradiance. Yield and solar irradiance show a positive correlation [
53].
As shown in the PCA table and biplot (
Table 5 and
Figure 1), variable differences could be observed between the seasons. In spring, PC1 focused on pod- and seed-related traits; however, in fall, PC1 was related more to rust disease, yield, and shelling percentage. Although the PCA results are distinct for the two seasons, the PCA biplot in this study still showed the separation between the spp.
fastigiata and
hypogaea (
Figure 1). These results correspond to those of germplasm research in India [
13,
50]. In spp.
fastigiata, the flowering time is early, and this type of peanut requires less GDD to achieve maturity. In contrast, spp.
hypogaea is medium to late maturing and requires a longer planting period (
Table 4) [
54]. In Taiwan, spp.
fastigiata is more advantageous than spp.
hypogaea, because for the two-season cropping systems, the growth length is critical, and early maturing germplasm is more likely to avoid detrimental weather conditions. Flexibility also provides buffering for farmers to better deploy management strategies.
The main objectives of this study were to evaluate the core collection and select the accessions suitable for different seasons. The multiple genotypes and multiple agronomic traits made the evaluation difficult to conduct. The GT biplot method is an excellent tool to help achieve this goal [
55]. The GGE biplot is commonly performed when there are multiple locations to evaluate [
56] and the GT biplot is an alternative use of the GGE biplot [
57] when the ‘locations’ are replaced with ‘traits’. Many studies have shown the benefit of using a GT biplot [
58,
59,
60]. In the germplasm study, the relation plot and which-won-where/what plot of the GT biplots (
Figure 2) both provided important information in a concise format. Breeders can focus on certain traits and select the best accessions easily from the which-won-where/what plot, and simultaneously, understand the correlation (the cosine angle) among all the traits and how variable (vector length) these traits are. A positive correlation between pod width, pod length, 100-seed weight, and 100-pod weight has been reported [
61,
62,
63]. For the two-season cropping system, the stability plot of the GT biplot (
Figure 4) can help breeders to clarify the stability of certain traits in both seasons, such that they can efficiently select the accessions that are beneficial for the complicated environment under different weather conditions.
For the two-season cropping system, because the weather conditions are distinct, the disease-preferred seasons are also different. For example, in spring, stem rot and witches’ broom diseases were more severe than in fall (
Table 4); however, the rust disease showed a higher disease rating in fall. The disease-season interaction has to be considered for germplasm selection purposes. The disease triangle theory illustrates that the three essential factors for disease development are host, pathogen, and environment [
64]. Environmental factors can explain why there are seasonal differences in disease development.
In fall, rust was an important factor and was listed on PC1 variable (
Table 5). Rust disease in peanut is controlled by a few major QTLs and some minor QTLs with high heritability [
28]. Flor [
65,
66,
67] used flax (
Linum usitatissimum L.) and flax rust as experimental materials and proposed a gene-for-gene hypothesis to describe the plant–pathogen interaction. Rust fungi are host specific. The interaction between pathogen (presence or absence of avirulence (
Avr) genes) and host (presence or absence of the corresponding resistance (
R) genes) causes compatible or incompatible results.
CR273 (ICG(FDRS)-21) and CR542 (PI 314817) were classified as resistant accessions in previous studies [
37,
68]; however, in our study, they were susceptible to rust in both seasons. This can be explained using the gene-for-gene theory, which indicates that the common rust fungi physiological races in Taiwan might possess different avirulence genes. The pathogen-host interaction showed compatible association and ‘resistant’ lines showed susceptible phenotypes. Considering the disease triangle theory, the disease occurs because the ‘pathogen’ appears.
Based on the GT stability biplot (
Figure 4), the resistant accessions suitable for the two-season cropping system in Taiwan were selected and validated in the following three planting seasons (
Table 7). The resistance difference among market types was observed, and the spp.
hypogeae performed well. We illustrated the importance of retaining early maturity characteristics from the spp.
fastigiata in a two-season cropping system; however, the resistant allele comes from the spp.
hypogeae. When peanuts show resistance to foliar diseases, they also commonly provide low yield and late maturity performance [
28,
69]. The most resistant accession is often not the highest yield line, and the resistance might relate to late maturity [
70]. In Taiwan, to select the germplasm accessions from a breeding perspective, the strategy should be to retain the early maturity trait (spp.
fastigiata), but use traditional backcross methods or marker-assisted selection to help introgress the resistance allele derived from the spp.
hypogeae. The resistant accessions CR116, CR144, CR271, and CR531 (
Table 7) can be a useful source for providing the resistance allele, because they all showed very convincing resistance levels in the five seasons of evaluation.
Marker-assisted selection is a powerful tool in agriculture [
71], and several studies have used molecular markers to evaluate disease resistance in germplasms [
72,
73,
74,
75]. Thirty rust resistance-related markers [
3,
31,
32,
33,
34,
35,
36,
42] were utilized in this study to select the rust resistance accessions in Taiwan; however, the resistant marker band patterns did not correspond to resistance phenotypes. In the gene-for-gene theory, the band patterns of genotypes represent the
R gene, and the incompatible outcome indicates the change in
avr genes, which represent rust physiological races in Taiwan. Although the band pattern did not provide a 100% match to the phenotype results, there were three markers (GM1954, PM375, and pPGPseq8E12) with relatively high PVE values (58.6–68.7%) (
Table 6), and these markers can be combined as an indicator.


