Article

Spatial Distribution and Influencing Factors of Soil Fungi in a Degraded Alpine Meadow Invaded by Stellera chamaejasme

1
College of Urban and Environmental Sciences, Northwest University, Xi’an 710127, China
2
Shaanxi Key Laboratory of Earth Surface System and Environmental Carrying Capacity, Xi’an 710127, China
3
Geovis Technology Co., Ltd., Xi’an 710100, China
4
College of Life Sciences, Northwest University, Xi’an 710069, China
*
Author to whom correspondence should be addressed.
Submission received: 1 November 2021 / Revised: 8 December 2021 / Accepted: 13 December 2021 / Published: 16 December 2021
(This article belongs to the Special Issue Advanced Research of Rhizosphere Microbial Activity)

Abstract

:
Alpine meadow degradation causes a notable decrease in palatable grasses and an increase in forbs and toxic plants in recent decades. Stellera chamaejasme is one of the most serious toxic weeds, which exerts an increasing threat on alpine meadow in Qinghai–Tibetan Plateau. Combined DNA sequencing with geostatistics was applied to analyze a typical degraded meadow invaded by S. chamaejasme in Qinghai Province, China. The study aimed to determine the spatial variation of soil fungi and its interrelationship with the plant–soil environment. Alpha diversity and relative abundance of fungal phyla and classes showed moderate or strong spatial dependency and were structured in patches of 19–318 m, and taxonomic composition exhibited much higher spatial variability than alpha diversity. Compared to plant cover, the matching of patch size showed a closer spatial link between soil properties and fungal community. Community coverage, SOM, TN, TP, and TK positively correlated to fungal diversity and taxonomic composition; no direct correlation was found between S. chamaejasme coverage and fungal community. The result suggested significant but weak association between plant–soil properties and soil fungal community at local scale. Patchy pattern of S. chamaejasme may disturb spatial variations of soil properties and fungal community, since S. chamaejasme in higher coverage corresponded to lower TK content, which contributed to a decrease in fungal diversity indirectly.

1. Introduction

Soil microbes play key roles in the regulation of soil biogeochemical cycles [1]. Similar to plants and animals, soil microbes exhibit distinct heterogeneity at multiscales, which are not randomly but structurally distributed in space [2,3,4,5]. Studies on the spatial pattern of soil microbial communities provide important information on mechanisms for generating and maintaining microbial biodiversity [2,6]. Soil properties, plant cover, land management, and climate condition are highlighted as main factors influencing the distribution of soil microbial communities [3,4]. However, knowledge of spatial patterns and determinants of these communities is still limited, which restricts our understanding on the linkage between soil microbes, environment, and ecological processes across a wide range of scales [5,7].
Alpine meadow is the most representative ecosystem on the Qinghai–Tibetan Plateau (QTP), which suffers serious degradation due to climate change and human activity in recent decades. Studies on the microbe–environment relationship have been carried out in the region. Plant–plant interactions can mediate the partitioning of inorganic nitrogen between plants and soil microbes [8]; plant diversity has a predominant effect on soil fungal richness, along with C:N ratio, soil phosphorus, and dissolved organic carbon [9]. Warming changed the community structure of soil microbes significantly, and affected soil fungal and bacterial diversity to different extents [10,11,12]. Slope aspect can influence microbial composition by altering plant communities, soil properties, and environmental factors [13]. Some studies showed meadow degradation can affect soil microbes in multiple ways, including soil nutrient and moisture reduction, soil pH alteration, and soil surface erosion [14,15,16,17,18]. Higher bacterial richness is associated with lower potential soil multifunctionality along degradation gradients [19]. Severe degradation significantly shifted bacterial and fungal composition and increased community diversity in comparison with nondegraded meadow [20]. Further study revealed that soil moisture content, pH, and soil nutrients are the main factors influencing soil microbial community and functional structure during the process of degradation [21].
Previous studies focused on investigating the environmental determinants of soil microbes and responses of microbes to meadow degradation. Nevertheless, the spatial distribution of soil microbial community in degraded meadow is generally unknown, and the interrelationship among plant, soil, and microbes needs to be further identified. In recent years, spatial approaches that integrate GIS technologies have been applied to research related to soil microbes. These methods allow for the accurate connection of field-measured microbial information with environmental parameters, and enable us to better understand the factors that drive the spatial pattern of soil microbes [3,4,22].
Changes in plant community composition were associated with the process of meadow degradation, notably a decrease in palatable grasses and a corresponding increase in forbs and toxic plants [23]. Stellera chamaejasme (Thymelaeaceae family), a toxic perennial weed, has progressively replaced native Kobresia and Poa species and dominates in the degraded meadows [24]. S. chamaejasme spread rapidly on the QTP and brought increasingly severe impacts on the alpine ecosystem, serving as an indicator of grassland degradation. Therefore, an investigation was conducted by intensive and systematic sampling in a typical S. chamaejasme-invaded meadow in the study. Using DNA sequencing and geostatistics, our primary objectives were (1) to characterize the spatial variation of soil fungi and disentangle its spatial linkage with plant–soil parameters, and (2) to determine which parameters drive the distribution of soil fungi at local scale and evaluate the potential impact of S. chamaejasme on the distribution. The work may help us to decipher soil microbial biogeography in degraded grassland at small scale, and provide valuable implications in management, restoration, and development of degraded meadows.

2. Materials and Methods

2.1. Study Site

The study was carried out in Qilian County, Haibei Tibetan Autonomous Prefecture, Qinghai Province. The region is characterized by low hills and flat valleys with an average altitude of about 3000 m. It is characterized by a typical plateau climate with an annual average precipitation of 411.7 mm, concentrating from May to September. The annual average temperature is 1 °C with a mean temperature of −11.7 °C in January and 14.2 °C in July. Alpine meadow is the main vegetation type in the region, and is used as winter pasture by local herdsmen yearly, from December to May. Due to overgrazing in the last few decades, S. chamaejasme has spread to many towns of Qilian County, including Ebao, Mole, Arou, and Yeniugou. The sampling site is situated in Baishiya Village of Ebao Town (38°02′32.54″ N, 100°32′2.97″ E), with an average altitude of 3070 m and an average slope of 6.7°. S. chamaejasme is densely distributed in clumped patches; other common species include Kobresia myosuroides, Poa annua, Potentilla multifida, Medicago ruthenica, Elymus nutans and Agropyron cristatum, etc. The soil type is Mat Cry-gelic Cambisols, composed of 19% clay, 64.7% silt, and 16.3% sand.

2.2. Soil Sampling and Processing

Topsoil samples were collected during the blooming stage of S. chamaejasme in mid- July. Fifty quadrats (1 m × 1 m) were placed in an area of 23,000 m2 on a grid of approximately 22 m × 22 m. A digital photograph was taken vertically over each quadrat and bulk soil samples were acquired using the soil-drilling method. Soil samples were kept at 4 °C in cool boxes and transported to the laboratory. Subsamples were used for measurement of soil physicochemical properties, including water moisture, organic matter, and total content of nitrogen, phosphorus, and potassium. Subsamples were frozen at −80 °C for DNA extraction. Community coverage (CC) and S. chamaejasme coverage (SC) were estimated for each quadrat by photographic interpretation. Soil moisture (SM) samples were oven-dried at 105 °C for 12 h; soil moisture was calculated gravimetrically. Soil nutrient samples were air-dried and sieved by a 0.15 mm grid for further chemical analysis. Soil organic matter (SOM) was measured by the potassium dichromate heating oxidation–volumetric method, total nitrogen (TN) by Kjeldahl method, total phosphorus (TP) by NaOH fusion and Mo–Sb colorimetry, and total potassium (TK) by NaOH fusion and flame photometry [25].

2.3. DNA Extraction and Sequencing Analysis

Soil DNA was extracted from each soil sample of 250 mg using the MOBIO Power Soil DNA kit (Qiagen, Hilden, Germany). The internal transcribed spacer (ITS1) of the ribosomal RNA (rRNA) gene was amplified with the primers ITS1F and ITS2R. The PCR reaction mixture contained 2.5 µL of 10 × PCR buffer, 1 µL of 10 mmol L−1 dNTP, 1 µL each of 10 µmol L−1 forward and reverse primers, 2 µL of 50 ng µL−1 soil DNA template, 0.4 µL of 5 U µL−1 TaqDNA polymerase, and 17.1 µL of ddH2O. PCR conditions were as follows: 95 °C, 5 min; 95 °C, 30 s; 50 °C, 30 s; 72 °C, 40 s; and 72 °C, 7 min. PCR products were purified using MoBio UltraClean PCR Clean-Up Kit (Qiagen).
DNA sequencing was performed on an Illumina HiSeq 2500 platform (Illumina, San Diego, CA, USA). Raw gene sequences were assembled and quality-filtered, then chimeras were identified and removed. The resulting high-quality sequences were clustered into operation taxonomy units (OTUs) at sequence similarity of 97%. The representative sequences for OTUs were assigned to fungal taxonomic affiliations by RDP (Ribosomal Database Project) naïve Bayesian classifier [26], searching against the UNITE database [27].

2.4. Ecological and Statistical Analysis

Alpha diversity of the soil fungal community was analyzed. Margalef index (richness), Pielou index (evenness), and Shannon–Wiener index for each sample were calculated using OTUs data based on a Python script.
All data including alpha diversity index, relative abundance of fungal taxonomic composition, plant cover, and soil properties for the soil samples were tested for normality by the one-sample Kolmogorov–Smirnov (K–S) test (p > 0.05), then corresponding transformations were applied to ensure the variables not passing the test to follow normal distribution. To explore the effect of environmental factors on soil fungal communities, the Mantel test in the R package was used and significance testing was undertaken by 999 Monte Carlo permutations.

2.5. Geostatistics and Interpolation Mapping

Semivariograms were used to examine the spatial structure of soil, plant, and fungi variables. The average semivariance γ(h) is calculated according to:
γ ( h ) = 1 2 N ( h ) i = 1 n [ z ( x i ) z ( x i + h ) ] 2
where h is the lag distance between points x i and x i + h ; z ( x i ) and z ( x i + h ) are measured values at x i and x i + h ; and N(h) is the number of data pairs separated by the lag h. The empirical semivariograms are fitted by mathematical models to produce geostatistical parameters; common models mainly include: spherical, exponential, Gaussian, and linear.
Using the parameters defined by semivariograms, Kriging interpolation was applied to estimate and map all variables in the study. The equation follows:
z ^ ( x 0 ) = i = 1 n λ i z ( x i )
where z ^ ( x 0 ) is the estimated value at the unsampled site x 0 ; z ( x i ) is the measured value at the sampling site x i ; λ i is the weight associated with the site x i , samples closer to the unsampled point have greater impacts and higher weights; and n is the number of points used in estimation.
The best semivariogram models for all variables were fitted using Environmental Science (GS+) software. Using the geostatistical parameters produced and based on ArcGIS software, Ordinary Kriging was then performed to map the distribution of the variables across the sampling site.

3. Results

3.1. Plant Cover, Soil Property, and Soil Fungal Characteristics

3.1.1. Plant Cover and Soil Property

High plant community coverage was observed at the sampling site with a mean value of 87.37 %, and S. chamaejasme was distributed in dense patches with an average coverage 20.33 %. The soil is rich in SOM, TN, and TK, with mean values of 40.20, 2.16, and 20.07 g.kg−1, but poor in TP with a mean value of 0.59 g.kg−1. Coefficient of variation (CV) was used to evaluate data dispersion; data can be considered weak, moderate, and strong dispersion with the CV < 0.1, 0.1–1, and > 1, respectively [28]. According to CV values, community coverage was weakly dispersed and S. chamaejasme coverage was moderately dispersed; the distribution of S. chamaejasme showed much higher variation than that of the total community. CV values of SOM, TN, and TP were greater than 0.1, but CV values of TK and SM were less than 0.09, indicating different degrees of soil property variability (Table 1).

3.1.2. Soil Fungal Characteristics

Using DNA metabarcoding, 17,799–279,702 sequences were obtained from the 50 samples with a mean of 62,554 sequences. The sequence length ranged from 259 to 313 bp with a mean of 289 bp. After clustering at 97% sequence similarity, there were 12,033 OTUs in all samples, ranging from 86 to 380 with a mean of 262 OTUs per sample. The rarefaction curves confirmed that the sequencing depth sufficiently represented fungal diversity in each sample. Among the identified fungal phyla, Ascomycota dominated the overall fungal community and accounted for 61.2% of the sequences, followed by Basidiomycota (11.9%) and Zygomycota (11.7%). The rare phyla, including Chytridiomycota, Glomeromycota, and Rozellomycota, accumulated to less than 0.35% of the sequences. At the class level, Dothideomycetes (13.7%) and Sordariomycetes (11.3%) were the most abundant, followed by Leotiomycetes (7.6%), Agaricomycetes (6.6%), and Archaeorhizomycetes (6.4%). Although relative abundance of Eurotiomycetes, Pezizomycetes, Tremellomycetes, and Wallemiomycetes was below 3%, these classes were detected in most soil samples. The dominant phyla and classes identified were consistent with previous investigations conducted in alpine meadows on Tibetan Plateau [1,12,14,29].
Statistics of fungal alpha diversity and relative abundance of taxonomic composition are summarized in Table 2. CV values of alpha diversity indices ranged from 0.152 to 0.25, indicating moderate variation. CV values of relative abundance of fungal phyla and classes ranged from 0.245 to 4.255, indicating moderate and strong variation, among which CV values of the phyla of Chytridiomycota and Rozellomycota and the class of Pezizomycetes were the highest, reaching 3.717, 3.831, and 4.255, respectively. In general, relative abundance of taxonomic composition showed much higher variation than alpha diversity across the site.

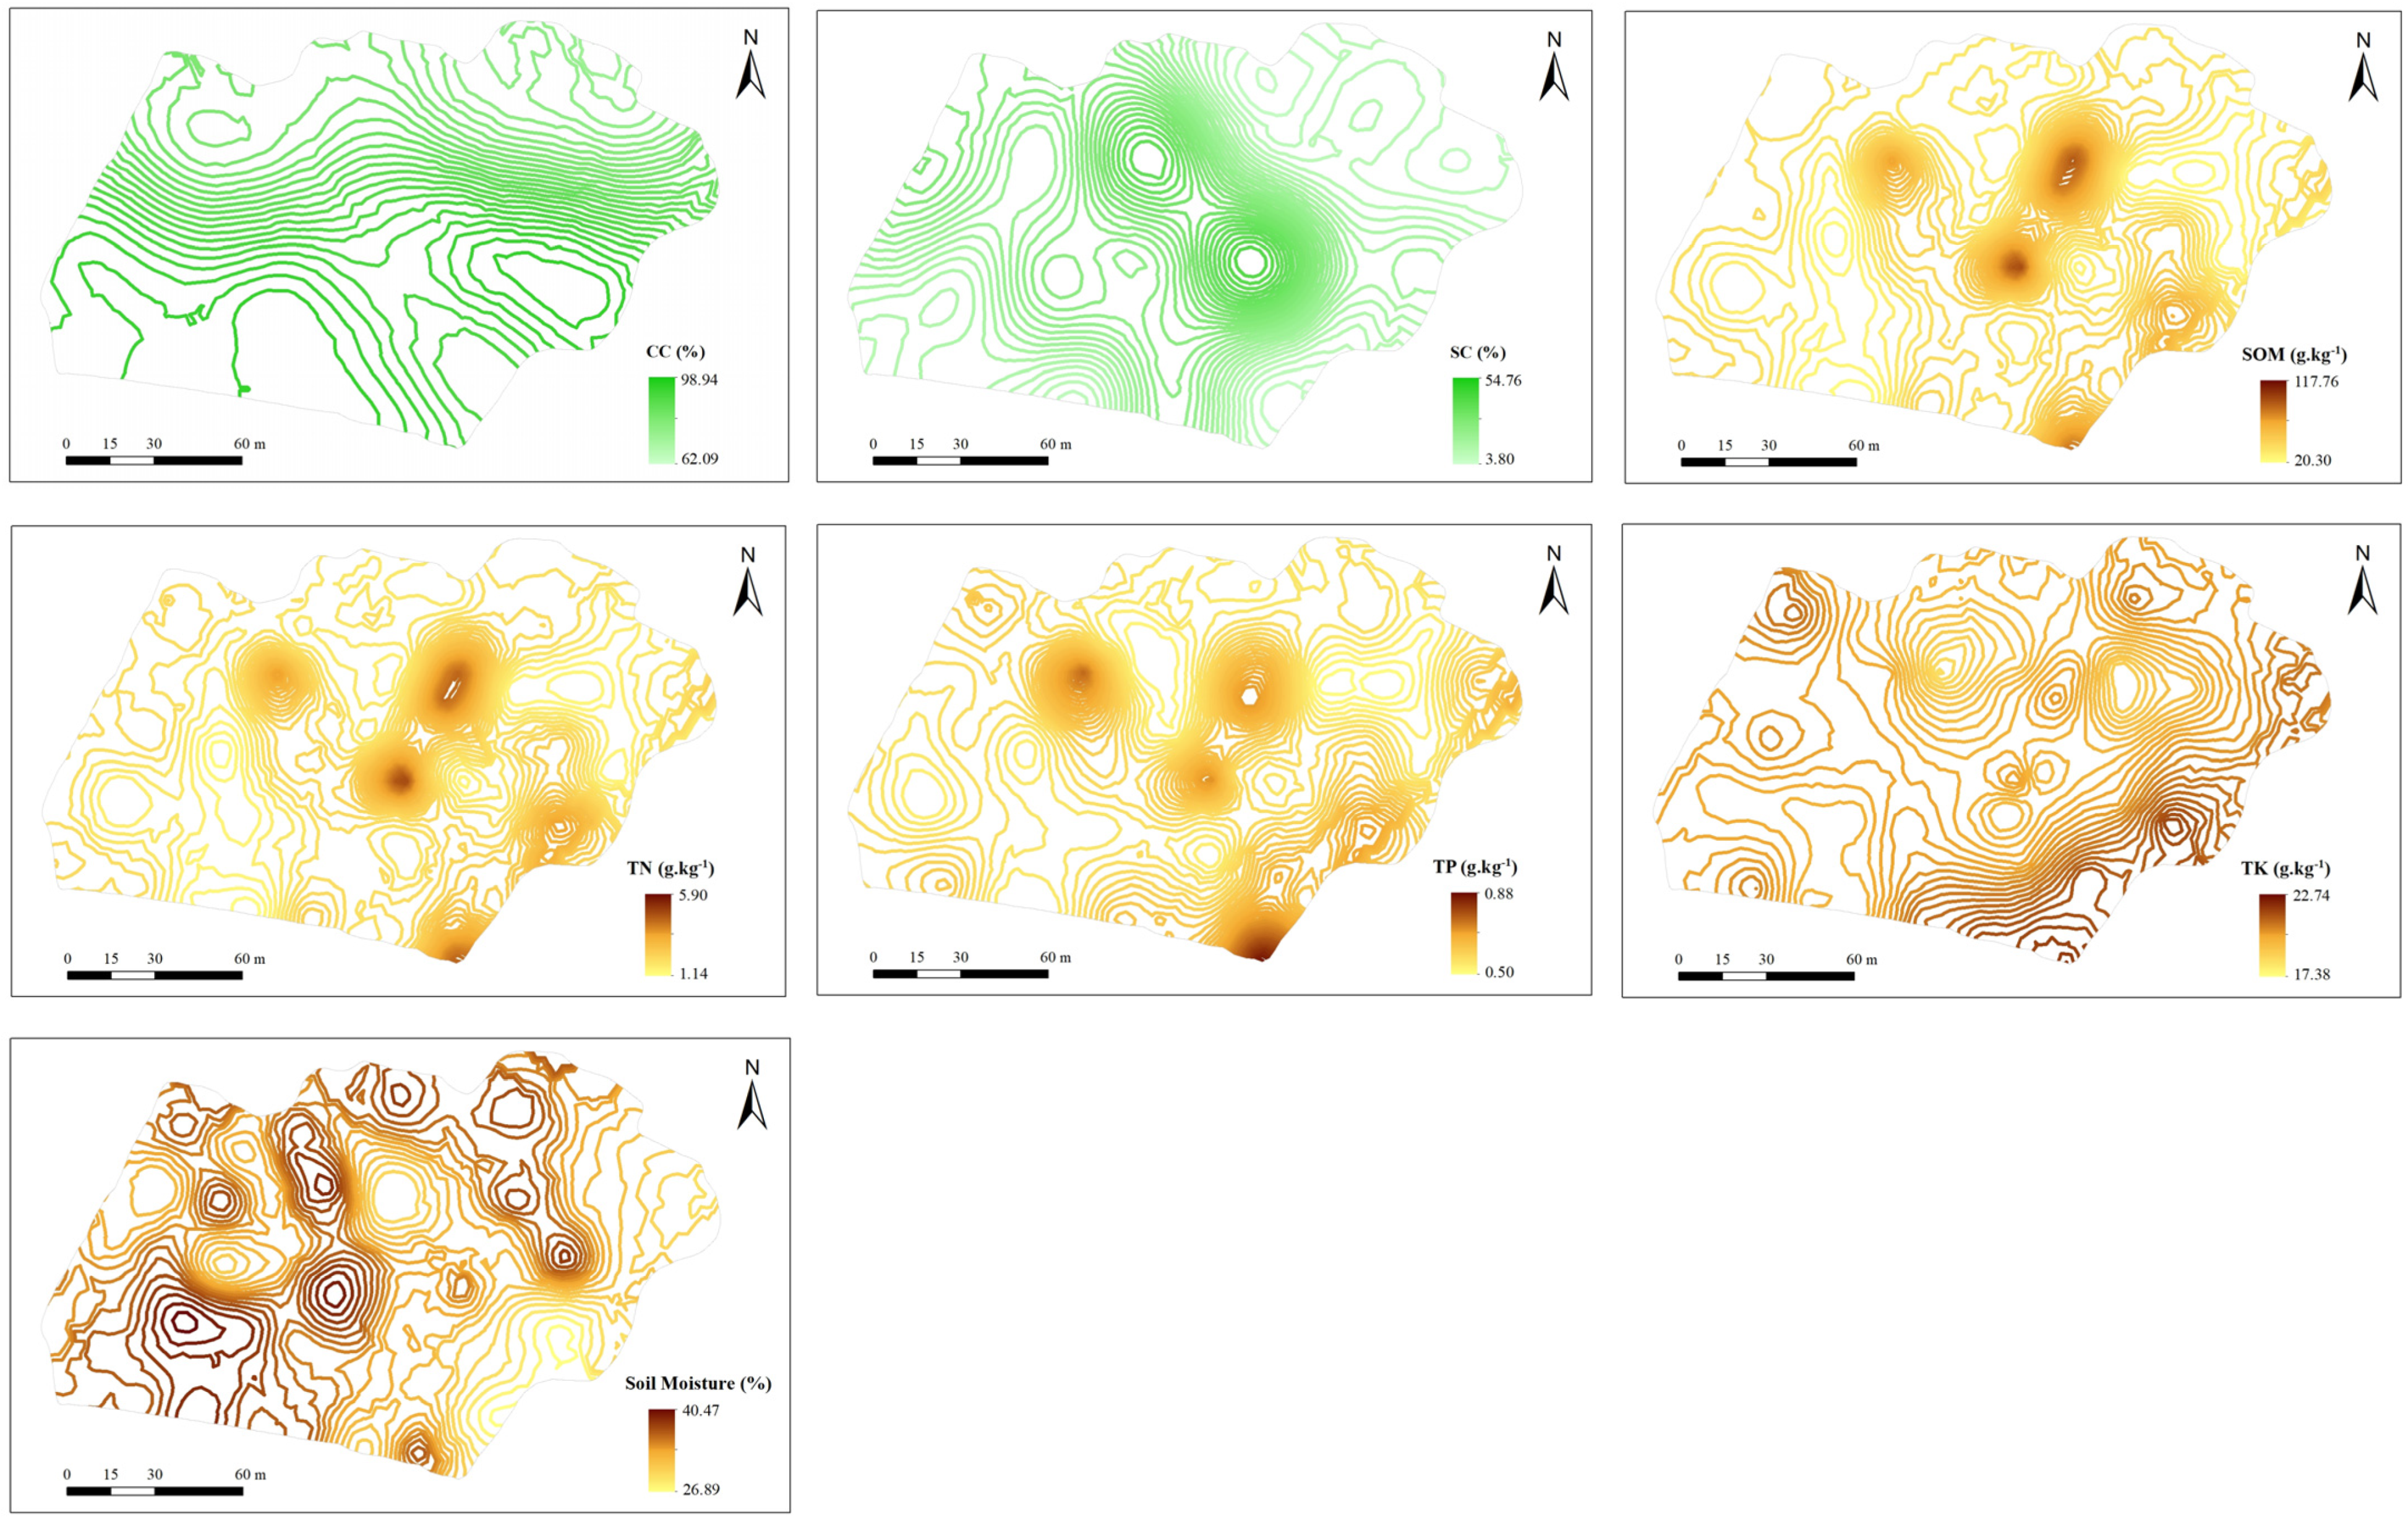
3.2. Mapping of Plant Cover and Soil Property

SOM, TN, and TP did not follow normal distribution according to the one-sample K–S test; logarithmic transformation was used to normalize the distribution of the three variables and pass the significance level (p > 0.05). Semivariogram models and detailed parameters for plant cover, soil nutrients, and soil moisture are shown in Table 1. Most plant–soil variables fit the spherical model except that community coverage and TK fit the Gaussian and exponential model. Nugget/sill ratio was used to characterize the spatial dependency among variables. Nugget/sill ratio ≤ 25%, 25–75%, and > 75% represented strong, moderate, and weak or no spatial dependency, respectively [30]. Community coverage and S. chamaejasme coverage exhibited moderate spatial dependency with a nugget/sill ratio of 50.00% and 31.82%. Soil nutrients and soil moisture showed strong spatial dependency and the nugget/sill ratio ranged from 0.15% to 19.15%. Range corresponds to the scope of spatial dependence; samples separated by distances greater than the range were not spatially related [30]. Ranges of community coverage and S. chamaejasme coverage were 62.2 and 47.8 m; ranges of SOM, TN, TP, and SM varied from 24.9 to 29.5 m, but the range of TK increased to 58.5 m. Most soil properties showed smaller distance of spatial autocorrelation than plant covers.
Ordinary Kriging interpolation was applied to map the distribution of plant cover and soil properties (Figure 1). All variables exhibited heterogeneously spatial structures. Compared to community coverage and S. chamaejasme coverage, soil nutrients and soil moisture showed higher spatial variation and were structured in smaller patches, with the exception of TK. Distribution maps of SOM, TN, and TP evidenced broad similar patterns, but TK exhibited a different trend.

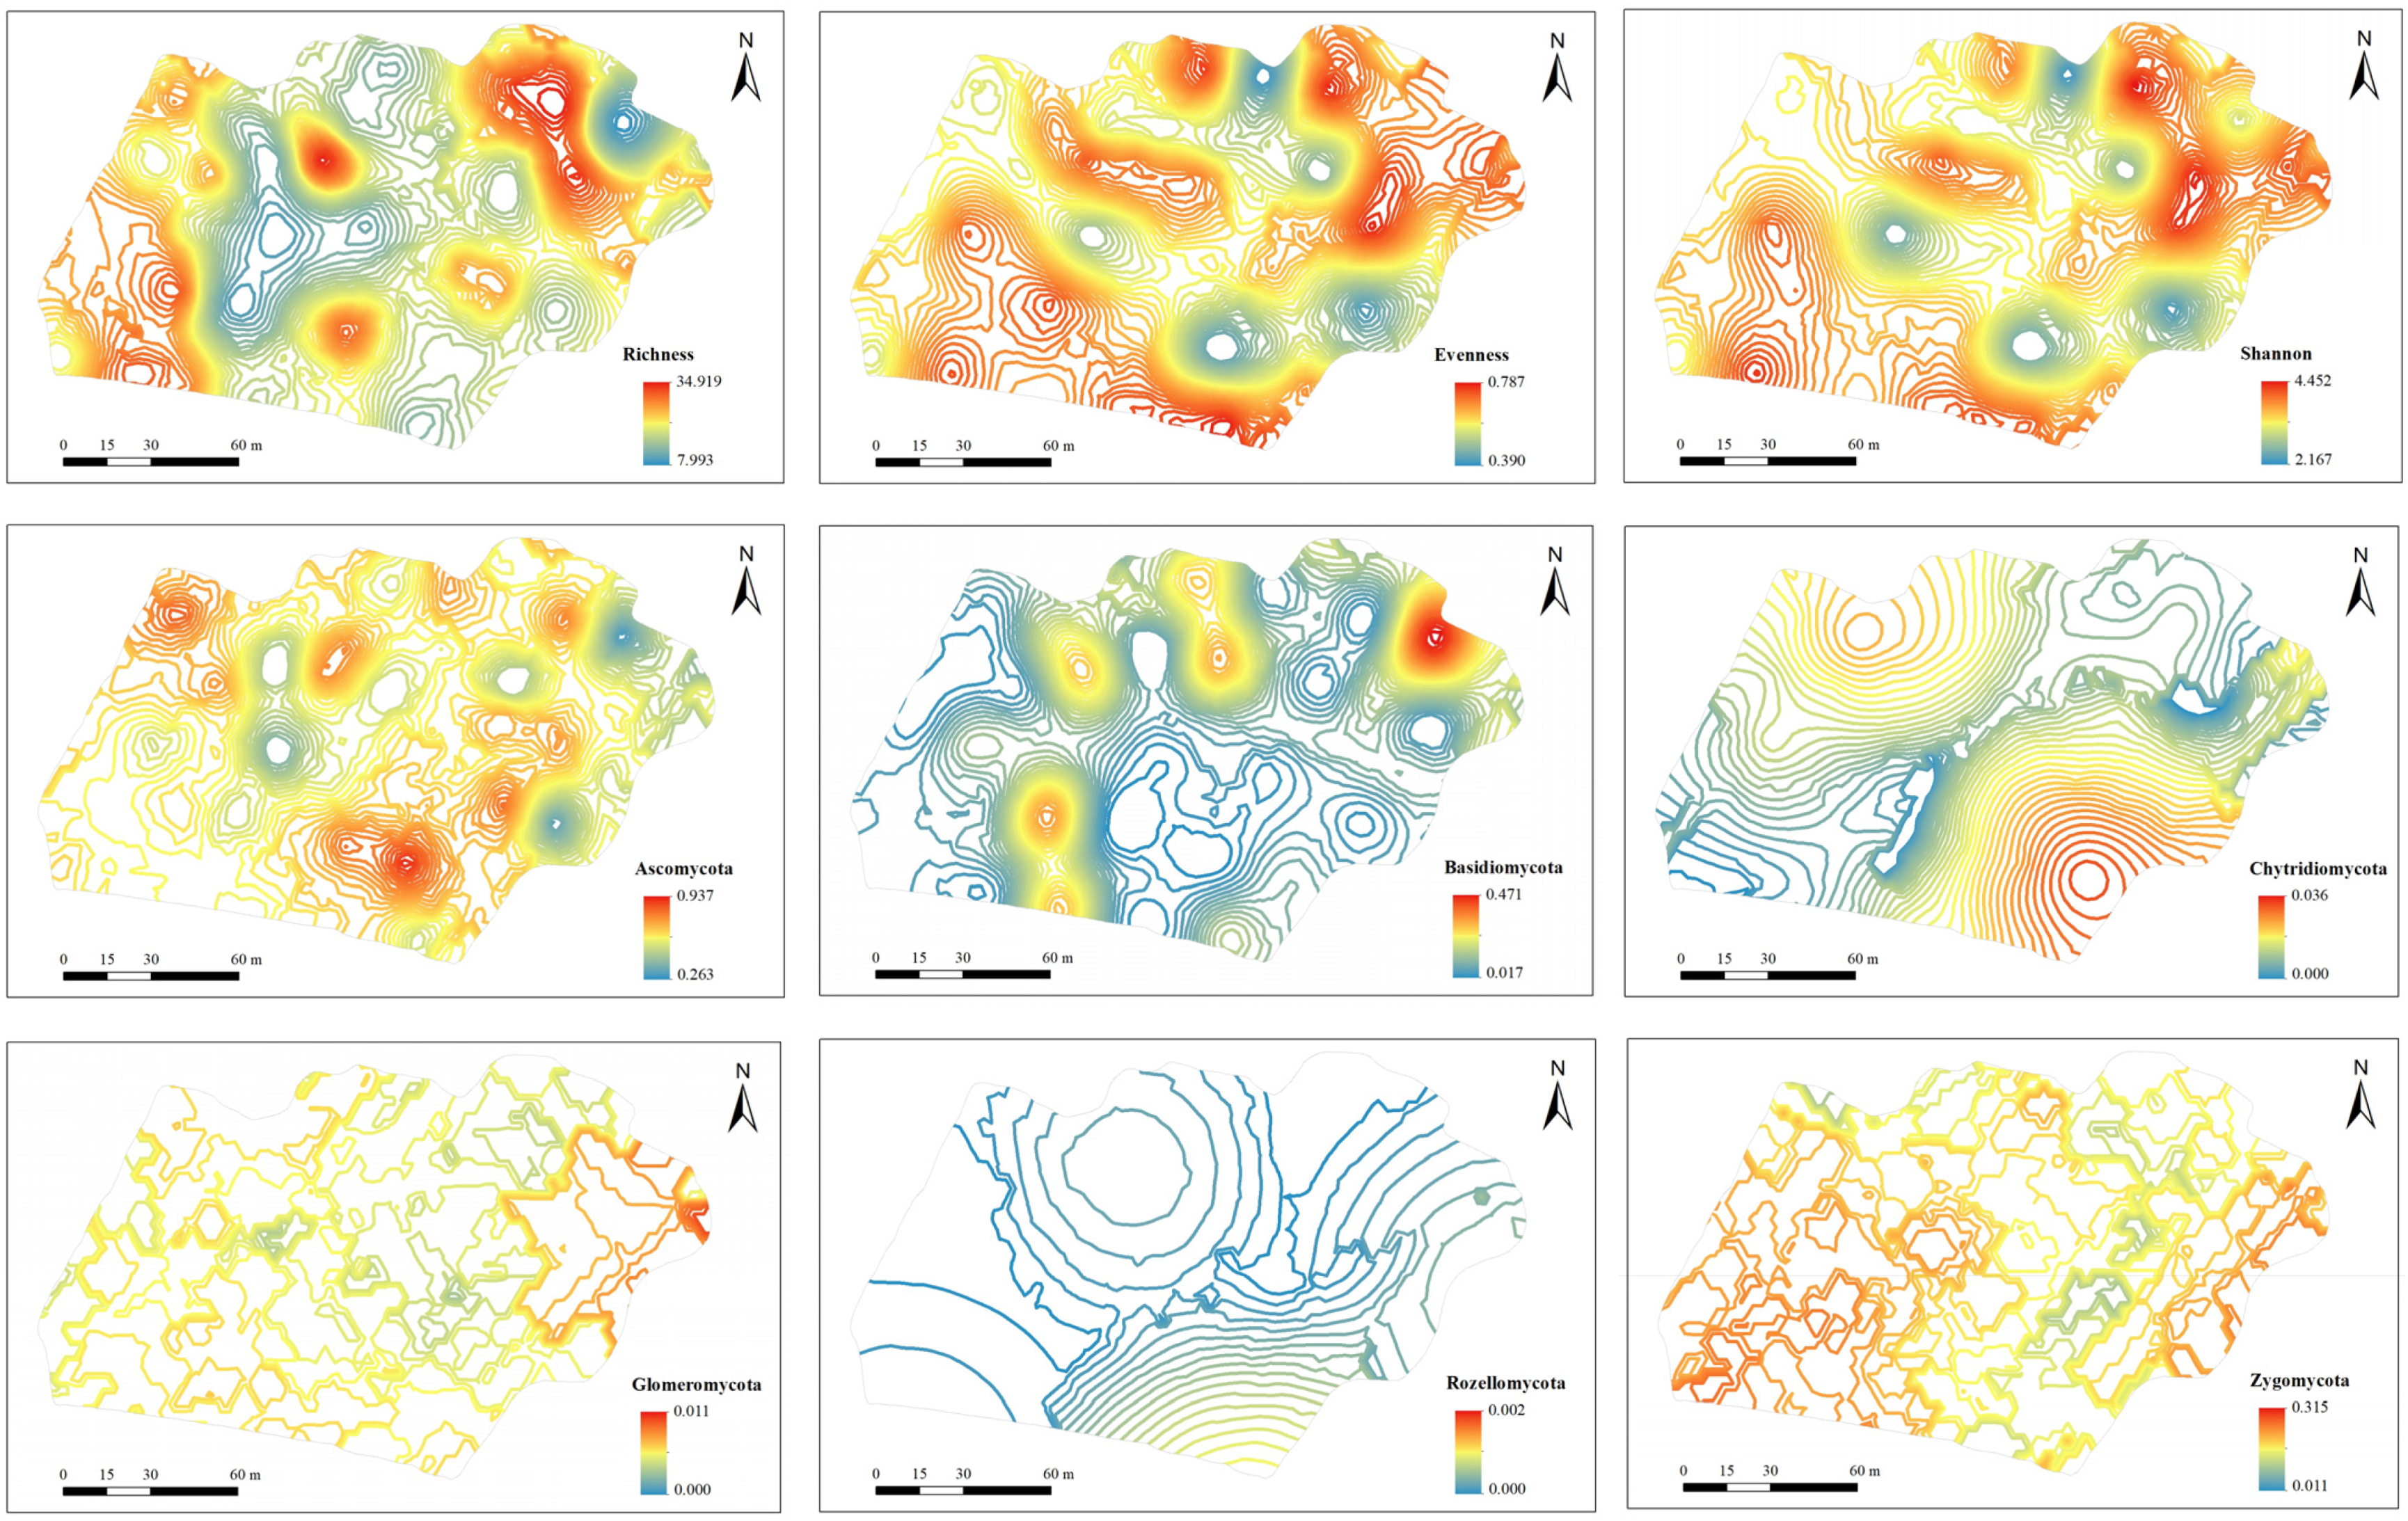
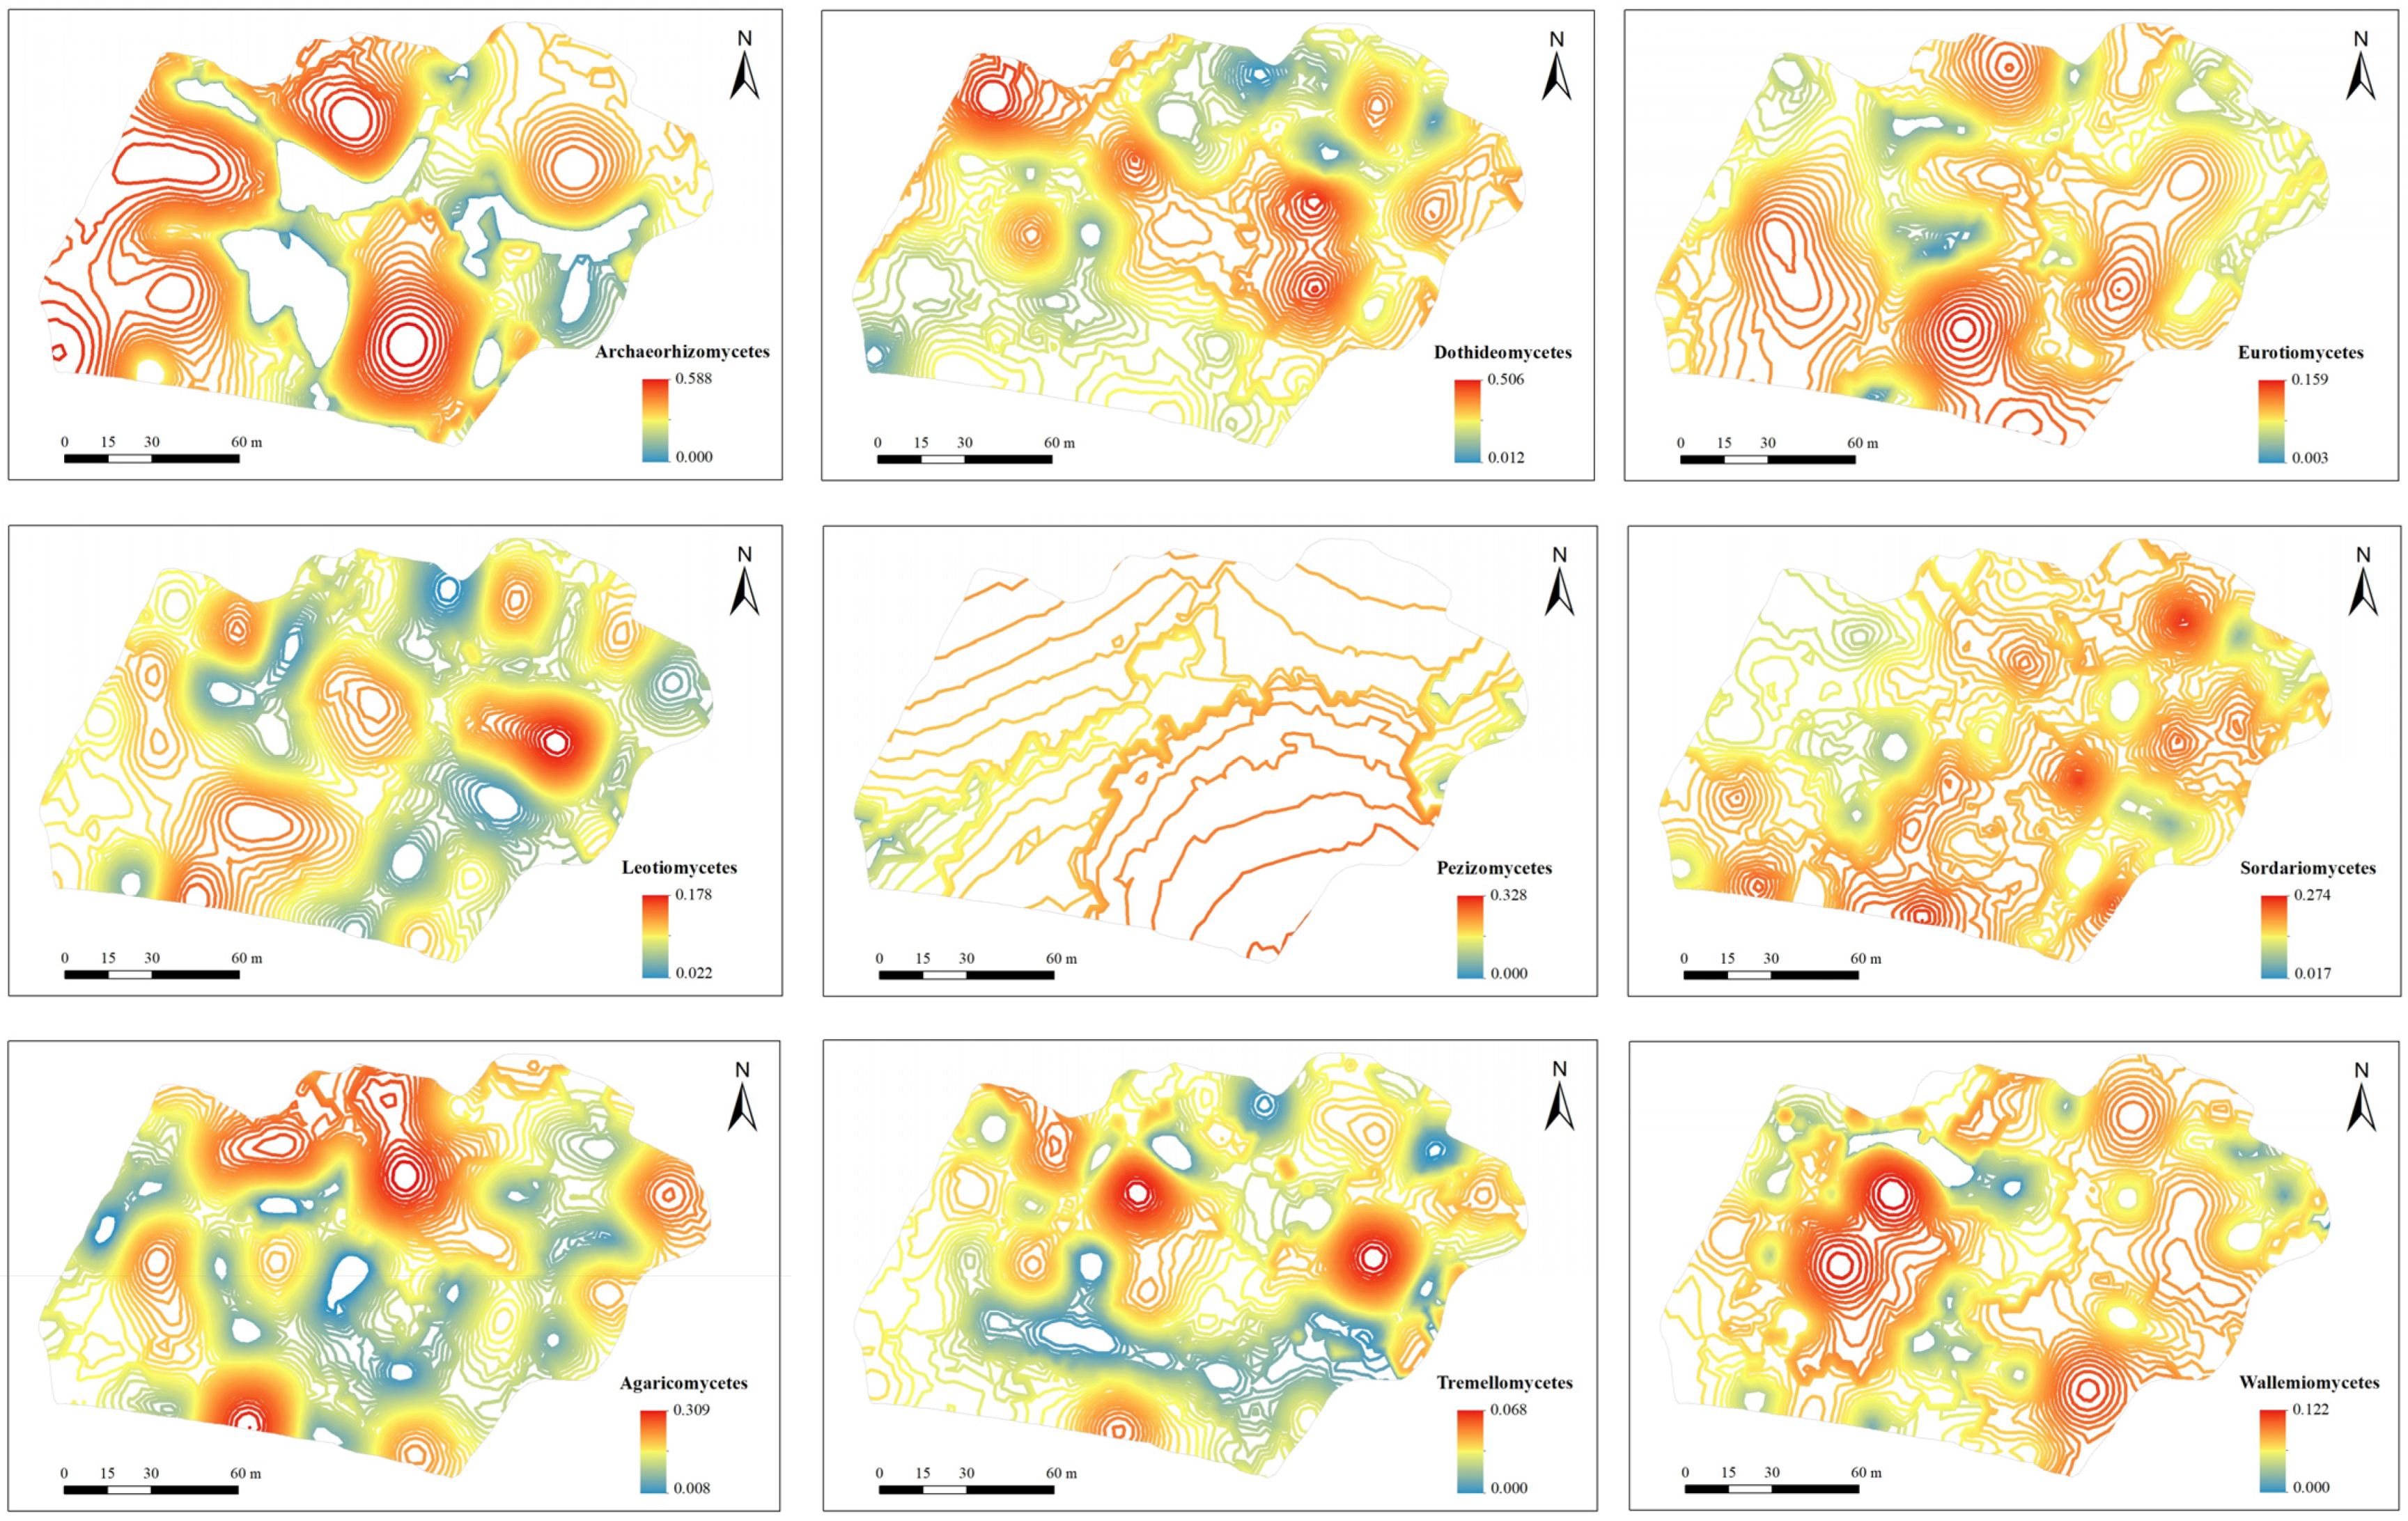
3.3. Mapping of Soil Fungal Diversity and Taxonomic Composition

All data of soil fungal characteristics followed a normal distribution according to the one-sample K–S test (p > 0.05). Geostatistical parameters for soil fungal alpha diversity and relative abundance of taxonomic composition are shown in Table 2. The optimum models for soil fungal characteristics were spherical and Gaussian models. Different patterns emerged for spatial autocorrelation in comparing of alpha diversity and fungal phyla and classes. All diversity indices exhibited strong spatial dependency with a nugget/sill ratio of 0.30–1.38%. Relative abundance of the dominant fungal phyla of Ascomycota, Basidiomycota, and Zygomycota were highly spatially related with the nugget/sill ratio < 7%, while the rare phyla of Chytridiomycota, Glomeromycota, and Rozellomycota were moderately spatially related with the nugget/sill ratio > 25%. Relative abundance of all fungal classes indicated strong spatial dependency with a nugget/sill ratio < 20%. The range of alpha diversity indices varied from 27.0 to 29.5 m. The range of relative abundance of fungal phyla and classes varied from 18.9 to 318 m, but most taxa (80%) exhibited a range value from 18.9 to 30.9 m. Range values did not change greatly among alpha diversity and most fungal taxa, which showed that the variability of spatial structure was relatively stable for the soil fungal community. The ranges of Chytridiomycota and Rozellomycota phyla and Pezizomycetes class were 224.4, 126.3, and 318 m, which indicate much larger distance of spatial autocorrelation than most fungal taxa.
Fungal diversity indices showed similar spatial variability, especially evenness and Shannon index, which appeared in similar patterns. Relative abundance of fungal phyla and classes showed various patterns across the degraded meadow; most of identified taxa displayed high spatial variation and were structured in small patches, with the exception of Chytridiomycota and Rozellomycota phyla, and Pezizomycetes class (Figure 2).

3.4. Correlation between Plant–Soil Parameters and Soil Fungal Characteristics

Correlation analyses between plant cover and soil properties at the sampling site are shown in Table 3. No associations were observed between community coverage and soil properties. The result generally showed negative impacts of S. chamaejasme coverage on soil properties, but only soil TK was significantly correlated to S. chamaejasme coverage; other soil properties did not vary in relation to S. chamaejasme coverage.
According to the Mantel test (Table 4), a minority of fungal characteristics indicated significant and positive correlation with the plant–soil parameters, but high correlation (R > 0.7) was not found. Meanwhile, no direct correlation was found between S. chamaejasme coverage and fungal characteristics. For fungal alpha diversity, richness weakly correlated to community coverage; evenness and Shannon index weakly correlated to TK. For species composition, the dominant phyla of Ascomycota and Basidiomycota weakly correlated to community coverage, SOM, and TN; the classes of Pezizomycetes and Wallemiomycetes correlated to SOM, TN, TP, and TK. No significant correlation was found between the other fungal phyla and classes and plant–soil parameters.

4. Discussion

4.1. Spatial Distribution of Soil Fungal Characteristics and Linkage with Plant–Soil Parameters

Many studies have demonstrated microbial biogeography at regional and landscape scales [2,3,4]. Our study showed that plant, soil, and fungi displayed different spatial variability in a locally degraded meadow. CV values for plant–soil parameters were 0.060–0.567, indicating weak and moderate variation. CV values for soil fungal characteristics ranged from 0.152 to 4.255, which were relatively higher than the environmental parameters, indicating moderate and strong variation. The varied plant growth and soil conditions may contribute to the marked change in soil fungi across the sampling area. Interpolation mapping revealed significant spatial variation in soil fungal richness, evenness, and Shannon index at local scale, which was in agreement with other studies carried out at similar or larger scales [3,31]. The spatial pattern of evenness was fairly similar to the Shannon index, which implied similar factors [3]. Mapping the relative abundance of all identified fungal phyla and classes revealed a heterogenous and specific distribution for each taxon; fungal species composition displayed various spatial patterns in patches of 19 to 318 m, suggesting different environmental determinants [4]. Alpha diversity and most fungal taxa were strongly spatially dependent with a nugget/sill ratio <25%, which may be controlled by intrinsic variation in soil characteristics and DNA pools [3,30]. Generally, the largest spatial variation was observed in fungal taxonomic composition, followed by alpha diversity, soil property, and plant cover.
Range represents the size of geographical patches and indicates the scale of spatial autocorrelation [4]. The alpha diversity indices were spatially structured in patches of 27–30 m. Relative abundance of most fungal phyla and classes was spatially structured in patches of 19–30 m. Patch sizes of alpha diversity were similar to fungal species composition, indicating a consistency of spatial scale in ecological processes of the soil fungal community. Soil physicochemical properties, mainly including SOM, TN, TP, and SM, were spatially structured in patches of 25–30 m, whereas community coverage and S. chamaejasme coverage were structured in larger patches of 48–62 m. The result showed a matching of patch size between soil property and fungal diversity and taxonomic composition, which suggests closer spatial linkage and interaction between soil environment and fungal characteristics. In other words, heterogeneity of soil properties (especially soil nutrients) may bring more immediate effects on the distribution of fungal community than plant cover.

4.2. Environmental Drivers of Soil Fungal Characteristics and Potential Impact of S. chamaejasme

The Mantel test revealed significant but weak impacts of plant–soil parameters on soil fungal communities in the sampling area. Fungal richness positively correlated to community coverage; the result was inconsistent with the finding that no significant relationship was found between fungal richness and community productivity [9]. Evenness and Shannon diversity positively correlated to soil TK, indicating the sensitivity of fungal diversity to TK content in the degraded meadow. The previous finding also indicated that TK was one of main factors influencing soil bacterial community and structure; these results confirm the impact of TK on soil microbes. Some studies reported that N and N plus P inputs increased fungal abundance and decreased fungal diversity, and P addition significantly reduced fungal species richness [29,32]; others showed N addition led to increased fungal richness [33,34]. In the contrast, no significant effects of TN and TP on fungal diversity indices were observed in this study. The discrepancies might be due to different interactions between soil properties, or different sampling strategies and technical approaches involved in the studies [4]. Ascomycota and Basidiomycota were the first two dominant phyla in all samples; both phyla were significantly affected by community coverage, confirming the positive impact of plant cover on soil fungal composition [9]. Ascomycota, the most abundant phylum (61.2%) at the sampling site, was also positively affected by SOM and TN, indicating sufficient soil nutrient pools contributed to the distribution of the dominant species. No significant correlation was observed between plant–soil parameters and most of fungal classes, except that Pezizomycetes positively correlated to TK, and Wallemiomycetes positively correlated to SOM, TN, and TP. Additionally, no obvious correlation was found between soil moisture and the distribution of fungal community. Compared to research at global and regional scales, our results suggest weakness of observed effect of plant–soil environment on fungal diversity and taxonomic composition at a local site [9,35].
Alpine meadows on the QTP have suffered serious invasion of poisonous plants in recent decades. S. chamaejasme takes the place of native palatable Kobresia and Poa species and has become the dominant species, bringing an increasing influence on alpine meadows. In the degraded meadow, S. chamaejasme coverage showed much higher variation than community coverage, mainly related to its densely clumped patterning over the region [36]. The toxic plant is characterized by great availability of soil nutrients and moisture, owing to its widely distributed root system with a length of 60–100 cm [24,37]. The patchy distribution of S. chamaejasme may disturb to different degrees the spatial variation of soil properties and fungal community.
Our study indicated a lack of direct correlation between S. chamaejasme and soil fungal characteristics. S. chamaejasme coverage was negatively correlated to soil TK, suggesting that S. chamaejasme population in higher coverage tended to be in a lower potassium condition. Considering the impact of TK on soil fungal diversity, the dense distribution of S. chamaejasme may decrease soil TK, which subsequently reduced soil fungal diversity.

5. Conclusions

Most existing surveys of soil microbes are based on few samples collected from each site, which does not allow for a detailed depiction of soil microbial biogeography. In this study, using systematic sampling in a small region and combining DNA sequencing with geostatistics, for the first time we were able to determine the spatial distribution of soil fungal diversity and taxonomic composition in a typical degraded alpine meadow invaded by S. chamaejasme. Interpolation maps revealed that fungal diversity and taxa exhibited highly heterogeneous structures in patches ranging from 19 to 318 m. Our study suggested weak associations between plant–soil and fungi; the relative homogeneity of plant and soil properties at local scale led to the weakening of impacts on fungal community. S. chamaejasme distribution may disturb spatial variations of fungal community and influence fungal diversity directly; further research is needed to determine the feedback mechanism among S. chamaejasme, soil and fungal community.

Author Contributions

Conceptualization and methodology, Y.L. (Yongmei Liu) and F.Z.; software and formal analysis, F.Z.; investigation, Y.L. (Yongmei Liu) and L.W.; resources, W.H. and Y.L. (Yongmei Liu); writing—original draft preparation, Y.L. (Yongmei Liu); writing—review and editing, Y.L. (Yongmei Liu); visualization, F.Z.; supervision, W.H., L.W., J.L. and Y.L. (Yongqing Long); funding acquisition, Y.L. (Yongmei Liu). All authors have read and agreed to the published version of the manuscript.

Funding

The study was supported by the National Natural Science Foundation of China (Grant No. 41871335). Special Aid Fund for Qinghai Province (Grant No. 2020-QY-210).

Institutional Review Board Statement

Not applicable.

Informed Consent Statement

Not applicable.

Data Availability Statement

The data that support the findings of this study are available on request from the corresponding author.

Conflicts of Interest

The authors declare no conflict of interest.

References

  1. Chen, Y.L.; Deng, Y.; Ding, J.Z.; Hu, H.; Xu, T.; Li, F.; Yang, G.B.; Yang, Y.H. Distinct microbial communities in the active and permafrost layers on the Tibetan Plateau. Mol. Ecol. 2017, 26, 6608–6620. [Google Scholar] [CrossRef] [PubMed]
  2. Martiny, J.B.H.; Bohannon, B.J.M.; Brown, J.H.; Colwell, R.K.; Fuhrman, J.A.; Green, J.L.; Horner-Devine, M.C.; Kane, M.; Krumins, J.A.; Kuske, C.R.; et al. Microbial biogeography: Putting microorganisms on the map. Nat. Rev. Microbiol. 2006, 4, 102–112. [Google Scholar] [CrossRef]
  3. Constancias, F.; Terrat, S.; Saby, N.P.A.; Horrigue, W.; Villerd, J.; Jean-Philippe, G.; Biju-Duval, L.; Nowak, V.; Dequiedt, S.; Ranjard, L.; et al. Mapping and determinism of soil microbial community distribution across an agricultural landscape. MicrobiologyOpen 2015, 4, 505–517. [Google Scholar] [CrossRef] [PubMed]
  4. Karimi, B.; Terrat, S.; Dequiedt, S.; Saby, N.P.A.; Horrigue, W.; Lelievre, M.; Nowak, V.; Jolivet, C.; Arrouays, D.; Wincker, P.; et al. Biogeography of soil bacteria and archaea across France. Sci. Adv. 2018, 4, eaat1808. [Google Scholar] [CrossRef] [Green Version]
  5. Talbot, J.M.; Bruns, T.D.; Taylor, J.W.; Smith, D.P.; Branco, S.; Glassman, S.I.; Erlandson, S.; Vilgalys, R.; Liao, H.L.; Smith, M.E.; et al. Endemism and functional convergence across the North American soil mycobiome. Proc. Natl. Acad. Sci. USA 2014, 111, 6341–6346. [Google Scholar] [CrossRef] [Green Version]
  6. Liu, J.; Guo, Z.Y.; Xu, A.A.; Wang, C.K.; Wu, S.W.; Pan, K.; Zhang, F.F.; Pan, X.Z. Spatial differences in bacterial communities preserved in soils archived for a decade. Appl. Soil Ecol. 2019, 142, 64–71. [Google Scholar] [CrossRef]
  7. Wang, C.T.; Long, R.J.; Wang, Q.J.; Ding, L.M.; Wang, M.P. Effects of altitude on plant-species diversity and productivity in an alpine meadow, Qinghai-Tibetan plateau. Aust. J. Bot. 2007, 55, 110–117. [Google Scholar] [CrossRef] [Green Version]
  8. Song, M.H.; Xu, X.L.; Hu, Q.W.; Tian, Y.Q.; OuYang, H.; Zhou, C.P. Interactions of plant species mediated plant competition for inorganic nitrogen with soil microorganisms in an alpine meadow. Plant Soil 2007, 297, 127–137. [Google Scholar] [CrossRef] [Green Version]
  9. Yang, T.; Adams, J.M.; Shi, Y.; He, J.S.; Jing, X.; Chen, L.T.; Tedersoo, L.; Chu, H.Y. Soil fungal diversity in natural grasslands of the Tibetan Plateau: Associations with plant diversity and productivity. New Phytol. 2017, 215, 756–765. [Google Scholar] [CrossRef] [PubMed] [Green Version]
  10. Che, R.X.; Wang, S.P.; Wang, Y.F.; Xu, Z.H.; Wang, W.J.; Rui, Y.C.; Wang, F.; Hu, J.M.; Tao, J.; Cui, X.Y. Total and active soil fungal community profiles were significantly altered by six years of warming but not by grazing. Soil Biol. Biochem. 2019, 139, 107611. [Google Scholar] [CrossRef]
  11. Wang, C.T.; Zhao, X.Q.; Zi, H.B.; Hu, L.; Ade, L.; Wang, G.X.; Lerdau, M. The effect of simulated warming on root dynamics and soil microbial community in an alpine meadow of the Qinghai-Tibet Plateau. Appl. Soil Ecol. 2017, 116, 30–41. [Google Scholar] [CrossRef]
  12. Yu, C.Q.; Han, F.S.; Fu, G. Effects of 7 years experimental warming on soil bacterial and fungal community structure in the Northern Tibet alpine meadow at three elevations. Sci. Total Environ. 2019, 655, 814–822. [Google Scholar] [CrossRef] [PubMed]
  13. Xue, R.; Yang, Q.; Miao, F.H.; Wang, X.Z.; Shen, Y.Y. Slope aspect influences plant biomass, soil properties and microbial composition in alpine meadow on the Qinghai-Tibetan Plateau. J. Soil Sci. Plant Nutr. 2018, 18, 1–12. [Google Scholar] [CrossRef]
  14. Che, R.X.; Wang, Y.F.; Li, K.X.; Xu, Z.H.; Hu, J.M.; Wang, F.; Rui, Y.C.; Li, L.F.; Pang, Z.; Cui, X.Y. Degraded patch formation significantly changed microbial community composition in alpine meadow soils. Soil Tillage Res. 2019, 195, 104426. [Google Scholar] [CrossRef]
  15. Liu, S.B.; Zamanian, K.; Schleuss, P.M.; Zarebanadkouki, M.; Kuzyakov, Y. Degradation of Tibetan grasslands: Consequences for carbon and nutrient cycles. Agric. Ecosyst. Environ. 2018, 252, 93–104. [Google Scholar] [CrossRef]
  16. He, S.Y.; Richards, K. Impact of meadow degradation on soil water status and pasture management-a case study in Tibet. Land Degrad. Dev. 2015, 26, 468–479. [Google Scholar]
  17. Che, R.X.; Wang, F.; Wang, W.J.; Zhang, J.; Zhao, X.; Rui, Y.C.; Xu, Z.H.; Wang, Y.F.; Hao, Y.B.; Cui, X.Y. Increase in ammonia-oxidizing microbe abundance during degradation of alpine meadows may lead to greater soil nitrogen loss. Biogeochemistry 2017, 136, 341–352. [Google Scholar] [CrossRef]
  18. Lin, L.; Li, Y.K.; Xu, X.L.; Zhang, F.W.; Du, Y.G.; Liu, S.L.; Guo, X.W.; Cao, G.M. Predicting parameters of degradation succession processes of Tibetan Kobresia grasslands. Solid Earth 2015, 6, 1237–1246. [Google Scholar] [CrossRef] [Green Version]
  19. Wang, J.; Wang, X.T.; Liu, G.B.; Zhang, C.; Wang, G.L. Bacterial richness is negatively related to potential soil multifunctionality in a degraded alpine meadow. Ecol. Indic. 2021, 121, 106996. [Google Scholar] [CrossRef]
  20. Li, Y.M.; Wang, S.P.; Jiang, L.L.; Zhang, L.R.; Cui, S.J.; Meng, F.D.; Wang, Q.; Li, X.N.; Zhou, Y. Changes of soil microbial community under different degraded gradients of alpine meadow. Agric. Ecosyst. Environ. 2016, 222, 213–222. [Google Scholar] [CrossRef]
  21. Li, S.X.; Wang, Y.L.; Wang, Y.Q.; Yin, Y.L. Response of soil bacterial community characteristics to alpine meadow degradation. Biodivers. Sci. 2021, 29, 53–64. (In Chinese) [Google Scholar]
  22. Ghorbanzadeh, N.; Salehi, A.; Pourbabaei, H.; Tolarod, A.A.S.; Alavi, S.J. Spatial variability of soil microbial indices in common alder COMMON ALDER (Alnus glutinosa) stands using a geostatistical approach in northern Iran. J. For. Res. 2019, 30, 679–688. [Google Scholar] [CrossRef]
  23. Harris, R.B. Rangeland degradation on the Qinghai-Tibetan plateau: A review of the evidence of its magnitude and causes. J. Arid Environ. 2010, 74, 1–12. [Google Scholar] [CrossRef]
  24. Shi, Z.C. The Poisonous Plants of Chinese Grassland; China Agriculture Press: Beijing, China, 1997; pp. 140–150. (In Chinese) [Google Scholar]
  25. Lu, R.K. Analytical Methods of Soil Agricultural Chemistry; China Agricultural Science Press: Beijing, China, 1999. (In Chinese) [Google Scholar]
  26. Wang, Q.; Garrity, G.M.; Tiedje, J.M.; Cole, J.R. Naive Bayesian classifier for rapid assignment of rRNA sequences into the new bacterial taxonomy. Appl. Environ. Microbiol. 2007, 73, 5261–5267. [Google Scholar] [CrossRef] [PubMed] [Green Version]
  27. Kõljalg, U.; Nilsson, R.H.; Abarenkov, K.; Tedersoo, L.; Taylor, A.F.; Bahram, M.; Bates, S.T.; Bruns, T.D.; Bengtsson-Palme, J.; Callaghan, T.M. Towards a unified paradigm for sequence-based identification of fungi. Mol. Ecol. 2013, 22, 5271–5277. [Google Scholar] [CrossRef] [Green Version]
  28. Wang, S.Q.; Zhu, S.L.; Zhou, C.L. Characteristics of spatial variability of soil thickness in China. Geogr. Res. 2001, 20, 161–169. (In Chinese) [Google Scholar]
  29. Zhou, J.; Jiang, X.; Zhou, B.; Zhao, B.; Ma, M.; Guan, D.; Li, J.; Chen, S.F.; Cao, F.M.; Shen, D.L.; et al. Thirty four years of nitrogen fertilization decreases fungal diversity and alters fungal community composition in black soil in NorthEast China. Soil Biol. Biochem. 2016, 57, 135–143. [Google Scholar] [CrossRef]
  30. Cambardella, C.A.; Moorman, T.B.; Novak, J.M.; Parkin, T.B.; Karlen, D.L.; Turco, R.F. Field-scale variability of soil properties in central lowa soils. Soil Sci. Soc. Am. J. 1994, 58, 1501–1511. [Google Scholar] [CrossRef]
  31. Shange, R.S.; Ankumah, R.O.; Ibekwe, A.M.; Zabawa, R.; Dowd, S.E. Distinct soil bacterial communities revealed under a diversely managed agroecosystem. PLoS ONE 2012, 7, e0040338. [Google Scholar] [CrossRef] [Green Version]
  32. He, D.; Xiang, X.J.; He, J.S.; Wang, C.; Cao, G.M.; Adams, J.; Chu, H.Y. Composition of the soil fungal community is more sensitive to phosphorus than nitrogen addition in the alpine meadow on the Qinghai-Tibetan Plateau. Biol. Fertil. Soils 2016, 52, 1059–1072. [Google Scholar] [CrossRef]
  33. Weber, C.F.; Vilgalys, R.; Kuske, C.R. Changes in fungal community composition in response to elevated atmospheric CO2 and nitrogen fertilization varies with soil horizon. Front Microbiol. 2013, 4, 78. [Google Scholar] [CrossRef] [PubMed] [Green Version]
  34. Mueller, R.C.; Balasch, M.M.; Kuske, C.R. Contrasting soil fungal community responses to experimental nitrogen addition using the large subunit rRNA taxonomic marker and cellobiohydrolase I functional marker. Mol. Ecol. 2014, 23, 4406–4417. [Google Scholar] [CrossRef] [PubMed]
  35. Tedersoo, L.; Bahram, M.; Polme, S.; Koljalg, U.; Yorou, N.S.; Wijesundera, R.; Ruiz, L.V.; Vasco-Palacios, A.M.; Thu, P.Q.; Suija, A.; et al. Fungal biogeography. Global diversity and geography of soil fungi. Science 2014, 346, 1–10. [Google Scholar] [CrossRef] [PubMed] [Green Version]
  36. Bao, G.S.; Wang, Y.Q.; Song, M.L.; Wang, H.S.; Yin, Y.L.; Liu, S.C.; Yang, Y.W.; Yang, M. Effects of Stellera chamaejasme patches on the surrounding grassland community and on soil physiochemical properties in degraded grasslands susceptible to S. chamaejasme invasion. Acta Prataculturae Sin. 2019, 28, 51–61. (In Chinese) [Google Scholar]
  37. Sun, G.; Luo, P.; Qiu, P.F.; Gao, Y.H.; Chen, H.; Shi, F.S. Stellera chamaejasme L. increases soil N availability, turnover rates and microbial biomass in an alpine meadow ecosystem on the eastern Tibetan Plateau of China. Soil Biol. Biochem. 2009, 41, 86–91. [Google Scholar] [CrossRef]
Figure 1. Distribution maps of plant cover and soil properties. CC, community coverage; SC, S. chamaejasme coverage; SOM, soil organic matter; TN, total nitrogen; TP, total phosphorus; TK, total potassium; SM, soil moisture.
Agriculture 11 01280 g001
Figure 2. Distribution maps of soil fungal diversity and taxonomic composition.
Agriculture 11 01280 g002aAgriculture 11 01280 g002b
Table 1. Results of statistical analyses of plant cover and soil properties.
Variable TypeMeanSDCV ModelNugget
C0
Sill
C0+C
Nugget/Sill
C0/(C0+C)/%
Range
/m
plant cover
CC (%)87.378.5850.098G0.0040.00750.0062.2
SC (%)20.3311.5180.567S0.0050.01531.8247.8
soil property
SOM (g.kg−1)40.2019.8230.493S0.0010.6910.1527.3
TN (g.kg−1)2.160.9960.169S0.0010.6270.1629.5
TP (g.kg−1)0.590.0730.124S0.0040.1123.4124.9
TK (g.kg−1)20.071.2040.060E0.3371.76019.1558.5
SM (%)34.98 3.1200.089S0.0000.0015.0525.1
SD, standard deviation; CV, coefficient of variation; CC, community coverage; SC, S. chamaejasme coverage; SOM, soil organic matter; TN, total nitrogen; TP, total phosphorus; TK, total potassium; SM, soil moisture; G, Gaussian; S, spherical; E, exponential.
Table 2. Results of statistical analyses of fungal alpha diversity and taxonomic composition.
Variable TypeMeanSDCVModelNugget
C0
Sill
C0+C
Nugget/Sill
C0/(C0+C)/%
Range
/m
Alpha diversity
richness23.9275.9880.250S0.500036.16331.3827.0
evenness0.6380.0970.152S0.00010.00901.1129.5
Shannon index3.5280.5780.164S0.00100.33670.3029.2
Relative abundance of taxonomic composition
PhylumClass
Ascomycota 0.6120.1500.245S0.00150.02356.3821.3
Archaeorhizomycetes0.0640.1282.001G0.00000.01680.0027.7
Dothideomycetes0.1370.1140.832S0.00020.01301.5423.7
Eurotiomycetes0.0290.0311.043S0.00010.001010.030.9
Leotiomycetes0.0760.0290.387G0.00000.00090.0022.9
Pezizomycetes0.0120.0494.255G0.00170.009018.89318.0
Sordariomycetes0.1130.0710.627S0.00000.00490.0020.2
Basidiomycota 0.1190.1030.866G0.00030.01042.8825.3
Agaricomycetes0.0660.0731.109G0.00000.00580.0022.7
Tremellomycetes0.0120.0141.185G0.00000.00020.0018.9
Wallemiomycetes0.0110.0242.157G0.00000.00070.0019.2
Chytridiomycota 0.0020.0063.717E0.00000.000125.04224.4
Glomeromycota 0.0010.0021.287G0.00000.000061.3426.3
Rozellomycota 0.0000.0003.831G0.00000.000053.14126.3
Zygomycota 0.1170.0760.643G0.00000.00571.5820.6
SD, standard deviation; CV, coefficient of variation; S, spherical; G, Gaussian; E, exponential.
Table 3. Correlation coefficients between plant cover and soil properties (R).
Variable TypeCCSCSOMTN TP TK SM
CC1
SC0.221
SOM0.04−0.111
TN0.05−0.130.99 **1
TP0.13−0.180.85 **0.88 **1
TK0.18−0.35 *0.47 **0.51 **0.66 **1
SM0.060.13−0.27−0.27−0.34 *−0.36 *1
CC, community coverage; SC, S. chamaejasme coverage; SOM, soil organic matter; TN, total nitrogen; TP, total phosphorus; TK, total potassium; SM, soil moisture. **, * significant at p < 0.01, p < 0.05, respectively.
Table 4. Mantel test between plant–soil parameters and soil fungal characteristics (R).
Variable TypeCCSCSOMTN TP TK SM
Alpha diversity
richness0.20 *−0.060.060.030.05−0.01−0.05
evenness0.02−0.050.130.140.150.17 *0.05
Shannon diversity0.07−0.030.100.110.110.18 *0.05
Relative abundance of soil fungal phylum
Ascomycota0.16 *−0.090.20 *0.19 *0.160.070.04
Basidiomycota0.26 *−0.080.100.070.06−0.10−0.04
Chytridiomycota−0.05−0.050.040.050.190.200.17
Glomeromycota−0.10−0.09−0.10−0.10−0.08−0.12−0.01
Rozellomycota−0.070.05−0.06−0.060.120.22−0.03
Zygomycota−0.07−0.07−0.01−0.01−0.05−0.020.01
Relative abundance of soil fungal class
Archaeorhizomycetes0.030.03−0.11−0.11−0.06−0.09−0.11
Dothideomycetes−0.030.01−0.13−0.13−0.110.11−0.08
Eurotiomycetes−0.04−0.02−0.10−0.11−0.08−0.07−0.02
Leotiomycetes−0.01−0.070.010.01−0.05−0.10−0.01
Pezizomycetes−0.38−0.070.070.070.200.22 *0.04
Sordariomycetes−0.020.080.010.02−0.04−0.03−0.01
Agaricomycetes−0.10−0.03−0.08−0.09−0.12−0.04−0.01
Tremellomycetes−0.060.130.020.03−0.070.160.04
Wallemiomycetes 0.01−0.110.52 **0.49 **0.50 **−0.010.02
CC, community coverage; SC, S. chamaejasme coverage; SOM, soil organic matter; TN, total nitrogen; TP, total phosphorus; TK, total potassium; SM, soil moisture. **, * significant at p < 0.01, p < 0.05, respectively.
Publisher’s Note: MDPI stays neutral with regard to jurisdictional claims in published maps and institutional affiliations.

