Article

Significance of Pyrolytic Temperature, Particle Size, and Application Rate of Biochar in Improving Hydro-Physical Properties of Calcareous Sandy Soil

1
Soil Sciences Department, College of Food and Agricultural Sciences, King Saud University, P.O. Box 2460, Riyadh 11451, Saudi Arabia
2
Soil and Water Science Department, Faculty of Agriculture, Alexandria University, Alexandria 21545, Egypt
*
Author to whom correspondence should be addressed.
Submission received: 27 October 2021 / Revised: 13 December 2021 / Accepted: 17 December 2021 / Published: 19 December 2021

Abstract

:
Water management and irrigation conservation in calcareous sandy soil are of significant importance for sustaining agricultural production, especially in arid and semi-arid region that facing scarcity of water resources. The changes in hydro-physical characteristics of calcareous sand soil were investigated after date palm waste-derived biochar application in column trials. Significance of pyrolysis temperature (300 °C, 500 °C, and 700 °C), particle size [<0.5 mm (D0.5), 0.5–1 mm (D1), and 1–2 mm (D2)], and application rate (1%, 2.5%, and 5%) were studied. Variations in infiltration rate, intermittent evaporation, and saturated hydraulic conductivity as a function of aforementioned factors were investigated. After amending the top 10-cm soil layer with different biochar and application rates, the columns were subjected to six wetting and drying cycles by applying 25 cm3 tap water per week over a 6-week period. Overall, biochar application resulted in decreased saturated hydraulic conductivity, while improved cumulative evaporation. Specifically, biochar produced at 300 °C and 500 °C demonstrated 10.2% and 13.3% higher cumulative evaporation, respectively., whereas, biochar produced at 700 °C with 5% application rate resulted in decreased cumulative evaporation. Cumulative evaporation increased by 5.0%, 7.7% and, 7.8% for D0.5, D1 and D2 (mm) on average, respectively, as compared with the untreated soil. Thus, biochar with particle size 0.5–1 mm significantly improved hydro-physical properties when applied at 1%. Generally, using biochar produced at medium temperature and small particle size with appropriate application rates could improve the soil hydro-physical properties.

1. Introduction

Soil physical properties are important factors that impact crop production and water use in the root zone, especially in arid and semiarid regions, which are characterized by high temperatures, low rainfall, and sandy soils. Scientists seek to find amendments that can improve the hydraulic properties of these soils to increase agricultural production, such as lowering infiltration rate, reducing evaporation, decreasing hydraulic conductivity, increasing available water, and reducing bulk density. Application of amendments is considered as a means to enhance soil physical properties and hydrological parameters. Amendments such as polymers, organic matter, and clay deposits have been widely used in Saudi Arabia to improve soil hydraulic properties, irrigation water conservation and thus, sustain crop production [1,2,3]. Recently, biochar produced from carbonization of tree wastes has been used to alleviate undesirable soil chemical and physical properties [4].
Studies have shown that biochar from different feedstock materials, applied to fields for a long time, could enhanced the hydro-physical properties of soil, because it increases macro- aggregates and aggregate stability and improves water retention capacity. It also enhances available water content and allows for the formation of new pores by modifying the arrangement of soil particles [5]. Saffari et al. [6] repotted that soil water retention, penetration resistance, bulk density, and total porosity were increased by biochar application. Furthermore, Hussain et al. [7] showed that the application of biochar to soil enhanced soil water retention characteristics (SWRC), like θr (residual water content), the air entry value, and the water content. These results were due to the properties of biochar, such as high specific surface area (SSA) and the presence of functional groups that can absorb nutrients. Razzaghi et al. [8] found that biochar decreased bulk density by 9%, while it increased water retention at field capacity (FC) and the wilting point (WP). Plant available water content (AW) was also increased by 14%, 21%, and 45% for fine, medium, and coarse textured soil, respectively. Biochar improved bulk density, porosity, moisture content, mean weight diameter of soil aggregates, dispersion ratio, and infiltration rate [9]. The particle size of biochar is an important factor that can enhance water holding capacity and bulk density [10]. In a study with biochar, Glab et al. [11] applied two different types and three different sizes (0–0.5, 0.5–1 and 1–2 mm), applied at four different rates (0.5%, 1%, 2% and 4%). They found that the small particles of biochar increased available water content.
With respect to the influence of pyrolytic temperature, most studies have focused on chemical properties of soil. For example, Usman et al. [12] reported that, with increasing pyrolytic temperature, fixed C, ash, and basic cations of date palm biochar increased while moisture, volatiles, and elemental composition (O, H, N, and S) decreased. Surface basicity of biochar increases with increasing pyrolytic temperature, and, consequently, pH increases. Increasing the pyrolytic temperature results in volatilizing some elements such as N and S, but it can cause other elements such as C to concentrate in the biochar, Bridle and Pritchard [13]. The pyrolytic temperature has a direct influence on the elements in the feedstock, and they may be lost to the atmosphere, fixed into more stable fractions, or released as soluble forms during the pyrolytic process [14,15].
In Saudi Arabia date palms are widely grown. Currently, the number of cultivated date palm trees has reached 32 million trees and the production is estimated to be 1,539,775 tons [16]. Date palm cultivation is producing tons of wastes that can be utilized on farms. Few studies have investigated the effect of date palm waste on hydro-physical properties of calcareous sandy soil. Therefore, the objective of this study was to evaluate the physical characteristics of a loamy sand in Saudi Arabia as influenced by the addition of date palm biochar produced at different pyrolytic temperatures and with different particle sizes.

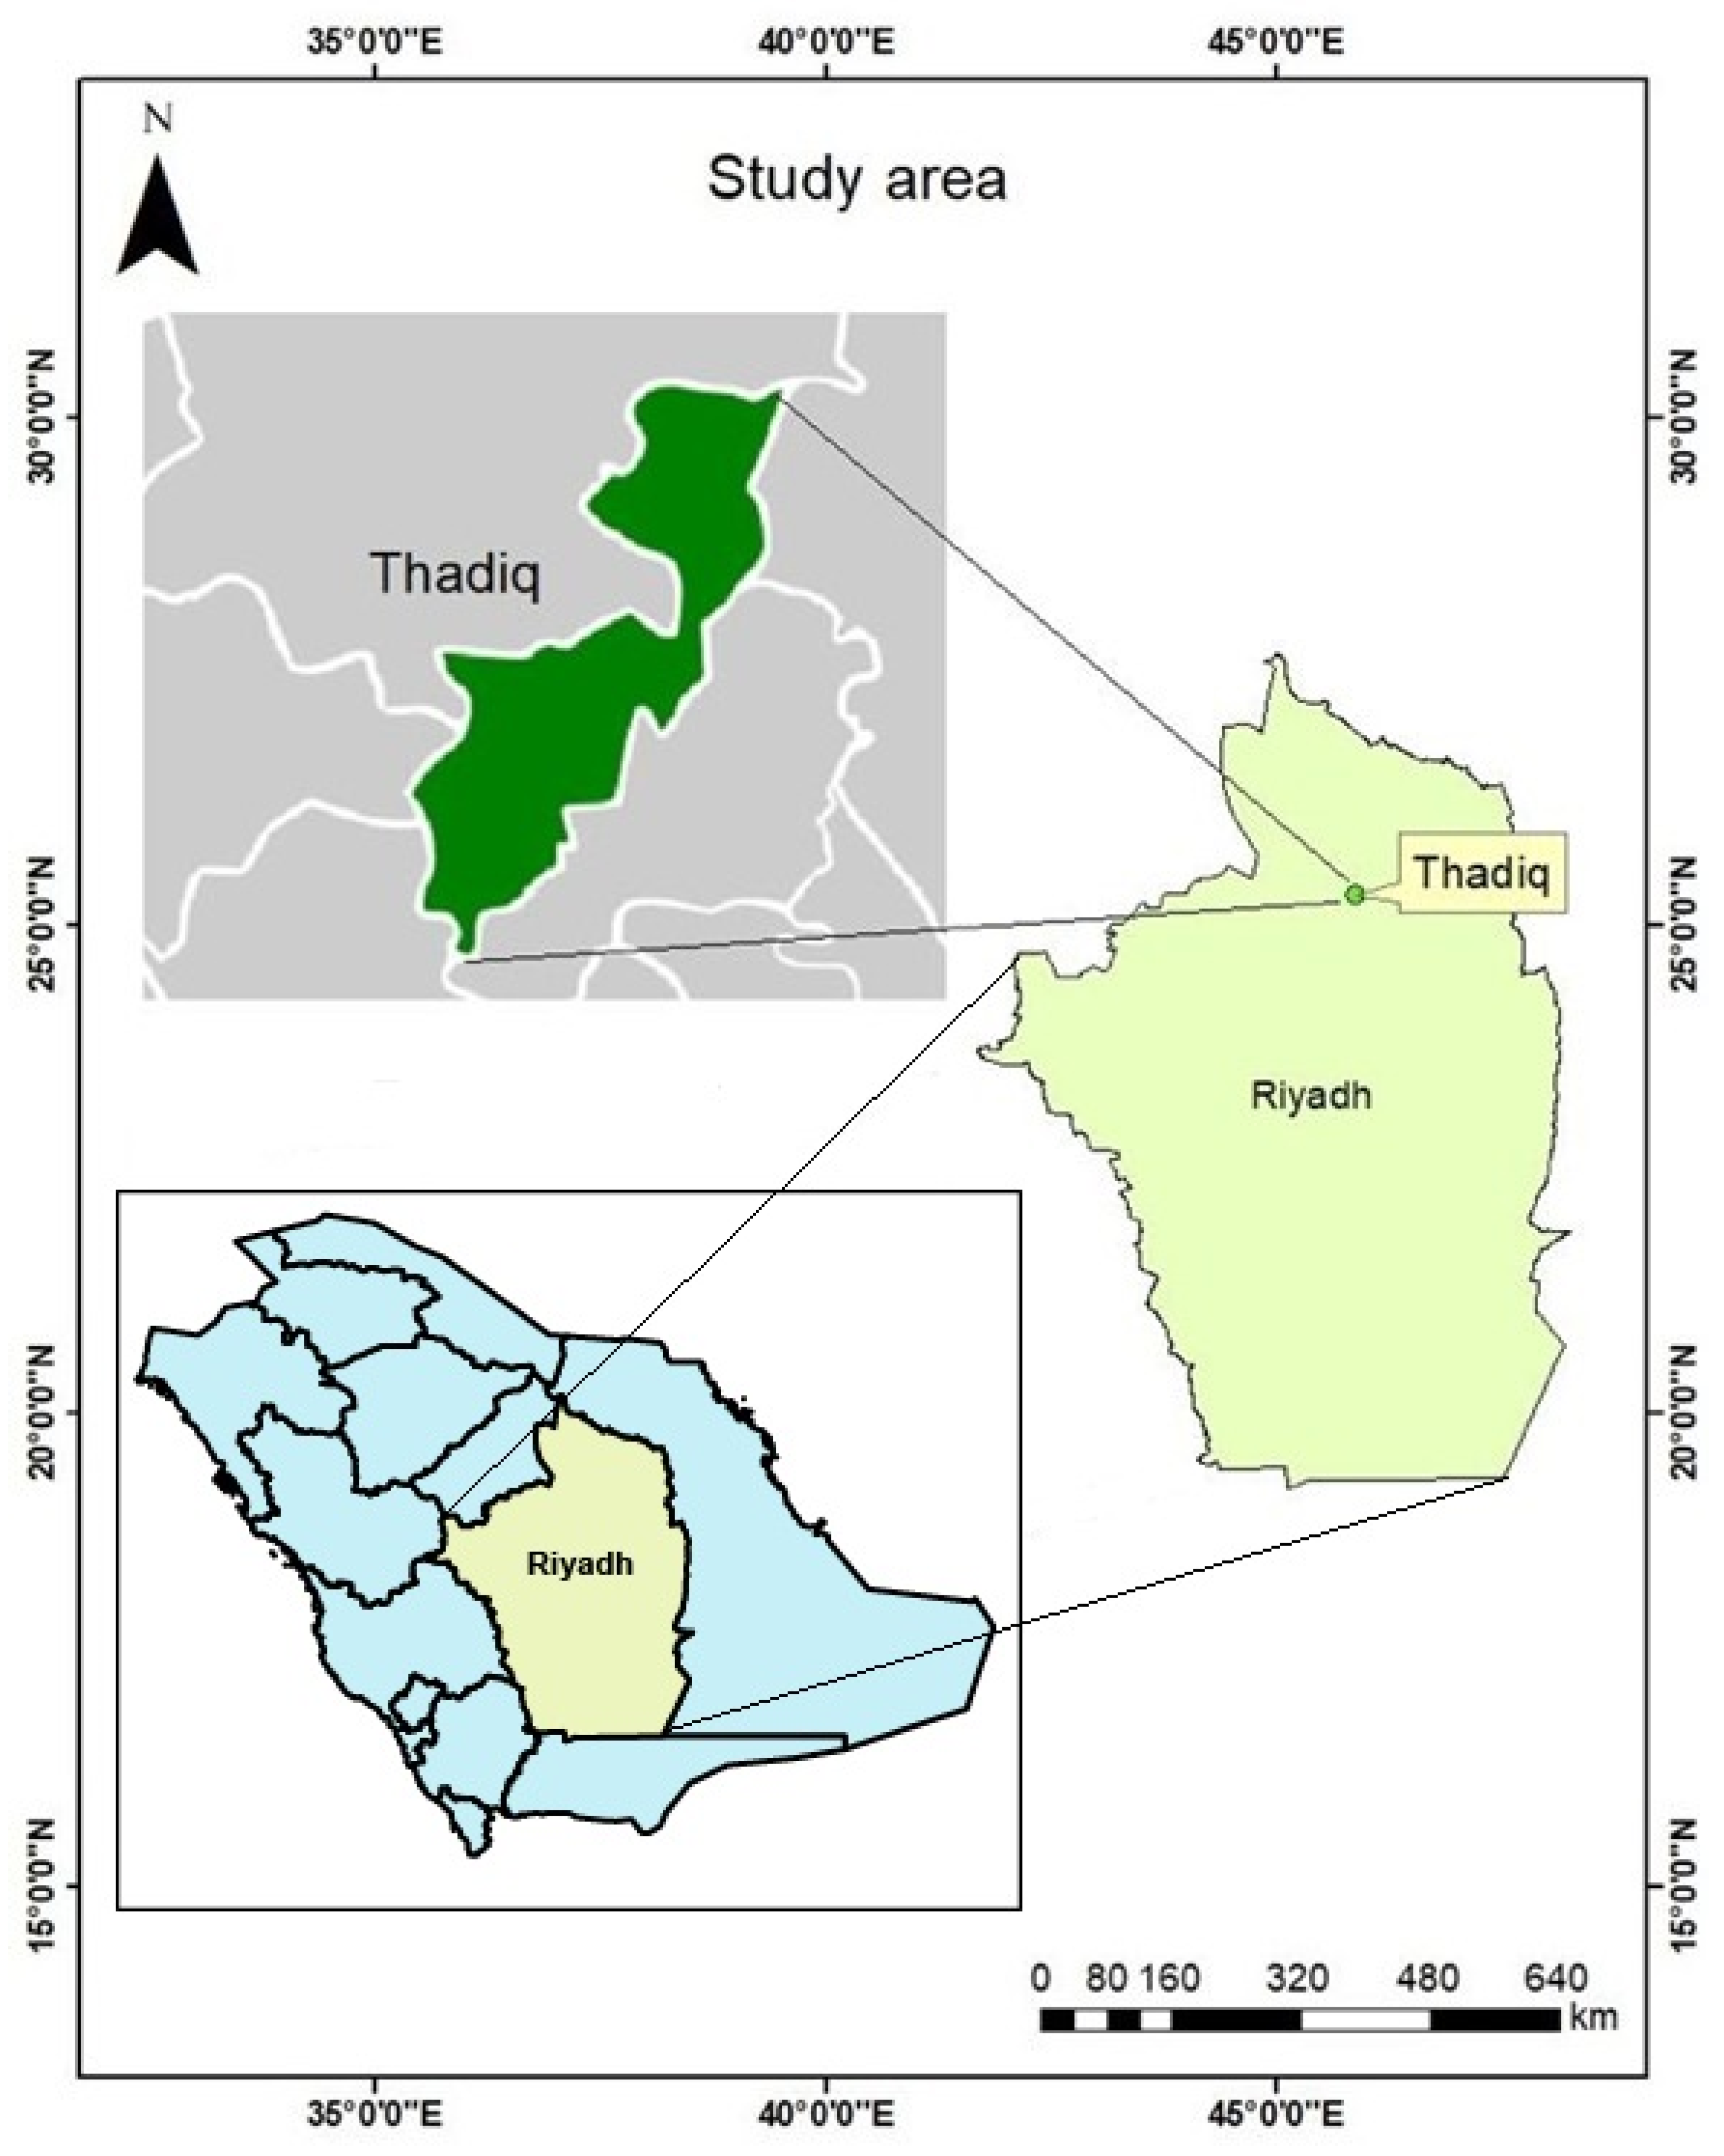
2. Materials and Methods

2.1. Experimental Design

2.1.1. Preparation of Soil Sample

Soil was brought from an area with a private agricultural project located in the Thadeq Governorate in central Saudi Arabia (25°17′40″ N, and 45°52′55″ E). Figure 1 shows the geographical map of the sampling sites. Soil samples were collected from one site at the surface soil layer (0–30 cm) and brought to the laboratory. Soil was air-dried and sieved through a 2-mm sieve for analysis. Soil texture was determined by the hydrometer method [17]. Soil pH was measured using a digital pH meter (WTW pH 315i, Weilheim, Germany) in a saturated soil paste [18]. The electrical conductivity (EC) was measured in a saturated paste extract using a digital EC meter (Jenway 4510 conductivity meter, Stone, Staffordshire, UK). Calcium carbonate was determined using a Calcimeter (Eijkelkamp, Agriearch Equipment, Giesbeek, the Netherlands). Soil organic matter was measured according to [18]. The physio-chemical characteristics of soil are presented in Table 1.

2.1.2. Biochar Preparation

Biochar derived from date palm residues, such as fronds and rachis, were exposed to direct sunlight to dry out and then cut in to small pieces (5–10 cm). The date palm pieces were packed tightly in a stainless-steel cylinder (50 cm radius and 80 cm length) to minimize air volume and to provide nearly oxygen-free conditions. The date palm pieces were put into an oven and were subjected to pyrolysis at three different temperatures: 300 °C, 500 °C, and 700 °C for 3 h, which were designated as T300, T500, and T700. Then the biochar was ground and divided by a mechanical sieve into three parts according to the following order less than 0.5, 0.5–1.0, and 1–2 mm, which were designated as D0.5, D1, and D2, respectively. The pH of the biochar was measured in a suspension of biochar-to-water ratio of 1:10, and also the EC was measured in 1:10 extract of biochar-to-water [19].

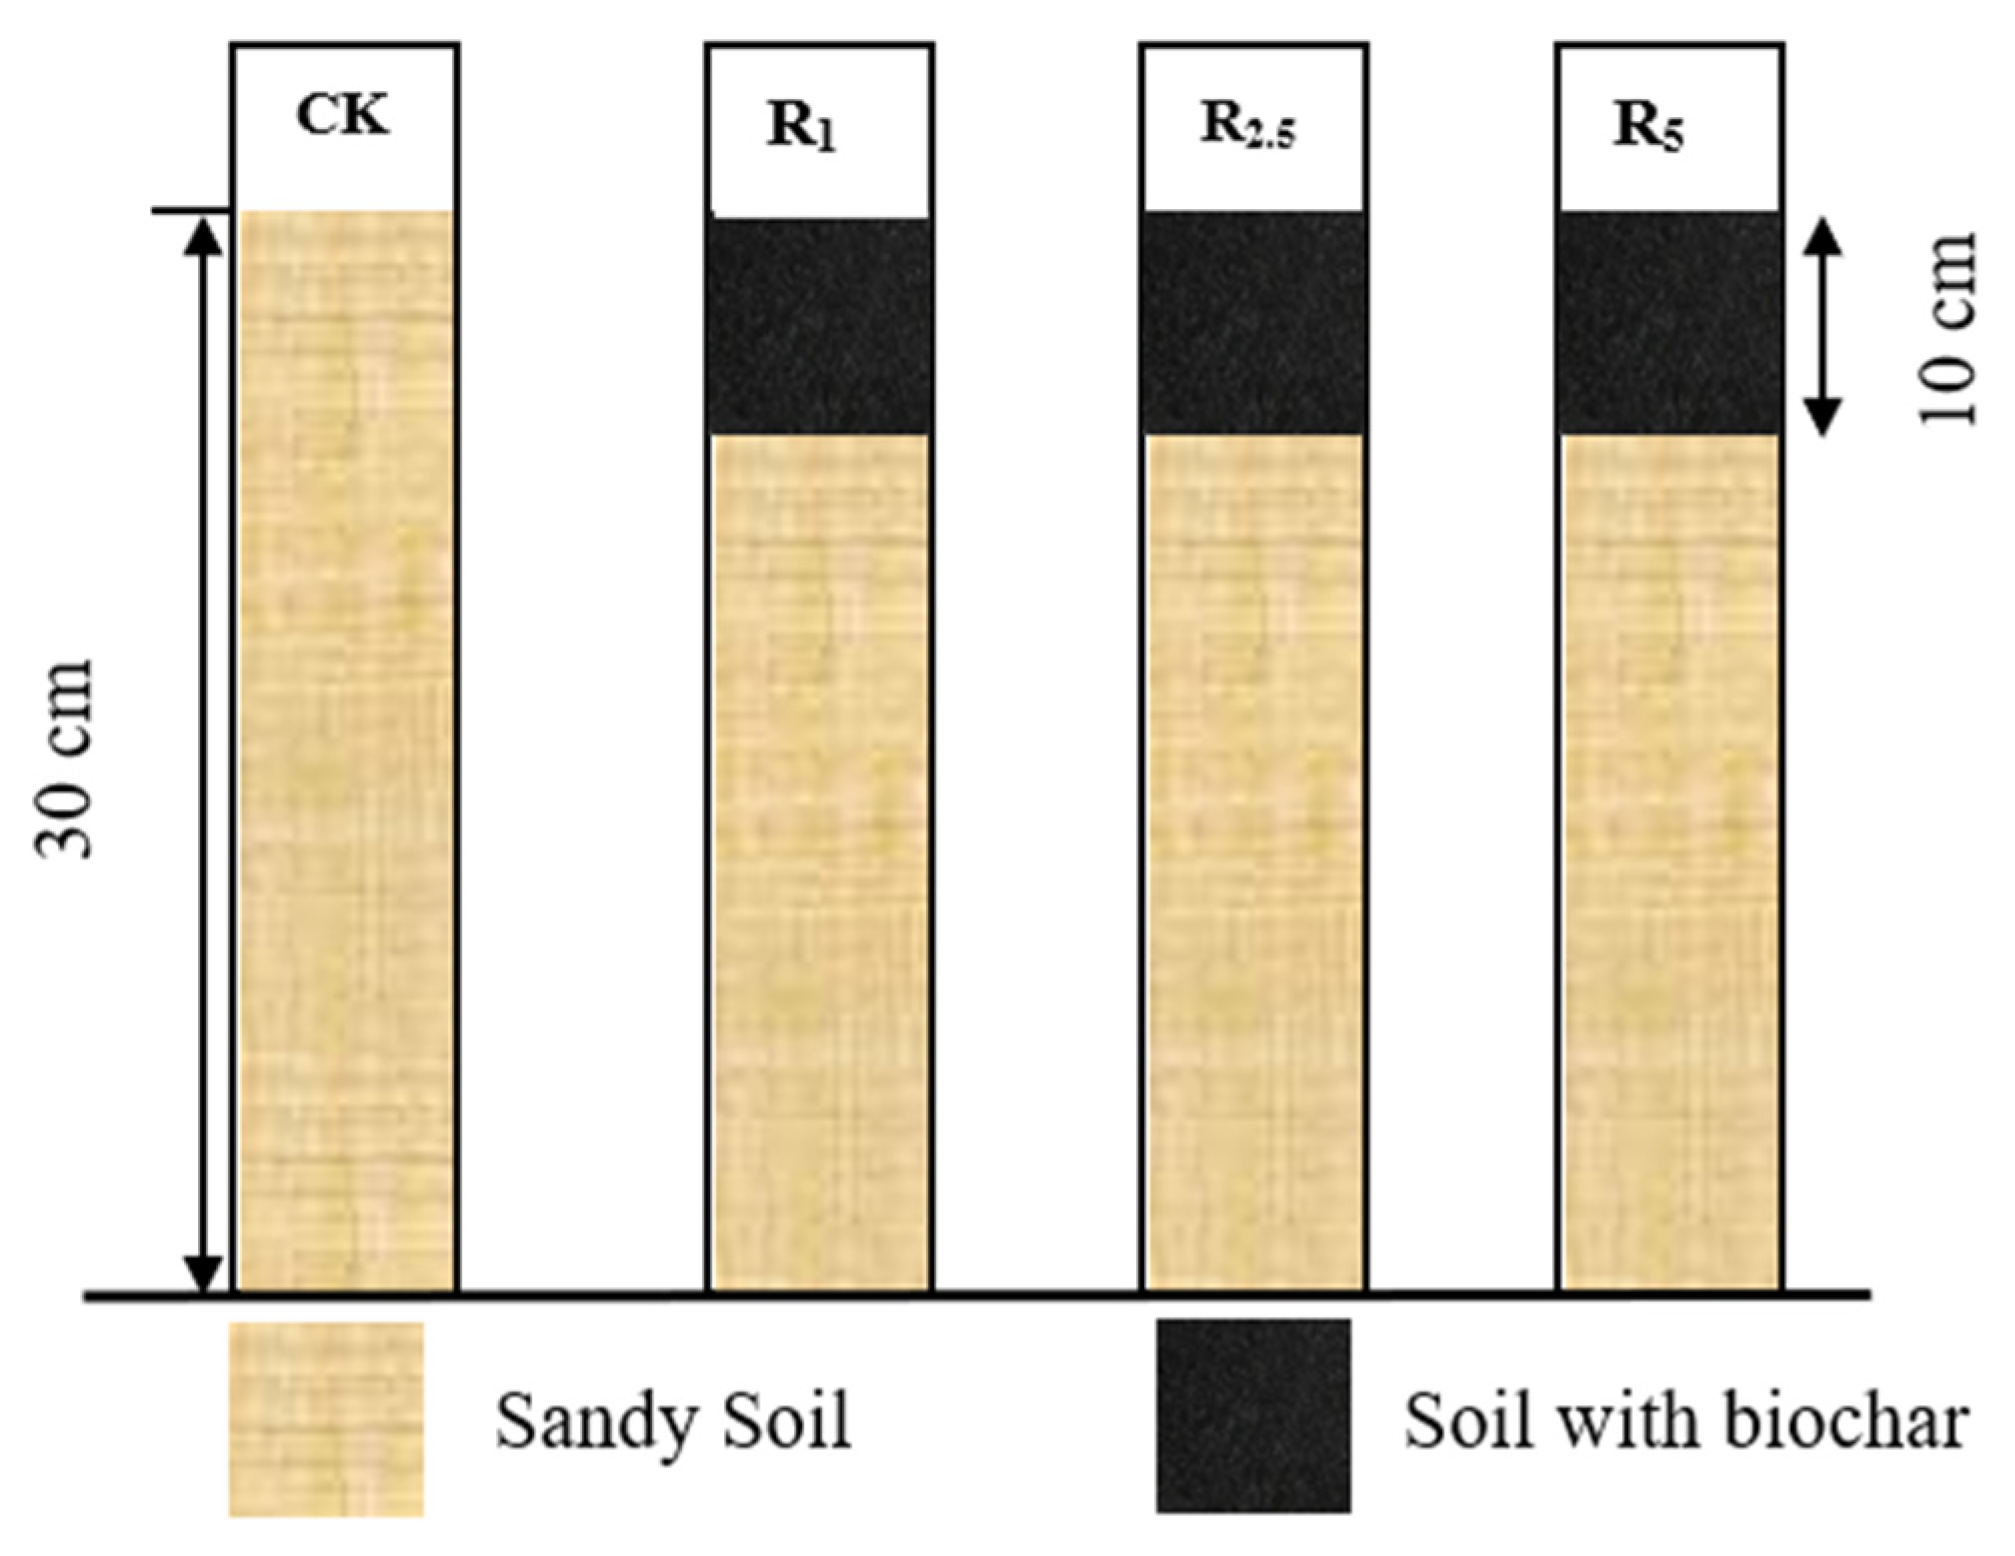
2.1.3. Soil Columns Preparations

Soil columns were made of transparent plastic, and the bottoms were closed off using filter paper and gauze fabric. The columns were 45 mm in internal diameter and 400 mm in height. The control column was packed to the 30-cm depth with 763.02 g of soil, which had an average bulk density of 1.6 g cm3 (Figure 2). There was no soil in the top 20 cm of the columns.
Biochar treatments are shown in Table 2. Biochar mixtures were added to the top 10 cm of each column in three and application rates were 1%, 2.5%, and 5% (10, 25, 50 g Kg−1 soil, respectively). Columns were placed vertically in a wooden holder inside a laboratory room, where the temperature was 22 ± 3 °C.

2.2. Cumulative Evaporation

Every week, 25 mL of tap water (EC = 1.4 dS m−1) was added to the columns. Water was added for six weeks (six cycles) and there were three replicates for each treatment for total number 84 columns in the experiment. Cumulative evaporation was measured daily by weighing each soil column. At the end of the six cycles, each column was divided into sections: three sections from the top (10 cm) layer of the column and 4 layers (5 cm) sections from the remainder (20 cm) of the column.

2.3. Cumulative Infiltration

Infiltration was measured with a mini-disk infiltrometer that held 100 cm3 water (model M11, 0.5 cm suction; Decagon Devices, Pullman, WA, USA). The disk infiltrometer was in full contact with the soil surface before measurements were taken. The volume of water infiltrated was recorded every 30 s for 10 min. Each treatment was replicated three times. Cumulative infiltration was based on the Philip (1957) equation, shown in Equation (1), and the infiltration rate (i) was established by Equation (2).
I = S t + At
where: I the cumulative infiltration (cm), S is the sorptivity (cm min−0.5), and A is a constant related to the hydraulic conductivity. A mathematical representation for Equation (1) obtained by plotting cumulative infiltration versus the square root of time, and a second-order polynomial fitted to the measured data.
i = 1 2 S   t 1 2 + A
obtained a mathematical representation for Equation (2) by plotting infiltration rate versus 1/(2 t 0.5) and fitting a linear equation to the measured data.

2.4. Saturated Hydraulic Conductivity (KS)

Saturated hydraulic conductivity (KS) was measured by the constant head method and, calculated according Darcy’s equation, (3):
K S = V   l A   t   ( l + h )
where Ks is the saturated hydraulic conductivity (cm s−1), V is the volume of outflow (cm3), l is the length of soil column (cm), A is the cross-sectional area of the soil column (cm2), t is time (s), and h is the constant head of water (cm).

2.5. Statistical Analysis

Means were determined. Statistical analyses were carried out using ANOVA and the least significant difference (LSD at p < 0.05) was determined using the software package for Windows (IBM SPSS Statistics 21 Core System, IBM Corporation 2019).

3. Results and Discussion:

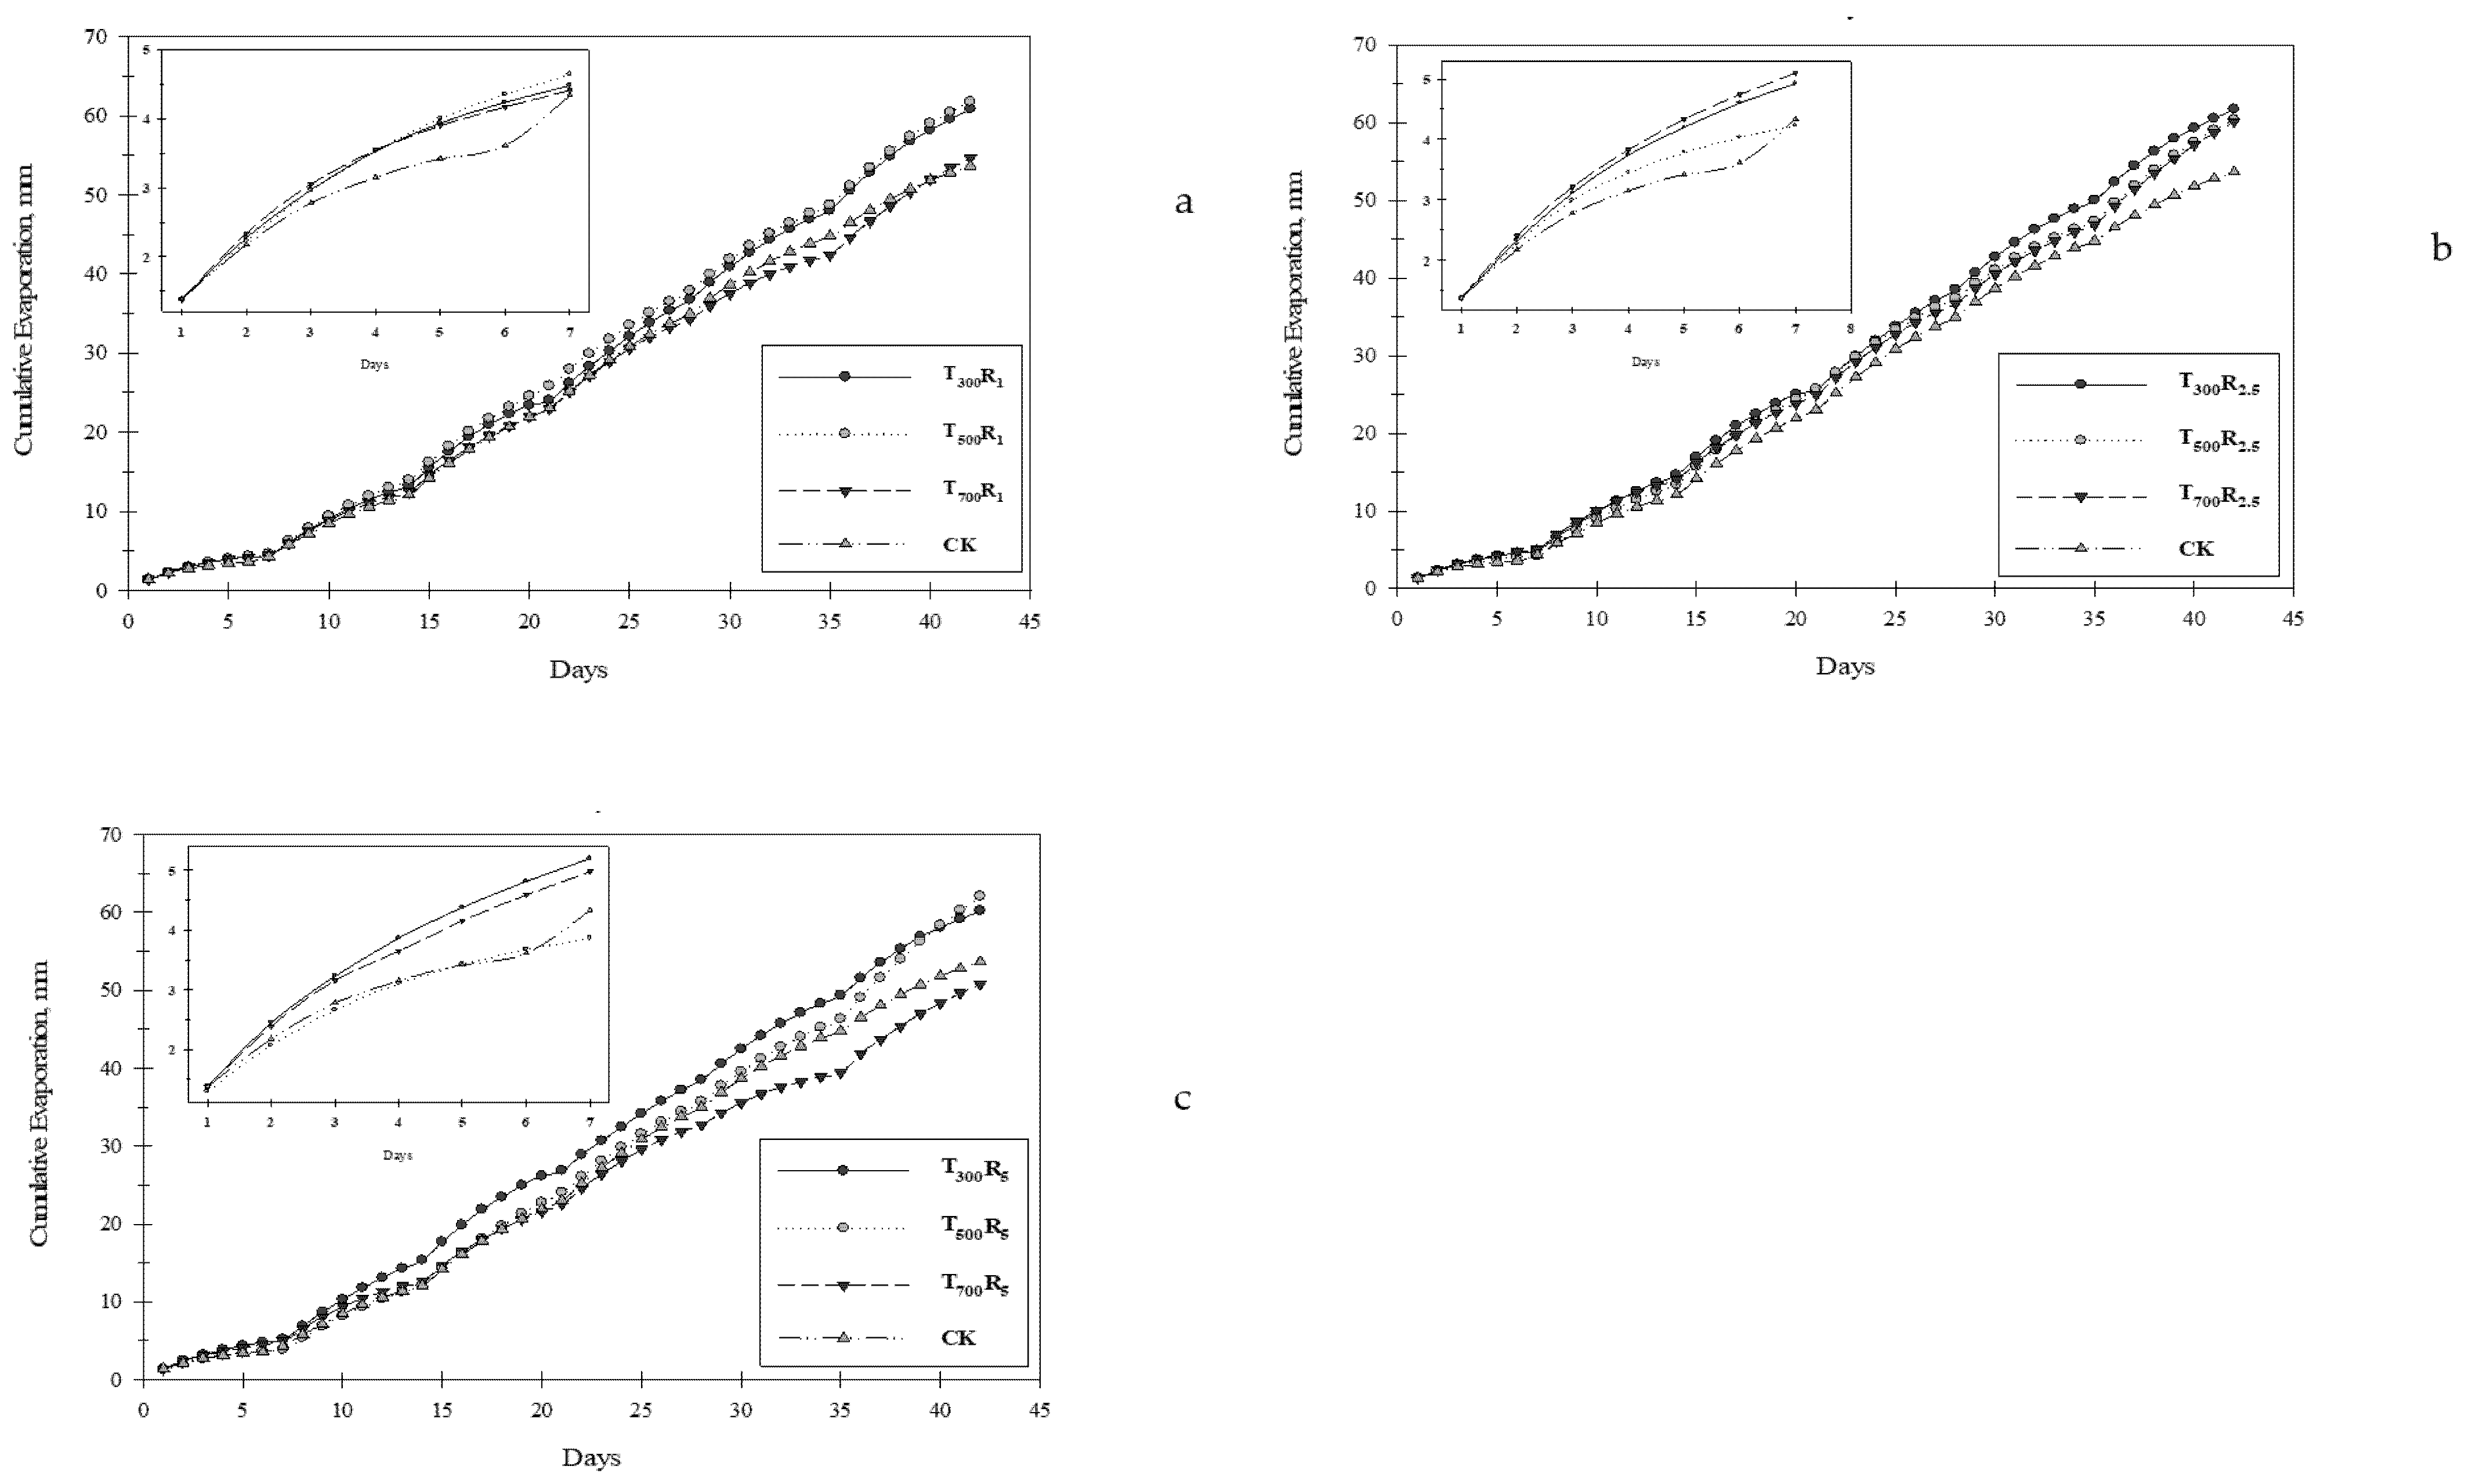
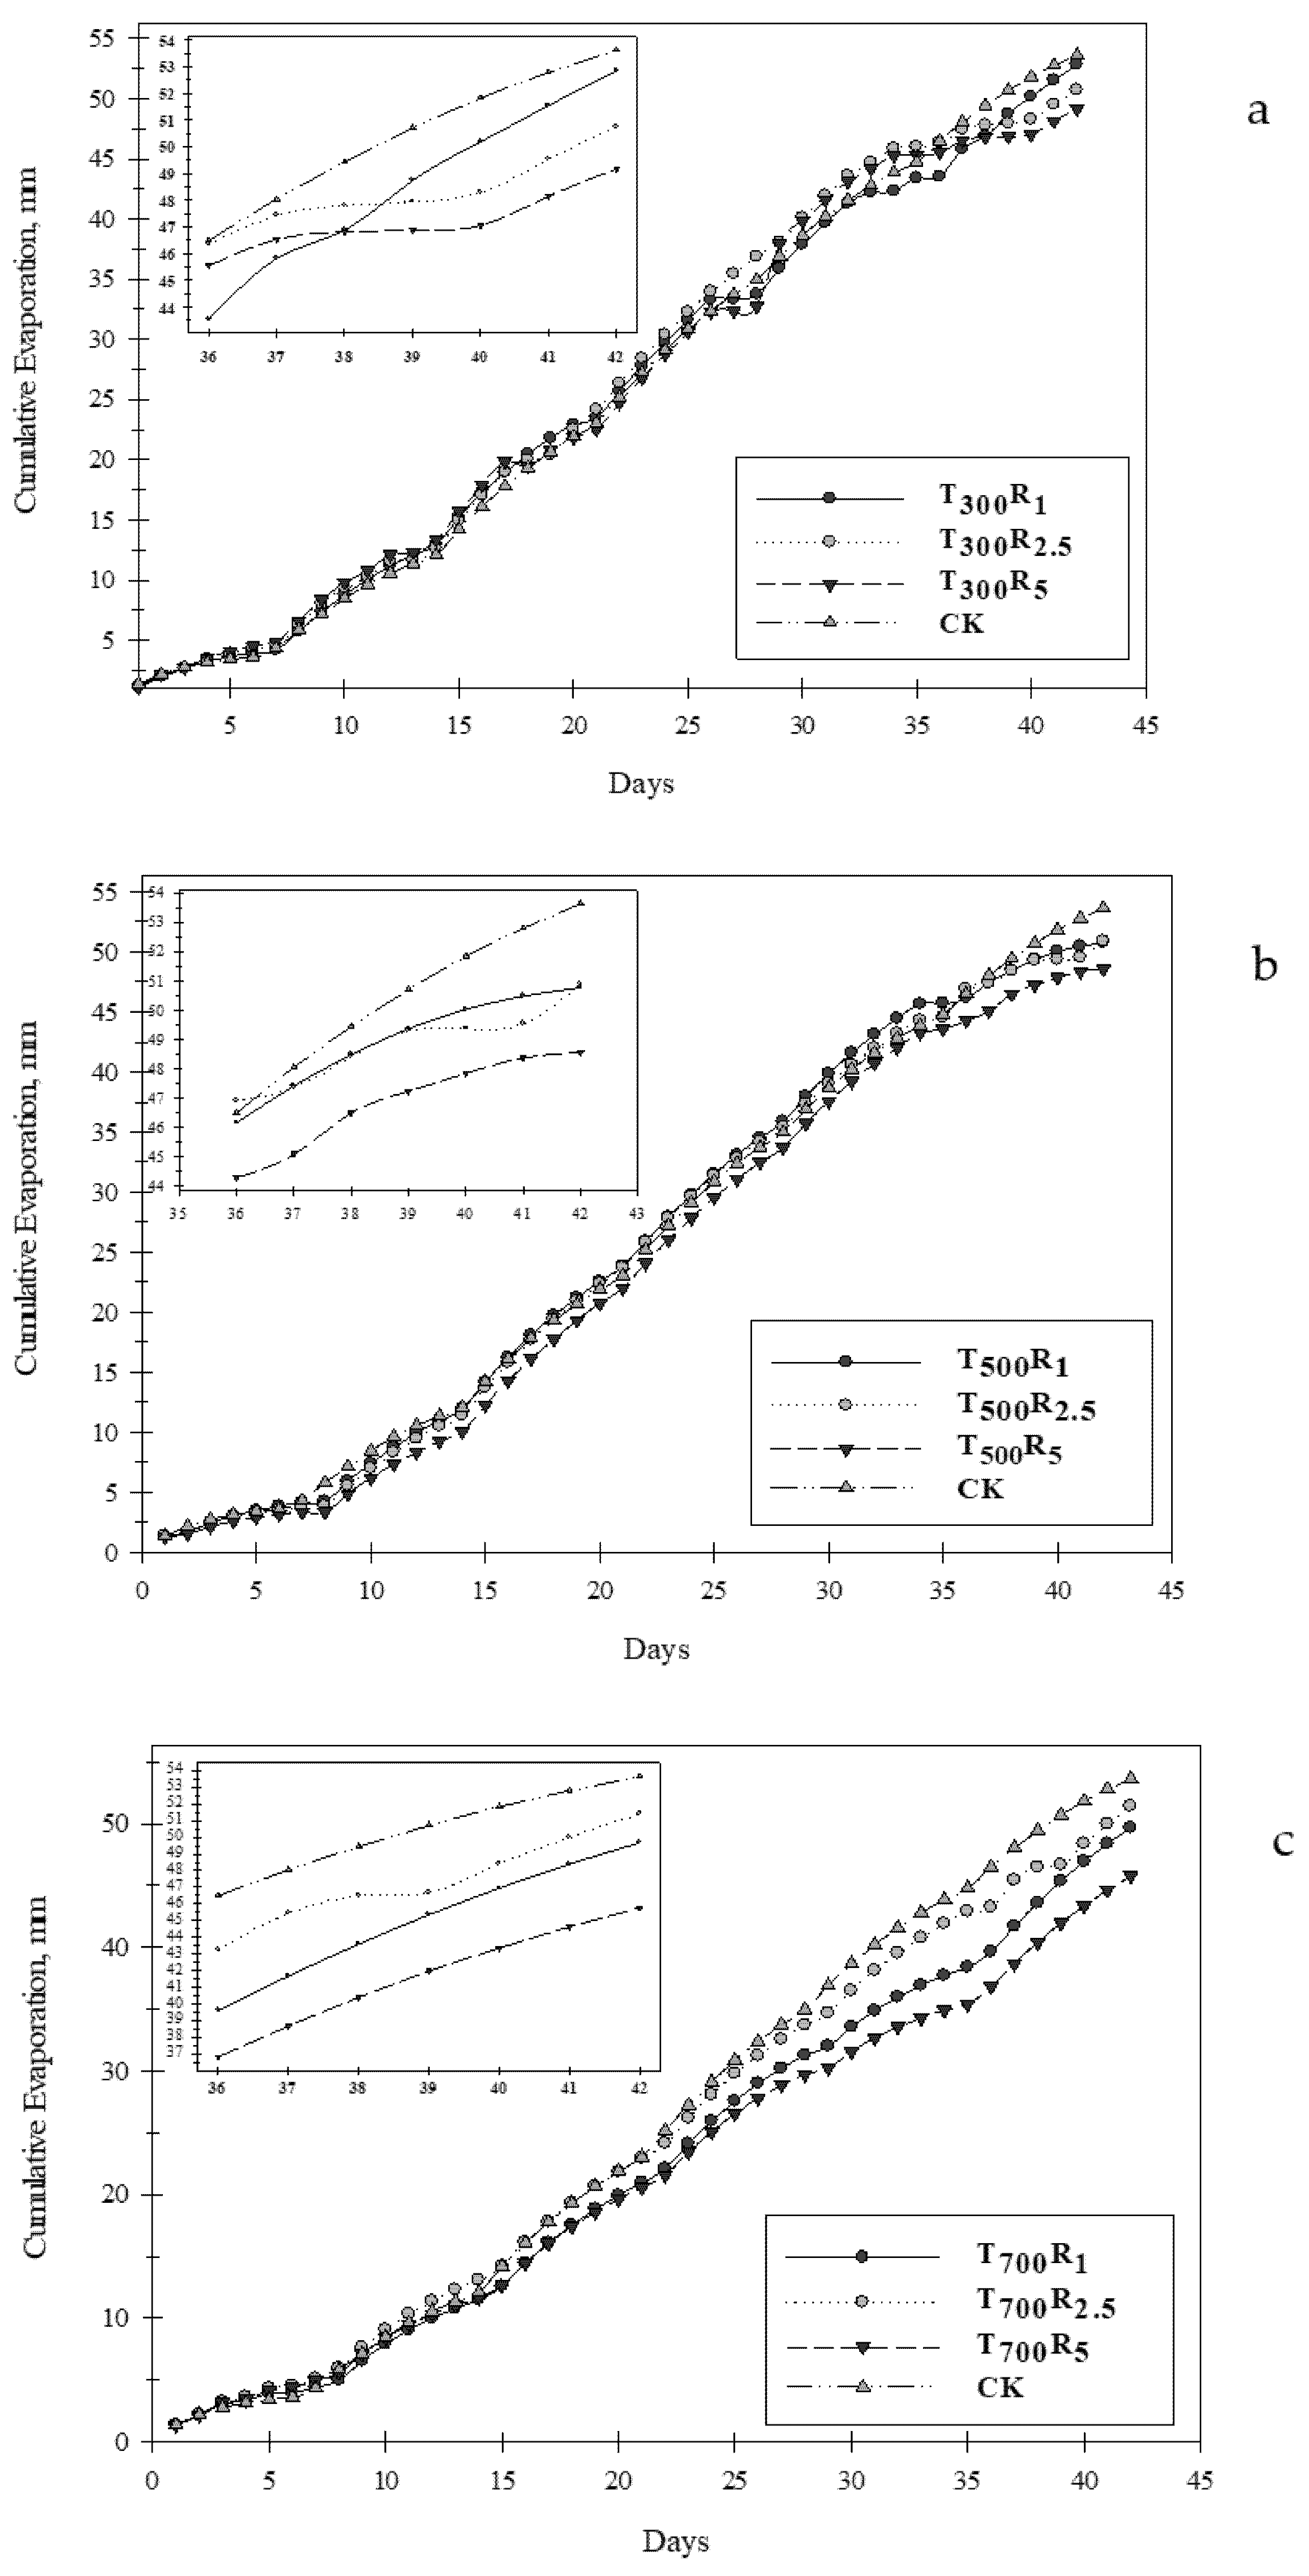
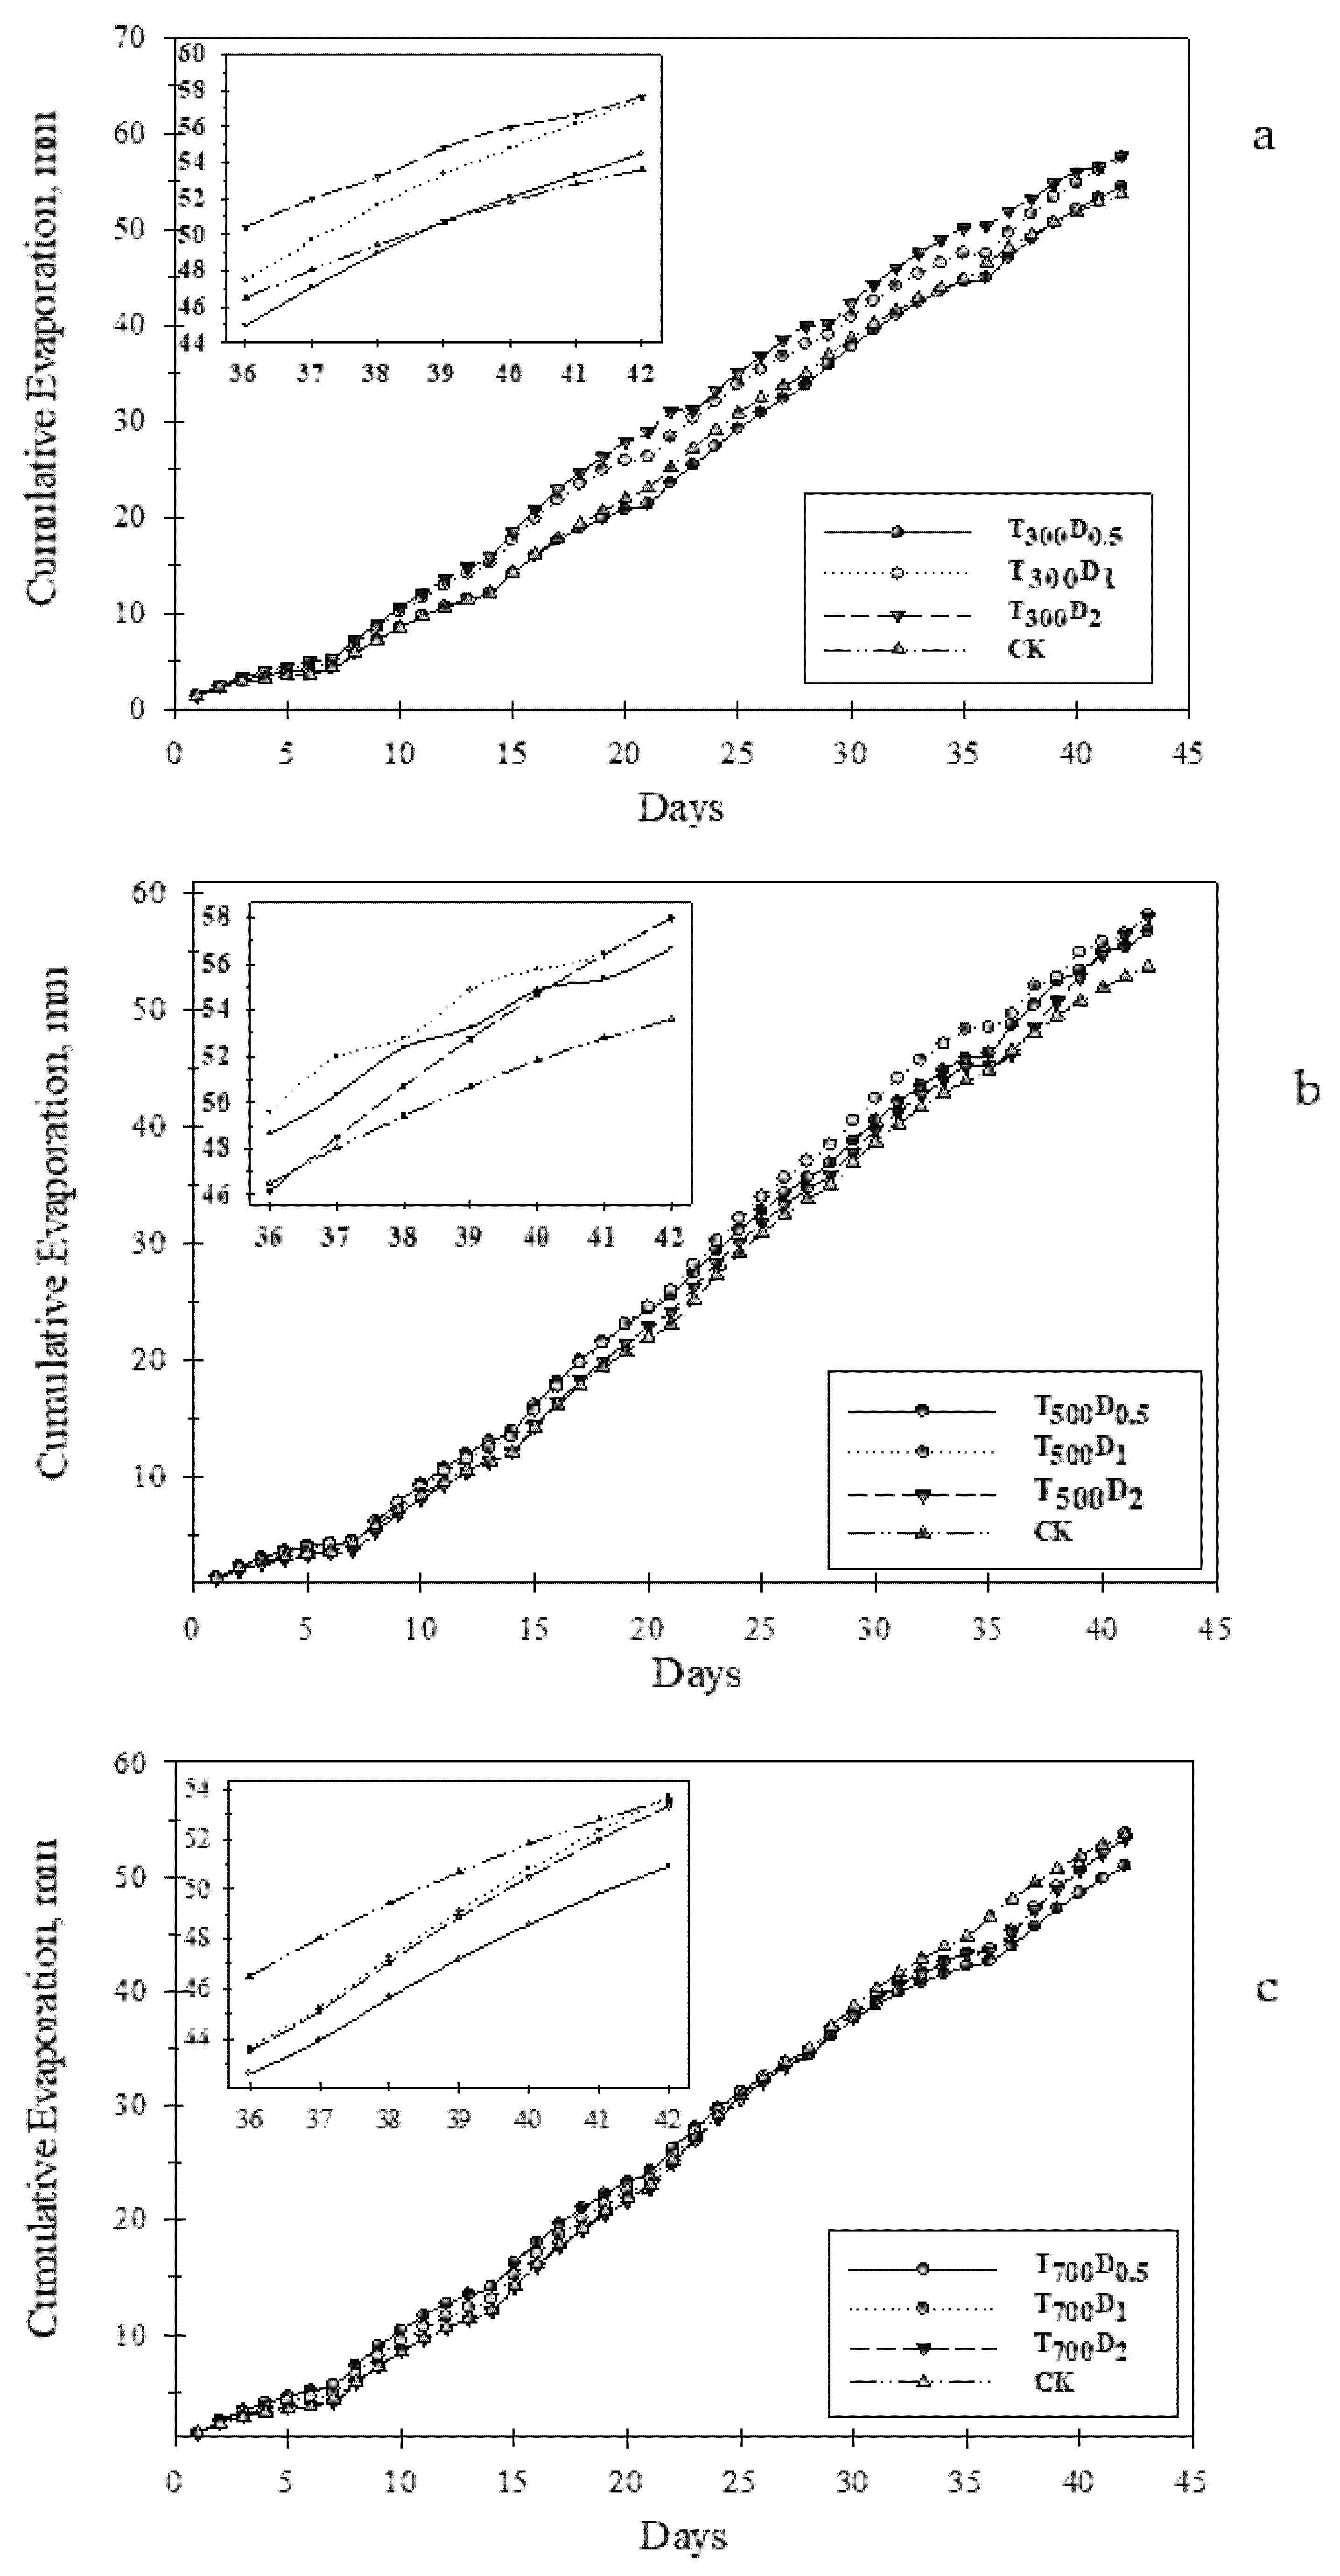
3.1. Cumulative Evaporation

3.1.1. Influence of Temperature of Pyrolysis

Figure 3 shows the influence of the pyrolytic temperature and different application rates on cumulative evaporation. The total amount of water applied to the soil columns throughout all the experiment was 94.36 mm. Compared to the control, addition of biochar at the rate of 1% and produced at the three different temperatures led to an increase in cumulative evaporation by 13.5%, 15.2%, and 1.9% for treatments T300, T500, and T700, respectively (Figure 3a), the increased was in specific period of evaporation cycles (especially in 15–42 days). Compared to the untreated soil Addition of biochar at the rate of 2.5% (w/w) at the three temperatures (Figure 3b) decreased the cumulative evaporation by 15.1%, 12.6% and 12.1% for treatments T300, T500, and T700, respectively. However, the application of the biochar with high rate 5% (w/w) increased the cumulative evaporation by 12.2% and 15.7% for T300 and T500, respectively (Figure 3c). Addition of biochar with highest pyrolytic temperature and highest rate (T700-R5) decreased cumulative evaporation by 5.32%. These finding could be attributed to the influences of the temperature of pyrolysis on the physical and chemical properties of the biochar and decomposition of its structure and chemical bonds. The increase of cumulative evaporation could be due to the fact that addition of biochar produced at lower pyrolytic temperatures could retain more water, which caused an increase in evaporation, especially because the biochar was placed in the top of columns. Retained water tends to be lost due to the high porosity of the biochar that has macropores [20,21]. This also could be due to the effect of pyrolytic temperature on biochar stability [22]. An increase of temperature of pyrolysis could affect the availability of elements like nitrogen [23]. Domingues et al. [24]. reported that an increase in biochar pyrolytic temperature from 450 °C to 750 °C decreased the cation exchange capacity that resulted in reduction in adsorption capacity of nutrients. A high temperature of pyrolysis might decrease pore volume and surface area and increase the ash content of biochar [25,26]. A low pyrolytic temperature is an important factor that could increase nutrient availability and functional groups [27].

3.1.2. Effect of Application Rate

Biochar reduced cumulative evaporation significantly (p > 0.05), when it was added at a high rate compared to the control, when biochar produced at a pyrolytic temperature of 300 °C was added with different rates, cumulative evaporation decreased in all of the cycles at all application rate tested by 1.4%, 5.4%, and 8.3% for rates 1%, 2.5%, and 5% (w/w), respectively (Figure 4a). When biochar produced at a pyrolytic temperature of 500 °C was added, cumulative evaporation decreased non-significantly by 1.4%, 0.42%, and 2.3% for of 1%, 2.5% and 5% (w/w) as the rates, respectively (Figure 4b). When biochar produced at a pyrolytic temperature of 700 °C (Figure 4c) and different dose 1%, 2.5%, and 5% (w/w) cumulative evaporation decreased by 7.4%, 4.1%, and 14.6% respectively (Figure 4c). Alkhasha et al. [28] found that cumulative evaporation was reduced by 29.4% and 14.6% when biochar was added at the high rates of 4% and 8%, respectively. This could be due to enhanced water retention by biochar and the reduction in macrospores of the sandy soil that they studied.

3.1.3. Impact of Diameter of Biochar

When biochar produced at a pyrolytic temperature of 300 °C was added, cumulative evaporation was increased (p > 0.05). The proportion of increased was 7.2% to 7.5% when the diameter of the biochar increased from <0.5 mm (D1) to 0.5 to 1.0 mm (D2) (Figure 5a). Compared to the control, cumulative evaporation increased 1.6% when biochar with a diameter < 0.5 mm was added. Biochar produced at 500 °C (Figure 5b) was added, the cumulative evaporation increased by 5.7%, 8.2%, and 8.11% for diameters less than 0.5 mm, 0.5–1 mm, and 1–2 mm, respectively. (Figure 5c) shown biochar produced at a pyrolytic temperature of 700 °C was added, cumulative evaporation decreased by 5.0% and 0.49% for diameters <0.5 mm and 1–2 mm, respectively, while cumulative evaporation increased non-significantly 0.27% when biochar with a diameter of 0.5 to 1 mm was added. Herath et al. [29] showed that the reduction of pores was correlated with the biochar application rate. Their detailed analysis of the soil pore system showed that some pore fractions were dependent not only on the rate of the biochar but also on its particle size. Mukherjee and Lal [30] showed that small particles of biochar reduced the volume of soil pores whose diameter was below 0.5 μm but increased the volume of larger pores with a diameter range between 0.5–500 μm.

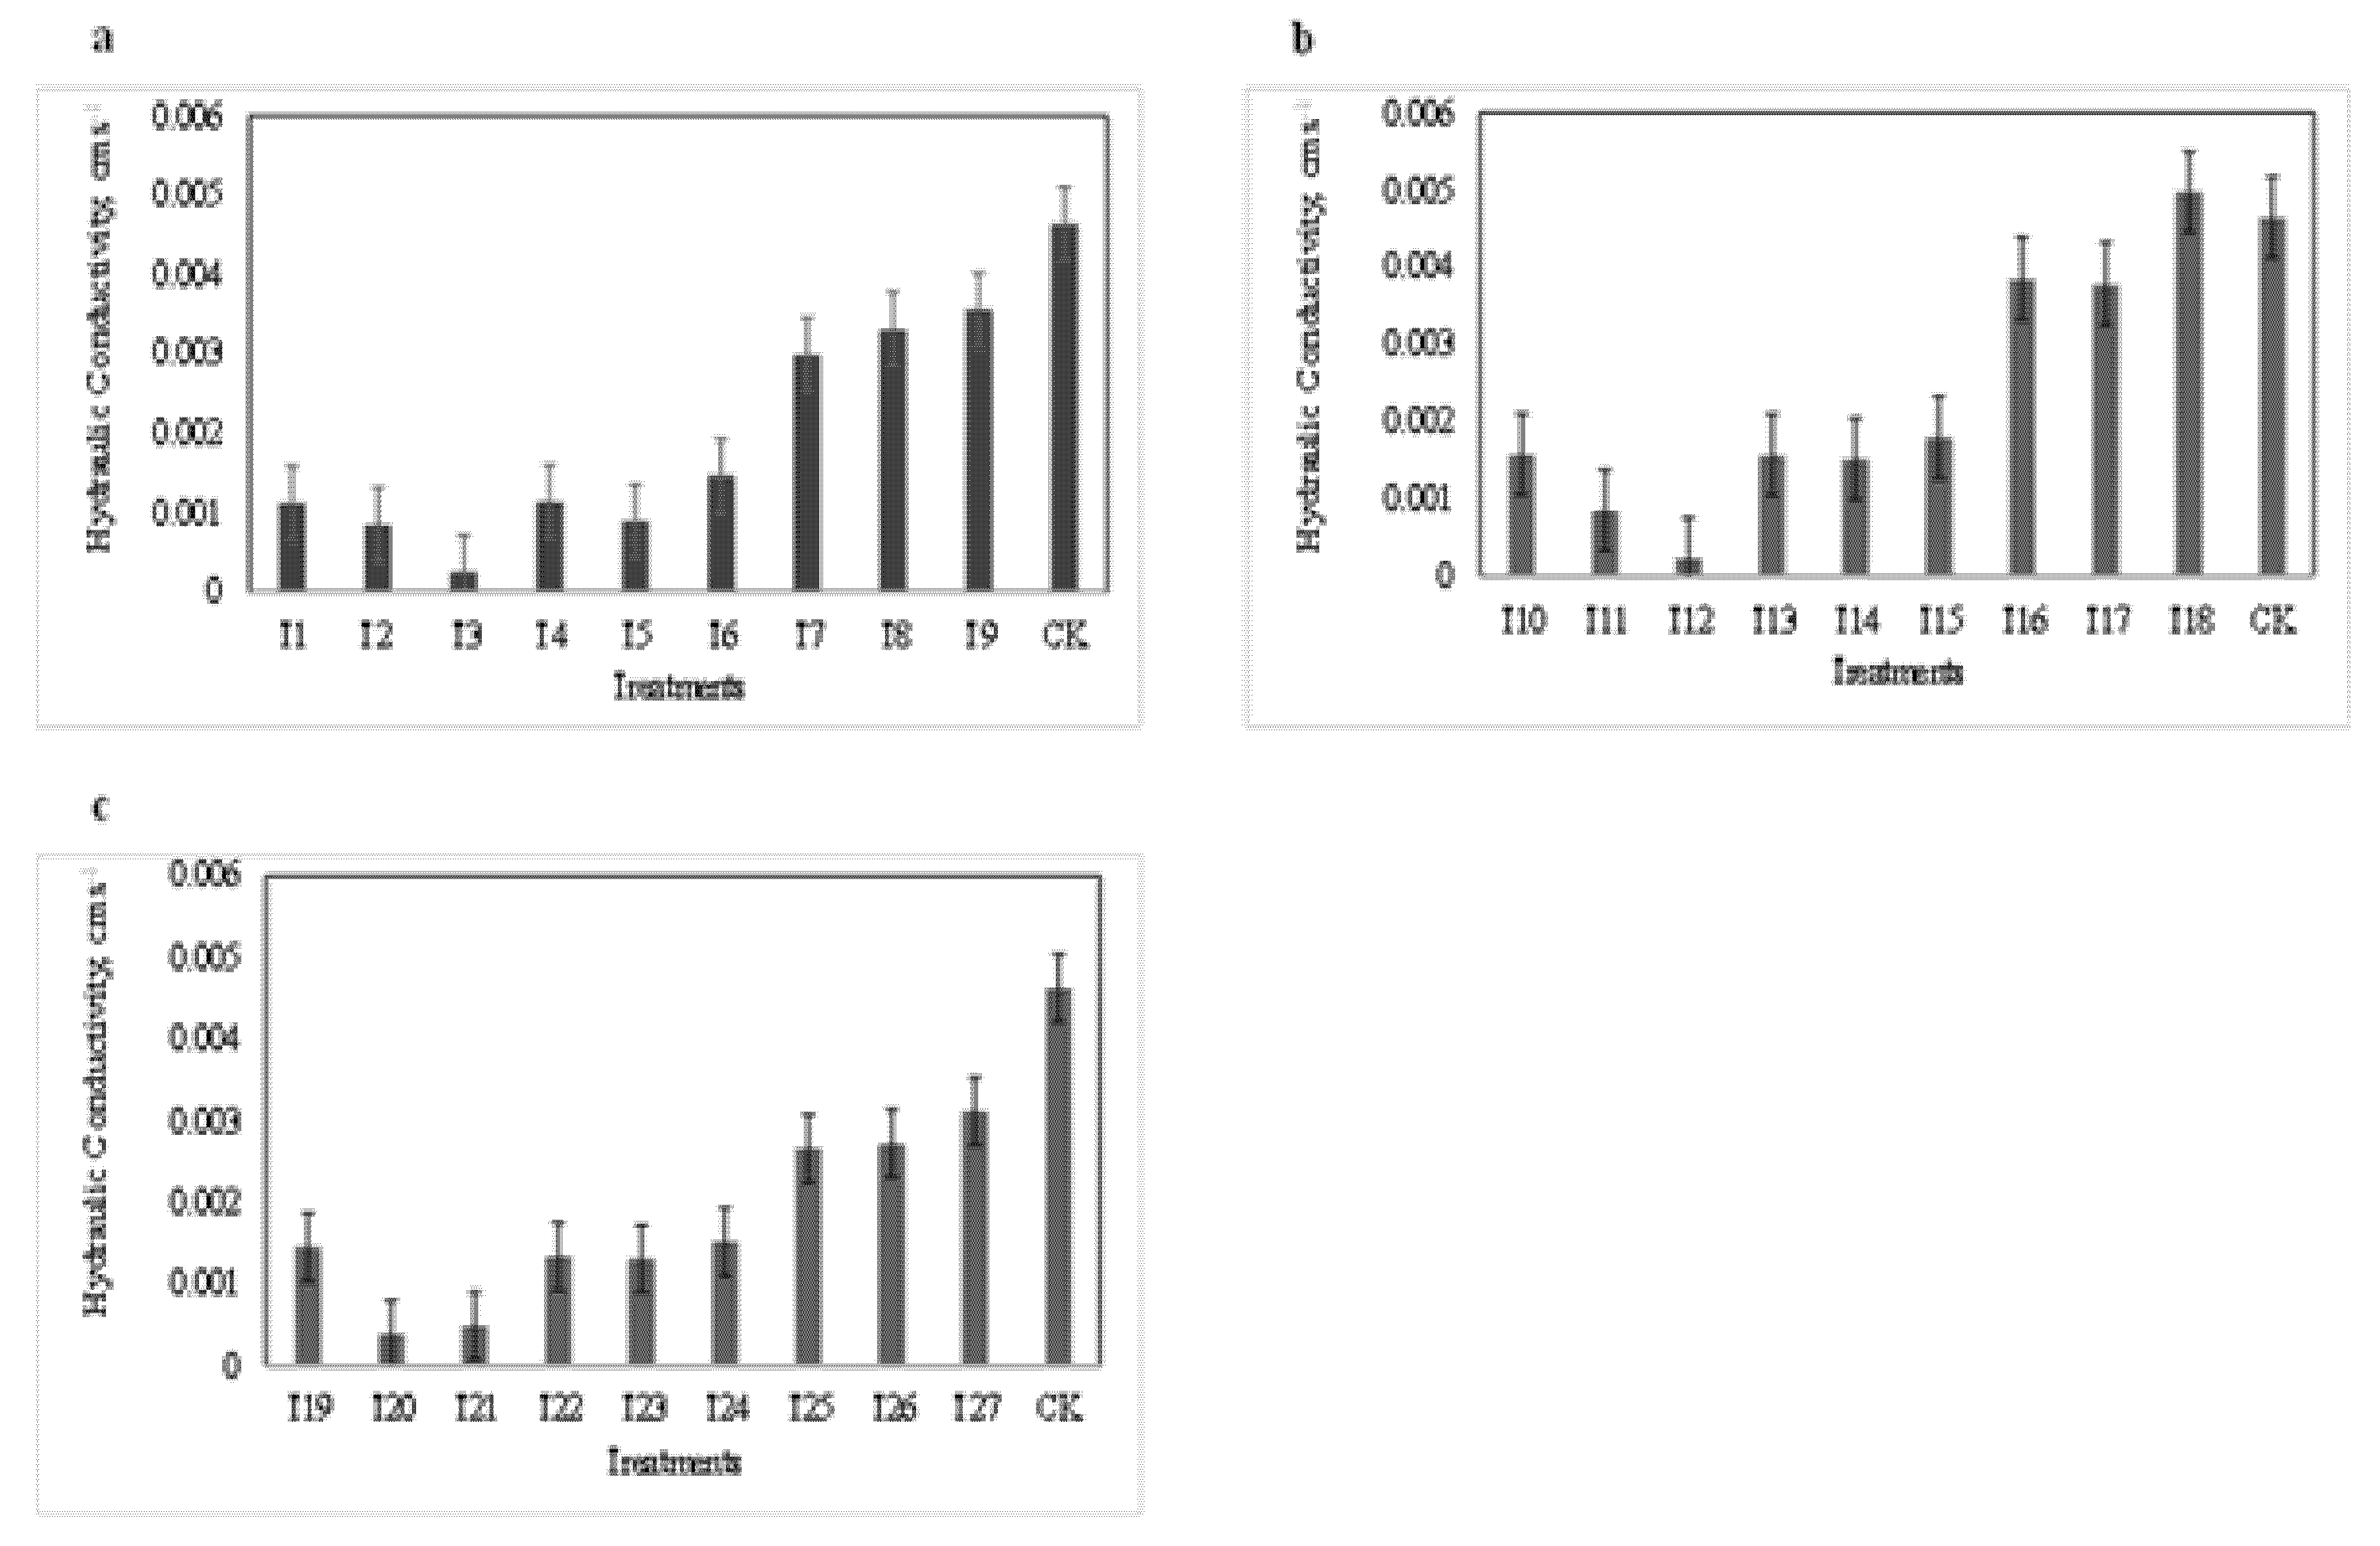
3.2. Saturated Hydraulic Conductivity

When biochar produced at a pyrolytic temperature of 300 °C was added, saturated hydraulic conductivity decreased significantly (p < 0.05) for all treatments (T1 to T9) (Figure 6a). Compared to the control, the highest decreases were 94.55% and 81.6% for T3 (<0.5 mm diameter; application rate of 5%) and T2 (<0.5 mm diameter; application rate of 2.5%), respectively. Compared to the control, the lowest decreases were 22.98% and 28.31% for T9 (1–2 mm diameter; application rate of 5%) and T8 (1–2 mm diameter; application rate of 2.5%), respectively.
When biochar produced at a pyrolytic temperature of 500 °C was added, Ks decreased in T10 to T17, and the decrease varied between 16.8% and 94.9% for T16 and T12, respectively (Figure 6b). Compared with the untreated soil, Ks increased by 7.1% in T18 (diameter of 1–2 mm and application rate of 5%). When biochar produced at a pyrolytic temperature of 700 °C was added, Ks decreased significantly (p < 0.05) compared with the control. The decreases were 68.5%, 91.6%, 89.4%, 71.0%, 71.6%, 67.1%, 42.4%, 41.2% and 32.6% for T19 to T27, respectively. Compared to the control, the highest decreases were 91.6% and 89.4% for T20 (<0.5 mm diameter and 2.5% application rate) and T21 (<0.5 mm diameter and 5% application rate), respectively. The decease of Ks could be attributed to the rearrangement of soil particles and the formation of micro-porosity. These results were similar to those reported earlier [31,32,33]. Since the biochar decrease saturated hydraulic conductivity of soils, it can be prevented groundwater contaminations especially in high temperature of arid environment [34,35].

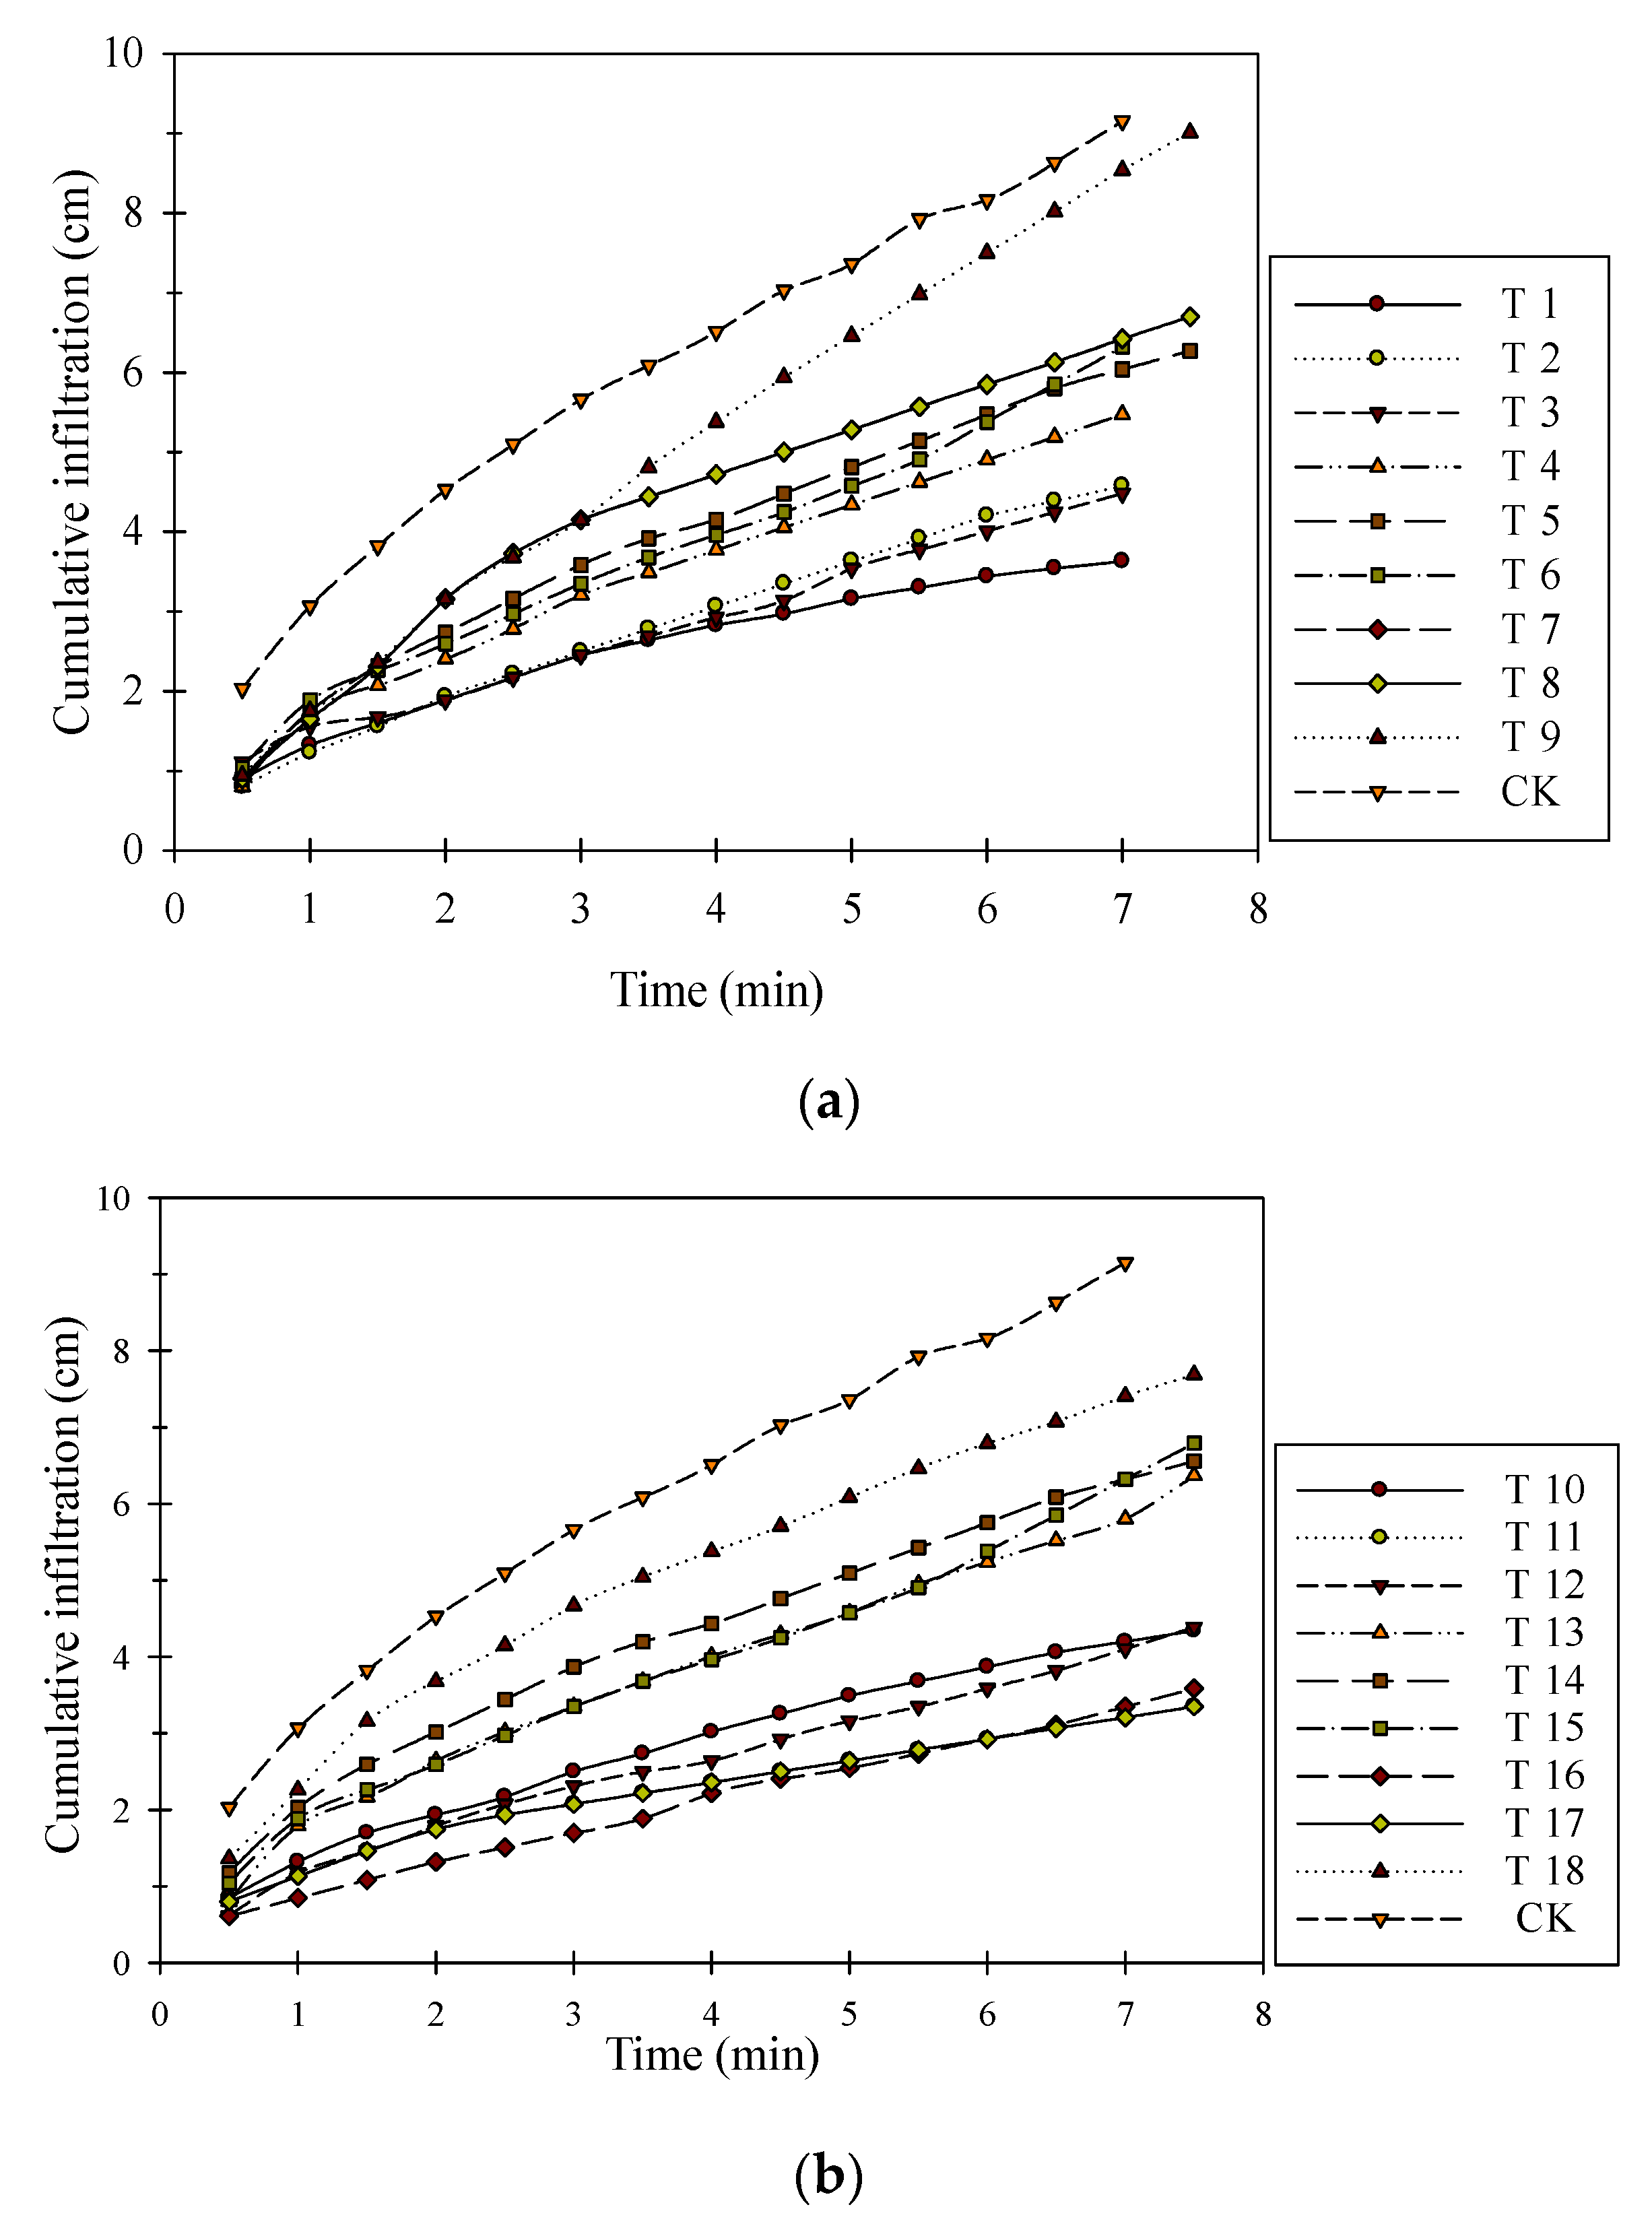
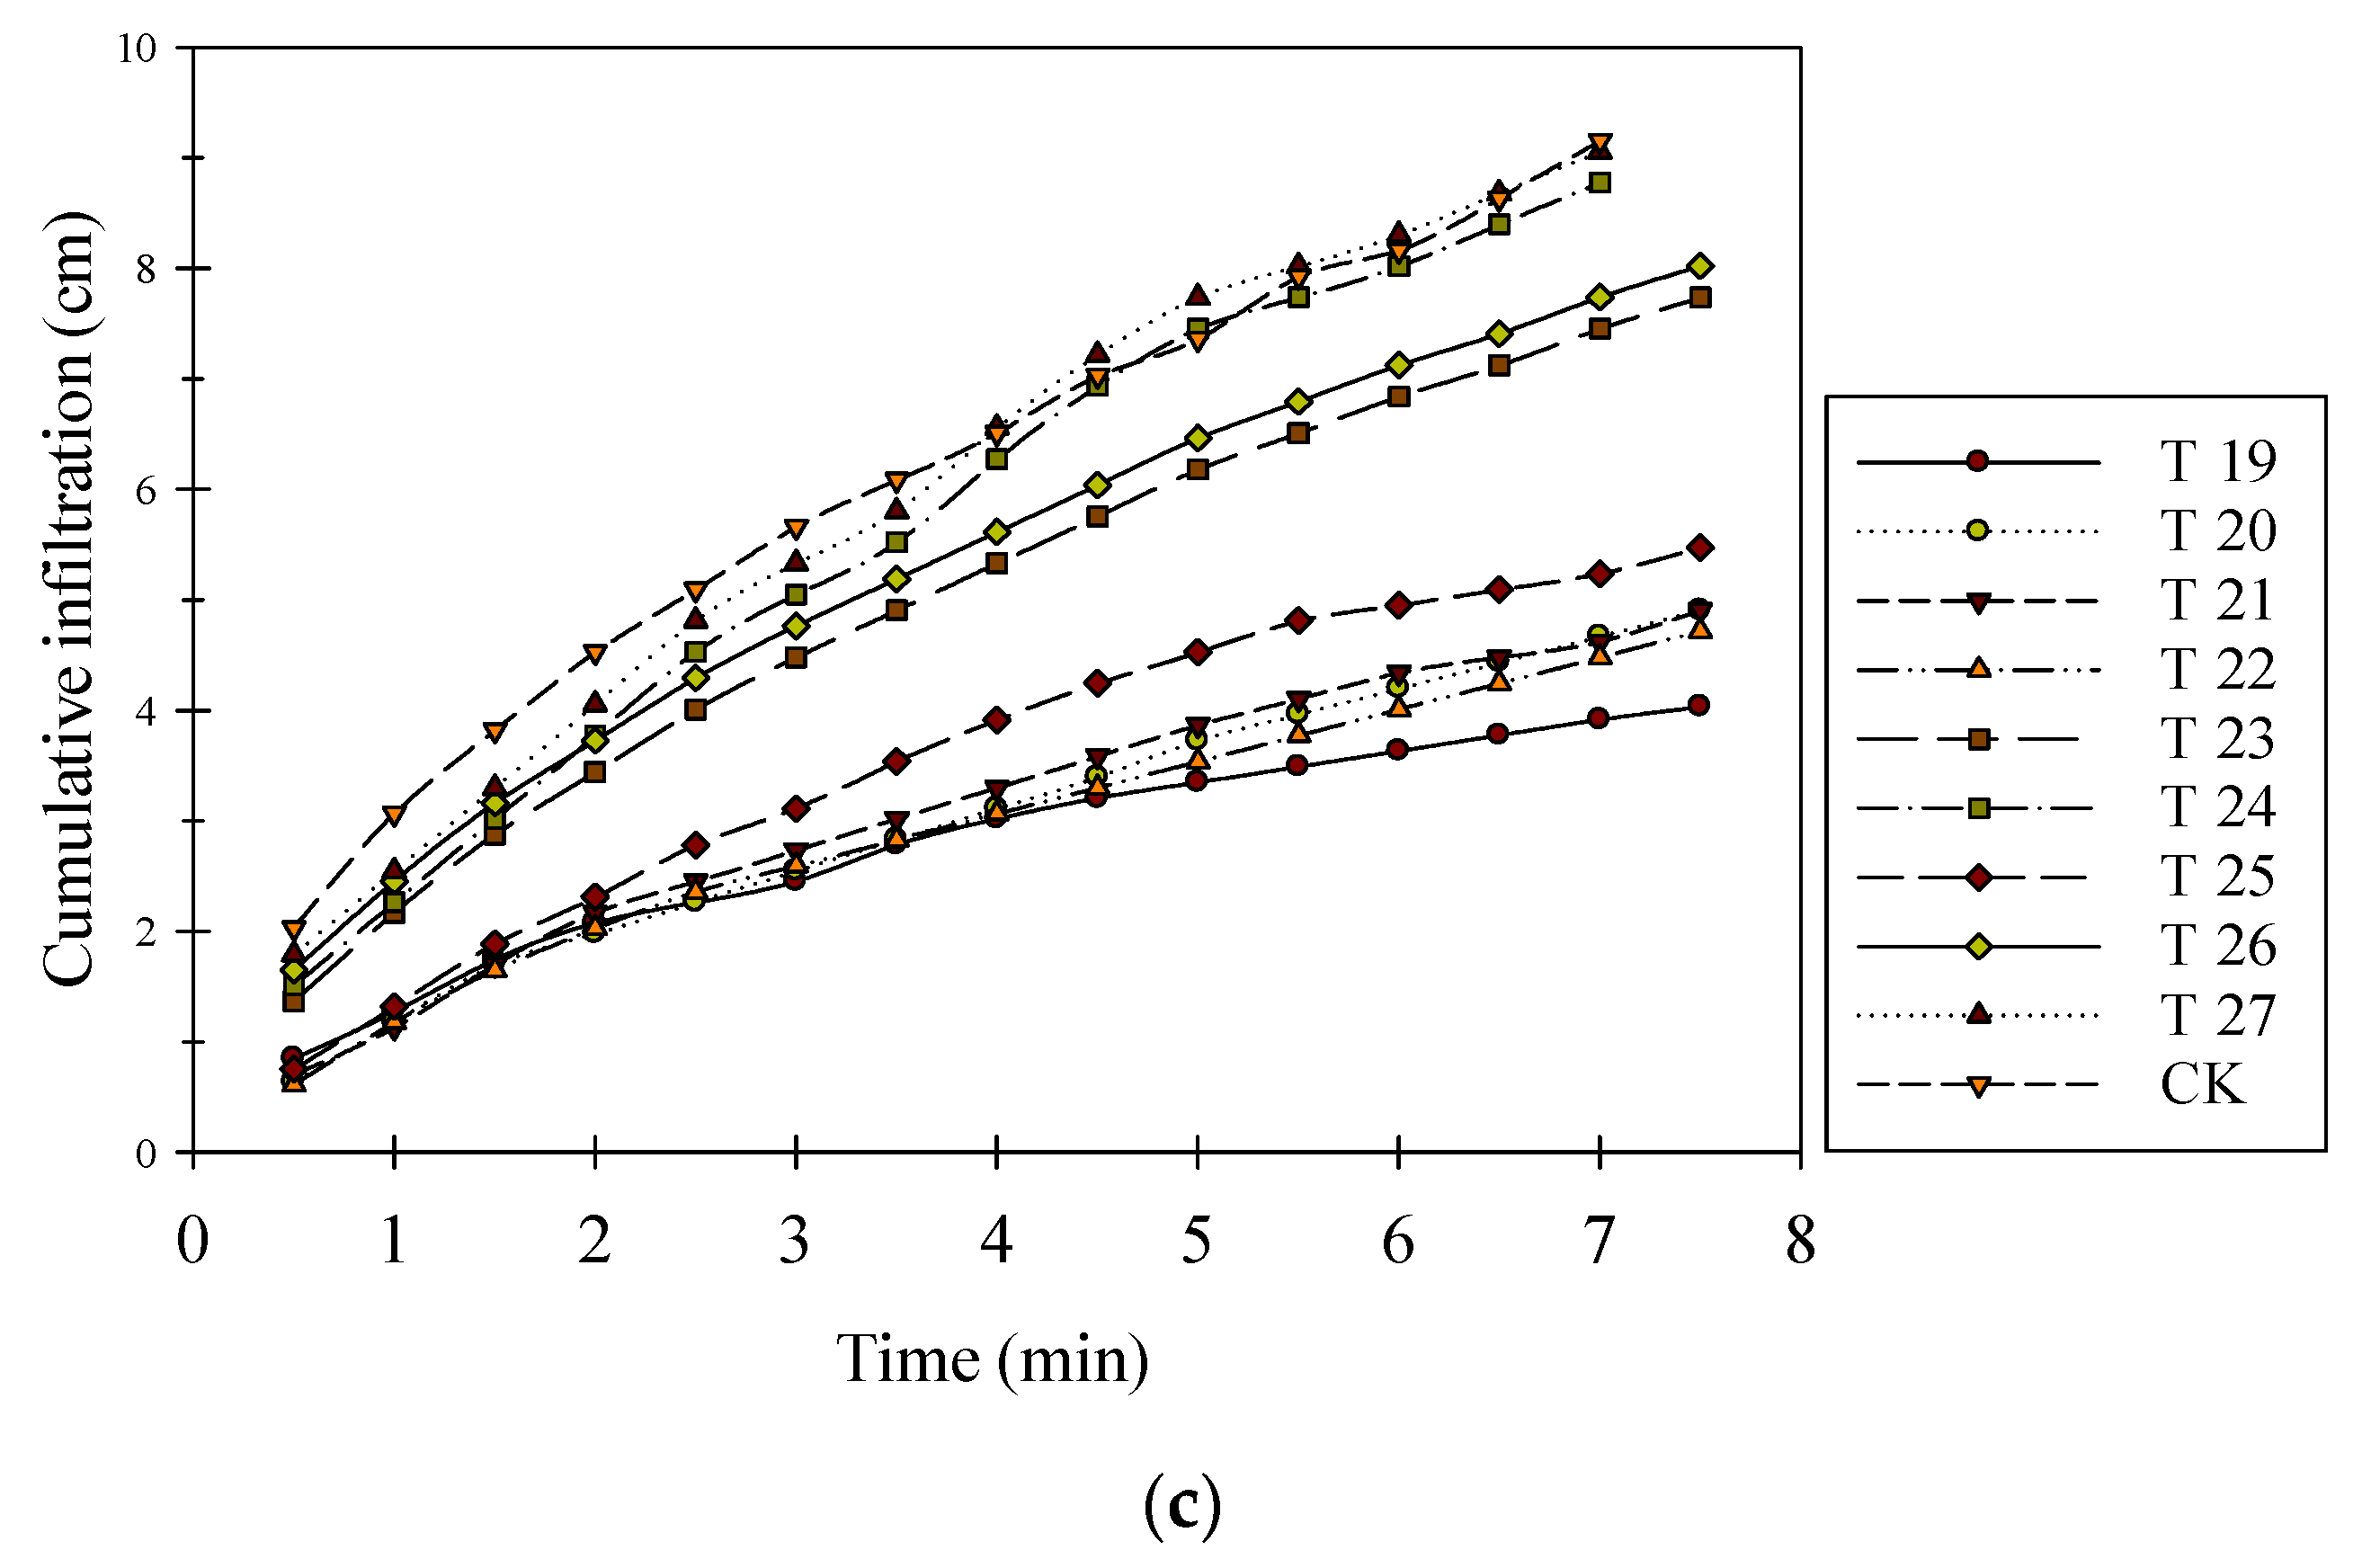
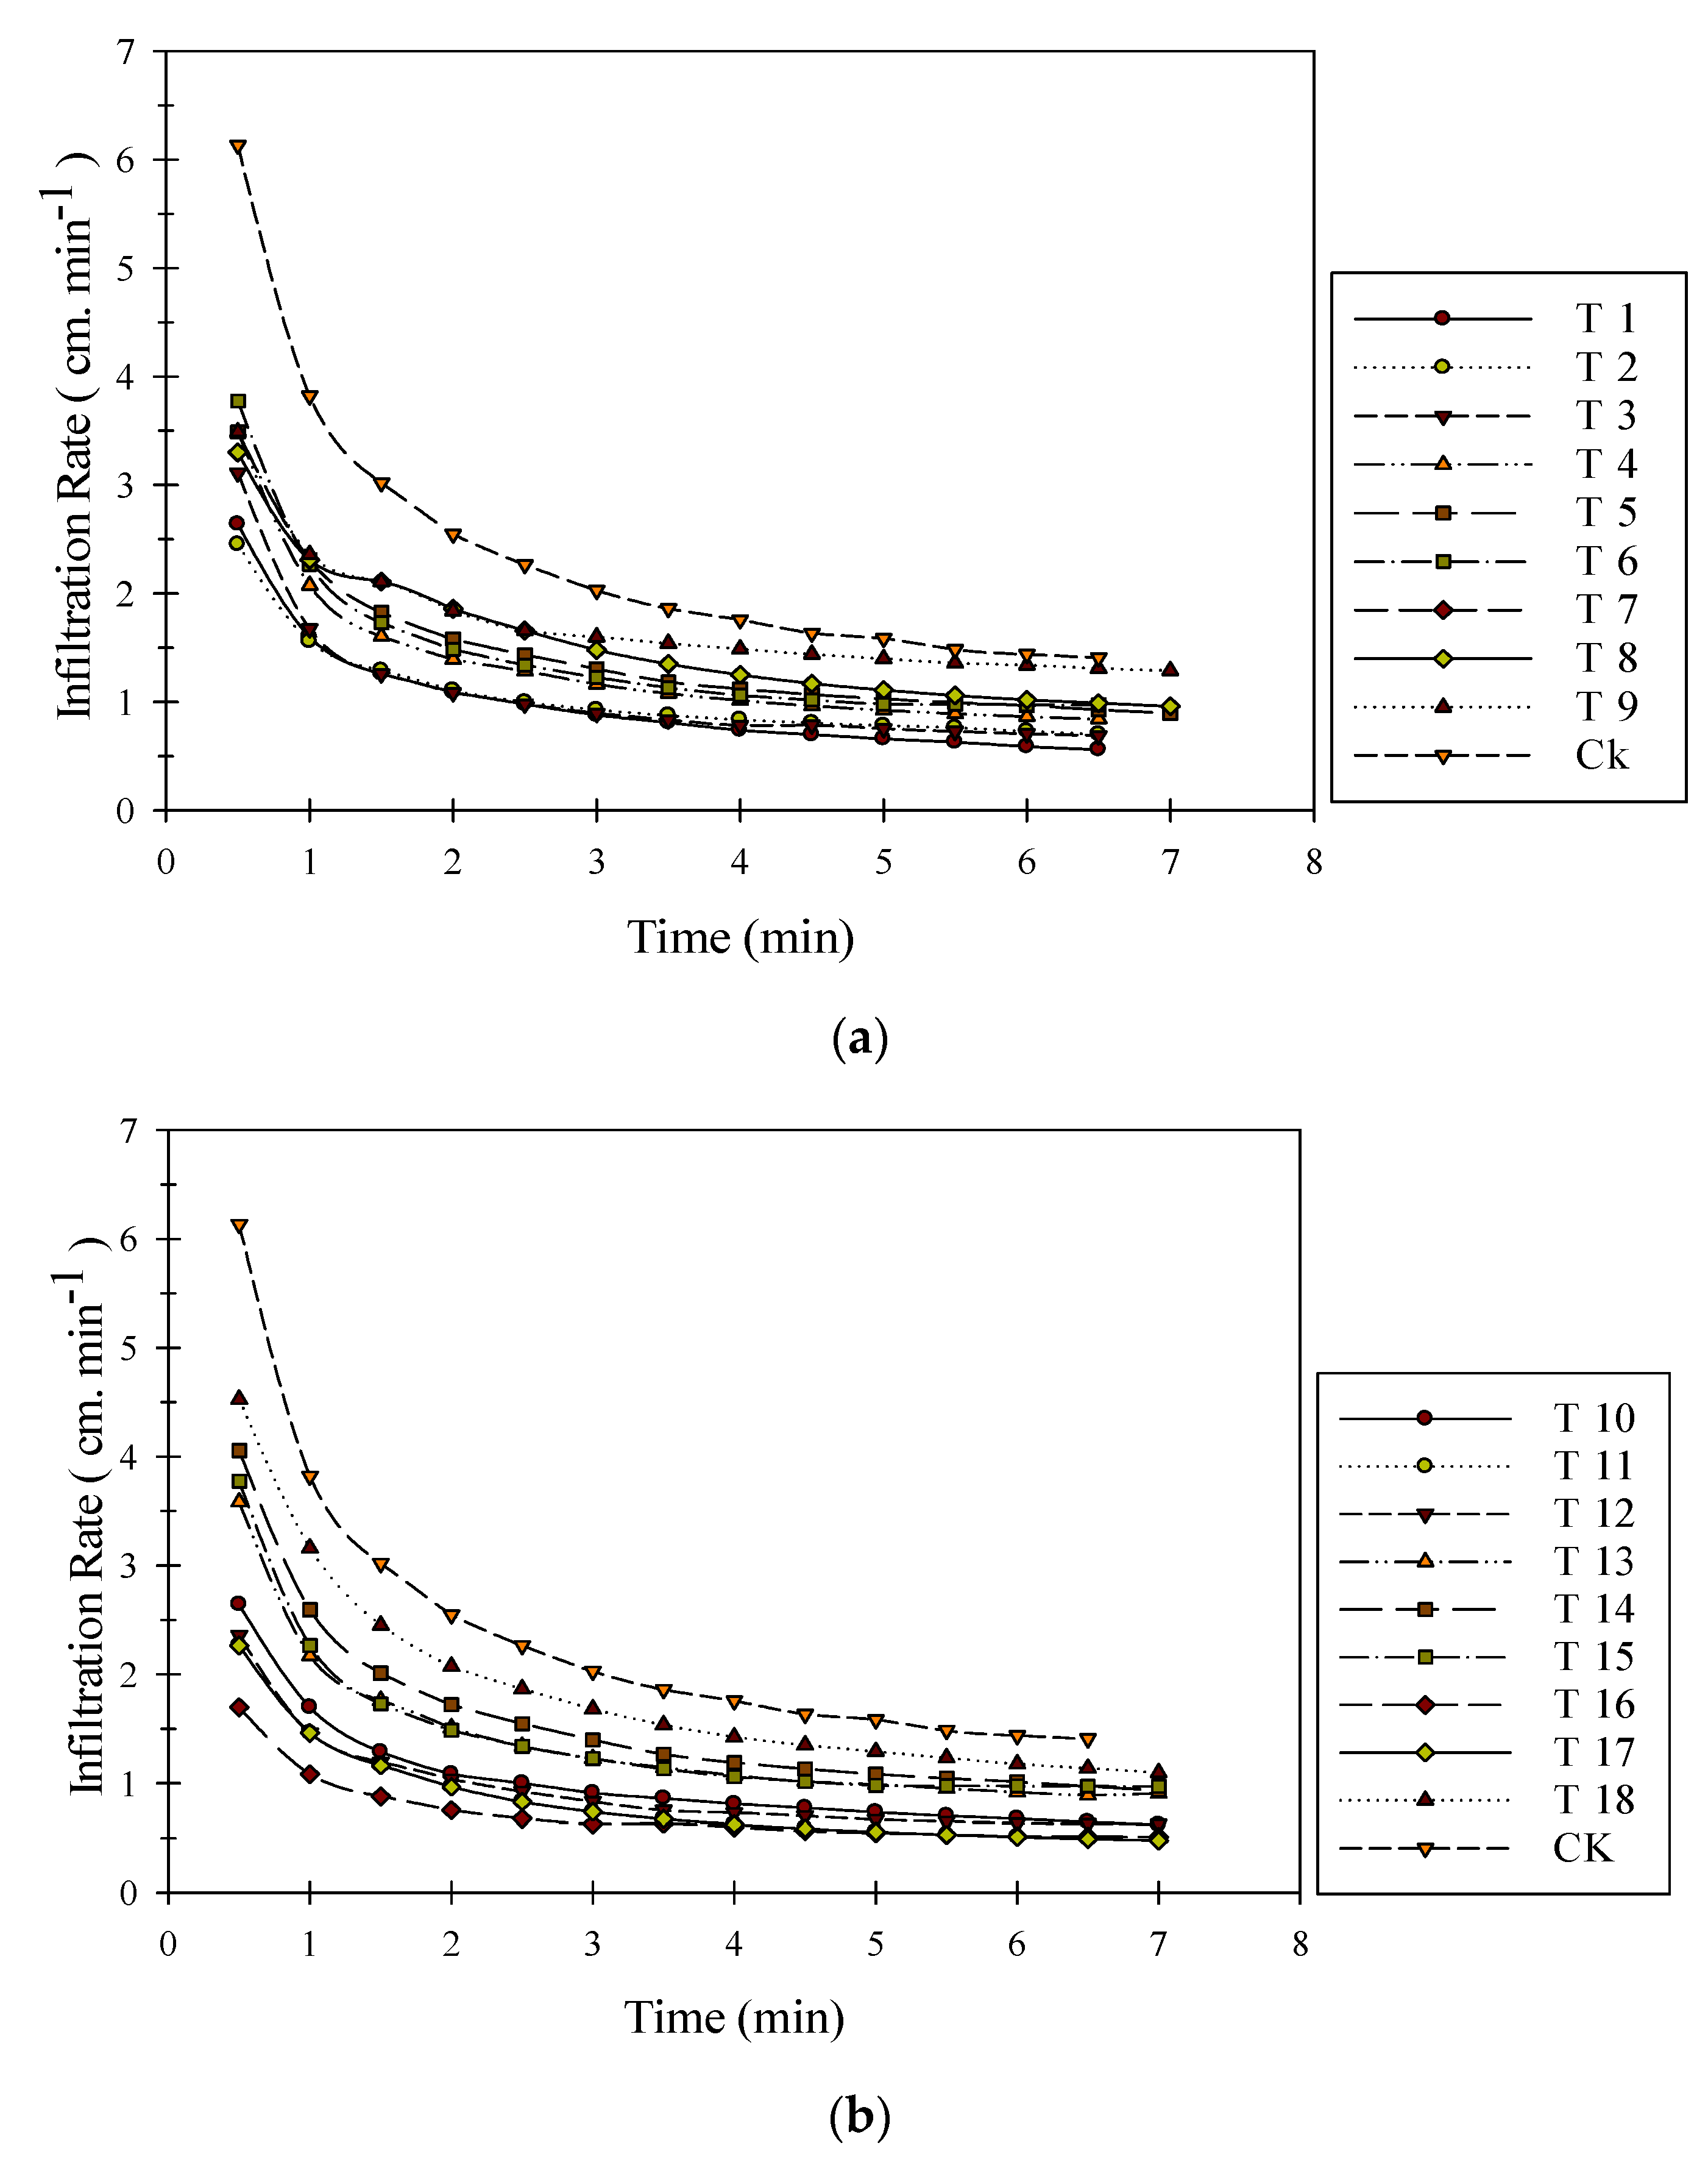
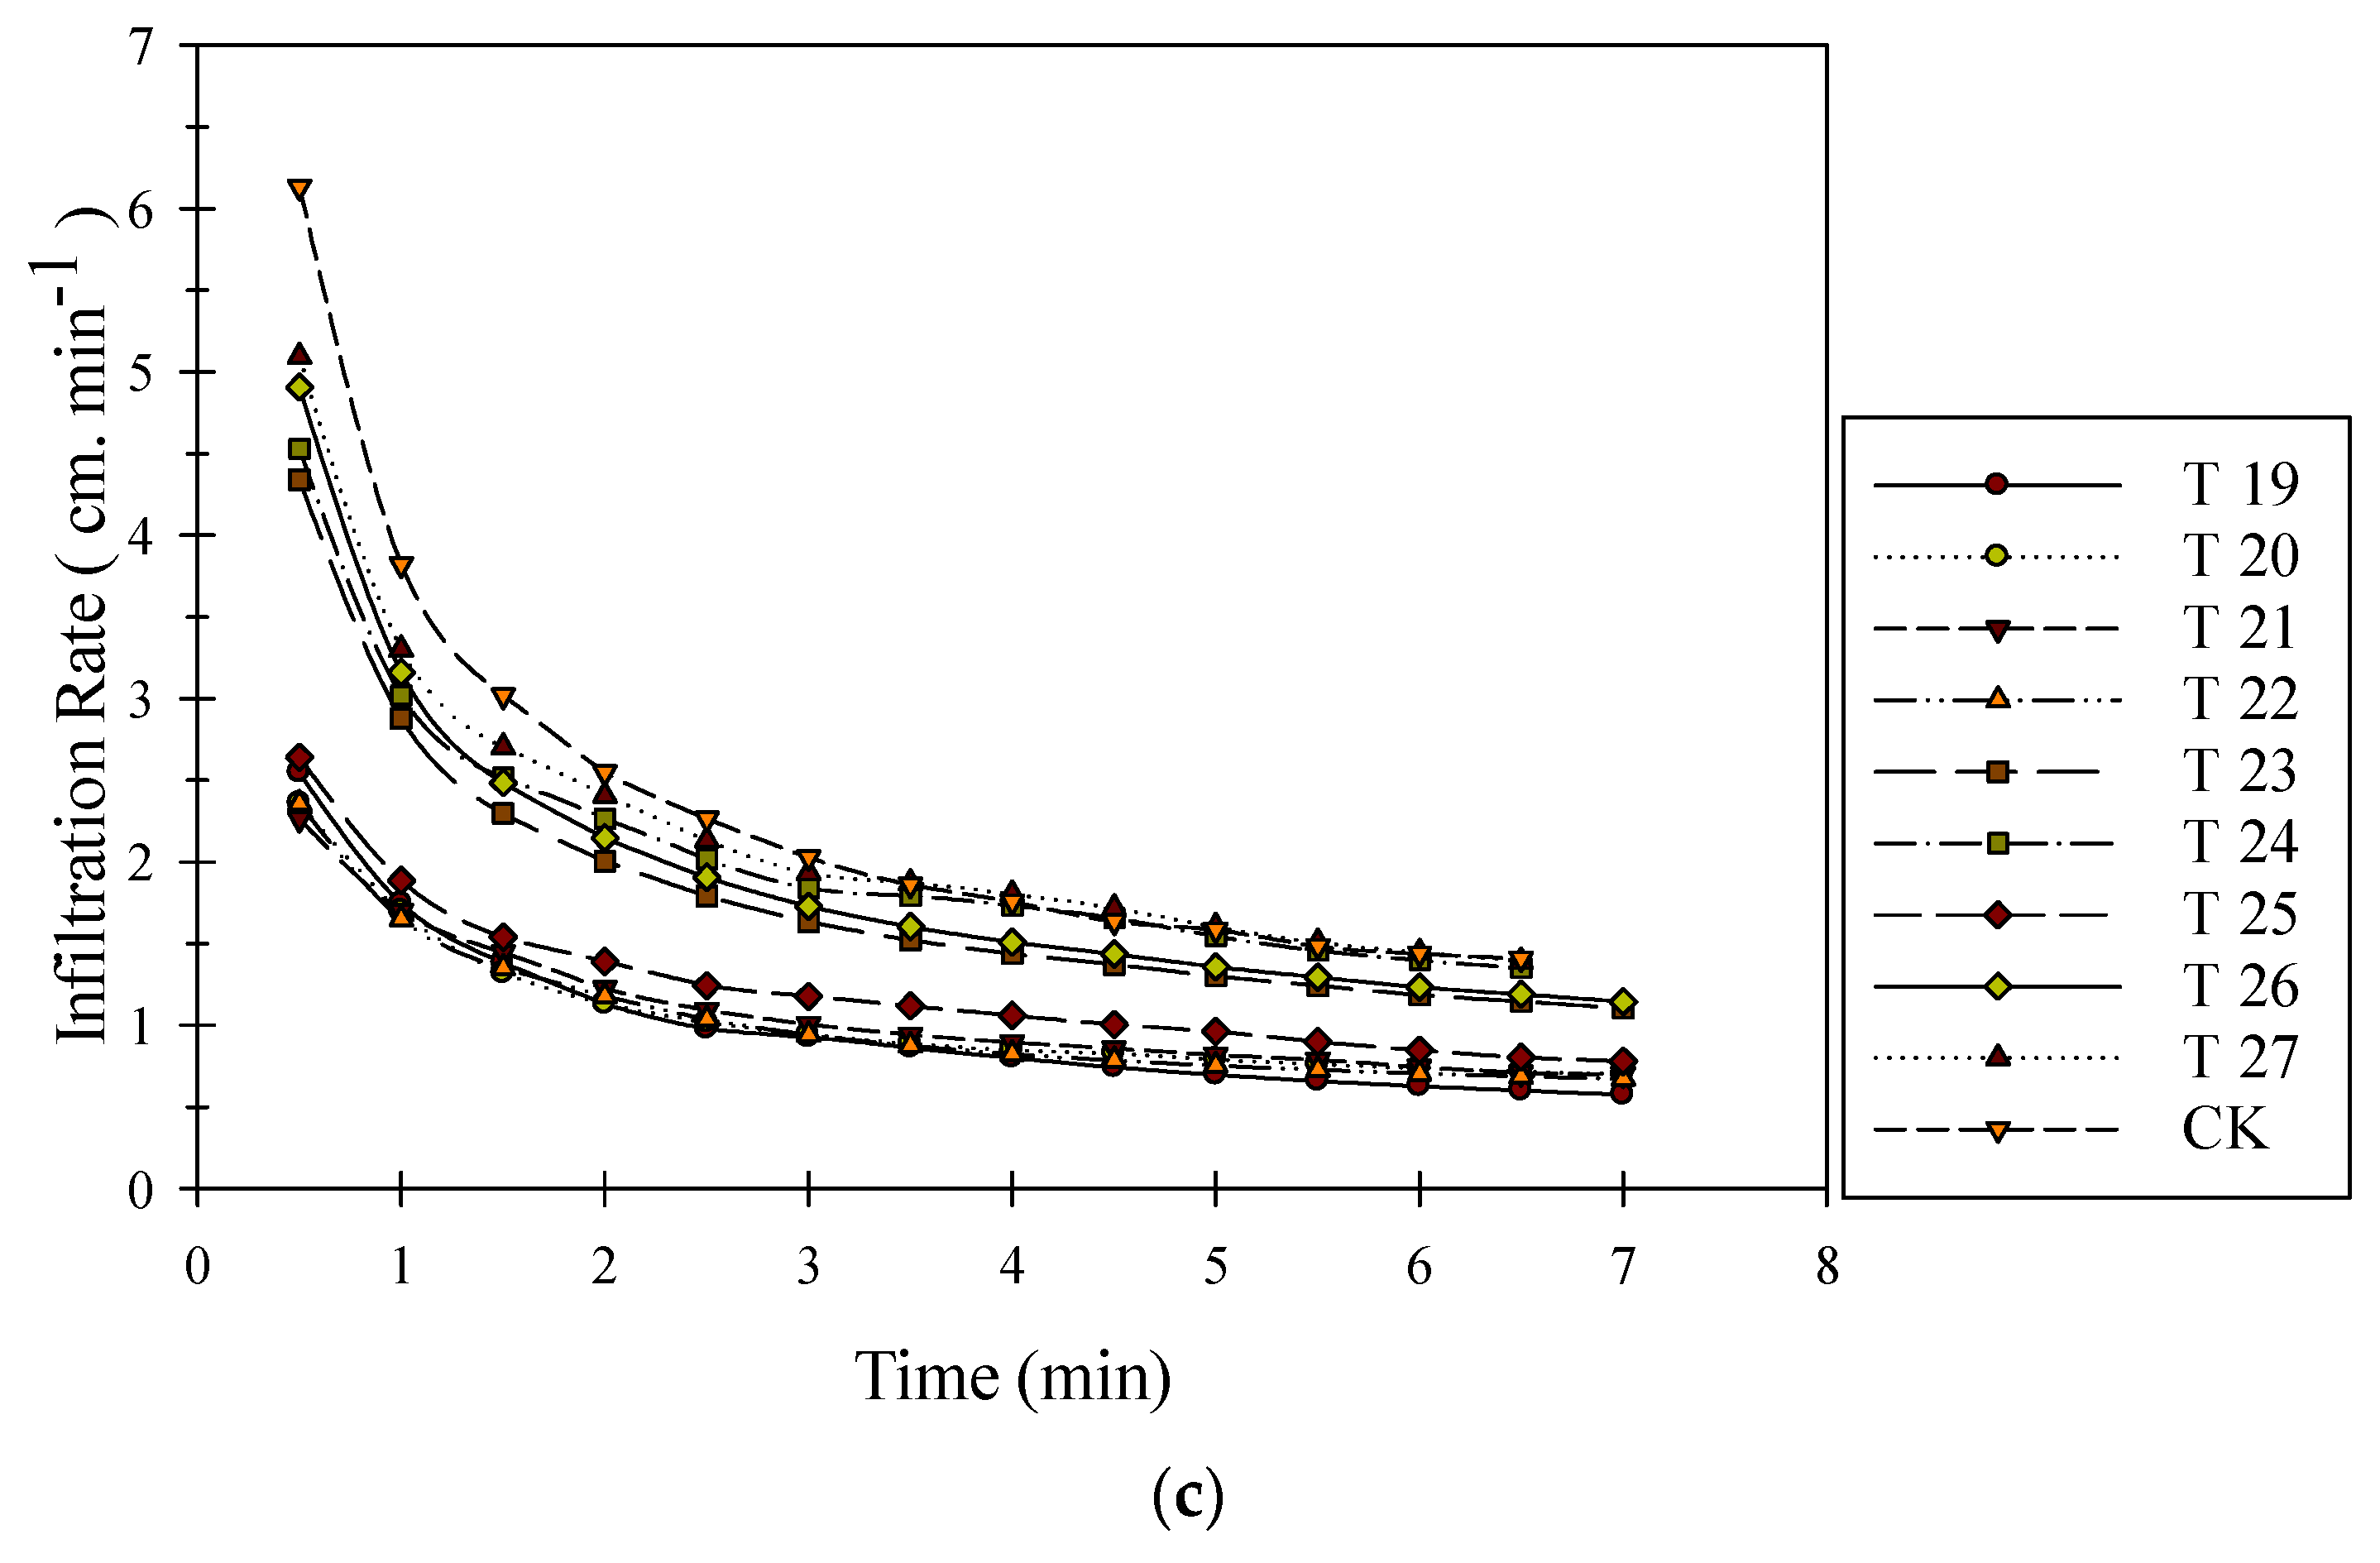
3.3. Cumulative Infiltration and Infiltration Rate

When biochar produced at a pyrolytic temperature of 300 °C, cumulative infiltration decreased significantly, and its percentage decrease varied from 6.7% to 60.3% for T9 and T1, respectively (Figure 7a). The highest decreases were 50.0% (T1), 51.0% (T2), and 60.3% (T3). All treatments had the fine particle size (diameter < 0.5 mm) and the rates of addition were 2.5% (T2), 5% (T3), and 1% (T1). Similar results were found for the infiltration rate with the same percentages of decrease (Figure 8a). The lowest decrease was for the large particle size (diameter 1–2 mm). Compared with the non-treated soil, cumulative infiltration and infiltration rate were reduced by 6.7%, 29.9 %, and 29.9% for T7, T8, and T9, respectively. For biochar produced at the pyrolytic temperature of 500 °C, cumulative infiltration and infiltration rate were enhanced by biochar application (Figure 7b and Figure 8b). For T11 (<0.5 mm diameter; 2.5% application rate) and T18 (1–2 mm diameter and 5% application rate), the decreases were 19.1% and 64.9%, respectively. For biochar produced at the pyrolytic temperature of 700 °C, and the percentages of the decrease for cumulative infiltration compared to the control were 57.2%, 48.9%, 49.5%, 51.0%, 18.6%, 4.1%, 42.8%, 15.5% and 1.0% for T19 to T27, respectively (See Appendix A). These results could be due to the fact that the biochar has fine particles that filled or clogged soil macrospores. Hence, pathways for conduction of water were reduced due to the interaction of biochar with soil matrix in water. However, under these conditions, water in the root-zone would not be lost due to deep percolation and there should be more available water for plant growth. Similar results were reported earlier by various researchers [4,9,27,36,37,38,39,40,41,42,43,44,45,46].

4. Conclusions

The biochar was generally used as an amendment in a coarse soil. Consequently, the impacts of pyrolytic temperature (300, 500, and 700 °C), particle size (1–2 mm, 0.5–1 mm, and less than 0.5 mm), and application rates (1%, 2.5%, and 5% weight/weight) of biochar on hydro-physical properties of calcareous sandy soil were investigated in column experiment. The findings of this study demonstrated significant decrease in cumulative evaporation and saturated hydraulic conductivity. It was revealed that the saturated hydraulic conductivity was declined from 23.0% to 94.6% with biochar application produced at 300 °C, 16.8% to 94.9% for biochar produced at 500 °C, and 32.7% to 92.0% for biochar produced at 700 °C, respectively. Application of biochar resulted in decreased cumulative infiltration and infiltration rate. The reduction was probably due to the fact that the fine particles of the biochar filled the micropores and increased micro-porosity. The highest improvements in hydro-physical properties of soils were observed when biochar with particle size of 0.5–1 mm was applied at low rate (1%). i.e., when biochar produced at a pyrolytic temperature of 300 °C, cumulative infiltration decreased significantly, and its percentage decrease varied from 6.7% to 60.3%. The highest decreases were 50.0% (T1), 51.0% (T2), and 60.3% (T3). Overall, the findings of this study demonstrated that the biochar can significantly improve the hydrological and physical properties of the calcareous sandy soil depending upon pyrolytic temperature, particle size, and application rate of biochar.

Author Contributions

Conceptualization, supervision, funding acquisition: A.G.A. and A.A.-O.; Methodology, formal analysis and investigation, original draft preparation: A.G.A. and A.A.-O.; Resources management, data acquisition, statistical analyses, manuscript review and editing: A.A., Data analyses, Statistical analyses: Z.A., Manuscript review and editing: A.A.A. All authors have read and agreed to the published version of the manuscript.

Funding

This project was funded by the National Plan for Science, Technology and Innovation (MAARIFAH), King Abdulaziz City for Science and Technology, Kingdom of Saudi Arabia, Award Number (15-AGR4704-02).

Institutional Review Board Statement

Not applicable.

Informed Consent Statement

Not applicable.

Data Availability Statement

Data is contained within the article.

Acknowledgments

The authors would like to thank the National Plan for Science, Technology and Innovation (MAARIFAH), King Abdulaziz City for Science and Technology, Kingdom of Saudi Arabia, Award Number (15-AGR4704-02) for supporting this work.

Conflicts of Interest

The authors declare no conflict of interest.

Appendix A. Equations Describing Cumulative Infiltration and Infiltration Rate

TCumulative EvaporationInfiltration Rate
T1y = 1.4534x − 0.1251R2 = 0.9975y = 2.2256x + 0.4664R2 = 0.9925
T2y = 2.0124x − 0.8518R2 = 0.9912y = 1.8796x + 0.6048R2 = 0.9967
T3y = 1.7679x − 0.4352R2 = 0.9708y = 2.5837x + 0.4678R2 = 0.9961
T4y = 3.0158x + 0.5561R2 = 0.9174y = 2.3214x − 0.7994R2 = 0.9959
T5y = 2.6133x − 0.95R2 = 0.9982y = 2.8205x + 0.7835R2 = 0.9886
T6y = 2.5537x − 0.9322R2 = 0.9786y = 3.2641x + 0.5948R2 = 0.9192
T7y = 2.8297x − 0.9942R2 = 0.9929y = 2.7413x + 0.8407R2 = 0.8009
T8y = 2.8212x − 0.9816R2 = 0.9938y = 2.5538x + 0.9527R2 = 0.9352
T9y = 4.0581x − 2.4953R2 = 0.9885y = 2.3642x + 1.181R2 = 0.9919
T10y = 1.7664x − 0.495R2 = 0.9971y = 2.1745x + 0.528R2 = 0.9941
T11y = 1.2225x − 0.0518R2 = 0.9976y = 1.965x + 0.3926R2 = 0.9845
T12y = 1.7705x − 0.7166R2 = 0.9896y = 1.8908x + 0.5051R2 = 0.9954
T13y = 2.5563x − 0.9953R2 = 0.9927y = 2.9078x + 0.7172R2 = 0.9972
T14y = 2.6133x − 0.6669R2 = 0.9982y = 3.3867x + 0.7835R2 = 0.9921
T15y = 2.6662x − 1.0981R2 = 0.9723y = 3.0739x + 0.7083R2 = 0.9991
T16y = 1.4839x − 0.7078R2 = 0.9802y = 1.2875x + 0.4263R2 = 0.9981
T17y = 1.2225x − 0.0518R2 = 0.9976y = 1.965x + 0.3926R2 = 0.9845
T18y = 3.0665x − 0.72R2 = 0.999y = 3.7874x + 0.9799R2 = 0.9753
T19y = 1.5823x − 0.227R2 = 0.9968y = 2.1588x + 0.5197R2 = 0.9756
T20y = 2.0988x − 0.9671R2 = 0.9953y = 1.8356x + 0.6277R2 = 0.9813
T21y = 2.099x − 0.8621R2 = 0.9984y = 1.7311x + 0.6842R2 = 0.9497
T22y = 1.9711x − 0.8006R2 = 0.9977y = 1.8635x + 0.6077R2 = 0.9755
T23y = 3.1899x − 1.0057R2 = 0.9994y = 3.4941x + 0.9935R2 = 0.9861
T24y = 3.951x − 1.6413R2 = 0.9946y = 3.6777x + 1.0836R2 = 0.8374
T25y = 2.4232x − 1.0245R2 = 0.9956y = 1.9846x + 0.7801R2 = 0.966
T26y = 3.1899x − 0.7226R2 = 0.9994y = 4.0603x + 0.9935R2 = 0.9897
T27y = 3.951x − 1.3582R2 = 0.9946y = 3.9499x + 1.2591R2 = 0.9892
CKy = 3.5996x − 0.5772R2 = 0.9985y = 5.1552x + 1.1224R2 = 0.9932

References

  1. Al-Omran, A.M.; Mustafa, M.A.; Shalaby, A.A. Intermittent Evaporation from Soil Columns as Affected by a Gel-forming Conditioner. Soil Sci. Soc. Am. J. 1987, 51, 1593–1599. [Google Scholar] [CrossRef]
  2. Ai-Omran, A.M.; Ai-Wabel, M.I.; Shalaby, A.A. Impact of Sewage Sludge on Water Movement in Calcareous Sandy Soils. J. Agric. Mar. Sci. 1997, 2, 59. [Google Scholar] [CrossRef] [Green Version]
  3. Al-Omran, A.M.; Choudhary, M.I.; Shalaby, A.A.; Mursi, M.M. Impact of Natural Clay Deposits on Water Movement in Calcareous Sandy Soil. Arid Land Res. Manag. 2002, 16, 185–193. [Google Scholar] [CrossRef]
  4. Ahmad, M.; Usman, A.R.; Al-Faraj, A.S.; Ahmad, M.; Sallam, A.; Al-Wabel, M.I. Phosphorus-loaded biochar changes soil heavy metals availability and uptake potential of maize (Zea mays L.) plants. Chemosphere 2018, 194, 327–339. [Google Scholar] [CrossRef]
  5. Yang, C.D.; Lu, S.G. Effects of five different biochars on aggregation, water retention and mechanical properties of paddy soil: A field experiment of three-season crops. Soil Tillage Res. 2021, 205, 104798. [Google Scholar] [CrossRef]
  6. Saffari, N.; Hajabbasi, M.A.; Shirani, H.; Mosaddeghi, M.R.; Owens, G. Influence of corn residue biochar on water retention and penetration resistance in a calcareous sandy loam soil. Geoderma 2021, 383, 114734. [Google Scholar] [CrossRef]
  7. Hussain, R.; Ravi, K.; Garg, A. Influence of biochar on the soil water retention characteristics (SWRC): Potential application in geotechnical engineering structures. Soil Tillage Res. 2020, 204, 104713. [Google Scholar] [CrossRef]
  8. Razzaghi, F.; Obour, P.B.; Arthur, E. Does biochar improve soil water retention? A systematic review and meta-analysis. Geoderma 2020, 361, 114055. [Google Scholar] [CrossRef]
  9. Adekiya, A.O.; Agbede, T.M.; Olayanju, A.; Ejue, W.S.; Adekanye, T.A.; Adenusi, T.T.; Ayeni, J.F. Effect of Biochar on Soil Properties, Soil Loss, and Cocoyam Yield on a Tropical Sandy Loam Alfisol. Sci. World J. 2020, 2020, 9391630. [Google Scholar] [CrossRef]
  10. Verheijen, F.G.; Zhuravel, A.; Silva, F.C.; Amaro, A.; Ben-Hur, M.; Keizer, J.J. The influence of biochar particle size and concentration on bulk density and maximum water holding capacity of sandy vs sandy loam soil in a column experiment. Geoderma 2019, 347, 194–202. [Google Scholar] [CrossRef]
  11. Głąb, T.; Palmowska, J.; Zaleski, T.; Gondek, K. Effect of biochar application on soil hydrological properties and physical quality of sandy soil. Geoderma 2016, 281, 11–20. [Google Scholar] [CrossRef]
  12. Usman, A.R.; Abduljabbar, A.; Vithanage, M.; Ok, Y.S.; Ahmad, M.; Ahmad, M.; Elfaki, J.; Abdulazeem, S.S.; Al-Wabel, M.I. Biochar production from date palm waste: Charring temperature induced changes in composition and surface chemistry. J. Anal. Appl. Pyrolysis 2015, 115, 392–400. [Google Scholar] [CrossRef]
  13. Bridle, T.R.; Pritchard, D. Energy and nutrient recovery from sewage sludge via pyrolysis. Water Sci. Technol. 2004, 50, 169–175. [Google Scholar] [CrossRef]
  14. DeLuca, T.H.; MacKenzie, M.D.; Gundale, M.J. Bio-char effects on soil nutrient transformation. In Biochar for Environmental Management; Lehmann, J., Joseph, S., Eds.; Science and Technology: Earthscan Publications Ltd., London, UK, 2009; pp. 251–270. [Google Scholar]
  15. Ahmad, M.; Ahmad, M.; Usman, A.R.A.; Al-Faraj, A.S.; Abduljabbar, A.; Ok, Y.S.; Al-Wabel, M.I. Date palm waste-derived biochar composites with silica and zeolite: Synthesis, characterization and implication for carbon stability and recalcitrant potential. Environ. Geochem. Health 2019, 41, 1687–1704. [Google Scholar] [CrossRef]
  16. National Center for Palm and Dates (NCPD) 2021; Annual report; Ministry of Environment, Water and Agriculture: Riyadh, Saudi Arabia, 2021.
  17. Gee, G.W.; Bauder, J.W. Methods of Soil Analysis: Physical and Mineralogical Methods; Soil Science Society of America and American Society of Agronomy: Madison, WI, USA, 1994; pp. 383–409. [Google Scholar]
  18. Sparks, D.L.; Page, A.L.; Helmke, P.A.; Loeppert, R.H. (Eds.) Methods of Soil Analysis, Part 3: Chemical Methods; John Wiley & Sons: Hoboken, NJ, USA, 2020; Volume 14. [Google Scholar]
  19. Al-Wabel, M.I.; Al-Omran, A.; El-Naggar, A.H.; Nadeem, M.; Usman, A.R. Pyrolysis temperature induced changes in characteristics and chemical composition of biochar produced from conocarpus wastes. Bioresour. Technol. 2013, 131, 374–379. [Google Scholar] [CrossRef] [PubMed]
  20. Huang, H.; Reddy, N.G.; Huang, X.; Chen, P.; Wang, P.; Zhang, Y.; Huang, Y.; Lin, P.; Garg, A. Effects of pyrolysis temperature, feedstock type and compaction on water retention of biochar amended soil. Sci. Rep. 2021, 11, 1–19. [Google Scholar] [CrossRef] [PubMed]
  21. Mollinedo, J.; Schumacher, T.E.; Chintala, R. Influence of feedstocks and pyrolysis on biochar’s capacity to modify soil water retention characteristics. J. Anal. Appl. Pyrolysis 2015, 114, 100–108. [Google Scholar] [CrossRef]
  22. Ippolito, J.A.; Cui, L.; Kammann, C.; Wrage-Mönnig, N.; Estavillo, J.M.; Fuertes-Mendizabal, T.; Borchard, N. Feedstock Choice, Pyrolysis Temperature and Type Influence Biochar Characteristics: A Comprehensive Meta-Data Analysis Review; Springer: Berlin/Heidelberg, Germany, 2020; pp. 1–18. [Google Scholar]
  23. Wang, M.; Zhu, Y.; Cheng, L.; Andserson, B.; Zhao, X.; Wang, D.; Ding, A. Review on utilization of biochar for metal-contaminated soil and sediment remediation. J. Environ. Sci. 2018, 63, 156–173. [Google Scholar] [CrossRef]
  24. Domingues, R.R.; Trugilho, P.F.; Silva, C.A.; De Melo, I.C.N.A.; Melo, L.C.; Magriotis, Z.M.; Sanchez-Monedero, M.A. Properties of biochar derived from wood and high-nutrient biomasses with the aim of agronomic and environmental benefits. PLoS ONE 2017, 12, e0176884. [Google Scholar] [CrossRef] [Green Version]
  25. Park, J.; Hung, I.; Gan, Z.; Rojas, O.; Lim, K.H.; Park, S. Activated carbon from biochar: Influence of its physicochemical properties on the sorption characteristics of phenanthrene. Bioresour. Technol. 2013, 149, 383–389. [Google Scholar] [CrossRef] [PubMed]
  26. Rafiq, M.K.; Bachmann, R.T.; Rafiq, M.T.; Shang, Z.; Joseph, S.; Long, R. Influence of Pyrolysis Temperature on Physico-Chemical Properties of Corn Stover (Zea mays L.) Biochar and Feasibility for Carbon Capture and Energy Balance. PLoS ONE 2016, 11, e0156894. [Google Scholar] [CrossRef] [Green Version]
  27. Murtaza, G.; Ahmed, Z.; Usman, M.; Tariq, W.; Ullah, Z.; Shareef, M.; Iqbal, H.; Waqas, M.; Tariq, A.; Wu, Y.; et al. Biochar induced modifications in soil properties and its impacts on crop growth and production. J. Plant Nutr. 2021, 44, 1–15. [Google Scholar] [CrossRef]
  28. Alkhasha, A.; Al-Omran, A.; Aly, A. Effects of Biochar and Synthetic Polymer on the Hydro-Physical Properties of Sandy Soils. Sustainability 2018, 10, 4642. [Google Scholar] [CrossRef] [Green Version]
  29. Herath, H.; Arbestain, M.C.; Hedley, M. Effect of biochar on soil physical properties in two contrasting soils: An Alfisol and an Andisol. Geoderma 2013, 209–210, 188–197. [Google Scholar] [CrossRef]
  30. Mukherjee, A.; Lal, R. Biochar Impacts on Soil Physical Properties and Greenhouse Gas Emissions. Agronomy 2013, 3, 313–339. [Google Scholar] [CrossRef] [Green Version]
  31. Hussain, R.; Ghosh, K.K.; Ravi, K. Impact of biochar produced from hardwood of mesquite on the hydraulic and physical properties of compacted soils for potential application in engineered structures. Geoderma 2021, 385, 114836. [Google Scholar] [CrossRef]
  32. Gelardi, D.L.; Ainuddin, I.; Rippner, D.A.; Abou Najm, M.; Parikh, S.J. Biochar Alters Hydraulic Conductivity and Inhibits Nutrient Leaching in Two Agricultural Soils; European Geosciences Union: Munich, Germany, 2021; pp. 1–23. [Google Scholar]
  33. Wang, K.; Zhang, X.; Sun, C.; Yang, K.; Zheng, J.; Zhou, J. Biochar application alters soil structure but not soil hydraulic conductivity of an expansive clayey soil under field conditions. J. Soils Sediments 2021, 21, 73–82. [Google Scholar] [CrossRef]
  34. Bai, B.; Long, F.; Rao, D.; Xu, T. The effect of temperature on the seepage transport of suspended particles in a porous medium. Hydrol. Process. 2016, 31, 382–393. [Google Scholar] [CrossRef]
  35. Bai, B.; Nie, Q.; Zhang, Y.; Wang, X.; Hu, W. Cotransport of heavy metals and SiO2 particles at different temperatures by seepage. J. Hydrol. 2021, 597, 125771. [Google Scholar] [CrossRef]
  36. Liu, Z.; Dugan, B.; Masiello, C.; Barnes, R.T.; Gallagher, M.E.; Gonnermann, H. Impacts of biochar concentration and particle size on hydraulic conductivity and DOC leaching of biochar–sand mixtures. J. Hydrol. 2016, 533, 461–472. [Google Scholar] [CrossRef] [Green Version]
  37. Ibrahim, A.; Usman, A.R.A.; Al-Wabel, M.I.; Nadeem, M.; Ok, Y.S.; Al-Omran, A. Effects of conocarpus biochar on hydraulic properties of calcareous sandy soil: Influence of particle size and application depth. Arch. Agron. Soil Sci. 2016, 63, 185–197. [Google Scholar] [CrossRef]
  38. Alkhasha, A.; Al-Omran, A.; Alghamdi, A.A.G. Effect of Water Quality and Date Palm Biochar on Evaporation and Specific Hydrological Characteristics of Sandy Soil. Agric. 2020, 10, 300. [Google Scholar] [CrossRef]
  39. Ibrahim, H.M.; Al-Wabel, M.I.; Usman, A.R.A.; Al-Omran, A. Effect of Conocarpus Biochar Application on the Hydraulic Properties of a Sandy Loam Soil. Soil Sci. 2013, 178, 165–173. [Google Scholar] [CrossRef]
  40. Alghamdi, A.; Aljohani, B.; Aly, A. Impacts of Olive Waste-Derived Biochar on Hydro-Physical Properties of Sandy Soil. Sustainability 2021, 13, 5493. [Google Scholar] [CrossRef]
  41. Alghamdi, A.G. Biochar as a potential soil additive for improving soil physical properties—A review. Arab. J. Geosci. 2018, 11, 1–16. [Google Scholar] [CrossRef]
  42. Alghamdi, A.G.; Alkhasha, A.; Ibrahim, H.M. Effect of biochar particle size on water retention and availability in a sandy loam soil. J. Saudi Chem. Soc. 2020, 24, 1042–1050. [Google Scholar] [CrossRef]
  43. Eibisch, N.; Durner, W.; Bechtold, M.; Fuß, R.; Mikutta, R.; Woche, S.K.; Helfrich, M. Does water repellency of pyrochars and hydrochars counter their positive effects on soil hydraulic properties? Geoderma 2015, 245–246, 31–39. [Google Scholar] [CrossRef]
  44. Li, W.; Liang, C.; Dong, L.; Zhao, X.; Wu, H. Accumulation and characteristics of fluorescent dissolved organic matter in loess soil-based subsurface wastewater infiltration system with aeration and biochar addition. Environ. Pollut. 2021, 269, 116100. [Google Scholar] [CrossRef] [PubMed]
  45. Duan, M.; Liu, G.; Zhou, B.; Chen, X.; Wang, Q.; Zhu, H.; Li, Z. Effects of modified biochar on water and salt distribution and water-stable macro-aggregates in saline-alkaline soil. J. Soils Sediments 2021, 21, 2192–2202. [Google Scholar] [CrossRef]
  46. Bai, B.; Rao, D.; Chang, T.; Guo, Z. A nonlinear attachment-detachment model with adsorption hysteresis for suspension-colloidal transport in porous media. J. Hydrol. 2019, 578, 124080. [Google Scholar] [CrossRef]
Figure 1. Geographical map of the sample site.
Agriculture 11 01293 g001
Figure 2. A diagram of the experiment illustrating the layers of soil and biochar.
Agriculture 11 01293 g002
Figure 3. Influence of temperature of pyrolysis on cumulative evaporation at different application rates (a) R1 or 1%, (b) R2.5 or 2.5% and (c) R5 or 5%.
Agriculture 11 01293 g003
Figure 4. Effect of application rate with different temperatures of pyrolysis on cumulative evaporation: (a) T300, (b) T500 and (c) T700.
Agriculture 11 01293 g004
Figure 5. Effect of different diameters on cumulative evaporation: (a) T300, (b) T500 and (c) T700.
Agriculture 11 01293 g005
Figure 6. Effect of application rate and particle size of biochar on saturated hydraulic conductivity, (a) biochar at 300 °C, (b) 500 °C and (c) 700 °C.
Agriculture 11 01293 g006
Figure 7. Effect of application rate and particle size of biochar on cumulative infiltration, (a) biochar at 300 °C, (b) 500 °C and (c) 700 °C.
Agriculture 11 01293 g007aAgriculture 11 01293 g007b
Figure 8. Effect of application rate and particle size of biochar on infiltration rate, (a) biochar at 300 °C, (b) 500 °C and (c) 700 °C.
Agriculture 11 01293 g008aAgriculture 11 01293 g008b
Table 1. Chemical and physical properties of the soil.
Physical Properties
Sand (%)Silt (%)Clay (%)Soil TextureBulk density (g cm−3)CaCO3 (%)Ks (cm day−1)WHC (%)
88.12.09.9Loamy sand1.5313.4121.3725–27
Chemical properties of soil and water.
Types of samplepHCations (meq L−1)Anions (meq L−1)
E.C dS m−1Ca+2Mg+2Na+K+ClHCO3SO4−2SAR
Soil7.732.3910.922.256.585.102.500.8319.832.56
Water applied to columns7.671.45.65.43.390.64112.41.634.02
Ks = hydraulic conductivity, WHC = water holding capacity, SAR = Sodium adsorption ratio.
Table 2. Biochar treatments applied in the experiments.
Temperature (°C)Diameter (mm)Application Rate (%)CodeSymbolReplicates
3000.51T300D0.5R1T13
2.5T300D0.5R2.5T23
5T300D0.5R5T33
11T300D1R1T43
2.5T300D1R2.5T53
5T300D1R5T63
21T300D2R1T73
2.5T300D2R2.5T83
5T300D2R5T93
5000.51T500D0.5R1T103
2.5T500D0.5R2.5T113
5T500D0.5R5T123
11T500D1R1T133
2.5T500D1R2.5T143
5T500D1R5T153
21T500D2R1T163
2.5T500D2R2.5T173
5T500D2R5T183
7000.51T700D0.5R1T193
2.5T700D0.5R2.5T203
5T700D0.5R5T213
11T700D1R1T223
2.5T700D1R2.5T233
5T700D1R5T243
21T700D2R1T253
2.5T700D2R2.5T263
5T700D2R5T273
CKCK3
(T) temperature, (D) diameter, (R) application rate and (CK) Control.
Publisher’s Note: MDPI stays neutral with regard to jurisdictional claims in published maps and institutional affiliations.

