Article

Magnesium Supplementation Alters Leaf Metabolic Pathways for Higher Flavor Quality of Oolong Tea

1
The Key Plant-Soil Interaction Laboratory, Department of Plant Nutrition, Ministry of Education, China Agricultural University, Beijing 100193, China
2
National Academy of Agriculture Green Development, China Agricultural University, Beijing 100193, China
3
International Magnesium Institute, Fujian Agriculture and Forestry University, Fuzhou 350002, China
4
Fujian Key Laboratory of Agro-Product Quality and Safety, Fujian Academy of Agricultural Sciences, Fuzhou 350003, China
*
Author to whom correspondence should be addressed.
Submission received: 23 December 2020 / Revised: 25 January 2021 / Accepted: 28 January 2021 / Published: 2 February 2021
(This article belongs to the Special Issue Effects of Fertilizer and Irrigation on Crop Production)

Abstract

:
Oolong tea, one of the most famous tea beverages in China, contains specialized metabolites contributing to rich flavors and human health. Accumulation patterns of such metabolites and underlying regulatory mechanisms significantly vary under different growth conditions. To optimize quality and yield while minimizing environmental effects, three treatments were designed in this study: Conventional fertilization, optimized fertilization, and optimized fertilization supplemented with magnesium (Mg). We investigated the yield, taste quality, primary and secondary metabolites of oolong tea, and found that a substantial reduction in chemical fertilizers (nutrient optimization by reducing 43% N, 58% P2O5 and 55% K2O) did not affect the tea yield in this study. Interestingly, Mg fertilization is an important factor influencing amino acid and sugar accumulation in oolong tea, resulting in higher concentrations of total free amino acids and a lower ratio of tea polyphenols (TP) to free amino acids (FAA). Gas chromatography-time-of-flight mass spectrometry (GC-TOF-MS) and liquid chromatography-high resolution mass spectrometry (LC-HRMS) combined multivariate analyses revealed distinct features of metabolite accumulation in leaves of three different treatments, as indicated by 34 differentially accumulated characteristic compounds. The levels of serine, aspartic acid, isoleucine, phenylalanine, theanine, and proline were reduced by fertilizer optimization and increased by Mg supplementation. Mg particularly promoted theanine accumulation favoring a stronger umami taste of oolong tea, while decreasing astringency and bitter metabolites. Thus, Mg application paves a new path for tea quality improvement in Southern China where Mg deficiency in the soil is a frequent limiting factor for crop production.

Graphical Abstract

1. Introduction

Oolong tea, one of the most popular beverages in China, is a kind of partially fermented tea with a sweet grassy taste and distinct aroma [1]. It contains various biochemical compounds, i.e., catechins, amino acids, and caffeine, which not only affect the tea flavor and taste, but also bring health benefits [2]. Amino acids contribute to sweetness, and caffeine and catechins are responsible for the bitter and astringent taste [3]. A list of beneficial effects of oolong tea include antioxidant, anti-obesity, anticancer, anti-microbial and antihyperglycemic activities [4,5,6,7,8]. The chemical composition and quality of oolong tea are affected by climate, the plant age, production methods and nitrogen (N) fertilization [9,10]. N application rates primarily determine tea yield and quality [11].
Crop production in China largely relies on high levels of N inputs [12]. For instance, the use of synthetic N fertilizers increased from 9.34 to 20.65 million tons (approximately 121%) during last four decades (National Bureau of Statistics). A majority of Chinese tea farmers are small-holder growers not well aware of precise fertilization and frequently apply much more chemical fertilizers (averaging 553 kg N/ha) than required to ensure high yield [13,14]. Over application of chemical N fertilizers is leading to a lower N use efficiency (0.25) than in developed countries (0.42) [15] and severe environmental consequences, such as greenhouse gas emission, eutrophication of surface water, and widespread soil acidification [16,17]. Soil acidification in Southern China, together with unintentional inclusion of heavy metals in compost and phosphate fertilizers, dramatically enhances the bioavailability of Cd and Mn and accelerates leaching losses of certain essential nutrients (Mg2+ and K+) on the other hand [18], adversely affecting the tea quality [19].
Mg is an essential nutrient for a wide array of physiological and biochemical processes in plants and plays particularly important roles in photosynthesis, respiration, enzyme activation, and energetic metabolism [20,21]. Mg deficiency impairs photosynthesis and allocation of carbohydrates, hampers biomass accumulation, and reduces crop yield and quality accordingly [22]. Today, most people absorb less Mg than the optimal level due to a high extent of dependence on Mg-insufficient agricultural products [23]. Mg deficiency appears as an increasingly serious problem in agriculture and human nutrition with imbalanced nutrient inputs and growing demand of nutritious food [24]. Oolong tea is traditionally produced in Fujian province in southeast China, a typical Mg deficient or extremely deficient region, and more widespread and severe Mg deficiency occurs as an obvious nutritional disorder with accelerated soil acidification in the tea field [25]. The meta-analysis suggests an average 8.5% increase of crop yield when Mg fertilizers are applied under various field conditions across the world [26]. Therefore, reduction of chemical N fertilizers and supplementation of Mg fertilizers is a promising novel strategy to balance plant nutrition, improve tea yield and quality, and reduce N losses. Previous tea studies showed significant yield responses to Mg fertilization and parallel improvement of certain quality traits, i.e., increases of soluble substances, catechins, and caffeine in contrast to decreases of the ratio of tea polyphenols to total amino acids [20,27,28]. Reducing chemical fertilizers with Mg supplementation favors catechin and epicatechin accumulation [21]. However, it remains unclear how optimized and balanced fertilization affects tea quality at the metabolic level and, in particular, how Mg affects the flavor and taste quality of oolong tea by metabolic repatterning. Non-targeted metabolomics analysis based on gas chromatography-time-of-flight mass spectrometry (GC-TOF-MS) and liquid chromatography-high resolution mass spectrometry (LC-HRMS) allows simultaneous detection of a broad spectrum of metabolites and provides in-depth metabolic hierarchical responses to different fertilization regimes [29]. In this study, we investigated sensory properties of oolong tea and effects of optimized fertilization and Mg supplementation on metabolite accumulation, and found that, on the basis of optimized N, P, and K fertilization, Mg supplementation alters leaf metabolic pathways and results in higher flavor quality of oolong tea.

2. Materials and Methods

2.1. Tea Cultivation and Sampling

A fertilizer experiment was conducted in a typical oolong tea field in Anxi County, Fujian Province (N 23°16′, E118° 15′) with three different fertilization regimes: (1) Conventional fertilization (CON), (2) optimized fertilization (OPT), and (3) optimized fertilization supplemented with Mg (OPTM). The CON treatment received N, P2O5 and K2O at 530, 238, and 278 kg/ha, respectively, according to the average application rate of 106 local farmers [30]. According to our previous study, the OPT and OPTM treatment received identical amounts of N, P2O5, and K2O at 300, 100, and 125 kg/ha, respectively, according to growth demand of tea over the entire growing season [31]. The Mg (MgO) was supplied at 70 kg/ha as magnesium sulfate monohydrate in the OPTM treatment [31], with one half inter-row broadcasted in late December 2018 and the other half broadcasted in August 2019. Each treatment had four randomly arranged 20 m2 plots (Supplementary Figure S1). Individual plots were separated from each other by one border line of tea plants. The inter-row and inter-plant distance within a row was 60 and 33 cm, respectively.
Representative tea samples from each plot were collected on the same harvest date in spring (April 2019) or autumn (October 2019), with 4 biological replicates. Following local plucking standards, one-tip-three-leaf tissues within the measuring frame (33 × 33 cm) were collected to calculate tea yield. According to a previous study [32], harvested samples underwent the whole manufacturing process from freshly harvested leaves to final products. Dried samples were ground into powder using a grinding machine and stored at −80 °C until analysis.

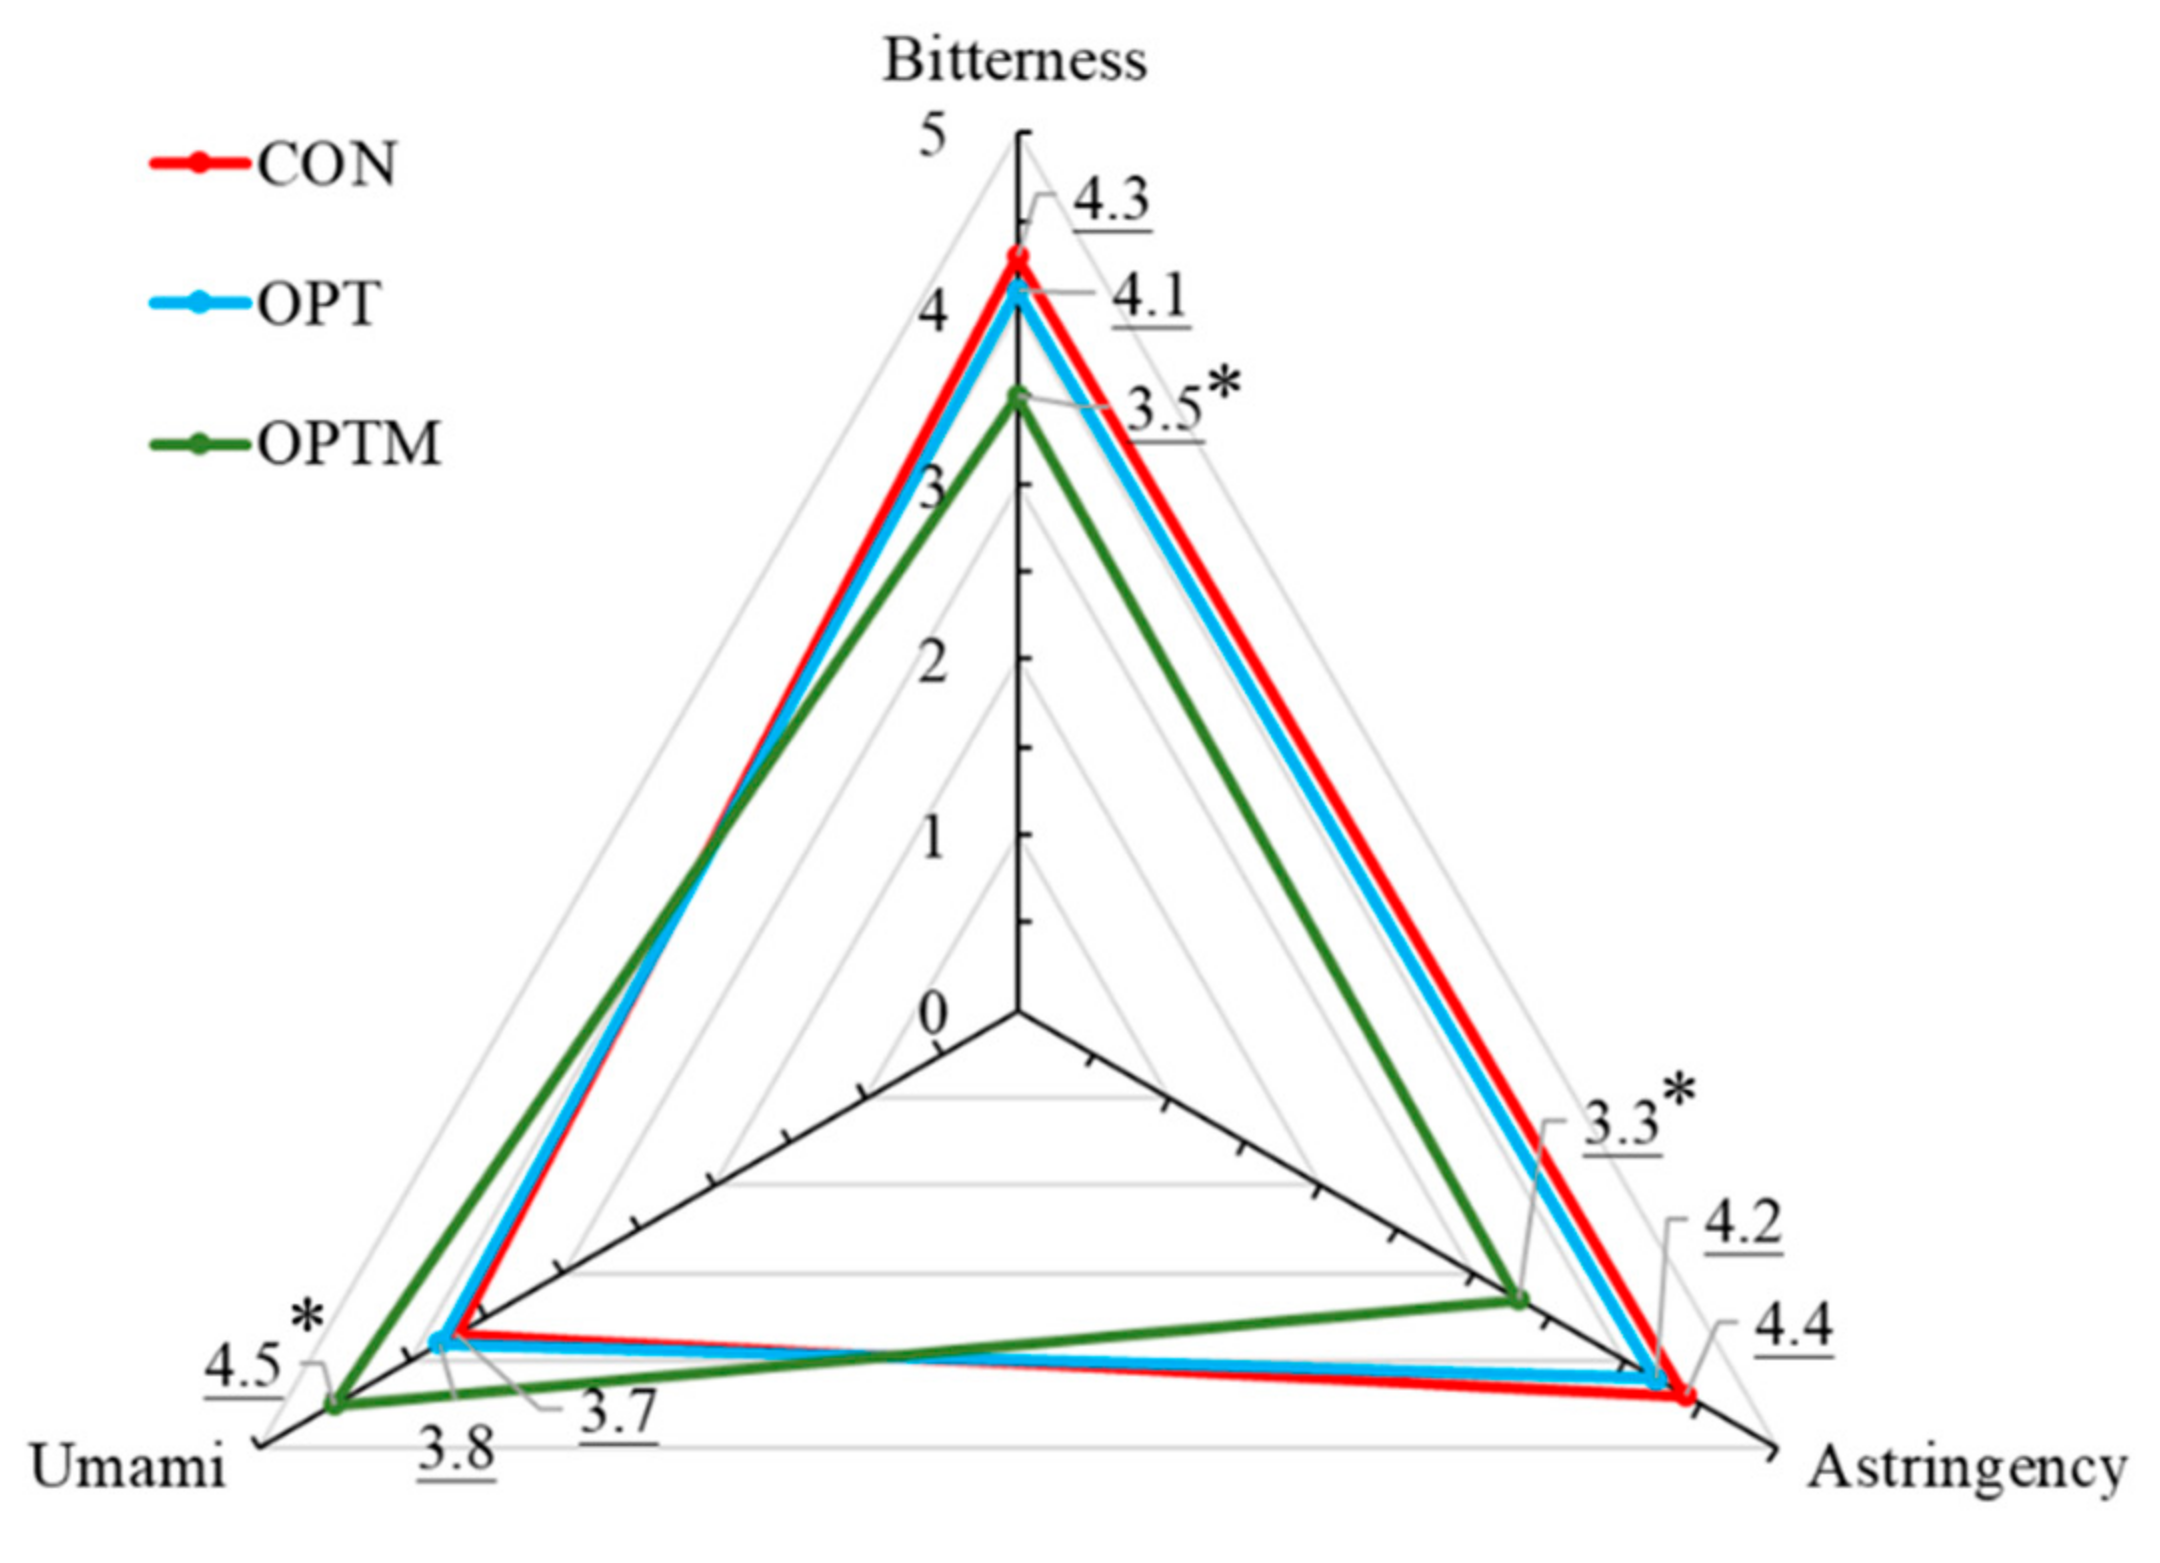
2.2. Sensory Evaluation of Oolong Tea

Sensory evaluation was performed according to the previously reported protocol with slight modification [1]. Samples were submitted to sensory evaluation by a panel of 10 trained assessors, including 5 females and 5 males (aged 20–45 years) with ample experience in tea quality evaluation. Three sensory attributes were chosen for evaluation: Umami, bitterness, and astringency. For tea infusion, tea product (2 g) was infused with boiling distilled water (100 mL, 98 °C), and the tea slurry was poured out after brewing for 5 min. A scorecard was developed with a 5-point category scale (least intense or unpleasant = 0; most intense or pleasant = 5).

2.3. Total Polyphenols and Amino Acids Content Analysis

The content of total polyphenols and amino acids in oolong tea was measured according to the Chinese National Standard methods (GB/T 8313-2008) and (GB/T 8314, 2013), respectively [33,34].

2.4. Chemicals and Reagents

High performance liquid chromatography (HPLC)-grade ethanol, acetonitrile, and water were obtained from Fisher Scientific (Pittsburgh, PA, USA). Formic acid of HPLC grade was purchased from TIC (Tokyo, Japan). The chemical standards for catechin, epicatechin, epigallocatechin, epizfzelechin, catechin gallate, isoquercitrin, myricetin 3-O-glucoside, rutin, caffeine, xylose, glucose, sorbitol, lactulose, valine, isoleucine, serine, proline, aspartic acid, phenylalanine, theanine, oxalic acid, succinic acid, malic acid, glutamic acid, shikimic acid, citric acid, and Bis(trimethylsilyl)trifluoroacetamide (BSTFA) and trimethylchlorosilane (TMCS) were obtained from Sigma Aldrich (St. Louis, MO, USA).

2.5. Non-Targeted Metabolomics Analysis

Metabolomic analysis by ultra-performance liquid chromatography quadrupole time-of-flight mass spectrometry (UPLC-Q-TOF/MS): The tea samples (40 mg) were extracted in 70% aqueous methanol (4 mL) by sonication for 30 min. 2 mL supernatant was further filtered through a 0.20-μm syringe filter with a GH Polypro membrane (Pall Corporation, Ann Arbor, MI, USA), and transferred into a 2 mL vial, followed by LC-MS analysis. The LC-MS analysis was performed on a MicrOTOF-Q II (Bruker Daltonics, Bremen, Germany) mass spectrometer, which was coupled with a 1290 high-performance liquid chromatography (HPLC) system (Agilent, Santa Clara, CA, USA). Solvent A consisted of water/acetonitrile (95:5, v/v with 0.1% formic acid) in contrast to solvent B (95:5 acetonitrile/water, v/v with 0.1% formic acid). The separation was achieved using a Waters Acquity UPLC BEH C18 column (100 × 2.1 mm, 1.7 μm, Waters, Minnesota, MN, USA) at a flow rate of 0.35 mL/min. The gradient program applied was as follows: 95% A (0 min), 70% A (5 min), 5% A (10–12 min). Post-run re-equilibrium took 3 min. A 2 μL aliquot of each extract was injected, and mass spectra were recorded over an m/z range of 50 to 1000 in the positive mode. The instrumental setting followed previous protocols [35,36].
Metabolomic analysis by GC-TOF-MS: 50-mg tea powder was added into 1.5 mL water-methanol-dichloromethane solution (1:3:1) and 50 μL internal standard solution (200 μg/mL, adonitol). Extraction was carried out by sonication for 20 min, then the mixture was centrifuged for 5 min at 16,000 × g. 1.0 mL of upper layer solution was transferred to a 1.5 mL Eppendorf tube and vacuum-dried in a CentriVap centrifugal vacuum concentrator (Labconco, TX, USA). The dried sample was then dissolved in 60 μL methoxyamine hydrochloride (20 mg/mL in pyridine) and incubated for 30 min at 80 °C; 80 μL BSTFA regent (1% TMCS, v/v) was added to the sample aliquot, incubated for 1.5 h at 70 °C. GC-TOF-MS analysis was performed using an Agilent 7890 gas chromatograph system coupled with a Pegasus HT time-of-flight mass spectrometer. The system utilizes a DB-5MS capillary column coated with 5% diphenyl cross-linked with 95% dimethylpolysiloxane (30 m × 250 μm inner diameter, 0.25-μm thick film; J&W Scientific, Folsom, CA, USA). A 1 μL aliquot of the analyte was injected in the splitless mode. Helium was used as the carrier gas, the front inlet purge flow was 3 mL/min, and the gas flow rate through the column was 1 mL/min. The initial temperature was 50 °C for 1 min, then rose to 310 °C at a rate of 20 °C /min, then maintained at 310 °C for 6 min. The injector, transfer line, and ion source temperatures were 280, 280, and 250 °C, respectively. The energy was −70 eV in the electron impact mode. The mass spectrometry data were acquired in the full-scan mode with the m/z range of 50–500 at a rate of 12.5 spectra per second after a solvent delay of 4.78 min.

2.6. Data Processing and Multivariate Data Analysis

LC-Q-TOF MS data were converted into the NetCDF format (*.cdf), then processed with XCMS Online (version 3.7.1, Scripps Center for Metabolomics, La Jolla, CA, USA) (https://xcmsonline.scripps.edu) to obtain the m/z values, retention times, p-values, q-values, and peak areas of each feature [37]. Chroma TOF 4.3X software (LECO Corporation, St Joseph, MI, USA) and LECO-Fiehn Rtx5 database were used for GC-TOF-MS raw peak extracting, data baseline filtering, and calibration of the baseline, peak alignment, deconvolution analysis, peak identification and integration of the peak area. Both mass spectrum match and retention index match were taken into account for metabolite identification. Peak areas were normalized to the internal standard, and normalized data were exported to MS Office Excel (version 2019, Microsoft Corporation., Redmond, WA, USA) and then subjected to multivariate analysis such as principal component analysis and partial least squares-discriminant analysis using SIMCA-P + software (version 14.0, Umertrics, Umea, Sweden). A box-and-whisker plot was constructed using Statistica (version 7.0; StatSoft Inc., Tulsa, OK, USA).

2.7. Statistical Analysis

Statistical analysis was conducted using the SPSS statistical software (version 21; SPSS Corp., Chicago, IL, USA). The significance difference between groups were analyzed by one-way ANOVA.

3. Results

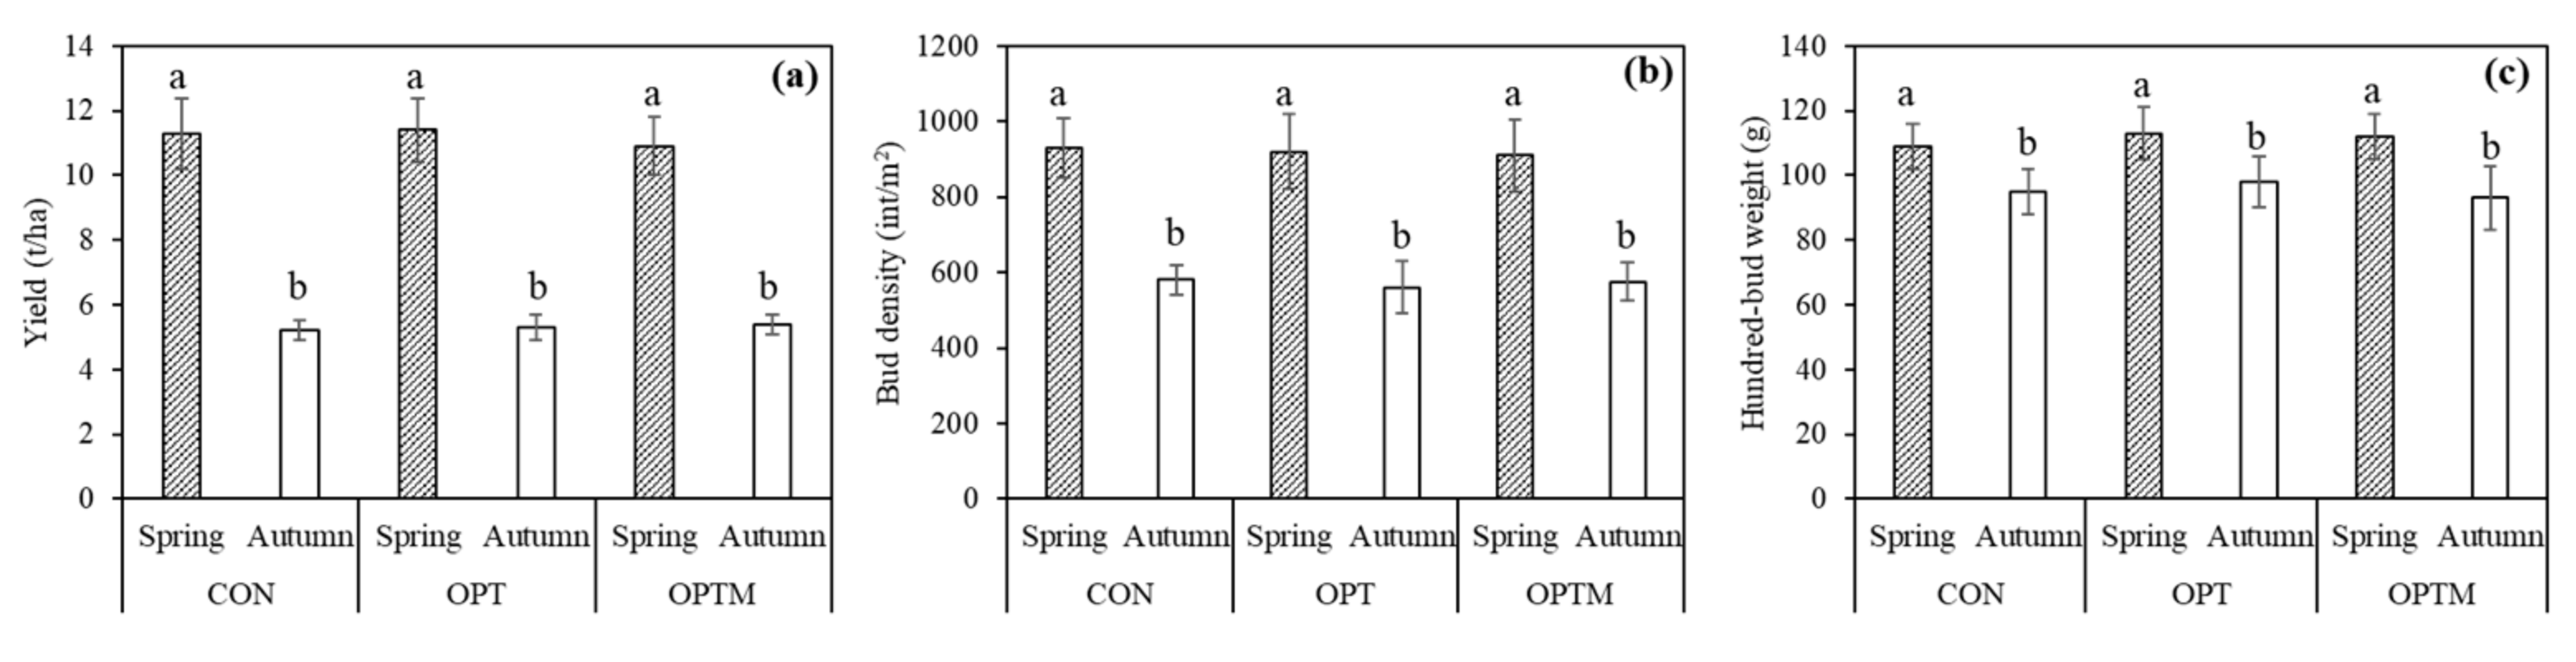
3.1. Tea Yield and Quality Analysis

To optimize nutrient management in tea production, the oolong tea was grown under control (CON), optimized fertilization (OPT), and optimized fertilization supplemented with Mg (OPTM) conditions in this study. Spring tea showed significantly higher yield, bud density, and hundred bud weight than autumn tea (Figure 1). OPT reduced 43.4% N, 58.0% P, and 55.0% K fertilizers compared to the CON treatment and did not lead to yield decreases, suggesting severe overapplication of macronutrients and high likelihood of nutrient imbalance in farmers’ tea production. Mg supplementation did not change tea yield in spring and autumn. Excessive K+ particularly antagonizes Mg2+ uptake [27], together with low pH and high concentrations of Mn2+ and Al3+, frequently causing Mg deficiency in the tea field [38,39].
Mg fertilization has stimulatory effects on crop yield and/or quality [27,28]. We speculated that Mg supplementation may improve tea quality. The taste indicator is one of critical criteria used by tea experts to determine tea grades [40]. The complex taste of tea infusion is based on umami, astringency, and bitterness. As shown in Figure 2, the umami score of the OPTM tea was 4.5, significantly higher than that of CON and OPT tea. By contrast, astringency and bitterness scores of the OPTM tea were 3.3 and 3.5, respectively, significantly lower than those of CON and OPT tea. Therefore, Mg fertilization significantly enhanced the umami taste while reducing astringency and bitterness, giving rise to a more favorable flavor. OPT had no significant effect on tea taste compared with the CON treatment.
Quality oolong tea generally has a lower ratio of tea polyphenols (TP) to free amino acids (FAA) [41]. Mg fertilization significantly reduced the ratio by enhancing accumulation of FAA (Table 1), while OPT promoted accumulation of tea polyphenols, suggesting Mg supplementation favors production of quality tea.

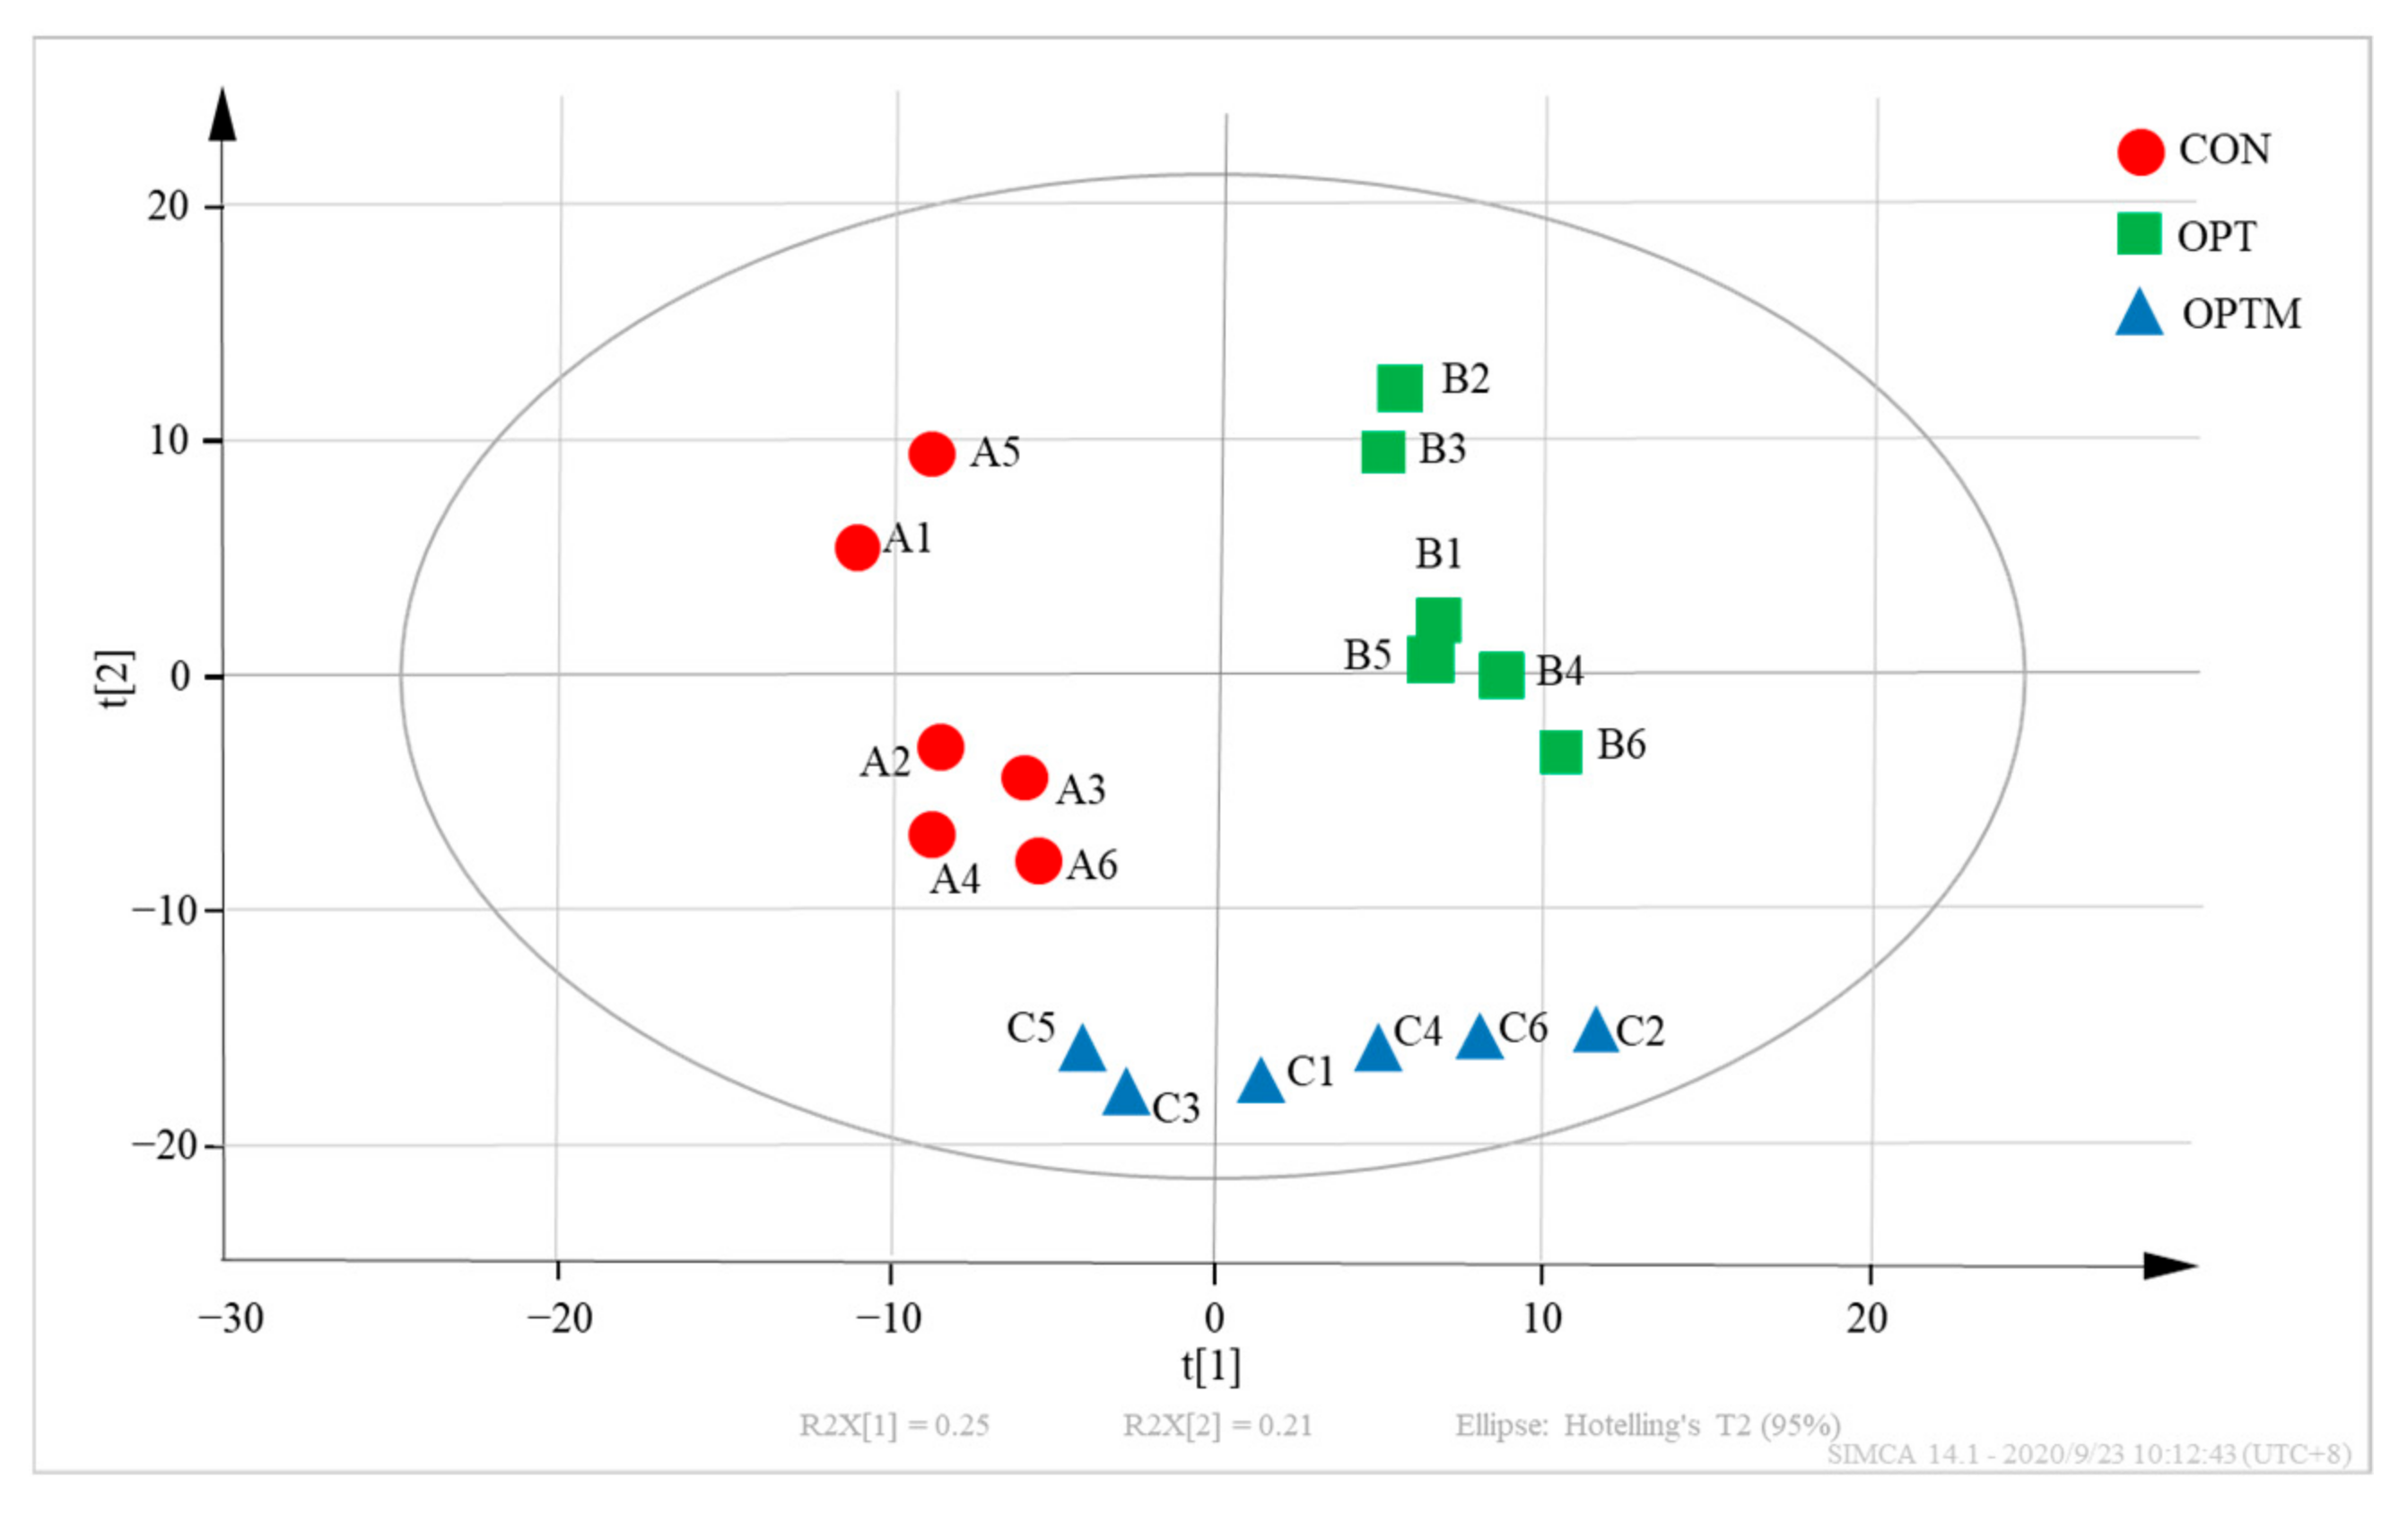
3.2. Identification of Differentail Metabolites between CON, OPT, and OPTM Samples

Primary and secondary metabolites contribute largely to the tea taste [42,43]. Using GC-TOF-MS and HPLC-Q-TOF–HRMS, non-targeted metabolomic analysis identified 132 metabolites out of approximately 1100 peaks according to the authentic standard, fragmentation pattern, database references. Partial least squares-discriminant analysis (PLS-DA) was performed to accurately predict the variables for class separation and subsequent improvement. Multivariate analysis showed that PLS-DA, including 25% of the first and 21% of the second principal component, collectively explained 46% of the total variance and well separated the CON, OPT, and OPTM classes (Figure 3). A similar separation pattern was observed using a PCA score plot with PC1 (24.7%) and PC2 (18.0%) (Supplementary Figure S2). The robustness of the PLS-DA model was indicated by R2 (goodness of fit) and Q2 (predictive ability) derived from the response permutation test (Supplementary Figure S3). In total, 34 metabolites meet the significance criteria (the projection VIP > 1.0 and p < 0.05) and were thus identified as significantly differential variables (Table 2; Table 3). These significant metabolites served as characteristic compounds to differentiate the CON, OPT, and OPTM tea.

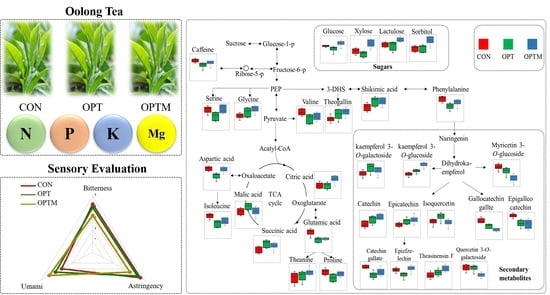
3.3. Metabolic Pathways and Compositional Differences between CON, OPT, and OPTM Treatments

The 34 significant metabolites included eight amino acids, seven organic acids, four sugars, seven catechins or dimeric catechin, seven flavonol or flavone glycosides and caffeine, which were illustrated in corresponding metabolic pathways in Figure 4 according to their biological functions. Most metabolites were involved in essential biological processes, such as sugar metabolism, tricarboxylic acid (TCA) cycle, amino acid metabolism, phenylpropanoid pathway, and flavonoid synthesis.

3.3.1. Sugars

Application of N fertilizers promotes photosynthesis which eventually facilitates sugar accumulation in tea leaves [44]. OPT dramatically cut N inputs on the basis of the farmer’s practice and led to decreases in reducing sugars glucose and xylose (Figure 4); however, Mg fertilization enhanced sugar accumulation across the pathway compared to the CON and OPT treatments. Four types of sugars including glucose, xylose, lactulose, and sorbitol showed consistent over-accumulation upon Mg application. Concentrations of total sugars increase when Mg is applied [20], and a more recent meta-analysis corroborates more sugar accumulation in crops due to Mg application [26].

3.3.2. Amino Acids

Amino acid metabolism plays important roles in shaping the amino acid profile that markedly affects the tea flavor; it also links C, N, and secondary metabolism, providing much more complicated impacts on tea quality [45]. The majority of amino acids had significantly lower concentrations in OPT samples than in the CON tea (Figure 4). These less abundant amino acids included serine, aspartic acid, isoleucine, glutamic acid, valine, phenylalanine, and proline. By contrast, concentrations of amino acids significantly increased with Mg application, including those of serine, aspartic acid, isoleucine, theanine, and proline.

3.3.3. Flavan-3-ols

Catechins refer to a set of plant-derived flavanols accounting for a major share of tea polyphenols. Total catechin accumulation maximizes at a N rate of 150 kg/ha in the tea field [46]. Fertilization optimization and Mg supplementation led to differential accumulation of individual catechin derivatives in tea leaves in this study. Compared to the farmers’ excessive N input, OPT significantly reduced N application to 150 kg/ha, which resulted in significant increases of concentrations of catechin and epicatechin. However, gallocatechin concentrations significantly deceased under the OPT condition compared to those under the CON condition. Mg application enhanced accumulation of catechin and epicatechin.
Flavonol glycosides mainly include quercetin glycoside, myricetin glycoside, and kaempferol glycoside [47]. The OPT treatment reduced concentrations of myricetin 3-O-glucoside; similarly, Mg application also negatively affected accumulation of myricetin 3-O-glucoside and quercetin 3-O-galactoside. The OPT treatment increased concentrations of kaempfer 3-O-galactoside and kaempferol 3-O-glucoside; Mg supplementation further enhanced accumulation of kaempferol 3-O-glucoside.

4. Discussion

China consumes approximately one third of global chemical fertilizers to feed a huge population [48]. Yield priority, dominance of small-holder growers, and low nutrient use efficiencies lead to widespread over-fertilization which skews nutrient ratios in the soil and imposes long-term negative effects on crop quality, soil health, and environment quality [13]. How to smoothly reduce inputs of synthetic chemical nutrients while ensuring food security arises as a crucial challenge to be tackled by scientists, farmers, and policy makers. Tea farmers apply a large quantity of nutrients (530 kg/ha N, 238 kg/ha P2O5, and 278 kg/ha K2O) following their own experiences or fellows, rather than crop demand, increasing the production cost and causing environmental pollution. We were able to make over 40% deductions towards optimal fertilization (300 kg/ha N, 100 kg/ha P2O5, and 125 kg/ha K2O) without sacrificing yield targets (Figure 1), suggesting that a large extent of fertilizer reduction in tea production is feasible. Therefore, substantial reduction of chemical fertilizers would prevent environmental pollution, and increase farmers’ earnings. Our results further suggested over-accumulation of individual sugars upon Mg fertilization, indicating a novel path for quality improvement in tea production by balanced fertilization.
Amino acids are mainly synthesized in roots and transported to new shoots in tea; N stimulates amino acid metabolism and promotes amino acid accumulation in tea plants, whereas concentrations of total amino acids decrease under phosphate deficiency [45,49]. Amino acids (especially glutamic acid, glutamate, theanine, and proline), succinic acid, gallic acid, and theogallin collectively determine approximately 70% of the umami intensity [8]. Theanine, a tea-specific amino acid, accounts for more than 60% of total amino acids in the oolong tea [50]. Therefore, theanine is one of the most important metabolites responsible for the umami taste and counteracts the bitterness and astringency of caffeine and catechin in tea [51]. Theanine abundance in tea serves as an important quality indicator. Theanine synthetase catalyzes L-theanine synthesis from glutamic acid and ethylamine [52,53], N overapplication negatively affects theanine accumulation [54]. OPTM, with substantial N reduction and 70 kg/ha Mg supplementation, caused a 13% increase of theanine concentrations, implying that Mg could function as a potential quality determinant of tea quality. Stimulation of theanine accumulation by OPTM, providing a nutrient and cost efficiency strategy for high-quality oolong tea production.
Mg favors photosynthesis to enhance amino acid biosynthesis [21]. In this study, umami metabolites theanine, proline, and aspartic acid were more abundant under the OPTM condition than under CON and OPT conditions, suggesting stimulatory effects of OPTM on the umami taste of oolong tea. By contrast, astringency and bitter metabolites such as quercetin 3-O-galactoside, myricetin 3-O-glucoside, gallocatechin gallte, and epigallcocatechin showed elevated accumulation in CON and OPT tea samples, indicating that CON and OPT teas were more astringent and bitter. In addition, four sweet-tasting carbohydrates glucose, xylose, lactulose, and sorbitol were enriched in OPTM samples, which may contribute to bitterness suppression and enhancement of tea flavor. Lastly, flavonol glycosides have complicated effects on the flavor of tea soup [47], which may induce mouth-coating sensation at very low concentrations. How they affect oolong tea quality prior- and post fermentation requires further investigation.

5. Conclusions

Farmers unintentionally over apply macronutrients in tea production, which antagonizes uptake of other essential nutrients and may adversely affect tea growth and quality. N over-fertilization accelerates soil acidification, further causing Mg deficiency. Our results show that reduction of 43% N, 58% P2O5, and 55% K2O is feasible in tea production at least in Anxi, Fujian. Mg application reduced the TP/FAA ratio. Metabolomic analysis revealed 34 differentially accumulated compounds between different treatments. Enhanced accumulation of amino acids, sugars, catechin and epicatechin upon Mg supplementation suggested that Mg serves as a critical nutrient in regulating oolong tea quality. In particular, Mg application improved the umami of oolong tea via enrichment of theanine, proline, and aspartic acid, while reducing accumulation of astringency and bitter metabolites such as isoquercetin, quercetin 3-O-galactoside, myricetin 3-O-glucoside, gallocatechin gallte and epigallcocatechin. Thus, fertilization optimization with Mg addition holds great potential for larger-scale application in tea production for quality improvement. Future studies are required to optimize Mg fertilization rates and to investigate the physiological mechanism of how Mg alters accumulation of quality-related metabolites.

Supplementary Materials

The following are available online at https://0-www-mdpi-com.brum.beds.ac.uk/2077-0472/11/2/120/s1. Figure S1. Random distribution of three types of fertilized plots in an experimental tea field in Anxi, Fujian. Figure S2. PCA score plots derived from non-targeted metabolite profiling of three different treatments analyzed by HPLC-TOF-MS and GC-TOF-MS. Figure S3. The response permutation test (n = 100) to estimate the statistical significance of the PLS-DA model.

Author Contributions

Conceptualization, J.X. and X.L.; methodology, J.X. and B.T.; software, J.X.; validation, J.X., L.W., and X.L.; formal analysis, J.X.; investigation, J.X., Z.H., and J.Y.; resources, L.W.; data curation, L.W.; writing—original draft preparation, J.X. and X.L.; writing—review and editing, J.X., L.W., W.L., and X.L.; supervision, L.W. and X.L.; project administration, L.W. and X.L.; funding acquisition, L.W. All authors have read and agreed to the published version of the manuscript.

Funding

This study was supported by the National Science Foundation of China (No. 31772385, 31902121, and 31501832) and National Key R&D Program of China (2016YFD0200400/ 2016YFD0200401).

Institutional Review Board Statement

Not applicable.

Informed Consent Statement

Not applicable.

Data Availability Statement

The data presented in this study are available on request from the corresponding author.

Conflicts of Interest

The authors declare no conflict of interest.

References

  1. Wang, C.; Lv, S.; Wu, Y.; Gao, X.; Li, J.; Zhang, W.; Meng, Q. Oolong tea made from tea plants from different locations in Yunnan and Fujian, China showed similar aroma but different taste characteristics. SpringerPlus 2016, 5, 576. [Google Scholar] [CrossRef] [Green Version]
  2. Ji, H.G.; Lee, Y.-R.; Lee, M.-S.; Hwang, K.-H.; Park, C.Y.; Kim, E.-H.; Park, J.S.; Hong, Y.-S. Diverse metabolite variations in tea (Camellia sinensis L.) leaves grown under various shade conditions revisited: A metabolomics study. J. Agric. Food Chem. 2018, 66, 1889–1897. [Google Scholar] [CrossRef]
  3. Zhang, L.; Cao, Q.Q.; Granato, D.; Xu, Y.Q.; Ho, C.T. Association between chemistry and taste of tea: A review. Trends Food Sci. Tech. 2020, 101, 139–149. [Google Scholar] [CrossRef]
  4. Fei, Q.; Gao, Y.; Zhang, X.; Sun, Y.; Hu, B.; Zhou, L.; Jabbar, S.; Zeng, X. Effects of Oolong tea polyphenols, EGCG, and EGCG3″Me on pancreatic alpha-amylase activity in vitro. J. Agric. Food Chem. 2014, 623, 9507–9514. [Google Scholar] [CrossRef] [PubMed]
  5. Rumpler, W.; Seale, J.; Clevidence, B.; Judd, J.; Wiley, E.; Yamamoto, S.; Komatsu, T.; Sawaki, T.; Ishikura, Y.; Hosoda, K. Oolong tea increases metabolic rate and fat oxidation in men. J. Nutr. 2001, 131, 2848–2852. [Google Scholar] [CrossRef] [PubMed] [Green Version]
  6. Yan, Z.; Zhong, Y.; Duan, Y.; Chen, Q.; Li, F. Antioxidant mechanism of tea polyphenols and its impact on health benefits. Anim. Nutr. 2020, 6, 115–123. [Google Scholar] [CrossRef] [PubMed]
  7. Zhang, H.; Qi, R.; Mine, Y. The impact of oolong and black tea polyphenols on human health. Food Biosci. 2019, 29, 55–61. [Google Scholar] [CrossRef]
  8. Ng, K.W.; Cao, Z.J.; Chen, H.B.; Zhao, Z.Z.; Zhu, L.; Yi, T. Oolong tea: A critical review of processing methods, chemical composition, health effects, and risk. Crit. Rev. Food Sci. 2018, 58, 2957–2980. [Google Scholar] [CrossRef] [PubMed]
  9. Tang, S.; Liu, Y.L.; Zheng, N.; Li, Y.; Ma, Q.X.; Xiao, H.; Zhou, X.; Xu, X.P.; Jiang, T.M.; He, P.; et al. Temporal variation in nutrient requirements of tea (Camellia sinensis) in China based on QUEFTS analysis. Sci. Rep. UK 2020, 10, 1745. [Google Scholar] [CrossRef] [Green Version]
  10. Qiao, C.L.; Xu, B.; Han, Y.T.; Wang, J.; Wang, X.; Liu, L.L.; Liu, W.X.; Wan, S.Q.; Tan, H.; Liu, Y.Z.; et al. Synthetic nitrogen fertilizers alter the soil chemistry, production and quality of tea. A meta-analysis. Agron. Sustain. Dev. 2018, 38, 10. [Google Scholar] [CrossRef]
  11. Ruan, L.; Wei, K.; Wang, L.Y.; Cheng, H.; Wu, L.Y.; Li, H.L. Characteristics of free amino acids (the quality chemical components of tea) under spatial heterogeneity of different nitrogen forms in tea (Camellia sinensis) plants. Molecules 2019, 24, 415. [Google Scholar] [CrossRef] [PubMed] [Green Version]
  12. Cui, Z.L.; Zhang, H.Y.; Chen, X.P.; Zhang, C.C.; Ma, W.Q.; Huang, C.D.; Zhang, W.F.; Mi, G.H.; Miao, Y.X.; Li, X.L.; et al. Pursuing sustainable productivity with millions of smallholder farmers. Nature 2018, 555, 363–366. [Google Scholar] [CrossRef] [PubMed]
  13. Zhang, F.S.; Cui, Z.L.; Fan, M.S.; Zhang, W.F.; Chen, X.P.; Jiang, R.F. Integrated soil-crop system management: Reducing environmental risk while increasing crop productivity and improving nutrient use efficiency in China. J. Environ. Q. 2011, 40, 1051–1057. [Google Scholar] [CrossRef]
  14. Xu, Q.; Hu, K.L.; Wang, X.L.; Wang, D.H.; Knudsen, M.T. Carbon footprint and primary energy demand of organic tea in China using a life cycle assessment approach. J. Clean. Prod. 2019, 233, 782–792. [Google Scholar] [CrossRef]
  15. Zhang, X.; Davidson, E.A.; Mauzerall, D.L.; Searchinger, T.D.; Dumas, P.; Shen, Y. Managing nitrogen for sustainable development. Nature 2015, 528, 51–59. [Google Scholar] [CrossRef] [Green Version]
  16. Guo, J.H.; Liu, X.J.; Zhang, Y.; Shen, J.L.; Han, W.X.; Zhang, W.F.; Christie, P.; Goulding, K.W.T.; Vitousek, P.M.; Zhang, F.S. Significant acidification in major Chinese croplands. Science 2010, 327, 1008–1010. [Google Scholar] [CrossRef] [Green Version]
  17. Liu, X.J.; Duan, L.; Mo, J.M.; Du, E.Z.; Shen, J.L.; Lu, X.K.; Zhang, Y.; Zhou, X.B.; He, C.N.; Zhang, F.S. Nitrogen deposition and its ecological impact in China: An overview. Environ. Pollut. 2011, 159, 2251–2264. [Google Scholar] [CrossRef]
  18. Zhu, Q.C.; Liu, X.J.; Hao, T.X.; Zeng, M.F.; Shen, J.B.; Zhang, F.S.; de Vries, W. Cropland acidification increases risk of yield losses and food insecurity in China. Environ. Pollut. 2020, 256, 113145. [Google Scholar] [CrossRef]
  19. Ui Haq, S.; Boz, I.; Shahbaz, P.; Yildirim, C. Evaluating eco-efficiency and optimal levels of fertilizer use based on the social cost and social benefits in tea production. Environ. Sci. Pollut. Res. 2020, 27, 33008–33019. [Google Scholar] [CrossRef]
  20. Jayaganesh, S.; Venkatesan, S. Impact of magnesium sulphate on biochemical and quality constituents of black tea. Am. J. Food Technol. 2010, 5, 31–39. [Google Scholar] [CrossRef] [Green Version]
  21. Cakmak, I. Magnesium in crop production, food quality and human health. Plant. Soil. 2013, 368, 1–4. [Google Scholar] [CrossRef] [Green Version]
  22. Senbayram, M.; Gransee, A.; Wahle, V.; Thiel, H. Role of magnesium fertilisers in agriculture: Plant-soil continuum. Crop. Pasture Sci. 2015, 66, 1219–1229. [Google Scholar] [CrossRef]
  23. Martinez-Ballesta, M.C.; Dominguez-Perles, R.; Moreno, D.A.; Muries, B.; Alcaraz-Lopez, C.; Bastias, E.; Garcia-Viguera, C.; Carvajal, M. Minerals in plant food: Effect of agricultural practices and role in human health. A review. Agron Sustain. Dev. 2010, 30, 295–309. [Google Scholar] [CrossRef]
  24. Guo, W.L.; Nazim, H.; Liang, Z.S.; Yang, D.F. Magnesium deficiency in plants: An urgent problem. Crop. J. 2016, 4, 83–91. [Google Scholar] [CrossRef] [Green Version]
  25. Ruan, J.Y.; Ma, L.F.; Yang, Y.J. Magnesium nutrition on accumulation and transport of amino acids in tea plants. J. Sci. Food Agric. 2012, 92, 1375–1383. [Google Scholar] [CrossRef] [PubMed]
  26. Wang, Z.; Ul Hassan, M.; Nadeem, F.; Wu, L.Q.; Zhang, F.S.; Li, X.X. Magnesium fertilization improves crop yield in most production systems: A meta-analysis. Front. Plant Sci. 2020, 10, 1727. [Google Scholar] [CrossRef] [Green Version]
  27. Ruan, J.Y.; Wu, X.; Ye, Y.; Hardter, R. Effect of potassium, magnesium and sulphur applied in different forms of fertilisers on free amino acid content in leaves of tea (Camellia sinensis L.). J. Sci. Food Agric. 1998, 76, 389–396. [Google Scholar] [CrossRef]
  28. Ruan, J.Y.; Wu, X.; Hardter, R. Effects of potassium and magnesium nutrition on the quality components of different types of tea. J. Sci. Food Agric. 1999, 79, 47–52. [Google Scholar] [CrossRef]
  29. Xu, J.L.; Shin, J.S.; Park, S.K.; Kang, S.; Jeong, S.C.; Moon, J.K.; Choi, Y. Differences in the metabolic profiles and antioxidant activities of wild and cultivated black soybeans evaluated by correlation analysis. Food Res. Int. 2017, 100, 166–174. [Google Scholar] [CrossRef]
  30. Huang, Z. Magnesium Fertilizer Efficiency Evaluation for Tieguanyin (Camellia sinensis (L.) O. Kuntze) and Special Magnesium Fertilizer Applicated Assessment. Master’s Thesis, Fujian Agriculture and Forestry University, Fujian, Beijing, April 2020. (In Chinese). [Google Scholar]
  31. Huang, Z.; Yin, J.; Huang, Y.; Su, D.; Wu, L. Magnesium fertilizer efficiency and its relation to the nutrient absorption and utilization of tea plant in oolong tea producing area. J. Southern Agric. 2020, 51, 2120–2129. [Google Scholar] [CrossRef]
  32. Fraser, K.; Lane, G.A.; Otter, D.E.; Harrison, S.J.; Quek, S.Y.; Hemar, Y.; Rasmussen, S. Non-targeted analysis by LC-MS of major metabolite changes during the oolong tea manufacturing in New Zealand. Food Chem. 2014, 151, 394–403. [Google Scholar] [CrossRef] [PubMed]
  33. National Standard of the People’s Republic of China, GB/T 8313. Determination of Total Polyphenols and Catechins Content in Tea; Standardization Administration of the People’s Republic of China: Beijing, China, 2008. (In Chinese)
  34. National Standard of the People’s Republic of China, GB/T 8314. Determination of Free Amino Acids Content in Tea; Standardization Administration of the People’s Republic of China: Beijing, China, 2013. (In Chinese)
  35. Hyeon, H.; Xu, J.L.; Kim, J.K.; Choi, Y. Comparative metabolic profiling of cultivated and wild black soybeans reveals distinct metabolic alterations associated with their domestication. Food Res. Int. 2020, 134, 109290. [Google Scholar] [CrossRef] [PubMed]
  36. Zhang, Q.F.; Shi, Y.Z.; Ma, L.F.; Yi, X.Y.; Ruan, J.Y. Metabolomic analysis using ultra-performance liquid chromatography-quadrupole-time of flight mass spectrometry (UPLC-Q-TOF MS) uncovers the effects of light intensity and temperature under shading treatments on the metabolites in tea. PLoS ONE 2014, 9, 112572. [Google Scholar] [CrossRef] [PubMed]
  37. Tautenhahn, R.; Patti, G.J.; Rinehart, D.; Siuzdak, G. XCMS online: A web-based platform to process untargeted metabolomic data. Anal. Chem. 2012, 84, 5035–5039. [Google Scholar] [CrossRef] [PubMed] [Green Version]
  38. Yang, X.D.; Ni, K.; Shi, Y.Z.; Yi, X.Y.; Zhang, Q.F.; Fang, L.; Ma, L.F.; Ruan, J.Y. Effects of long-term nitrogen application on soil acidification and solution chemistry of a tea plantation in China. Agric. Ecosyst. Environ. 2018, 252, 47–80. [Google Scholar] [CrossRef]
  39. Mehra, A.; Baker, C.L. Leaching and bioavailability of aluminium, copper and manganese from tea (Camellia sinensis). Food Chem. 2007, 100, 1456–1463. [Google Scholar] [CrossRef]
  40. Liang, Y.L.; Lu, J.L.; Zhang, L.Y.; Wu, S.; Wu, Y. Estimation of black tea quality by analysis of chemical composition and colour difference of tea infusions. Food Chem. 2003, 80, 283–290. [Google Scholar] [CrossRef]
  41. Lin, X.H.; Sun, W.D. Recent developments in vibrational spectroscopic techniques for tea quality and safety analyses. Trends Food Sci. Tech. 2020, 104, 163–176. [Google Scholar] [CrossRef]
  42. Fritz, C.; Palacios-Rojas, N.; Feil, R.; Stitt, M. Regulation of secondary metabolism by the carbon-nitrogen status in tobacco: Nitrate inhibits large sectors of phenylpropanoid metabolism. Plant. J. 2006, 46, 533–548. [Google Scholar] [CrossRef]
  43. Scharbert, S.; Hofmann, T. Molecular definition of black tea taste by means of quantitative studies, taste reconstitution, and omission experiments. J. Agric. Food Chem. 2005, 53, 5377–5384. [Google Scholar] [CrossRef] [PubMed]
  44. Zeng, L.T.; Zhou, Y.; Fu, X.M.; Mei, X.; Cheng, S.H.; Gui, J.D.; Dong, F.; Tang, J.C.; Ma, S.Z.; Yang, Z.Y. Does oolong tea (Camellia sinensis) made from a combination of leaf and stem smell more aromatic than leaf-only tea? Contribution of the stem to oolong tea aroma. Food Chem. 2017, 237, 488–498. [Google Scholar] [CrossRef] [PubMed]
  45. Yang, T.Y.; Li, H.P.; Tai, Y.L.; Dong, C.X.; Cheng, X.M.; Xia, E.H.; Chen, Z.P.; Li, F.; Wan, X.C.; Zhang, Z.L. Transcriptional regulation of amino acid metabolism in response to nitrogen deficiency and nitrogen forms in tea plant root (Camellia sinensis L.). Sci Rep. UK 2020, 10, 6868. [Google Scholar] [CrossRef] [PubMed] [Green Version]
  46. Okemwa, E.K.; Silvanuss, K.K. Effects of different fertilizer rates on total polyphenols and catechins of selected clones of green tea (Camellia sinensis L. [O] Kuntze). World J. Appl. Chem. 2020, 5, 13–19. [Google Scholar] [CrossRef]
  47. Dong, F.; Hu, J.H.; Shi, Y.Z.; Liu, M.Y.; Zhang, Q.F.; Ruan, J.Y. Effects of nitrogen supply on flavonol glycoside biosynthesis and accumulation in tea leaves (Camellia sinensis). Plant. Physiol. Bioch. 2019, 138, 48–57. [Google Scholar] [CrossRef]
  48. Yu, C.; Huang, X.; Chen, H.; Godfray, H.C.; Wright, J.S.; Hall, J.W.; Gong , P.; Ni, S.; Qiao, S.; Huang, G.; et al. Managing nitrogen to restore water quality in China. Nature 2019, 567, 516–520. [Google Scholar] [CrossRef]
  49. Lin, Z.H.; Qi, Y.P.; Chen, R.B.; Zhang, F.Z.; Chen, L.S. Effects of phosphorus supply on the quality of green tea. Food Chem. 2012, 130, 908–914. [Google Scholar] [CrossRef]
  50. Liu, P.P.; Yin, J.F.; Chen, G.S.; Wang, F.; Xu, Y.Q. Flavor characteristics and chemical compositions of oolong tea processed using different semi-fermentation times. J. Food Sci. Techchnol. 2018, 55, 1185–1195. [Google Scholar] [CrossRef]
  51. Dong, C.X.; Li, F.; Yang, T.Y.; Feng, L.; Zhang, S.P.; Li, F.D.; Li, W.H.; Xu, G.H.; Bao, S.L.; Wan, X.C.; et al. Theanine transporters identified in tea plants (Camellia sinensis L.). Plant. J. 2020, 101, 57–70. [Google Scholar] [CrossRef]
  52. Deng, W.W.; Ogita, S.; Ashihara, H. Distribution and biosynthesis of theanine in Theaceae plants. Plant. Physiol. Bioch. 2010, 48, 70–72. [Google Scholar] [CrossRef] [PubMed]
  53. Ruan, J.; Haerdter, R.; Gerendas, J. Impact of nitrogen supply on carbon/nitrogen allocation: A case study on amino acids and catechins in green tea [Camellia sinensis (L.) O. Kuntze] plants. Plant. Biol. 2010, 12, 724–734. [Google Scholar] [CrossRef]
  54. Sun, L.; Liu, Y.; Wu, L.; Liao, H. Comprehensive analysis revealed the close relationship between N/P/K status and secondary metabolites in tea leaves. ACS Omega 2019, 4, 176–184. [Google Scholar] [CrossRef] [Green Version]
Figure 1. The yield (a), bud density (b) and hundred bud weight (c) of oolong tea in spring and autumn of 2019. Different letters indicated significant differences between mean values (p < 0.05). CON, conventional fertilization; OPT, optimized fertilization; OPTM, optimized fertilization supplemented with Mg.
Agriculture 11 00120 g001
Figure 2. Spider web plot of the sensory indicators of oolong tea. Underlined numbers represented individual taste scores of conventional fertilization (CON, red), optimized fertilization (OPT, blue), and optimized fertilization supplemented with Mg (OPTM, green) teas determined by the panelists. “*” indicated significance at p < 0.05 by one-way ANOVA analysis.
Agriculture 11 00120 g002
Figure 3. Partial least squares-discriminant analysis (PLS-DA) score plot of primary and secondary metabolites identified by GC-TOF MS and LC-Q-TOF MS. CON, conventional fertilization; OPT, optimized fertilization; OPTM, optimized fertilization supplemented with Mg.
Agriculture 11 00120 g003
Figure 4. Schematic illustration of metabolic pathways affected in tea samples under three different treatments. Different letters (a, b, c) within the same box plot indicated significant differences between treatments (p < 0.05).
Agriculture 11 00120 g004
Table 1. Accumulation of tea polyphenols (TP) and free amino acids (FAA) in oolong tea.
TreatmentTP (mg/g DW)FAA (mg/g DW)Ratio of TP to FAA
CON158.3 ± 9.3 b26.5 ± 2.3 b6.0 ± 0.3 a
OPT165.6 ± 10.3 a26.3 ± 1.7 b6.3 ± 0.4 a
OPTM158.7 ± 7.6 b28.3 ± 2.4 a5.6 ± 0.3 b
Data are means ± SD (n = 5). DW = Dry weight. Different upper letters within the same column indicated a significant difference between treatments at p < 0.05 by one-way ANOVA analysis. CON, conventional fertilization; OPT, optimized fertilization; OPTM, optimized fertilization supplemented with Mg.
Table 2. Statistically important metabolites in different tea samples derived from using UPLC−Q-TOF MS analysis.
NO.Rt
(min)
Theoretical Mass (m/z)Accurate Mass (m/z)Error (ppm)IDMS2 a
Fragments
VIP bp Value c
12.61307.0813307.0804−2.9Epigallcocatechin d289, 153, 1391.304.85 × 10−4
22.86291.0863291.0856−2.4Catechin d139, 123, 951.202.30 × 10−2
33.19195.0877195.0871−3.1Caffeine d138, 110, 691.112.56 × 10−2
43.44291.0863291.0856−2.4Epichatechin d207, 139, 1231.103.30 × 10−2
53.45459.0922459.0914−1.7Gallocatechingallte d289, 181, 1531.441.30 × 10−5
63.49899.1678899.16881.1Theasinensin F d425, 287,1531.361.95 × 10−4
73.89275.0914275.0911−1.1Epizfzelechin d191, 139, 1071.362.17 × 10−3
83.98481.0977481.0955−4.5Myricetin 3-O-glucoside d3191.372.81 × 10−4
94.20443.0973443.0959−3.1Catechin gallate d273, 153, 1391.355.68 × 10−4
104.24773.2135773.21290.78Quercetin 3-O-glucosyl-rutinoside611, 465, 3031.682.31 × 10−3
114.42611.1607611.1600−1.15Rutin d465, 303, 851.432.30 × 10−3
124.48465.1028465.0998−6.5Quercetin 3-O-galactoside303, 165, 911.384.12 × 10−4
134.56465.3742465.37563.0Isoquercitrin d3031.131.59 × 10−2
144.87449.1079449.1053−5.8Kaempferol 3-O-glucoside287, 851.503.20 × 10−2
155.04449.1079449.1056−5.1Kaempferol 3-O-galactoside2871.024.30 × 10−2
Note: Differential accumulation of metabolites with VIP > 1.0 and p < 0.05 as the cut-off values. a MS2, tandem mass spectrometry. bVIP is the variable importance in the project, with values above 1.00 indicating high relevance to explain the difference between sample groups. c p values were analyzed by ANOVA. d Confirmed by authentic standards.
Table 3. Statistically important metabolites in tea samples derived from GC-TOF MS analysis.
NORt (min)IDMS2 a FragmentsVIP bp Value c
Sugars
115.61Xylose d217, 117, 741.496.70 × 10−5
218.10Glucose d205, 147, 1031.324.52 × 10−3
318.60Sorbitol d219, 293, 3081.311.52 × 10−3
424.93Lactulose d204, 131, 1471.133.20 × 10−3
Amino acids
58.61Valine d144, 218, 1001.092.56 × 10−2
69.73Isoleucine d158, 218, 1001.311.49 × 10−3
710.68Serine d204, 218, 1471.249.07 × 10−3
811.08Proline d142, 244, 2161.131.40 × 10−2
912.77Aspartic acid d232, 100, 1471.431.00 × 10−4
1014.15Glutamic acid d246, 147, 1001.379.80 × 10−4
1114.42Phenylalanine d218, 192, 1471.263.80 × 10−2
1214.98Theanine d160, 273, 1281.032.60 × 10−2
Organic acids
138.69Oxalic acid d147, 218, 1901.533.30 × 10−5
1411.30Succinic acid d147, 247, 731.102.10 × 10−2
1513.57Malic acid d147, 233, 2451.511.10 × 10−2
1617.26Shikimic acid d204, 147, 2671.052.40 × 10−2
1717.36Citric acid d273, 147, 3471.283.00 × 10−3
1815.28Tartaric acid147, 186, 2171.495.70 × 10−5
198.28Saccharic acid143, 217, 3331.337.74 × 10−4
Note: Differential accumulation of metabolites with VIP > 1.0 and p < 0.05 as the cut-off values. a MS2, tandem mass spectrometry. b VIP is the variable importance in the project, with values above 1.00 indicating high relevance to explain the difference between sample groups. c p values were analyzed by ANOVA. d Confirmed by authentic standards.
Publisher’s Note: MDPI stays neutral with regard to jurisdictional claims in published maps and institutional affiliations.

