
Manganese Supply Improves Bread Wheat Productivity, Economic Returns and Grain Biofortification under Conventional and No Tillage Systems

 ,
,  ,
, 

 ,
,  and
and 
Abstract
:1. Introduction
2. Materials and Methods
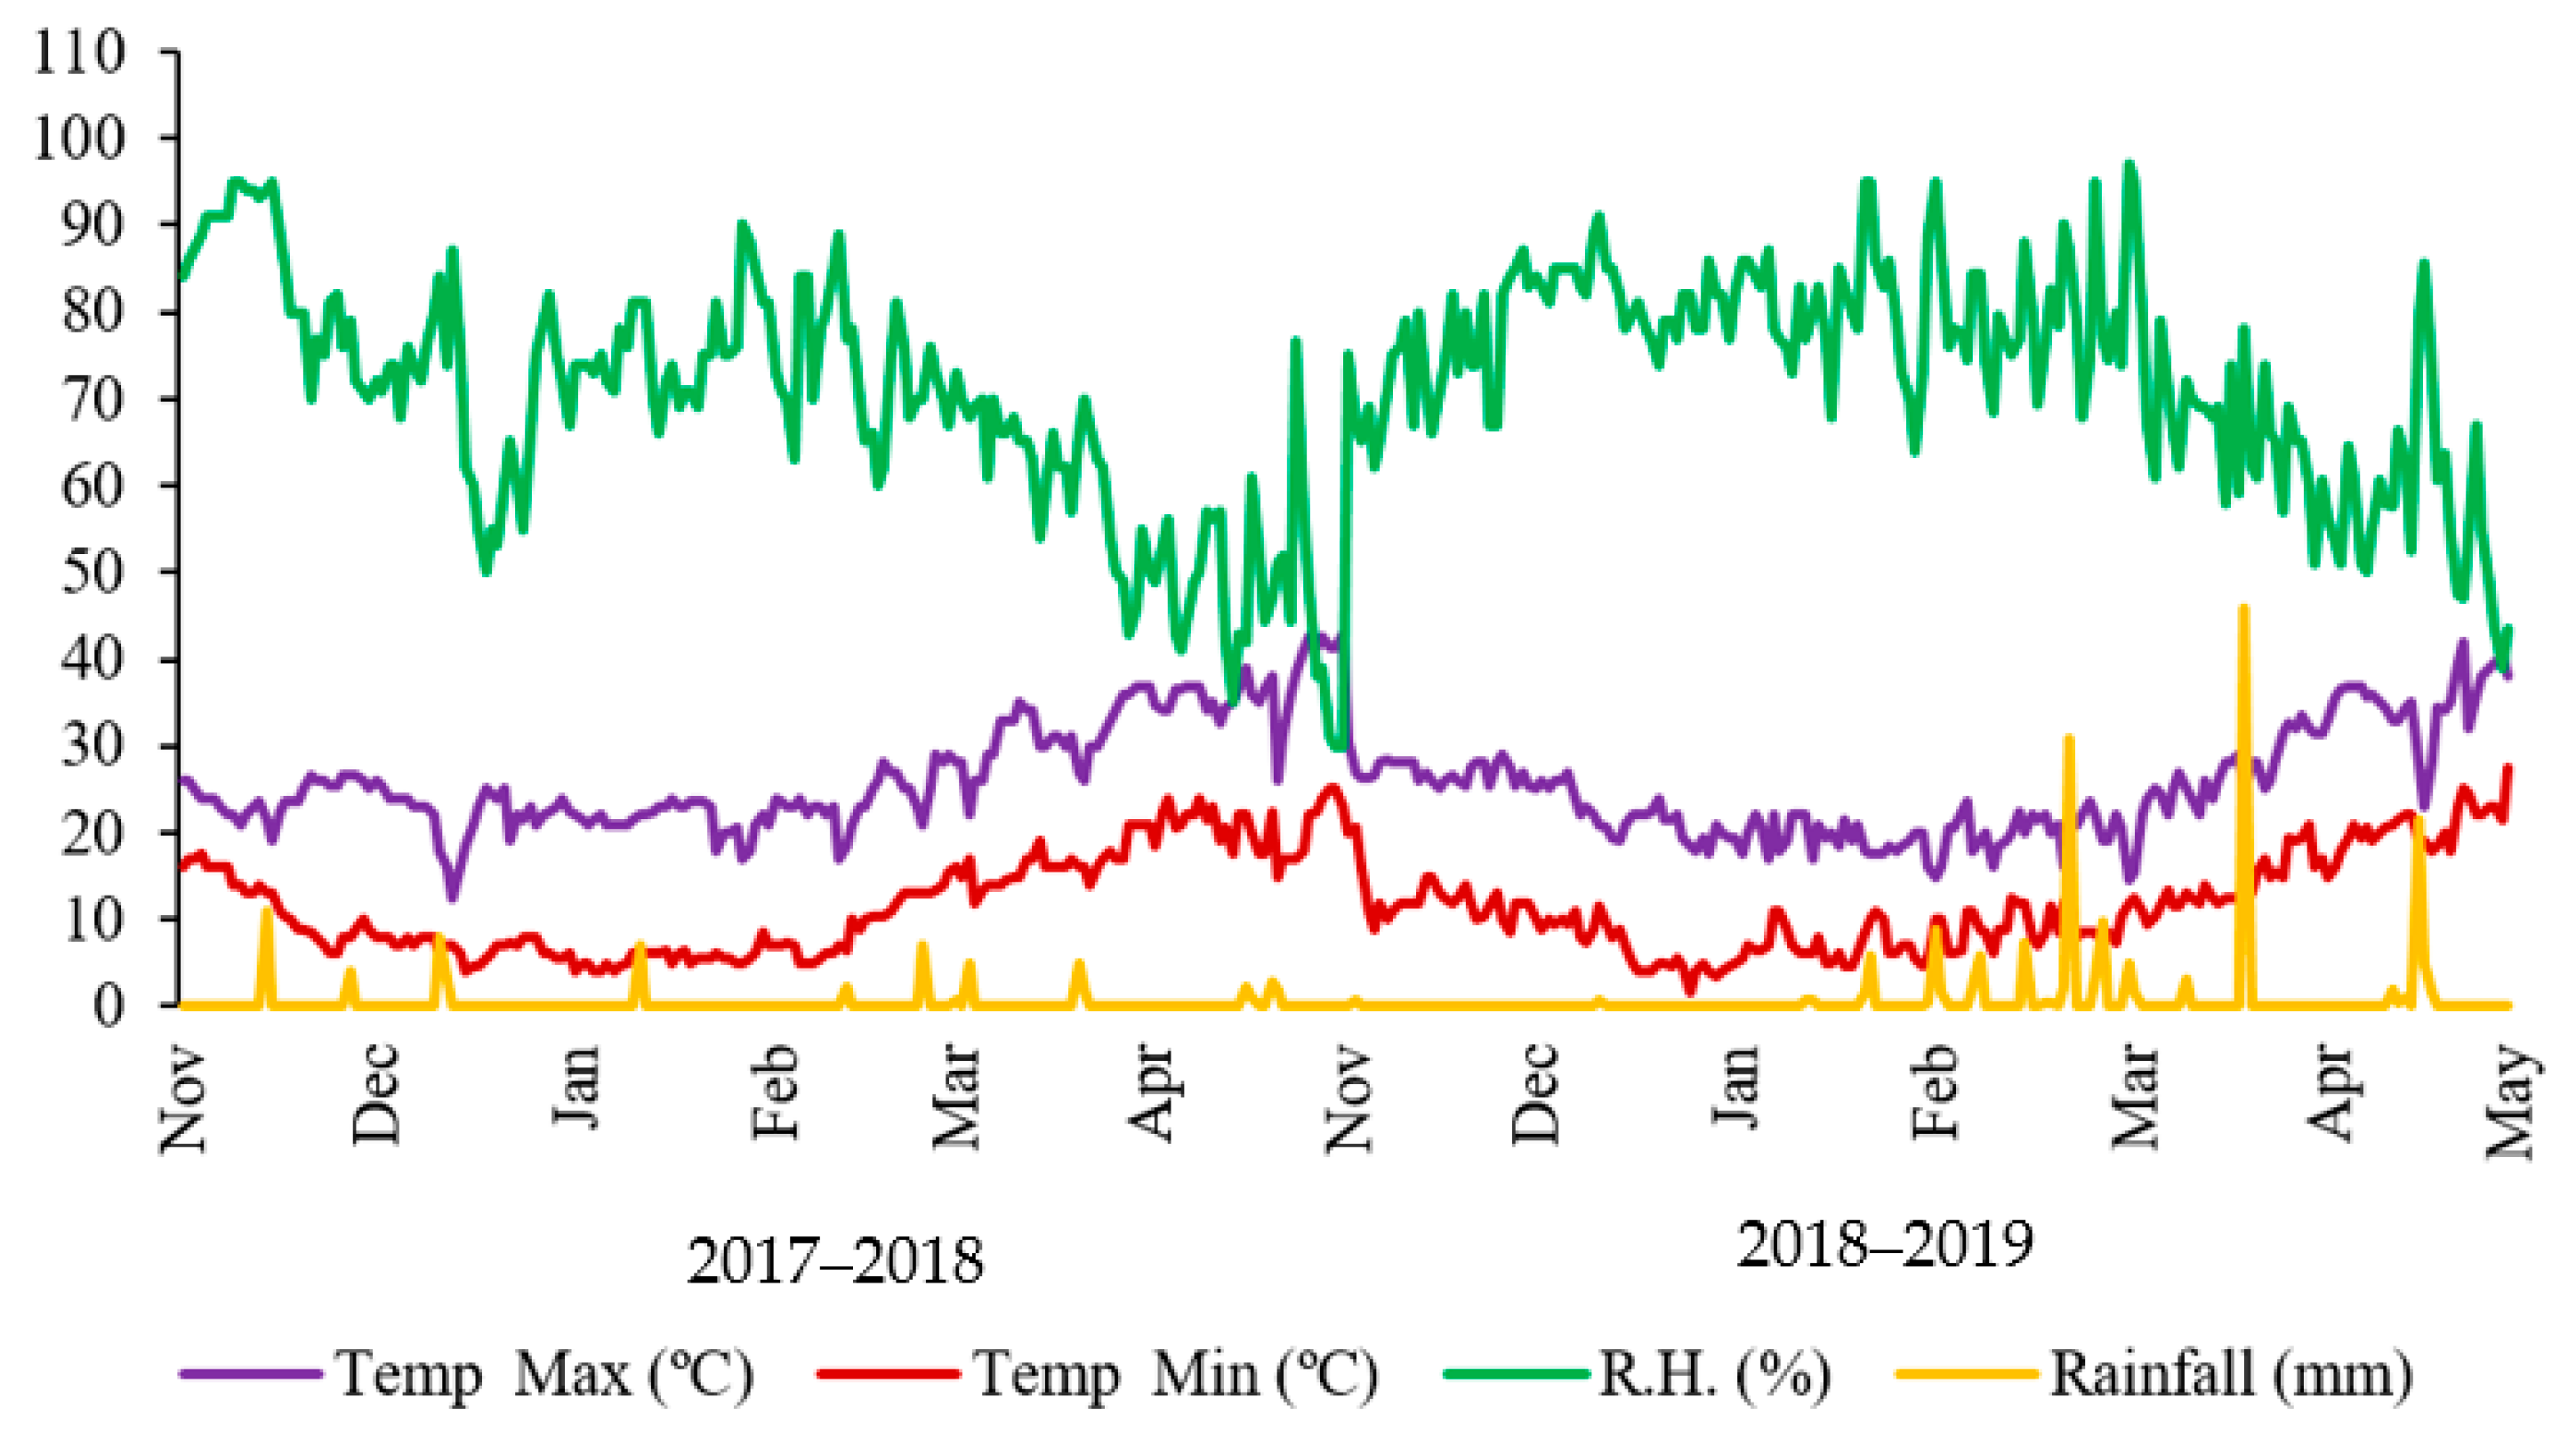
2.1. Site, Soil and Climate
2.2. Plant Material
2.3. Experimental Details
2.4. Observations, Measurements, and Data Analysis
2.4.1. Soil Properties
2.4.2. Yield Parameters
2.4.3. Grain and Straw Mn Concentrations
2.4.4. Estimation of Mn Use Efficiency
2.4.5. Economic Analysis
2.4.6. Statistical Analysis
3. Results
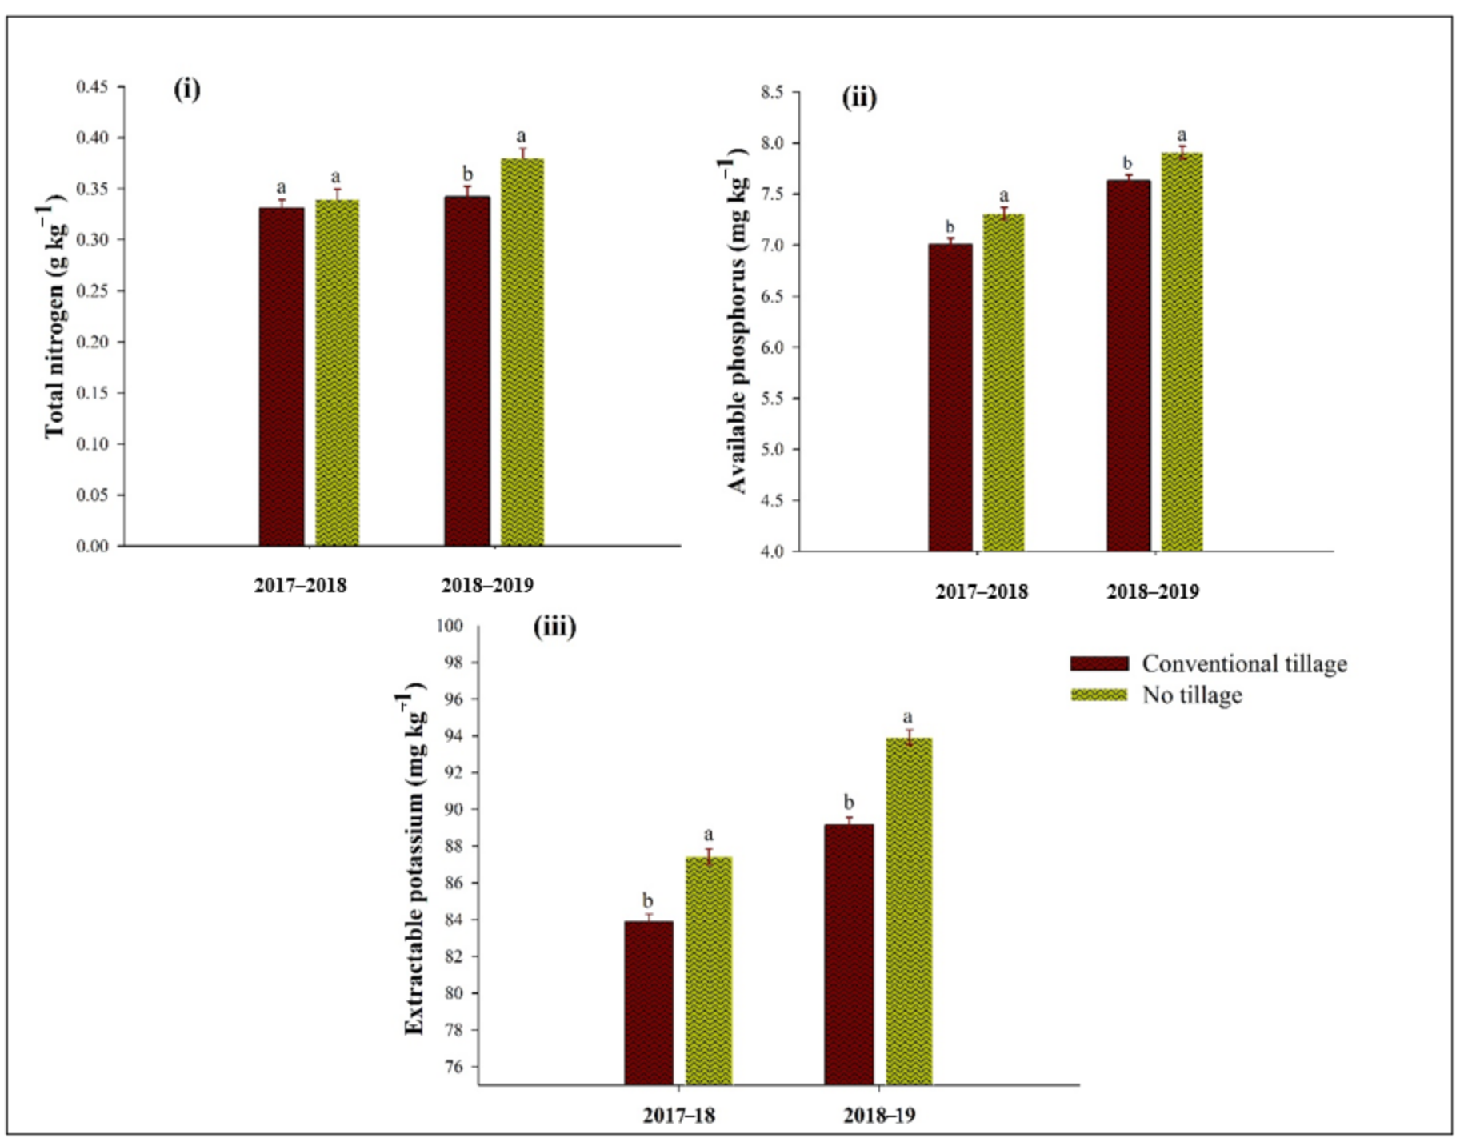
3.1. Soil Properties
3.2. Yield Parameters
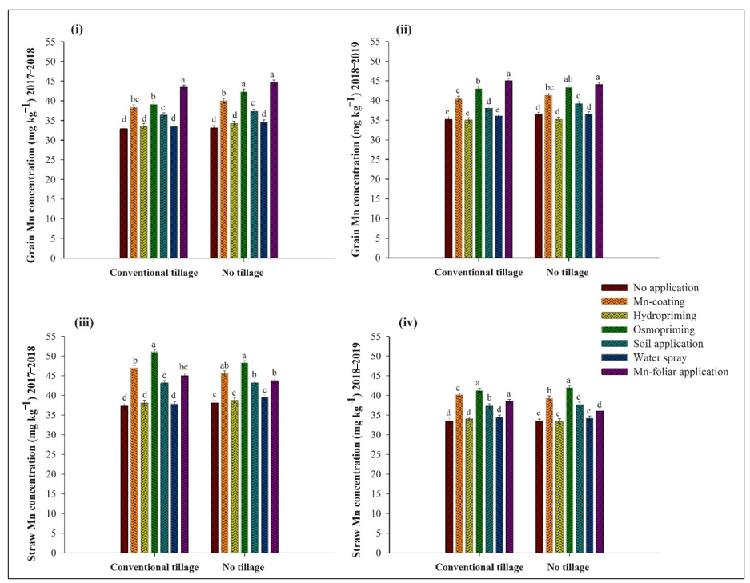
3.3. Grain and Straw Mn Concentrations
3.4. Manganese Use Efficiency Indices
3.5. Economic and Marginal Analysis
4. Discussion
5. Conclusions
Author Contributions
Funding
Institutional Review Board Statement
Informed Consent Statement
Data Availability Statement
Acknowledgments
Conflicts of Interest
References
- Hodge, J. Hidden hunger: Approaches to tackling micronutrient deficiencies. In Nourishing Millions: Stories of Change in Nutrition; Gillespie, S., Hodge, J., Yosef, S., Pandya-Lorch, R., Eds.; International Food Policy Research Institute: Washington, DC, USA, 2016; pp. 35–43. [Google Scholar] [CrossRef]
- International Food Policy Research Institute. Global Nutrition Report 2017: Nourishing the SDGs; IFPRI: Washington, DC, USA, 2017. [Google Scholar]
- Food and Agriculture Organization; International Fund for Agricultural Development; United Nations Children’s Fund; World Health Organization. The State of Food Security and Nutrition in the World: Building Resilience for Peace and Food Insecurity; FAO: Rome, Italy, 2017. [Google Scholar]
- Jawaldeh, A.A.; Pena-Rosas, J.P.; McColl, K.; Johnson, Q.; Elmadfa, I.; Nasreddine, L. Wheat Four Fortifcation in the Eastern Mediterranean Region; Licence: CC BY-NC-SA 3.0 IGO; WHO Regional Office for the Eastern Mediterranean: Cairo, Egypt, 2019. [Google Scholar]
- Bouis, H.E.; Eozenou, P.; Rahman, A. Food Prices, Household Income, and Resource Allocation: Socioeconomic Perspectives on Their Effects on Dietary Quality and Nutritional Status. Food Nutr. Bull. 2011, 32, S14–S23. [Google Scholar] [CrossRef] [PubMed] [Green Version]
- Bouis, H.E.; Hotz, C.; McClafferty, B.; Meenakshi, J.V.; Pfeiffer, W.H. Biofortification: A New Tool to Reduce Micronutrient Malnutrition. Food Nutr. Bull. 2011, 32, S31–S40. [Google Scholar] [CrossRef]
- Allen, S.L.; De Brauw, A. Nutrition sensitive value chains: Theory, progress, and open questions. Glob. Food Secur. 2018, 16, 22–28. [Google Scholar] [CrossRef]
- Kenzhebayeva, S.; Abekova, A.; Atabayeva, S.D.; Yernazarova, G.; Omirbekova, N.; Zhang, G.; Turasheva, S.; Asrandina, S.; Sarsu, F.; Wang, Y. Mutant Lines of Spring Wheat with Increased Iron, Zinc, and Micronutrients in Grains and Enhanced Bioavailability for Human Health. BioMed Res. Int. 2019, 2019, 1–10. [Google Scholar] [CrossRef] [Green Version]
- Tripathi, D.K.; Singh, S.; Singh, S.; Mishra, S.; Chauhan, D.K.; Dubey, N.K. Micronutrients and their diverse role in agricultural crops: Advances and future prospective. Acta Physiol. Plant. 2015, 37, 1–14. [Google Scholar] [CrossRef]
- Ducic, T.; Polle, A. Transport and detoxification of manganese and copper in plants. Braz. J. Plant Physiol. 2005, 17, 103–112. [Google Scholar] [CrossRef] [Green Version]
- Millaleo, R.; Diaz, M.R.; Ivanov, A.G.; Mora, M.; Alberdi, M. Manganese as Essential and Toxic Element for Plants: Transport, Accumulation and Resistance Mechanisms. J. Soil Sci. Plant Nutr. 2010, 10, 470–481. [Google Scholar] [CrossRef] [Green Version]
- Fageria, N.K. The Use of Nutrients in Crop Plants; CRC Press: Boca Raton, FL, USA, 2009; pp. 31–77. [Google Scholar] [CrossRef] [Green Version]
- Golub, M.S.; Hogrefe, C.E.; Germann, S.L.; Tran, T.T.; Beard, J.L.; Crinella, F.M.; Lonnerdal, B. Neurobehavioral evaluation of rhesus monkey infants fed cow’s milk formula, soy formula, or soy formula with added manganese. Neurotoxicol. Teratol. 2005, 27, 615–627. [Google Scholar] [CrossRef] [PubMed]
- Martinez-Finley, E.J.; Chakraborty, S.; Aschner, M. Manganese in Biological Systems. In Encyclopedia of Metalloproteins; Kretsinger, R.H., Uversky, V.N., Permyakov, E.A., Eds.; Springer: New York, NY, USA, 2013; pp. 1297–1303. [Google Scholar] [CrossRef]
- Livorness, J.; Smith, T.D. The role of manganese in photosynthesis. In Bioschemistry; Springer: Berlin/Heidelberg, Germany, 1982; pp. 1–44. [Google Scholar] [CrossRef]
- Grundmeier, A.; Dau, H. Structural models of the manganese complex of photosystem II and mechanistic implications. Biochim. Biophys. Acta (BBA) Bioenerg. 2012, 1817, 88–105. [Google Scholar] [CrossRef] [Green Version]
- Moosavi, A.A.; Ronaghi, A. Growth and Iron-Manganese Relationships in Dry Bean as Affected by Foliar and Soil Applications of Iron and Manganese in a Calcareous Soil. J. Plant Nutr. 2010, 33, 1353–1365. [Google Scholar] [CrossRef]
- Schmidt, S.B.; Jensen, P.E.; Husted, S. Manganese Deficiency in Plants: The Impact on Photosystem II. Trends Plant Sci. 2016, 21, 622–632. [Google Scholar] [CrossRef] [PubMed]
- Ullah, A.; Farooq, M.; Rehman, A.; Arshad, M.S.; Shoukat, H.; Nadeem, A.; Nawaz, A.; Wakeel, A.; Nadeem, F. Manganese Nutrition Improves the Productivity and Grain Biofortification of Bread Wheat in Alkaline Calcareous Soil. Exp. Agric. 2017, 54, 744–754. [Google Scholar] [CrossRef]
- Ullah, A.; Farooq, M.; Nadeem, A.; Rehman, A.; Asad, S.A.; Nawaz, A. Manganese nutrition improves the productivity and grain biofortification of fine grain aromatic rice in conventional and conservation production systems. Paddy Water Environ. 2016, 15, 563–572. [Google Scholar] [CrossRef]
- Graham, R.D. Micronutrient Deficiencies in Crops and Their Global Significance. In Micronutrient Deficiencies in Global Crop Production; Springer: Dodrecht, The Netherlands, 2008; pp. 41–61. [Google Scholar] [CrossRef]
- Sinclair, A.H.; Mackie-Dawson, L.A.; Linehan, D.J. Micronutrient inflow rates and mobilisation into soil solution in the root zone of winter wheat (Triticum aestivum L.). Plant Soil 1990, 122, 143–146. [Google Scholar] [CrossRef]
- Miao, S.; Delaune, R.; Jugsujinda, A. Influence of sediment redox conditions on release/solubility of metals and nutrients in a Louisiana Mississippi River deltaic plain freshwater lake. Sci. Total Environ. 2006, 371, 334–343. [Google Scholar] [CrossRef]
- Dixit, A.K.; Agrawal, R.K.; Das, S.K.; Sahay, C.S.; Choudhary, M.; Rai, A.K.; Palsaniya, D.R. Soil properties, crop productivity and energetics under different tillage practices in fodder sorghum + cowpea—Wheat cropping system. Arch. Agron. Soil Sci. 2019, 65, 492–506. [Google Scholar] [CrossRef]
- Bhowmik, A.; Kukal, S.S.; Saha, D.; Sharma, H.; Kalia, A.; Sharma, S. Potential Indicators of Soil Health Degradation in Different Land Use-Based Ecosystems in the Shiwaliks of Northwestern India. Sustainability 2019, 11, 3908. [Google Scholar] [CrossRef] [Green Version]
- Zulfiqar, U.; Maqsood, M.; Hussain, S.; Anwar-Ul-Haq, M. Iron Nutrition Improves Productivity, Profitability, and Biofortification of Bread Wheat under Conventional and Conservation Tillage Systems. J. Soil Sci. Plant Nutr. 2020, 20, 1298–1310. [Google Scholar] [CrossRef]
- Zulfiqar, U.; Hussain, S.; Ishfaq, M.; Matloob, A.; Ali, N.; Ahmad, M.; Alyemeni, M.N.; Ahmad, P. Zinc-Induced Effects on Productivity, Zinc Use Efficiency, and Grain Biofortification of Bread Wheat under Different Tillage Permutations. Agronomy 2020, 10, 1566. [Google Scholar] [CrossRef]
- Nawaz, A.; Farooq, M.; Nadeem, F.; Siddique, K.H.M.; Lal, R. Rice–wheat cropping systems in South Asia: Issues, options and opportunities. Crop. Pasture Sci. 2019, 70, 395–427. [Google Scholar] [CrossRef]
- Bouis, H.E. Biofortification: An Agricultural Tool to Address Mineral and Vitamin Deficiencies. In Food Fortification in a Globalized World; Venkatesh Manar, M.G., Hurell, R., Eds.; Academic Press: Cambridge, MA, USA, 2018; pp. 69–81. [Google Scholar] [CrossRef]
- Lalani, B.; Bechoff, A.; Bennett, B. Which Choice of Delivery Model(s) Works Best to Deliver Fortified Foods? Nutrients 2019, 11, 1594. [Google Scholar] [CrossRef] [Green Version]
- Velu, G.; Ortiz-Monasterio, I.; Cakmak, I.; Hao, Y.; Singh, R. Biofortification strategies to increase grain zinc and iron concentrations in wheat. J. Cereal Sci. 2014, 59, 365–372. [Google Scholar] [CrossRef]
- De Valença, A.; Bake, A.; Brouwer, I.; Giller, K.E. Agronomic biofortification of crops to fight hidden hunger in sub-Saharan Africa. Glob. Food Secur. 2017, 12, 8–14. [Google Scholar] [CrossRef]
- Zulfiqar, U.; Hussain, S.; Maqsood, M.; Ishfaq, M.; Ali, N. Zinc nutrition to enhance rice productivity, zinc use efficiency, and grain biofortification under different production systems. Crop Sci. 2021, 61, 739–749. [Google Scholar] [CrossRef]
- Cakmak, I. Enrichment of cereal grains with zinc: Agronomic or genetic biofortification? Plant Soil 2008, 302, 1–17. [Google Scholar] [CrossRef]
- Zulfiqar, U.; Maqsood, M.; Hussain, S. Biofortification of Rice with Iron and Zinc: Progress and Prospects. In Rice Research for Quality Improvement: Genomics and Genetic Engineering; Springer: Singapore, 2020; pp. 605–627. [Google Scholar] [CrossRef]
- Food and Agriculture Organization. World Reference Base for Soil Resources 2014. International Soil Classification System for Naming Soils and Creating Legends for Soil Maps; FAO: Rome, Italy, 2014. [Google Scholar]
- United States Department of Agriculture. Keys to Soil Taxonomy, 12th ed.; Natural Resources Conservation Service: Washington, DC, USA, 2014.
- Estefan, G.; Sommer, R.; Ryan, J. Methods of Soil, Plant, and Water Analysis. A Manual for the West Asia and North Africa Region; International Center for Agricultural Research in the Dry Areas: Aleppo, Syria, 2013; pp. 65–119. [Google Scholar]
- International Seed Testing Association. International Rules for Seed Testing; International Seed Testing Association: Zürich, Switzerland, 2015. [Google Scholar]
- Meier, U. Growth Stages of Mono-and Dicotyledonous Plants; Federal Biological Research Centre for Agriculture and Forestry: Berlin, Germany, 2001. [Google Scholar] [CrossRef]
- Blake, G.R.; Hartge, K.H. Bulk Density. In Methods of Soil Analysis, 2nd ed.; Agron. No. 9, Part I; Klute, A., Ed.; American Society of Agronomy: Madison, WI, USA, 1986; pp. 363–375. [Google Scholar] [CrossRef]
- Vomocil, J.A. Porosity. In Methods of Soil Analysis; Blake, C.A., Ed.; American Society of Agronomy: Madison, WI, USA, 1965; pp. 299–314. [Google Scholar] [CrossRef]
- Walkley, A.; Black, I.A. An Examination of the Degtjareff Method for Determining Soil Organic Matter, and a Proposed Modification of the Chromic Acid Titration Method. Soil Sci. 1934, 37, 29–38. [Google Scholar] [CrossRef]
- Bremner, J.; Mulvaney, C. Nitrogen-Total. In Methods of Soil Analysis; Page, A.L., Miller, R.H., Keeny, D.R., Eds.; American Society of Agronomy: Madison, WI, USA, 1982; pp. 1119–1123. [Google Scholar] [CrossRef]
- Olsen, S.R. Estimation of Available Phosphorus in Soils by Extraction with Sodium Bicarbonate (No. 939); US Department of Agriculture: Washington, DC, USA, 1954.
- Richards, L.A. Diagnosis and Improvement of Saline and Alkali Soils; US Department of Agriculture: Washington, DC, USA, 1954; p. 154.
- Brookes, P.; Landman, A.; Pruden, G.; Jenkinson, D. Chloroform fumigation and the release of soil nitrogen: A rapid direct extraction method to measure microbial biomass nitrogen in soil. Soil Biol. Biochem. 1985, 17, 837–842. [Google Scholar] [CrossRef]
- Anderson, J.M.; Ingram, J.S.I. Tropical Soil Biology and Fertility. A Handbook of Methods, 2nd ed.; CAB International: Wallingford, UK, 1993. [Google Scholar] [CrossRef]
- Giron, H.C. Comparison between dry ashing and wet digestion in the preparation of plant material for atomic absorption analysis. J. At. Absorpt. Newsl. 1973, 12, 28–29. [Google Scholar]
- Shivay, Y.S.; Prasad, R. Zinc-Coated Urea Improves Productivity and Quality of Basmati Rice (Oryza Sativa L.) under Zinc Stress Condition. J. Plant Nutr. 2012, 35, 928–951. [Google Scholar] [CrossRef]
- The International Maize and Wheat Improvement Center. From Agronomic Data to Farmers Recommendations: An Economics Training Manual; The International Maize and Wheat Improvement Center: El Batan, Mexico, 1998; pp. 31–33. [Google Scholar]
- Byerlee, D. From Agronomic Data to Farmers Recommendations. An Economics Training Manual; CIMMYT: El Batan, Mexico, 1988; pp. 31–33. [Google Scholar]
- Steel, R.G.D.; Torrie, J.H.; Dickey, D.A. Principles and Procedures of Statistics: A Biometrical Approach; No. 519.5 S8; McGraw Hill College: New York, NY, USA, 1997. [Google Scholar]
- Benjamin, J. Tillage effects on near-surface soil hydraulic properties. Soil Tillage Res. 1993, 26, 277–288. [Google Scholar] [CrossRef]
- Shah, A.N.; Tanveer, M.; Shahzad, B.; Yang, G.; Fahad, S.; Ali, S.; Bukhari, M.A.; Tung, S.A.; Hafeez, A.; Souliyanonh, B. Soil compaction effects on soil health and cropproductivity: An overview. Environ. Sci. Pollut. Res. 2017, 24, 10056–10067. [Google Scholar] [CrossRef]
- Farooq, M.; Nawaz, A. Weed dynamics and productivity of wheat in conventional and conservation rice-based cropping systems. Soil Tillage Res. 2014, 141, 1–9. [Google Scholar] [CrossRef]
- Nawaz, A.; Farooq, M.; Lal, R.; Rehman, A.; Hussain, T.; Nadeem, A. Influence of Sesbania Brown Manuring and Rice Residue Mulch on Soil Health, Weeds and System Productivity of Conservation Rice–Wheat Systems. Land Degrad. Dev. 2016, 28, 1078–1090. [Google Scholar] [CrossRef]
- Roldan, A. No-tillage, crop residue additions, and legume cover cropping effects on soil quality characteristics under maize in Patzcuaro watershed (Mexico). Soil Tillage Res. 2003, 72, 65–73. [Google Scholar] [CrossRef]
- Hobbs, P.R. Conservation agriculture: What is it and why is it important for future sustainable food production? J. Agric. Sci. 2007, 145, 127–137. [Google Scholar] [CrossRef] [Green Version]
- Jacobs, A.; Rauber, R.; Ludwig, B. Impact of reduced tillage on carbon and nitrogen storage of two Haplic Luvisols after 40 years. Soil Tillage Res. 2009, 102, 158–164. [Google Scholar] [CrossRef]
- Ordoñez-Morales, K.D.; Cadena-Zapata, M.; Zermeño-González, A.; Campos-Magaña, S. Effect of Tillage Systems on Physical Properties of a Clay Loam Soil under Oats. Agriculture 2019, 9, 62. [Google Scholar] [CrossRef] [Green Version]
- Nandan, R.; Singh, V.; Singh, S.S.; Kumar, V.; Hazra, K.K.; Nath, C.P.; Poonia, S.; Malik, R.K.; Bhattacharyya, R.; McDonald, A. Impact of conservation tillage in rice–based cropping systems on soil aggregation, carbon pools and nutrients. Geoderma 2019, 340, 104–114. [Google Scholar] [CrossRef]
- Six, J.; Elliott, E.T.; Paustian, K. Soil macroaggregate turnover and microaggregate formation: A mechanism for C sequestration under no-till agriculture. Soil Biol. Biochem. 2000, 32, 2099–2103. [Google Scholar] [CrossRef]
- Mandal, K.G.; Mishra, A.K.; Hati, K.M.; Bandyopadhyay, K.K.; Ghosh, P.K.; Mohanty, M. Rice residue management options and effects on soil properties and crop productivity. Food Agric. Environ. 2004, 2, 224–231. [Google Scholar]
- Mohanty, M.; Painuli, D.; Misra, A.; Ghosh, P. Soil quality effects of tillage and residue under rice–wheat cropping on a Vertisol in India. Soil Tillage Res. 2007, 92, 243–250. [Google Scholar] [CrossRef]
- Zikeli, S.; Gruber, S.; Teufel, C.-F.; Hartung, K.; Claupein, W. Effects of Reduced Tillage on Crop Yield, Plant Available Nutrients and Soil Organic Matter in a 12-Year Long-Term Trial under Organic Management. Sustainability 2013, 5, 3876–3894. [Google Scholar] [CrossRef] [Green Version]
- Lupwayi, N.Z.; Hanson, K.; Harker, K.; Clayton, G.; Blackshaw, R.; O’Donovan, J.; Johnson, E.; Gan, Y.; Irvine, R.; Monreal, M. Soil microbial biomass, functional diversity and enzyme activity in glyphosate-resistant wheat–canola rotations under low-disturbance direct seeding and conventional tillage. Soil Biol. Biochem. 2007, 39, 1418–1427. [Google Scholar] [CrossRef]
- Balota, E.L.; Colozzi-Filho, A.; Andrade, D.S.; Dick, R.P. Microbial biomass in soils under different tillage and crop rotation systems. Biol. Fertil. Soils 2003, 38, 15–20. [Google Scholar] [CrossRef]
- Roscoe, R. Tillage effects on soil organic matter in density fractions of a Cerrado Oxisol. Soil Tillage Res. 2003, 70, 107–119. [Google Scholar] [CrossRef]
- Moussadek, R.; Mrabet, R.; Dahan, R.; Zouahri, A.; El Mourid, M.; Van Ranst, E. Tillage System Affects Soil Organic Carbon Storage and Quality in Central Morocco. Appl. Environ. Soil Sci. 2014, 2014, 1–8. [Google Scholar] [CrossRef]
- Das, A.; Lyngdoh, D.; Ghosh, P.K.; Lal, R.; Layek, J.; Idapuganti, R.G. Tillage and cropping sequence effect on physico-chemical and biological properties of soil in Eastern Himalayas, India. Soil Tillage Res. 2018, 180, 182–193. [Google Scholar] [CrossRef]
- Stanislawska-Glubiak, E.; Korzeniowska, J. Effect of soil tillage systems on nutrient concentration in winter wheat plants. J. Food Agric. Environ. 2012, 10, 1353–1355. [Google Scholar]
- Meisinger, J.J.; Palmer, R.E.; Timlin, D.J. Effects of tillage practices on drainage and nitrate leaching from winter wheat in the Northern Atlantic Coastal-Plain USA. Soil Tillage Res. 2015, 151, 18–27. [Google Scholar] [CrossRef]
- Busari, M.A.; Kukal, S.S.; Kaur, A.; Bhatt, R.; Dulazi, A.A. Conservation tillage impacts on soil, crop and the environment. Int. Soil Water Conserv. Res. 2015, 3, 119–129. [Google Scholar] [CrossRef] [Green Version]
- Bhatt, R.; Khera, K.L.; Arora, S. Effect of tillage and mulching on yield of corn in the submontaneous rainfed region of Punjab, India. Int. J. Agric. Biol. 2004, 6, 126–128. [Google Scholar]
- Longnecker, N.E.; Graham, R.D.; McCarthy, K.W.; Sparrow, D.H.B.; Egan, J.P.; Bassam, N. Screening for manganese efficiency in barley (Hordeum vulgare L.). In Genetic Aspects of Plant Mineral Nutrition; Bassam, N.E., Loughman, B.C., Eds.; Springer: Dodrecht, The Netherlands, 1990; pp. 273–280. [Google Scholar] [CrossRef]
- Marschner, P. (Ed.) Marschner’s Mineral Nutrition of Higher Plants; Academic Press: San Diego, CA, USA, 1995; p. 889. [Google Scholar] [CrossRef]
- Lutts, S.; Benincasa, P.; Wojtyla, Ł.; Kubala, S.S.; Pace, R.; Lechowska, K.; Quinet, M.; Garnczarska, M. Seed Priming: New Comprehensive Approaches for an Old Empirical Technique. In New Challenges in Seed Biology—Basic and Translational Research Driving Seed Technology; IntechOpen: London, UK, 2016; pp. 1–46. [Google Scholar] [CrossRef] [Green Version]
- Haider, M.U.; Hussain, M.; Khan, M.B.; Ijaz, M.; Sattar, A.; Akram, M.S.; Hassan, W. Influence of Seed Priming and Seed Size on Wheat Performance under Different Tillage Systems. Int. J. Agric. Biol. 2016, 18, 858–864. [Google Scholar] [CrossRef]
- Goussias, C.; Boussac, A.; Rutherford, A. Photosystem II and photosynthetic oxidation of water: An overview. Philos. Trans. R. Soc. B Biol. Sci. 2002, 357, 1369–1381. [Google Scholar] [CrossRef] [PubMed] [Green Version]
- Suzana, C.S.; Brunetto, A.; Marangon, D.; Tonello, A.A.E.; Kulczynski, S.M. Influence of fertilization leaf on the quality of soybean seed physiological stored. Enciclopedia Biosf. 2012, 8, 2385–2392. [Google Scholar]
- Barros, H.B.; Souza, M.E.; Dario, A.S.; Santos, M.P.D.A.; Nascimento, V.L. Manganese foliar supplementation impacts rice yield in tropical lowlands. J. Plant Nutr. 2019, 42, 1567–1574. [Google Scholar] [CrossRef]
- Longnecker, N.; Marcar, N.; Graham, R. Increased manganese content of barley seeds can increase grain yield in manganese-deficient conditions. Aust. J. Agric. Res. 1991, 42, 1065–1074. [Google Scholar] [CrossRef]
- El-Esawi, M.; Glascoe, A.; Engle, D.; Ritz, T.; Link, J.; Ahmad, M. Cellular metabolites modulate in vivo signaling of Arabidopsis cryptochrome-1. Plant Signal. Behav. 2015, 10, e1063758. [Google Scholar] [CrossRef] [PubMed] [Green Version]
- El-Esawi, M.; Sammour, R. Karyological and phylogenetic studies in the genus Lactuca L. (Asteraceae). Cytologia 2014, 79, 269–275. [Google Scholar] [CrossRef] [Green Version]
- Li, M.; Yang, X.; Tian, X.; Wang, S.; Chen, Y. Effect of Nitrogen Fertilizer and Foliar Zinc Application at Different Growth Stages on Zinc Translocation and Utilization Efficiency in Winter Wheat. Cereal Res. Commun. 2014, 42, 81–90. [Google Scholar] [CrossRef]
- Zulfiqar, U.; Hussain, S.; Ishfaq, M.; Ali, N.; Yasin, M.U.; Ali, M.A. Foliar Manganese Supply Enhances Crop Productivity, Net Benefits, and Grain Manganese Accumulation in Direct-Seeded and Puddled Transplanted Rice. J. Plant Growth Regul. 2020, 2020, 1–18. [Google Scholar] [CrossRef]
- Mousavi, S.R.; Galavi, M.; Ahmadvand, G. Effect of Zinc and Manganese Foliar Application on Yield, Quality and Enrichment on Potato (Solanum tuberosum L.). Asian J. Plant Sci. 2007, 6, 1256–1260. [Google Scholar] [CrossRef] [Green Version]


| Year | 2017–2018 | 2018–2019 | ||
|---|---|---|---|---|
| Tillage System | Conventional Tillage | No Tillage | Conventional Tillage | No Tillage |
| Previous crop stubble management | 14 November | 17 November | ||
| Soaking (Rauni) irrigation | 17 November | 17 November | 21 November | 21 November |
| Land preparation 3 cultivations of field up to depth of 0.3 m + 2 plankings | 21 November | 26 November | ||
| Seeding rate (kg ha−1) | 125 | 125 | 125 | 125 |
| Seed treatment | Hombre 37.25% FS (Imidacloprid and Tebuconazole) 2 mL kg−1 | Hombre 37.25% FS (Imidacloprid and Tebuconazole) 2 mL kg−1 | Hombre 37.25% FS (Imidacloprid and Tebuconazole) 2 mL kg−1 | Hombre 37.25% FS (Imidacloprid and Tebuconazole) 2 mL kg−1 |
| Sowing | Sowing with a manually operated drill (23 November) | Direct seeding in undisturbed post rice soil with a manually operated NT drill (23 November) | Sowing with a manually operated drill (28 November) | Direct seeding in undisturbed post rice soil with a manually operated NT drill (28 November) |
| Fertilizers application N:P:K kg ha−1 | 115:85:65 | 115:85:65 | 115:85:65 | 115:85:65 |
| Weed management | Total 80 WG (sulfosulfuron and iodosulfuron) at 30 DAS | Total 80 WG (sulfosulfuron and iodosulfuron) at 30 DAS | Axial 50 EC (pinoxaden) at 30 DAS | Axial 50 EC (pinoxaden) at 30 DAS |
| Harvesting | 20 April | 20 April | 24 April | 24 April |
| Treatments | 2017–2018 | 2018–2019 | ||
|---|---|---|---|---|
| 0–10 cm | 10–20 cm | 0–10 cm | 10–20 cm | |
| Soil Bulk Density (g cm−3) | ||||
| Conventional tillage | 1.54 A | 1.50 A | 1.56 A | 1.55 A |
| No tillage | 1.49 B | 1.45 B | 1.54 A | 1.49 B |
| HSD (p ≤ 0.05) | 0.02 | 0.01 | NS | 0.03 |
| Total Soil Porosity (%) | ||||
| Conventional tillage | 39.00 A | 38.07 B | 41.67 B | 38.66 B |
| No tillage | 40.51 A | 41.03 A | 45.11 A | 42.41 A |
| HSD (p ≤ 0.05) | NS | 1.28 | 1.43 | 0.79 |
| Soil Microbial Biomass Carbon (μg g−1) | ||||
| Conventional tillage | 155.31 B | 161.52 A | 167.73 | 165.98 B |
| No tillage | 162.10 A | 162.87 A | 173.76 | 171.13 A |
| HSD (p ≤ 0.05) | 1.74 | NS | 1.10 | 1.24 |
| Soil Microbial Biomass Nitrogen (μg g−1) | ||||
| Conventional tillage | 508 B | 486 B | 514 B | 507 B |
| No tillage | 519 A | 498 A | 532 A | 515 A |
| HSD (p ≤ 0.05) | 9.4 | 2.99 | 14.87 | 2.66 |
| Soil Organic Carbon (g kg−1) | ||||
| Conventional tillage | 7.02 B | 6.28 B | 6.98 B | 6.89 B |
| No tillage | 8.36 A | 7.09 A | 8.08 A | 8.08 A |
| HSD (p ≤ 0.05) | 0.063 | 0.08 | 0.072 | 0.25 |
| Treatments | 2017–2018 | 2018–2019 | ||||
|---|---|---|---|---|---|---|
| Conventional Tillage | No Tillage | Mean (Mn) | Conventional Tillage | No Tillage | Mean (Mn) | |
| Productive Tillers (m−2) | ||||||
| No application | 311 g | 320 e | 315.5 E | 300 i | 311 ef | 305.5 E |
| Seed coating | 338 c | 349 b | 343.5 B | 330 c | 332 c | 331.0 B |
| Hydropriming | 318 ef | 325 d | 321.5 C | 305 gh | 313 ef | 309.0 DE |
| Osmopriming | 349 b | 360 a | 354.5 A | 339 b | 344 a | 341.5 A |
| Soil application | 351 b | 340 c | 345.5 B | 322 d | 329 c | 325.5 C |
| Water spray | 319 ef | 317 f | 318.0 DE | 303 hi | 310 ef | 306.5 DE |
| Mn-foliar application | 319 ef | 321 e | 320.0 CD | 309 fg | 314 e | 311.5 D |
| Mean (WTs) | 329 A | 333 A | 315 B | 322 A | ||
| HSD (p ≤ 0.05) | Mn = 3.02 | WTs = 0.61; Mn = 5.14 | ||||
| Number of Grains per Spike | ||||||
| No application | 37 a | 36 a | 36.5 C | 35 a | 36 a | 35.0 D |
| Seed coating | 42 a | 41 a | 41.5 B | 41 a | 41 a | 41.0 C |
| Hydropriming | 37 a | 36 a | 36.5 C | 36 a | 36 a | 36.0 D |
| Osmopriming | 44 a | 46 a | 45.0 A | 44 a | 45 a | 44.5 A |
| Soil application | 41 a | 42 a | 41.5 B | 40 a | 41 a | 40.5 C |
| Water spray | 38 a | 37 a | 37.5 C | 36 a | 35 a | 35.5 D |
| Mn-foliar application | 45 a | 45 a | 45.5 A | 43 a | 43 a | 43.0 B |
| Mean (WTs) | 40.7 A | 40.4 A | 39.3 A | 39.6 A | ||
| HSD (p ≤ 0.05) | Mn = 1.13 | Mn = 0.71 | ||||
| 1000-Grain Weight (g) | ||||||
| No application | 38.84 a | 39.69 a | 39.26 D | 34.56 f | 35.27 ef | 34.91 E |
| Seed coating | 43.95 a | 43.95 a | 43.95 B | 42.16 d | 43.95 c | 43.05 B |
| Hydropriming | 39.65 a | 38.71 a | 39.18 D | 35.89 e | 36.51 e | 36.20 D |
| Osmopriming | 45.70 a | 45.41 a | 45.55 A | 46.21 a | 46.23 a | 46.22 A |
| Soil application | 42.16 a | 42.16 a | 42.16 C | 41.16 d | 42.36 d | 41.76 C |
| Water spray | 38.15 a | 39.65 a | 38.90 D | 34.15 f | 36.45 e | 35.30 DE |
| Mn-foliar application | 46.22 a | 47.00 a | 46.61 A | 44.67 bc | 45.97 ab | 45.32 A |
| Mean (WTs) | 42.10 A | 42.40 A | 39.83 B | 40.96 A | ||
| HSD (p ≤ 0.05) | Mn = 1.31 | WTs = 1.03; Mn = 0.94 | ||||
| Biological Yield (t ha−1) | ||||||
| No application | 7.18 gh | 7.03 h | 7.10 F | 7.31 h | 7.42 gh | 7.36 E |
| Seed coating | 7.92 ef | 7.78 f | 7.85 D | 8.04 e | 8.11 de | 8.07 C |
| Hydropriming | 7.39 g | 7.21 gh | 7.30 E | 7.45 fg | 7.59 f | 7.52 D |
| Osmopriming | 8.37 bc | 8.18 cd | 8.28 B | 8.28 cd | 8.44 c | 8.36 B |
| Soil application | 8.60 a | 8.40 ab | 8.50 A | 8.62 b | 8.85 a | 8.74 A |
| Water spray | 7.26 gh | 7.11 h | 7.19 EF | 7.35 gh | 7.51 fg | 7.43 DE |
| Mn-foliar application | 8.11 de | 7.96 def | 8.04 C | 7.98 e | 7.98 e | 7.98 C |
| Mean (WTs) | 7.83 | 7.67 | 7.87 A | 8.02 A | ||
| HSD (p ≤ 0.05) | Mn = 0.15; WTs × Mn = 0.22 | Mn = 0.09; WTs × Mn = 0.13 | ||||
| Grain Yield (t ha−1) | ||||||
| No application | 3.09 h | 3.14 h | 3.11 E | 3.33 ef | 3.34 ef | 3.34 E |
| Seed coating | 3.67 e | 3.71 e | 3.69 C | 3.76 d | 3.73 d | 3.74 D |
| Hydropriming | 3.21 g | 3.25 fg | 3.23 D | 3.32 ef | 3.34 ef | 3.33 E |
| Osmopriming | 4.01 c | 4.21 a | 4.11 A | 4.18 a | 4.19 a | 4.18 A |
| Soil application | 3.85 d | 3.89 d | 3.87 B | 3.94 c | 3.93 c | 3.93 C |
| Water spray | 3.28 f | 3.21 g | 3.24 D | 3.34 ef | 3.29 f | 3.32 E |
| Mn-foliar application | 4.11 b | 4.02 c | 4.06 A | 4.06 b | 4.04 b | 4.05 B |
| Mean (WTs) | 3.60 | 3.63 | 3.71 | 3.70 | ||
| HSD (p ≤ 0.05) | Mn = 0.046; WTs × Mn = 0.065 | Mn = 0.038; WTs × Mn = 0.051 | ||||
| Harvest Index (%) | ||||||
| No application | 43.04 a | 44.66 a | 43.85 F | 45.65 cde | 45.29 cde | 45.47 C |
| Seed coating | 46.34 a | 47.7 a | 47.02 C | 46.77 b | 46.00 bc | 46.38 BC |
| Hydropriming | 43.44 a | 45.09 a | 44.26 EF | 44.66 def | 44.00 f | 44.33 D |
| Osmopriming | 49.44 a | 52.84 a | 51.14 A | 50.64 a | 49.57 a | 50.10 A |
| Soil application | 44.77 a | 46.31 a | 45.54 D | 45.71 bcd | 44.41 ef | 45.06 CD |
| Water spray | 45.18 a | 45.10 a | 45.14 DE | 45.44 cde | 43.81 f | 44.63 D |
| Mn-foliar application | 49.11 a | 49.15 a | 49.13 B | 50.84 a | 50.17 a | 50.78 A |
| Mean (WTs) | 45.90 A | 47.30 A | 47.13 A | 46.15 A | ||
| HSD (p ≤ 0.05) | Mn = 0.95 | Mn = 1.52 | ||||
| Treatments | 2017–2018 | 2018–2019 | 2017–2018 | 2018–2019 | ||||||||
|---|---|---|---|---|---|---|---|---|---|---|---|---|
| CT | NT | Mean (Mn) | CT | NT | Mean (Mn) | CT | NT | Mean (Mn) | CT | NT | Mean (Mn) | |
| Agronomic Efficiency (kg kg−1) | Physiological Efficiency (kg kg−1) | |||||||||||
| No application | - | - | - | - | - | - | - | - | - | - | - | - |
| Seed coating | 18,560 a | 18,240 a | 18,400 A | 13,547 a | 11,840 a | 12,693 A | 42.43 c | 43.86 c | 43.15 B | 49.88 a | 51.97 a | 50.93 BC |
| Osmopriming | 2040 b | 1760 b | 1900 B | 1513 b | 1420 b | 1467 B | 53.94 bc | 52.66 c | 53.30 B | 63.08 a | 66.20 a | 64.64 B |
| Soil application | 760 b | 750 b | 755 B | 603 b | 570 b | 587 C | 122.40 a | 111.96 ab | 117.18 A | 143.9 a | 145.4 a | 144.7 A |
| Mn-foliar application | 736 b | 856 b | 796 B | 685 b | 659 b | 672 BC | 45.37 c | 46.81 c | 46.09 B | 30.58 a | 43.64 a | 37.11 C |
| Mean (WTs) | 5524 A | 5402 A | 4087 A | 3622 A | 66.0 A | 63.8 A | 71.8 A | 76.8 A | ||||
| HSD (p ≤ 0.05) | Mn = 1530 | Mn = 874 | Mn = 18.5 | Mn = 20.9 | ||||||||
| Agro-Physiological Efficiency (kg kg−1) | Apparent Recovery Efficiency (%) | |||||||||||
| No application | - | - | - | - | - | - | - | - | - | - | - | - |
| Seed coating | 33.38 a | 33.77 a | 33.57 C | 28.98 de | 27.01 e | 28.00 C | 145.63 a | 69.6 b | 107.6 A | 118.75 a | 54.72 a | 86.73 A |
| Osmopriming | 45.84 a | 39.54 a | 42.69 B | 41.23 c | 38.55 cd | 39.89 B | 3.83 c | 3.46 c | 3.64 B | 3.09 a | 2.84 a | 2.96 BC |
| Soil application | 67.47 a | 61.17 a | 64.32 A | 65.32 a | 57.74 ab | 61.53 A | 1.23 c | 1.23 c | 1.23 B | 0.94 a | 0.99 a | 0.96 C |
| Mn-foliar application | 45.06 a | 53.20 a | 49.13 B | 48.30 bc | 63.84 a | 56.07 A | 14.19 c | 13.41 c | 13.80 B | 11.84 a | 8.80 a | 10.32 B |
| Mean (WTs) | 47.94 A | 46.92 A | 45.96 | 46.78 | 41.22 A | 21.92 A | 33.65 A | 16.83 A | ||||
| HSD (p ≤ 0.05) | Mn = 8.90 | Mn = 8.13; WTs × Mn = 11.50 | Mn = 21.63 | Mn = 8.04 | ||||||||
| Utilization Efficiency (kg kg−1) | Manganese Harvest Index (%) | |||||||||||
| No application | - | - | - | - | - | - | 44.57 cde | 44.21 de | 44.39 C | 49.98 cd | 49.87 c | 49.43 C |
| Seed coating | 5920 a | 3000 b | 4460 A | 5840 a | 2760 b | 4300 A | 44.95 b–e | 46.72 b | 45.83 BC | 50.18 bcd | 51.28 b | 50.73 B |
| Osmopriming | 198.3 c | 177 c | 187.6 C | 195 c | 187.7 c | 191.3 B | 43.44 e | 46.69 b | 45.07 BC | 51.02 bc | 50.77 bc | 50.89 B |
| Soil application | 142 c | 137 c | 139.5 C | 131 c | 143 c | 137 B | 45.73 bcd | 46.41 bc | 46.07 B | 50.50 bc | 50.94 bc | 50.72 B |
| Mn-foliar application | 620 c | 624.4 c | 622.2 B | 360 c | 373.3 c | 366.7 B | 49.10 a | 50.49 a | 49.80 A | 53.88 a | 54.98 a | 54.43 A |
| Mean (WTs) | 1720 A | 984.6 B | 1632 A | 866 B | 45.56 A | 46.90 A | 50.91 A | 51.57 A | ||||
| HSD (p ≤ 0.05) | Mn = 382.66 | Mn = 408.1 | Mn = 1.55 | Mn = 0.91 | ||||||||
| Treatments | Grain Yield (t ha−1) | Straw Yield (t ha−1) | Adjusted Grain Yield (t ha−1) | Adjusted Straw Yield (t ha−1) | Gross Income ($ ha−1) | Total Fixed Cost ($ ha−1) | Total Variable Cost ($ ha−1) | Total Cost ($ ha−1) | Net Benefits ($ ha−1) | Benefit Cost Ratio | |
|---|---|---|---|---|---|---|---|---|---|---|---|
| CT | No application | 3.21 | 4.03 | 2.89 | 3.63 | 904 | 519.86 | 56.25 | 576.11 | 279.96 | 1.57 |
| Mn-coating | 3.72 | 4.27 | 3.34 | 3.84 | 1029 | 519.86 | 60.86 | 580.72 | 399.83 | 1.77 | |
| Hydropriming | 3.27 | 4.15 | 2.94 | 3.74 | 922 | 519.86 | 57.81 | 577.68 | 296.03 | 1.60 | |
| Osmopriming | 4.10 | 4.17 | 3.69 | 3.76 | 1113 | 519.86 | 62.50 | 582.36 | 482.69 | 1.91 | |
| Soil application | 3.90 | 4.72 | 3.51 | 4.24 | 1089 | 519.86 | 68.75 | 588.61 | 452.06 | 1.85 | |
| Water spray | 3.31 | 4.00 | 2.98 | 3.60 | 925 | 519.86 | 57.81 | 577.68 | 298.94 | 1.60 | |
| Mn-foliar application | 4.09 | 4.01 | 3.68 | 3.61 | 1103 | 519.86 | 70.31 | 590.18 | 464.27 | 1.87 | |
| NT | No application | 3.25 | 3.98 | 2.93 | 3.58 | 910 | 482.04 | 56.25 | 538.29 | 327.32 | 1.69 |
| Mn-coating | 3.72 | 4.23 | 3.35 | 3.80 | 1028 | 482.04 | 60.86 | 542.89 | 440.66 | 1.89 | |
| Hydropriming | 3.30 | 4.11 | 2.97 | 3.69 | 926 | 482.04 | 57.81 | 539.85 | 341.52 | 1.72 | |
| Osmopriming | 4.20 | 4.21 | 3.78 | 3.79 | 1137 | 482.04 | 62.50 | 544.54 | 547.24 | 2.09 | |
| Soil application | 3.91 | 4.72 | 3.52 | 4.24 | 1092 | 482.04 | 68.75 | 550.79 | 496.86 | 1.98 | |
| Water spray | 3.25 | 4.06 | 2.93 | 3.66 | 914 | 482.04 | 57.81 | 539.85 | 329.41 | 1.69 | |
| Mn-foliar application | 4.03 | 3.85 | 3.63 | 3.46 | 1084 | 482.04 | 70.31 | 552.35 | 486.77 | 1.96 | |
| Treatments | Total Variable Cost ($ ha−1) | Net Benefits ($ ha−1) | Marginal Cost ($) | Marginal Net Benefits ($) | Marginal Rate of Return (%) | |
|---|---|---|---|---|---|---|
| CT | No application | 56.25 | 279.96 | |||
| Mn-coating | 60.86 | 399.83 | 4.61 | 119.87 | 2600.64 | |
| Hydropriming | 57.81 | 296.03 | 1.56 | 16.07 | 1028.38 | |
| Osmopriming | 62.50 | 482.69 | 6.25 | 202.72 | 3243.59 | |
| Soil application | 68.75 | 452.06 | 12.50 | 172.10 | 1376.80 | |
| Water spray | 57.81 | 298.94 | 1.56 | 18.98 | 1214.75 | |
| Mn-foliar application | 70.31 | 464.27 | 14.06 | 184.31 | 1310.66 | |
| NT | No application | 56.25 | 327.32 | |||
| Mn-coating | 60.86 | 440.66 | 4.61 | 113.34 | 2458.90 | |
| Hydropriming | 57.81 | 341.52 | 1.56 | 14.21 | 909.12 | |
| Osmopriming | 62.50 | 547.24 | 6.25 | 219.92 | 3518.75 | |
| Soil application | 68.75 | 496.86 | 12.50 | 169.54 | 1356.31 | |
| Water spray | 57.81 | 329.41 | 1.56 | 2.09 | 134.00 | |
| Mn-foliar application | 70.31 | 486.77 | 14.06 | 159.46 | 1133.92 | |
Publisher’s Note: MDPI stays neutral with regard to jurisdictional claims in published maps and institutional affiliations. |
© 2021 by the authors. Licensee MDPI, Basel, Switzerland. This article is an open access article distributed under the terms and conditions of the Creative Commons Attribution (CC BY) license (http://creativecommons.org/licenses/by/4.0/).
Share and Cite
Zulfiqar, U.; Hussain, S.; Ishfaq, M.; Ali, N.; Ahmad, M.; Ihsan, F.; Sheteiwy, M.S.; Rauf, A.; Hano, C.; El-Esawi, M.A. Manganese Supply Improves Bread Wheat Productivity, Economic Returns and Grain Biofortification under Conventional and No Tillage Systems. Agriculture 2021, 11, 142. https://0-doi-org.brum.beds.ac.uk/10.3390/agriculture11020142
Zulfiqar U, Hussain S, Ishfaq M, Ali N, Ahmad M, Ihsan F, Sheteiwy MS, Rauf A, Hano C, El-Esawi MA. Manganese Supply Improves Bread Wheat Productivity, Economic Returns and Grain Biofortification under Conventional and No Tillage Systems. Agriculture. 2021; 11(2):142. https://0-doi-org.brum.beds.ac.uk/10.3390/agriculture11020142
Chicago/Turabian StyleZulfiqar, Usman, Saddam Hussain, Muhammad Ishfaq, Nauman Ali, Muhammad Ahmad, Fahid Ihsan, Mohamed S. Sheteiwy, Abdur Rauf, Christophe Hano, and Mohamed A. El-Esawi. 2021. "Manganese Supply Improves Bread Wheat Productivity, Economic Returns and Grain Biofortification under Conventional and No Tillage Systems" Agriculture 11, no. 2: 142. https://0-doi-org.brum.beds.ac.uk/10.3390/agriculture11020142