
Efficacy of Heavy Use Area Protection (HUAP) Pads in Poultry Farm


1
Department of Agriculture and Natural Resources, Delaware State University, Dover, DE 19901, USA
2
Biology Department, University of Wisconsin River Falls, River Falls, WI 54022, USA
*
Author to whom correspondence should be addressed.
Agriculture 2021, 11(2), 154; https://0-doi-org.brum.beds.ac.uk/10.3390/agriculture11020154
Submission received: 16 January 2021
/
Accepted: 4 February 2021
/
Published: 13 February 2021
(This article belongs to the Special Issue Resource Conserving Agricultural Practices for Ecological Sustainability)
Abstract
:This research focuses on the efficiency of recommended heavy use area protection (HUAP) pads installed in poultry houses utilizing the Choptank River, a tributary of the Chesapeake Bay. The Chesapeake Bay watershed is severely affected by crop agriculture and poultry feeding operations. Water quality degradation along with scarcity of water is a significant concern in this area, suggesting a need for changes in both environmental and groundwater management practices. Our objective in this study was to compare the efficiency of HUAP in reducing litter spillage and nutrient runoff between two poultry houses, one of which was constructed in 2005 and the other in 2009. The poultry house constructed in 2005 did not have HUAP pads initially; they were built in 2006. The poultry house built in 2009 had the pads from the starting point. We collected soil and water samples each month and analyzed them for pH, electrical conductivity (EC), nitrate, nitrite, total nitrogen, phosphate, and other soil properties throughout the year. The pH of soil and water samples was in the range of 6.8–8.0 and 6.5–7.2, respectively. We collected six water samples in total in the ditch, from points at retention ponds near the farm ditch to sites in wooded areas on the farm. Water sample B (where ditch water meets retention pond water from the poultry farm) had the highest EC value and nitrate, nitrite, and total nitrogen concentrations compared with other water samples. The subsequent water samples downstream had reduced loads of nutrients. The study results suggest that there was a minimum carryover of nutrients from soil into the runoff water, storm ditches, and adjacent stream. There was also a minimal effect of house cleaning and storm events in raising the concentration of nutrients in soil and water samples at our study sites. The older poultry site had higher total nitrogen and phosphorous surrounding the pads, whereas no elevated levels of nutrients were identified at the newer site. The ability of HUAP pads to hold onto contaminates decreases with age and use. This study also shows that the impacts from poultry activities on surface and groundwater can be minimized by using management practices such as HUAP pads. These practices can reduce pollution in the farm, increase productivity, and save farmers and ranchers time and money in the long run.

1. Introduction
One of the major challenges in modern day agricultural systems is soil and water quality protection [1,2,3]. As the largest estuary in the United States, the Chesapeake Bay has a drainage basin of over 166,534 km2 [4]. The bay receives 51 billion liters of freshwater per day from more than 150 streams and rivers draining from six states (DE, MD, NY, PA, VA, and WV) and the District of Columbia [5,6]. Having a length of 322 km, a width range of 5.5–56 km, and an average depth of 7 m, the bay holds more than 18 trillion liters of water in total [5]. The ecosystem provides a habitat for more than 2700 species of plants and animals and supports the production of 227 million kg of seafood each year [7]. However, it has been reported that the water quality and overall health of the bay ecosystem have been decreasing due to the synergic effect of several factors [8]. Agricultural development, residential development, and effluent discharge from sewage treatment plants are a few point and nonpoint sources to name [9]. As a result, the bay has experienced eutrophication and the associated disturbances such as hypoxia, anoxia, fish kills, increased turbidity, loss of submerged aquatic vegetation, and changes in food web structure [10]. Nutrient and sediment pollution originating from agricultural land, especially in Delmarva’s tributaries, are two major concerns to the agricultural industry [7]. Together with the ever-pressing matter of water scarcity, it highlights the significance of groundwater management [11].
Coastal habitats across the Delmarva Peninsula have been degraded owing to changing land use patterns, intensive farming practices, and rural residential development [12]. It is estimated that 51% of the Delaware watershed is used for agriculture [13] and about 1700 farms are producing 11 million chickens per week for four chicken companies in the Delmarva Peninsula [14]. The excessive loads of nitrogen and phosphorous from the agricultural and poultry runoff, therefore, enrich surface waters [15]. According to the United States Environmental Protection Agency [16], the total maximum daily load (TMDL) for the Chesapeake Bay watershed is set at 84,323 metric tons of nitrogen, 5670 metric tons of phosphorus, and 2,925,670 metric tons of sediment per year. Therefore, a 25 percent reduction in nitrogen, 24 percent reduction in phosphorus, and 20 percent reduction in sediment is suggested [16]. To achieve this, Delmarva has made some progress in reducing runoff and increasing the water quality of Chesapeake Bay by utilizing physical and chemical treatment methods such as heavy use area protection (HUAP) pads, implementing a confined animal feeding operation (CAFO) management plan, a stormwater prevention plan (SWPP), and using best management practices (BMPs) [17]. However, the poultry industry still faces challenges when reducing the nutrient runoff [18].
Used litter and manure are generally spread on croplands or open fields in poultry operations [19,20]. When excess manure is applied, nutrients can wind up in surface waters [21,22]. The poultry manure can also be transported to neighboring states as fertilizer [23]. In addition to nutrients like nitrogen and phosphorus, the poultry litter contains trace elements like arsenic, copper, and zinc which are often added to poultry feed to increase weight, improve feed efficiency and egg production, and prevent diseases [24,25,26]. Thus, waste leaching and subsequent water quality decline continue to be important issues raised as environmental concerns in Delmarva [27].
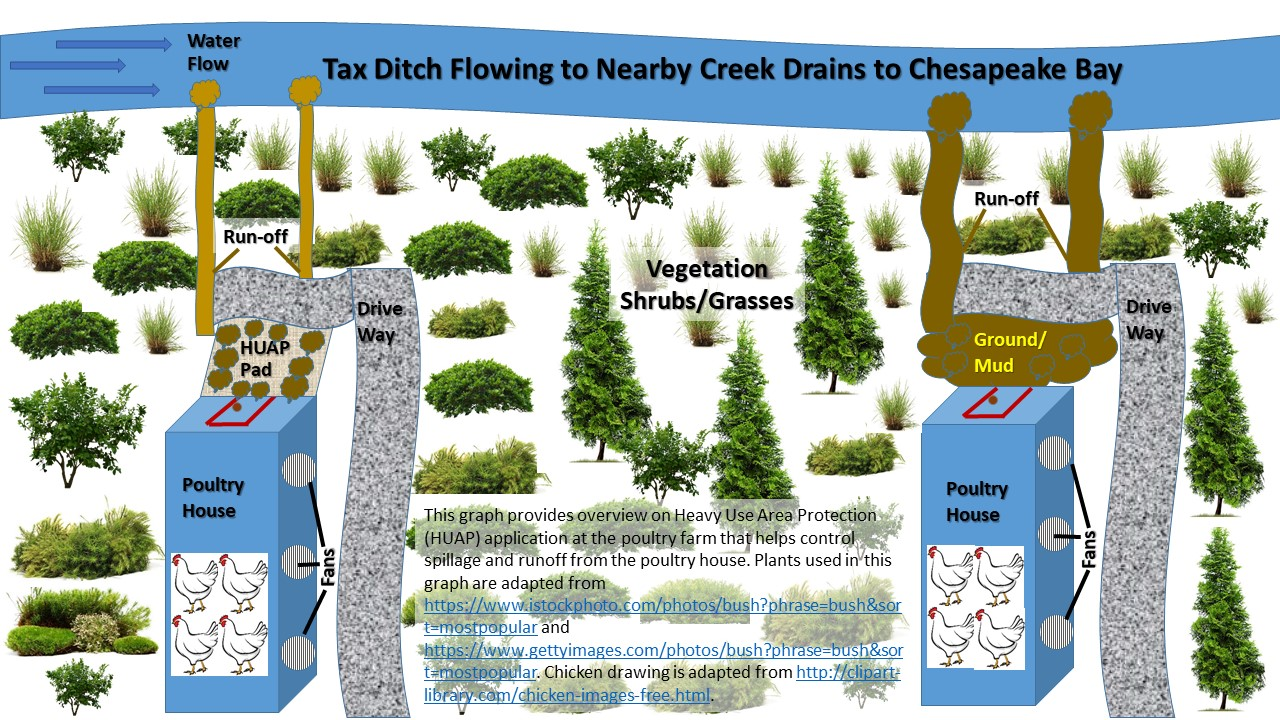
BMPs can reduce or eliminate the potential of poultry litter nutrient runoff, prevent soil erosion, and safeguard the quality of water bodies. Federal and state agencies (within their jurisdictions), such as the Natural Resources Conservation Services (NRCS) and the Delaware Department of Natural Resources and Environmental Control (DNREC) in Delaware, now require BMPs such as cover crops, installation of HUAP, poultry carcass composters, and manure storage sheds to decrease agricultural runoff to draining nearby water bodies, some of which ultimately release to the Chesapeake Bay [28]. These concrete HUAP pads are installed at the entrances of poultry houses, provide a stable surface for farm equipment, and prevent ground and surface water contamination from leached nutrients. Not only do HUAP pads provide safe and stable access to frequently used areas, keeping the farm clean and animals healthier, but the HUAP pads also protect surface water from nutrient runoff during poultry house cleanouts by capturing spilled litter and manure [29]. Therefore, the use of HUAP pads in areas with extensive poultry farming practices would help to minimize the loads of nutrients and sediments entering the Chesapeake Bay area. It is our hope that coordinated pollutant load management strategies with HUAP pads will help improve the environmental health of the Chesapeake Bay area.
This project aims to evaluate the efficacy of HUAP pads in mitigating nitrogen and phosphorus loadings onto the watershed by monitoring soil and runoff nutrient composition at poultry houses equipped with HUAP pads and situated in a private poultry farm in Kent County, Delaware.
2. Materials and Methods
2.1. Study Site
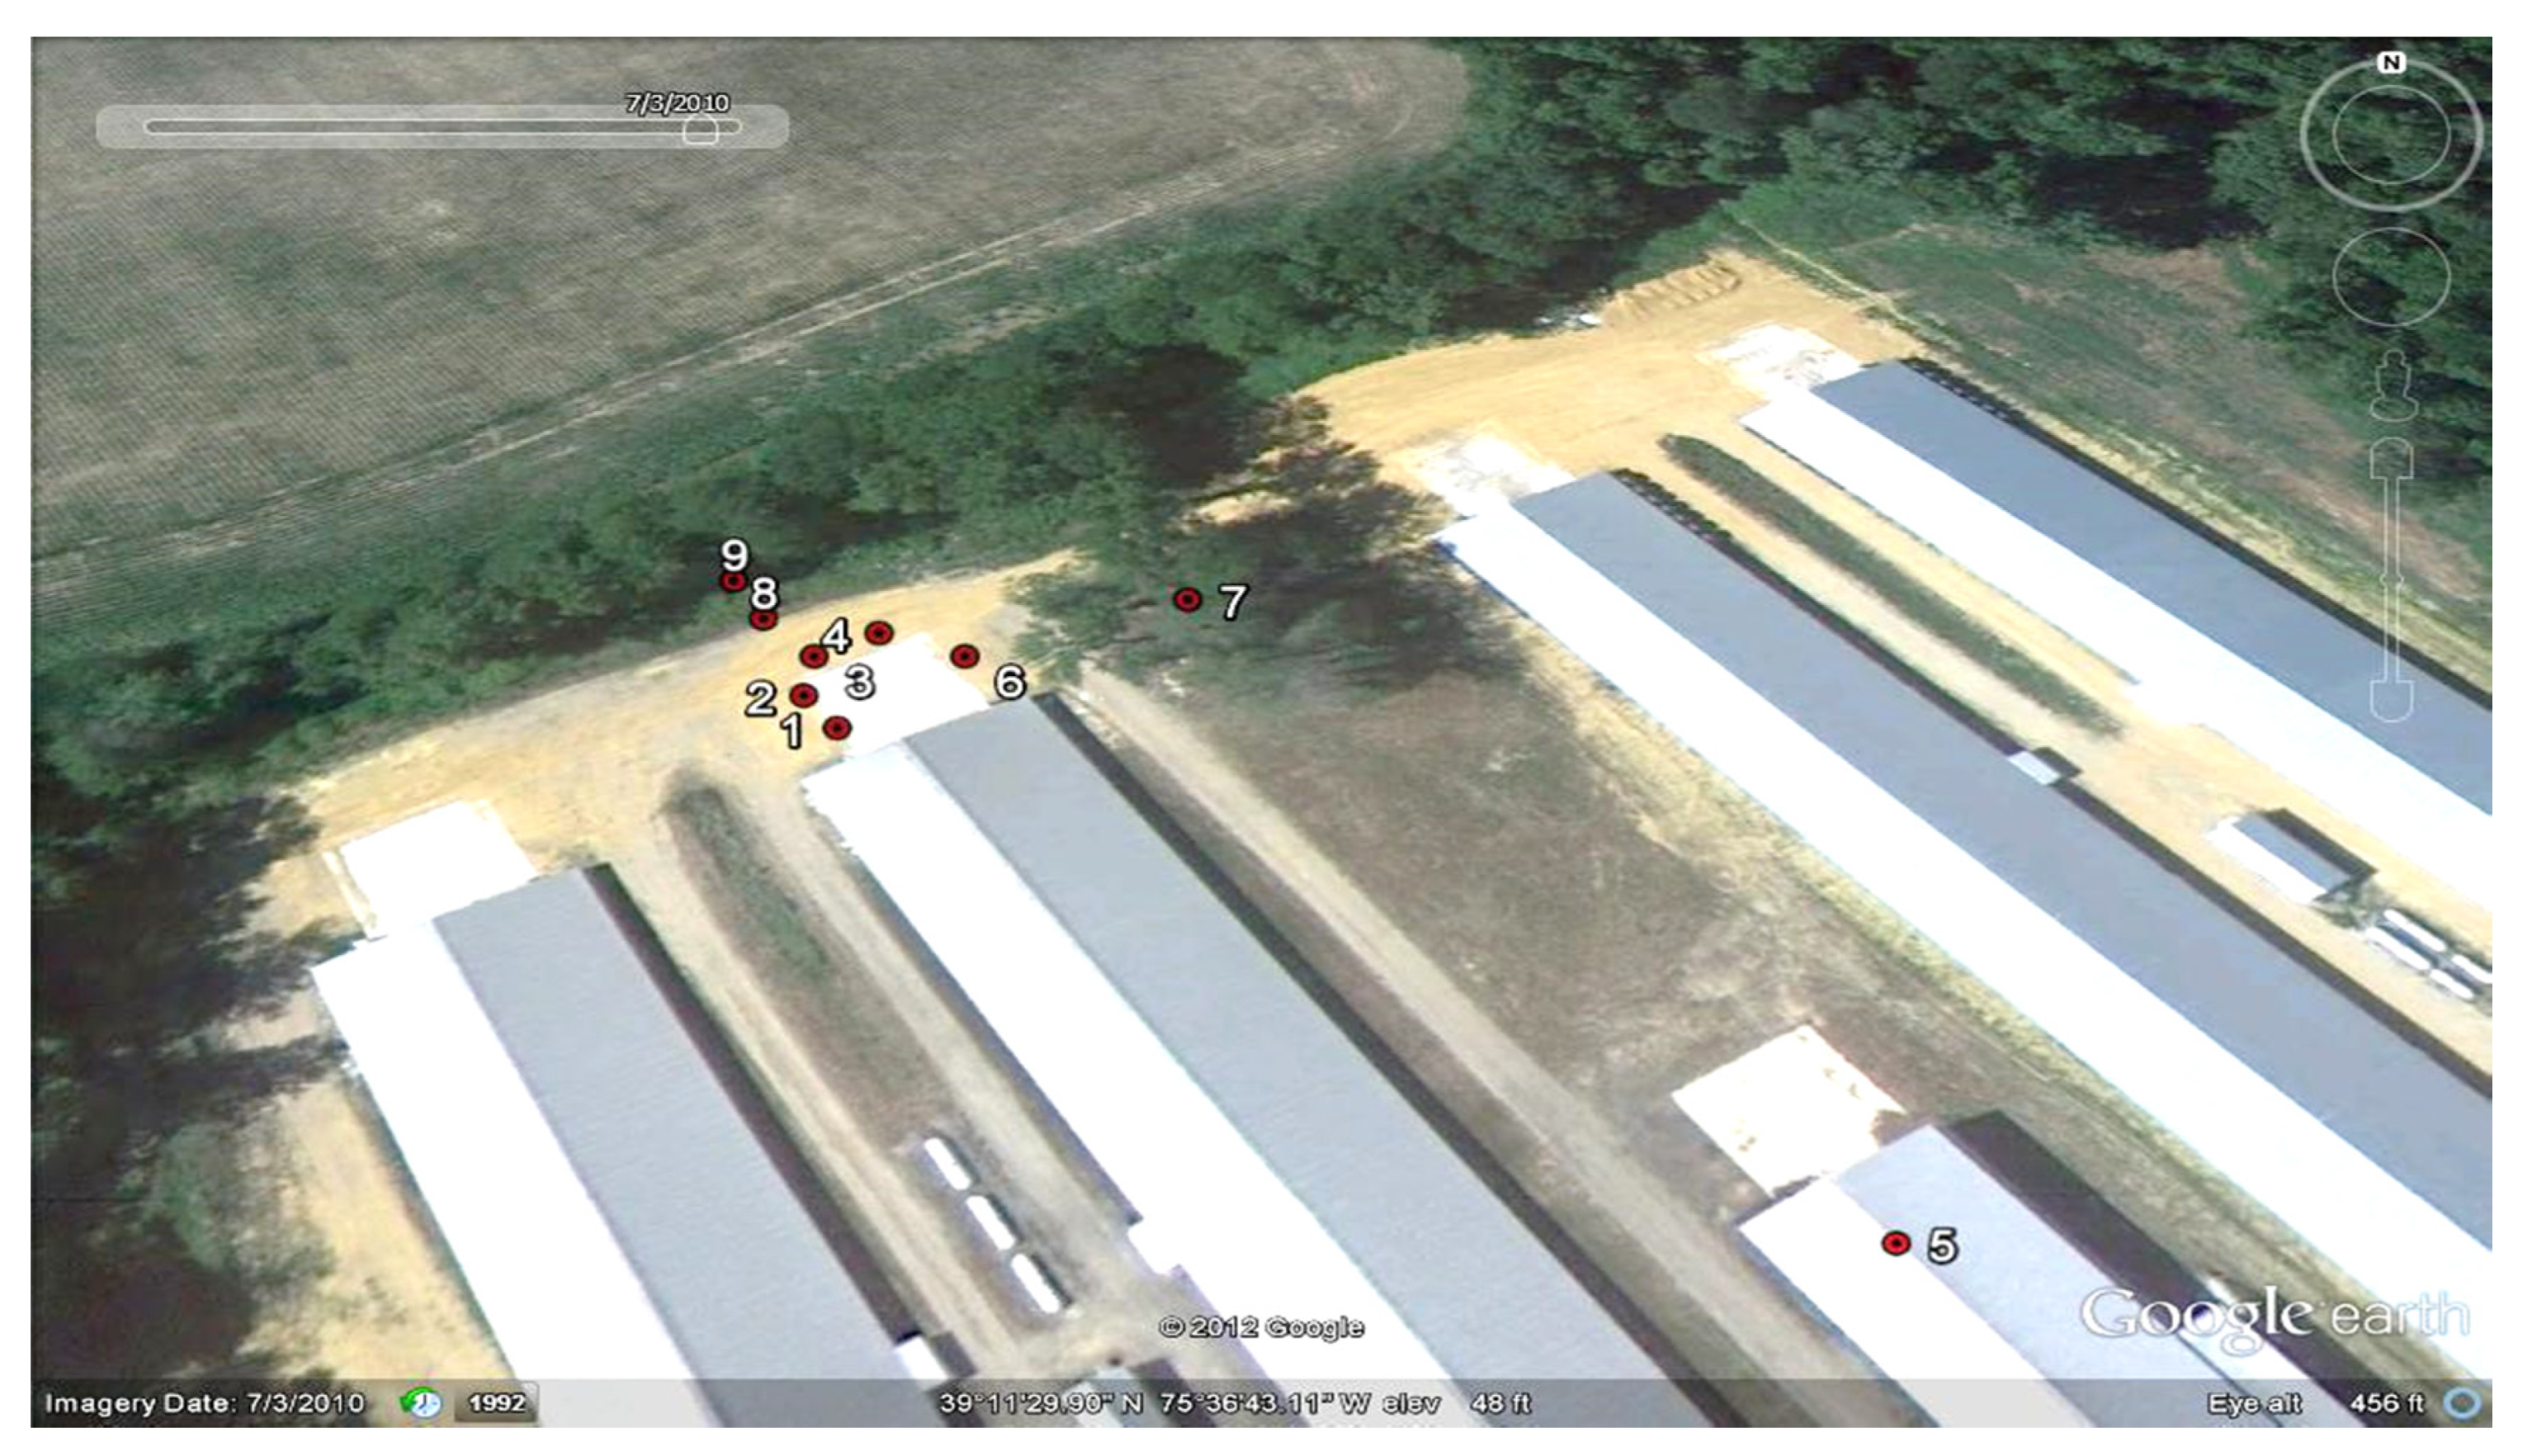
A poultry farm located in Kent County, Delaware was selected for the study; aerial photographs of this poultry farm with two poultry houses labeled as Sites I and II are shown in Figure 1, Figure 2, Figure 3 and Figure 4. All poultry houses in the participating farm were equipped with HUAP pads. The first poultry house labeled Site I has a pond and a ditch adjacent to it and was constructed in 2009, while the other poultry house labeled Site II had been operating since 2005; the HUAP pads were constructed in 2006 on Site II. The research team was not involved in the construction of the HUAP pads on the farm. The farmer did not take pictures nor videos during the construction phase. However, based on the information the farmer shared, he used the technique adopted from USDA NRCS. The following video link is a good source for the HUAP pad layout, construction, and layers: https://vimeo.com/14315831.
2.2. Sampling
The soil and water samples were collected from various locations within the two study sites on the farm in order to analyze and compare the distribution of physiochemical parameters and nutrient profile in the soil and farm runoff. Samples at Site I were collected from December 2011 through November 2012, whereas samples from Site II were evaluated during June 2012 to December 2012. Some samples were collected after Hurricane Sandy (November 2012) and after the poultry house clean-up (approximately seven- to nine-week cycles for broilers to grow about 2 kg [30], in order to further check the efficiency of HUAP pads after this type of intensive event. Site II was added during the middle of the study; this site was relatively old and selected to compare the measurements with Site I. While both soil and water samples were collected from Site I, only soil samples were collected from Site II because this site was located far from the storm ditch. The sampling locations for both study sites are shown in Figure 2, Figure 3 and Figure 4, respectively. Soil samples surrounding the HUAP pads were collected in order to monitor the potential nutrients leached in the soils adjacent to the pads. A spade was used to collect these soil samples. Soil was collected from a depth of 10 cm depending upon the underlying gravel layer. The use of a soil core sampler was restricted to the first 10 cm soil layer in most locations due to a >50 cm gravel layer below. We collected 10 spades-full from each sample site, combined them in a plastic bag, and stored three replicates in zip-lock bags. In order to check the horizontal movement of nutrients and the role of buffer grass strips, some samples were taken before and after the buffer grass strips, while others were taken near the water source and after the grass strips to check the nutrient concentrations before the storm ditch. The poultry manure, which served as a positive control for our analyses, was also sampled from the storage area to estimate the maximum nutrient load on the farm. The water sampling points were chosen to reflect the overall quality of water entering and leaving the farm. The first water sampling point was retention pond water prior to the ditch where there is no mixing of the poultry house runoff with the pond water. The second sampling point was the runoff from the farm pond and ditch adjacent to the farm. Another sampling point was the water leaving the poultry house, which may contain the runoff nutrients. Several intermediate sampling points were chosen to monitor water quality at specific intervals, and a final point was located in the forested part of the land situated away from the poultry houses. Three water subsamples were collected across the ditch in each sampling site.
In the farm, poultry litter was managed in-house and there was outdoor in-field roofed manure storage to reduce pathogens and ammonia. The litters were cleanout and transported according to Delaware Nutrient Management Law (https://agriculture.delaware.gov/nutrient-management/). The litter goes through degradation to decrease litter mass and concentrate nutrients such as phosphorus and potassium and increase the proportion of fulvic and humic acids. This method has a relatively complete removal and reduces the nutrient loss. Those litters were hauled using standard tractors to move the litter to nearby agricultural fields (https://lpelc.org/alternative-poultry-litter-storage-for-improved-transportation-and-use-as-a-soil-amendment/). Cleanout/crust-out was usually done once a year, and the litters were stored in a conical shape in order to minimize the nutrient loss and reduce the nutrient leach; however, chicken movement occurs five to six times each year, so the HUAP pads capture bird catching and spilled litter.
2.3. Soil and Water Samples
A total of nine composite soil samples were collected at Site I (Figure 2). The nine samples are identified by their location relative to the second poultry house and are listed in Table 1. Also, seven soil samples were collected from Site II (Figure 4). Samples were taken from all side edges within 300 cm of the HUAP pads and named based on the relative location to the front, main door, and they are listed in Table 1. Likewise, a total of six water samples were collected in the ditch from Site Ι (Figure 3). The stations are identified by their location from the ditch (Table 1).
2.4. Analysis of Soil Samples
The soil samples were collected in zip-lock bags (3.79 L; Ziploc bags, S. C. Johnson & Son Inc., Racine, WI, USA) and were transferred in a cooler (Polar Pac, Mid-Lands Chemical Company Inc., Miami, FL, USA) to the laboratory within one hour of collection for measuring physicochemical parameters according to the procedures used by the University of Delaware Soil Testing Program (http://ag.udel.edu/dstp/analytical_information.html). Soil pH was analyzed using samples with a soil to water ratio of 1:1 [31], which is the standard measurement of soil pH in North America according to the North America Proficiency Testing (NAPT) program [32]. The pH value was read using a Fisher Scientific Accumet pH meter (Thermo Fisher Scientific Inc, Waltham, MA, USA) and a VWR Symphony electrode (VWR Scientific Inc., Radnor, PA, USA). Organic matter also was measured by loss on ignition at a temperature of 360 °C [33], using a Blue-M High Temperature Furnace (SPX-TPS-Blue-M division, White Deer, PA, USA). For the nutrient profile, we measured nitrogen, phosphorous, nitrate nitrogen, ammonia nitrogen, cation exchange capacity (CEC), total nitrogen, and total carbon concentrations. Nutrient analysis was performed by extracting the nutrients, using the Mehlich 3 soil extraction (1:10) method [34]. The Mehlich 3 soil extracts were further analyzed by a Thermo Electron Iris Intrepid II Duo View XSP Inductively Couple Plasma Spectrometer (Thermo Electron, Madison, WI, USA). CEC and percent base saturation were estimated from the Mehlich 3 soil test results [35], and acidity was predicted by the buffer pH [36]. Nitrate-N and ammonia-N were extracted from the soil using 2M potassium chloride at a 1:10 (w/v) ratio [37] and analyzed colorimetrically using a Bran and Luebbe Auto Analyzer II Flow Injection System (Bran and Luebbe, Inc, Buffalo Grove, IL, USA).
2.5. Analysis of Water Samples
Water samples were collected in 500 mL amber plastic bottles (USPlastic, United States Plastic Corporation., Lima, OH, USA) and were transferred in a cooler (Polar Pac, Mid-Lands Chemical Company Inc., Miami, FL, USA), at 4 °C, to the Water Quality and Analytical Laboratory for further measurements according to the procedures used by the University of Delaware. The value of pH was measured using a Fisher Scientific Accumet pH meter (Fisher Scientific Inc, Massachusetts) and a VWR Symphony electrode (VWR Scientific Inc., Pennsylvania). Electrical conductivity (EC) was measured using a VWR Conductivity Meter 1052 with dip probe (VWR Scientific Inc., Pennsylvania). The water samples were tested for different elemental analytes, which were measured using a Thermo Electron Iris Intrepid II Duo View XSP Inductively Couple Plasma Spectrometer (Thermo Electron, Madison Wisconsin). Ortho-phosphate-P, nitrate-N, and ammonium-N were measured colorimetrically [35] using a Bran and Luebbe Auto Analyzer II Flow Injection System (Bran & Luebbe, Inc, Buffalo Grove, Illinois).
2.6. Rainfall Measurement
The rainfall data were recorded using a data logger (PC 200 W, Campbell Scientific, Inc, Cache Valley, UT, USA) installed on a rain gauge at the farm. With the exception of March 2012 where rainfall data were collected only for a 15-day period, rainfall data were collected for the entire month, starting from April and ending in December of 2012. We reported the monthly average, and the data were used to investigate the relationship between the precipitation and the nutrient levels at the study sites.
2.7. Statistical Analysis
Significant variables affecting the poultry farm were studied using principal component analysis (PCA) (PRIMER-E Ltd., Plymouth, UK), based on the correlation matrix between the components and standardized variables. The method was performed to analyze the nutrient data of the soil and water sample, on a data matrix of 7 by 7 based on the seven variables used for the plots. The rows correspond to the soil and water samples analyzed and the columns correspond to the concentration of different nutrients. The PCA method was performed to analyze the nutrient data of the soil and water samples as it can draw meaningful information on a two-dimensional plot by grouping the soil nutrients into a small set of new variables explaining most of the variance [38]. This is used to observe the correlations of the nutrient quality parameters among the study sites and the sample collection times (months). The significance of this analysis is explained by the % variation of the Eigenvalues in the PCA plot; variation greater than 95% is considered to be significant [39]. Sample means and standard deviations were analyzed using Microsoft Excel software.
3. Results and Discussion
3.1. Soil and Manure/Litter Testing
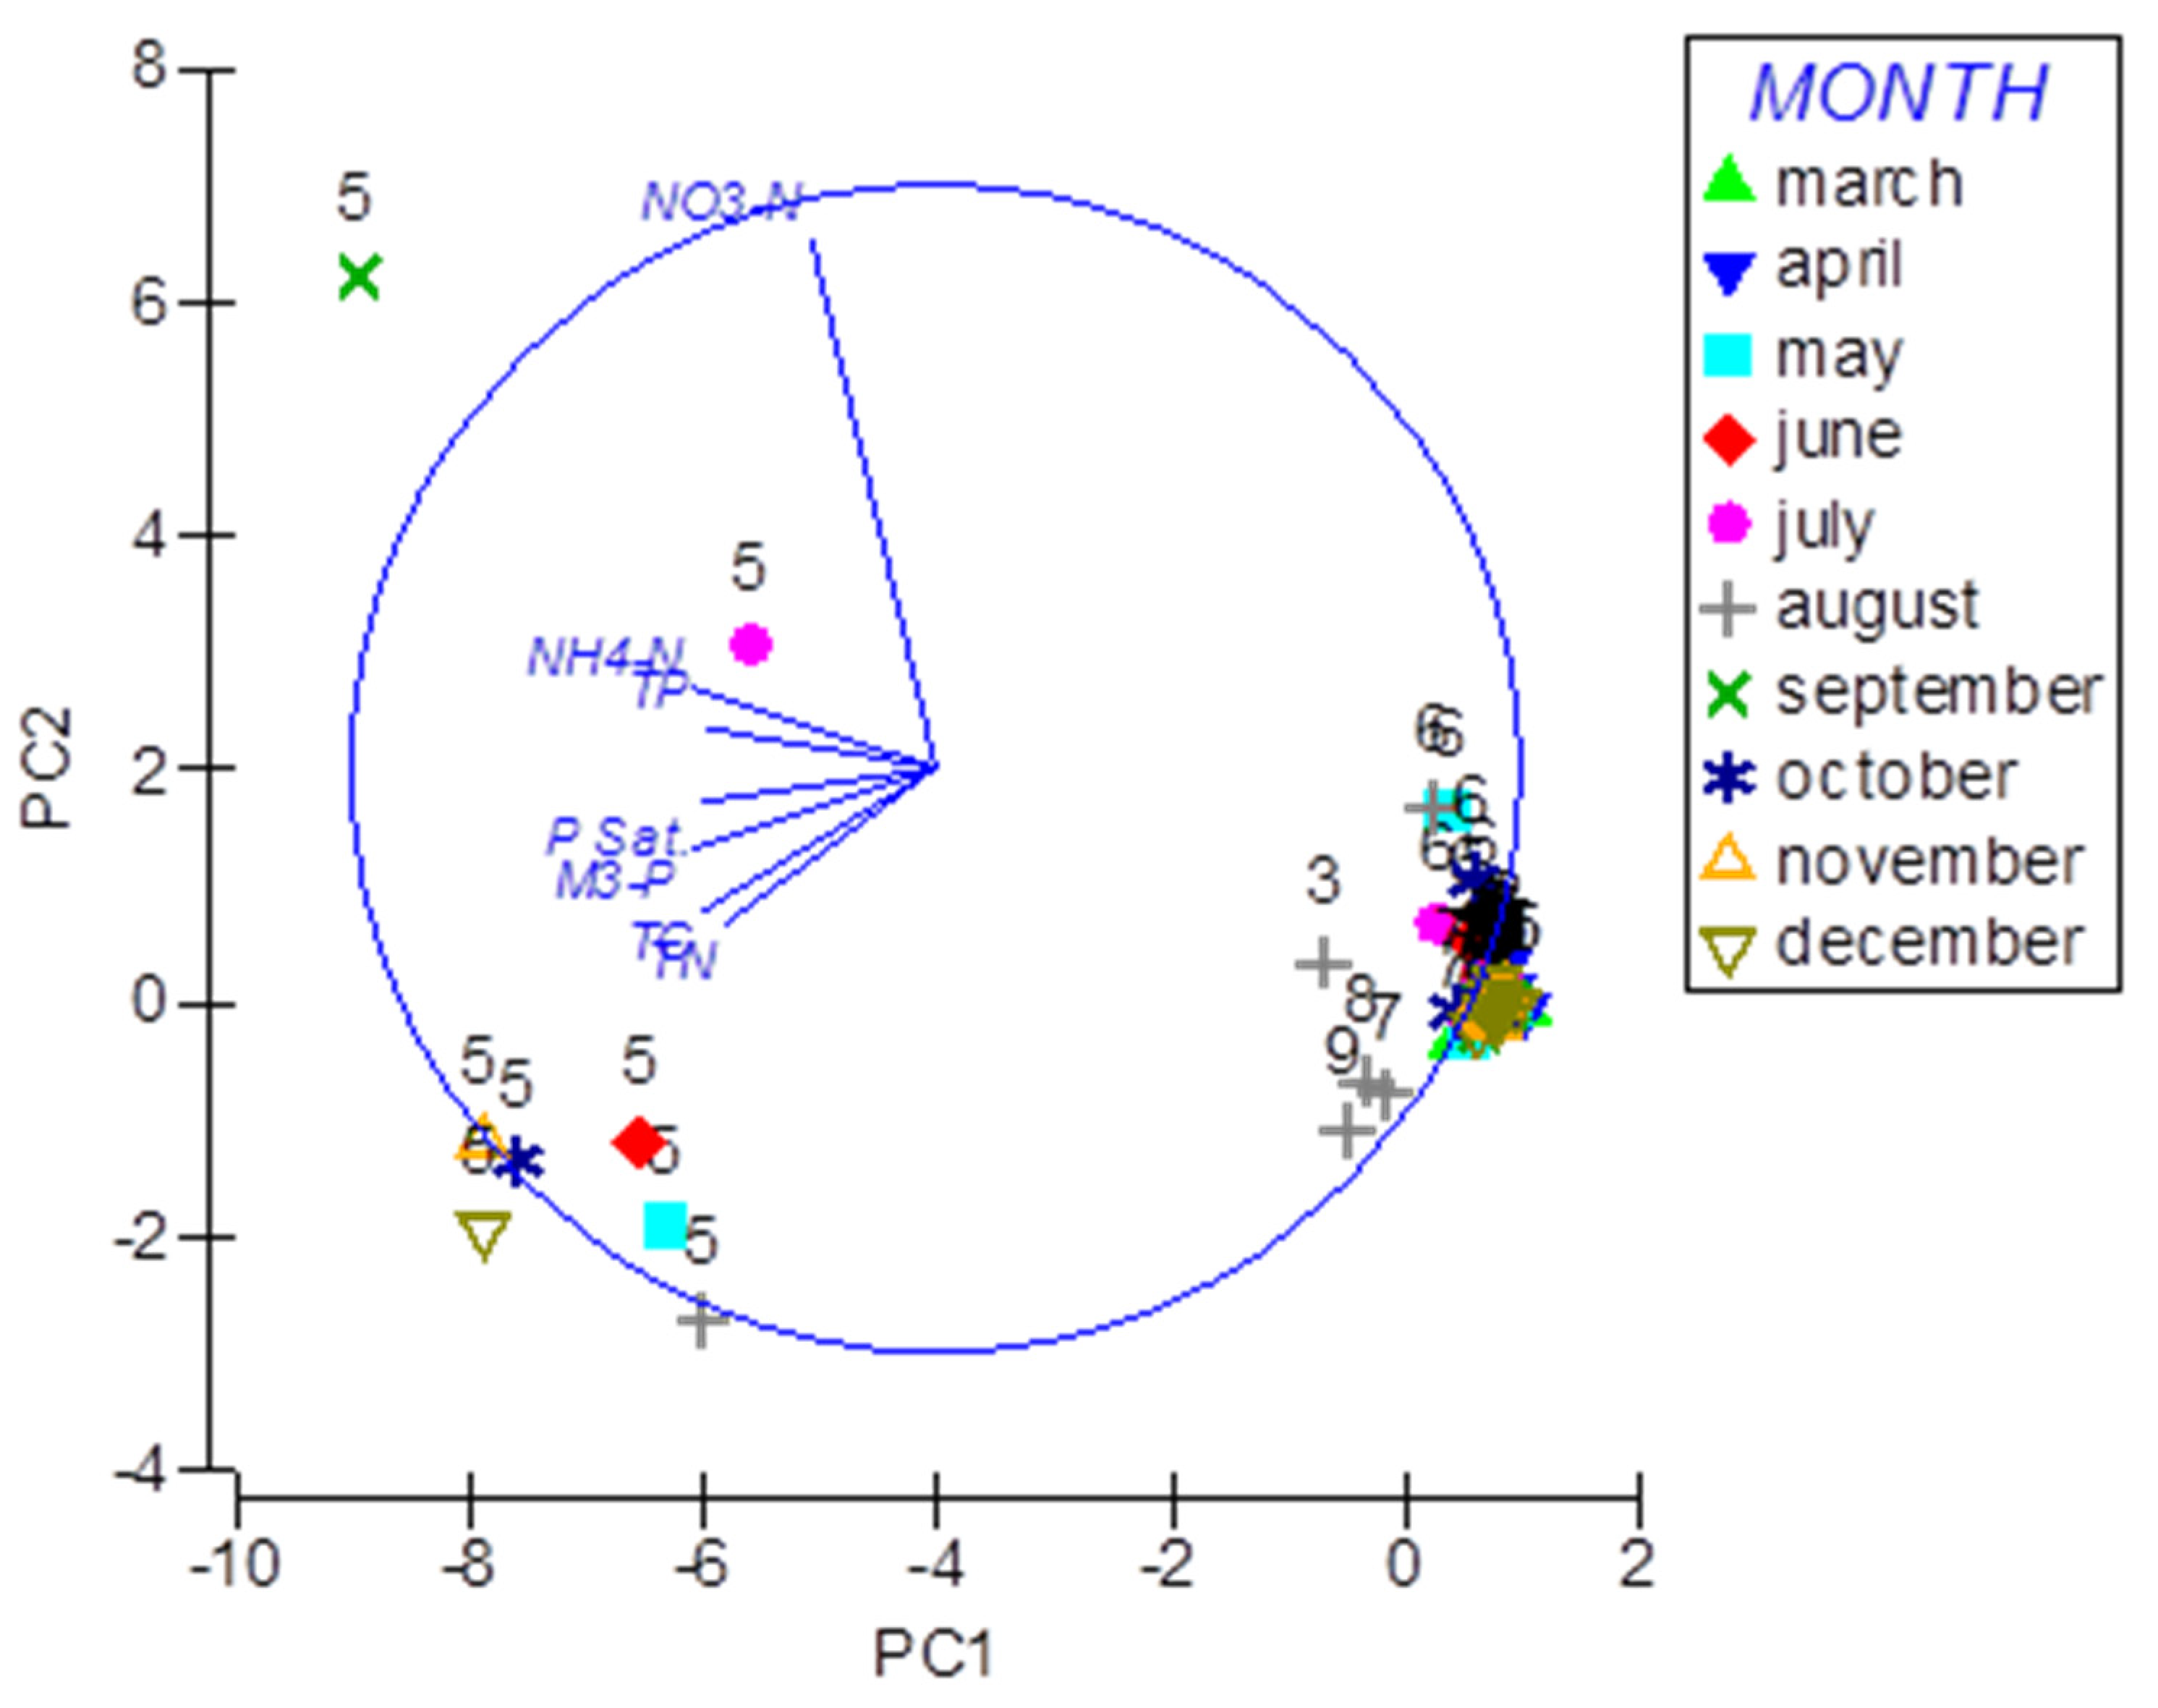
The general characteristics of the poultry manure sampled at various lots from Site I are summarized in Table 2. The poultry manure samples were collected from the poultry manure storage building. The storage building was also equipped with HUAP pads and covered. Nutrient analysis has been compared between manure and the soil samples from Site I, and the manure is considered as a positive control and is expected to have high nutrient concentration. The manure pile at the storage building (sample location 5) had a near-neutral pH, with approximately half of the manure samples containing organic matters. The Mehlich 3 extractable phosphorus was high, averaging about 3785 mg/kg. The extractable calcium (1922.3 mg kg−1) and sulfur (2995.2 mg kg−1) contents were also high. The manure samples contained enormous amounts of ammonia nitrogen. However, nitrate nitrogen was significantly low, and in some cases below detection limits. The PCA plot (Figure 5) clearly shows that location 5 is significantly different (>95%) in nutrient levels from other sample locations. In July, ammonia nitrogen was higher than other months in the manure pile. This result could be attributed to high temperature. The micronutrients at all sample locations were low, with an exception of location 5 (manure pile), which was high in aluminum and iron. Again, the concentrations are not statistically significant. Aluminum (11.6 mg kg−1) and copper (35.7 mg kg−1) concentrations were significantly lower compared with other elements analyzed for the soil samples. The concentrations of iron (112.3 mg kg−1), zinc (204.9 mg kg−1), and manganese (126.2 mg kg−1) were moderate in the soil. The nutrient levels in other sample locations were low during all sampling months when compared to the manure pile, which is supported by the PCA plot (Figure 5).
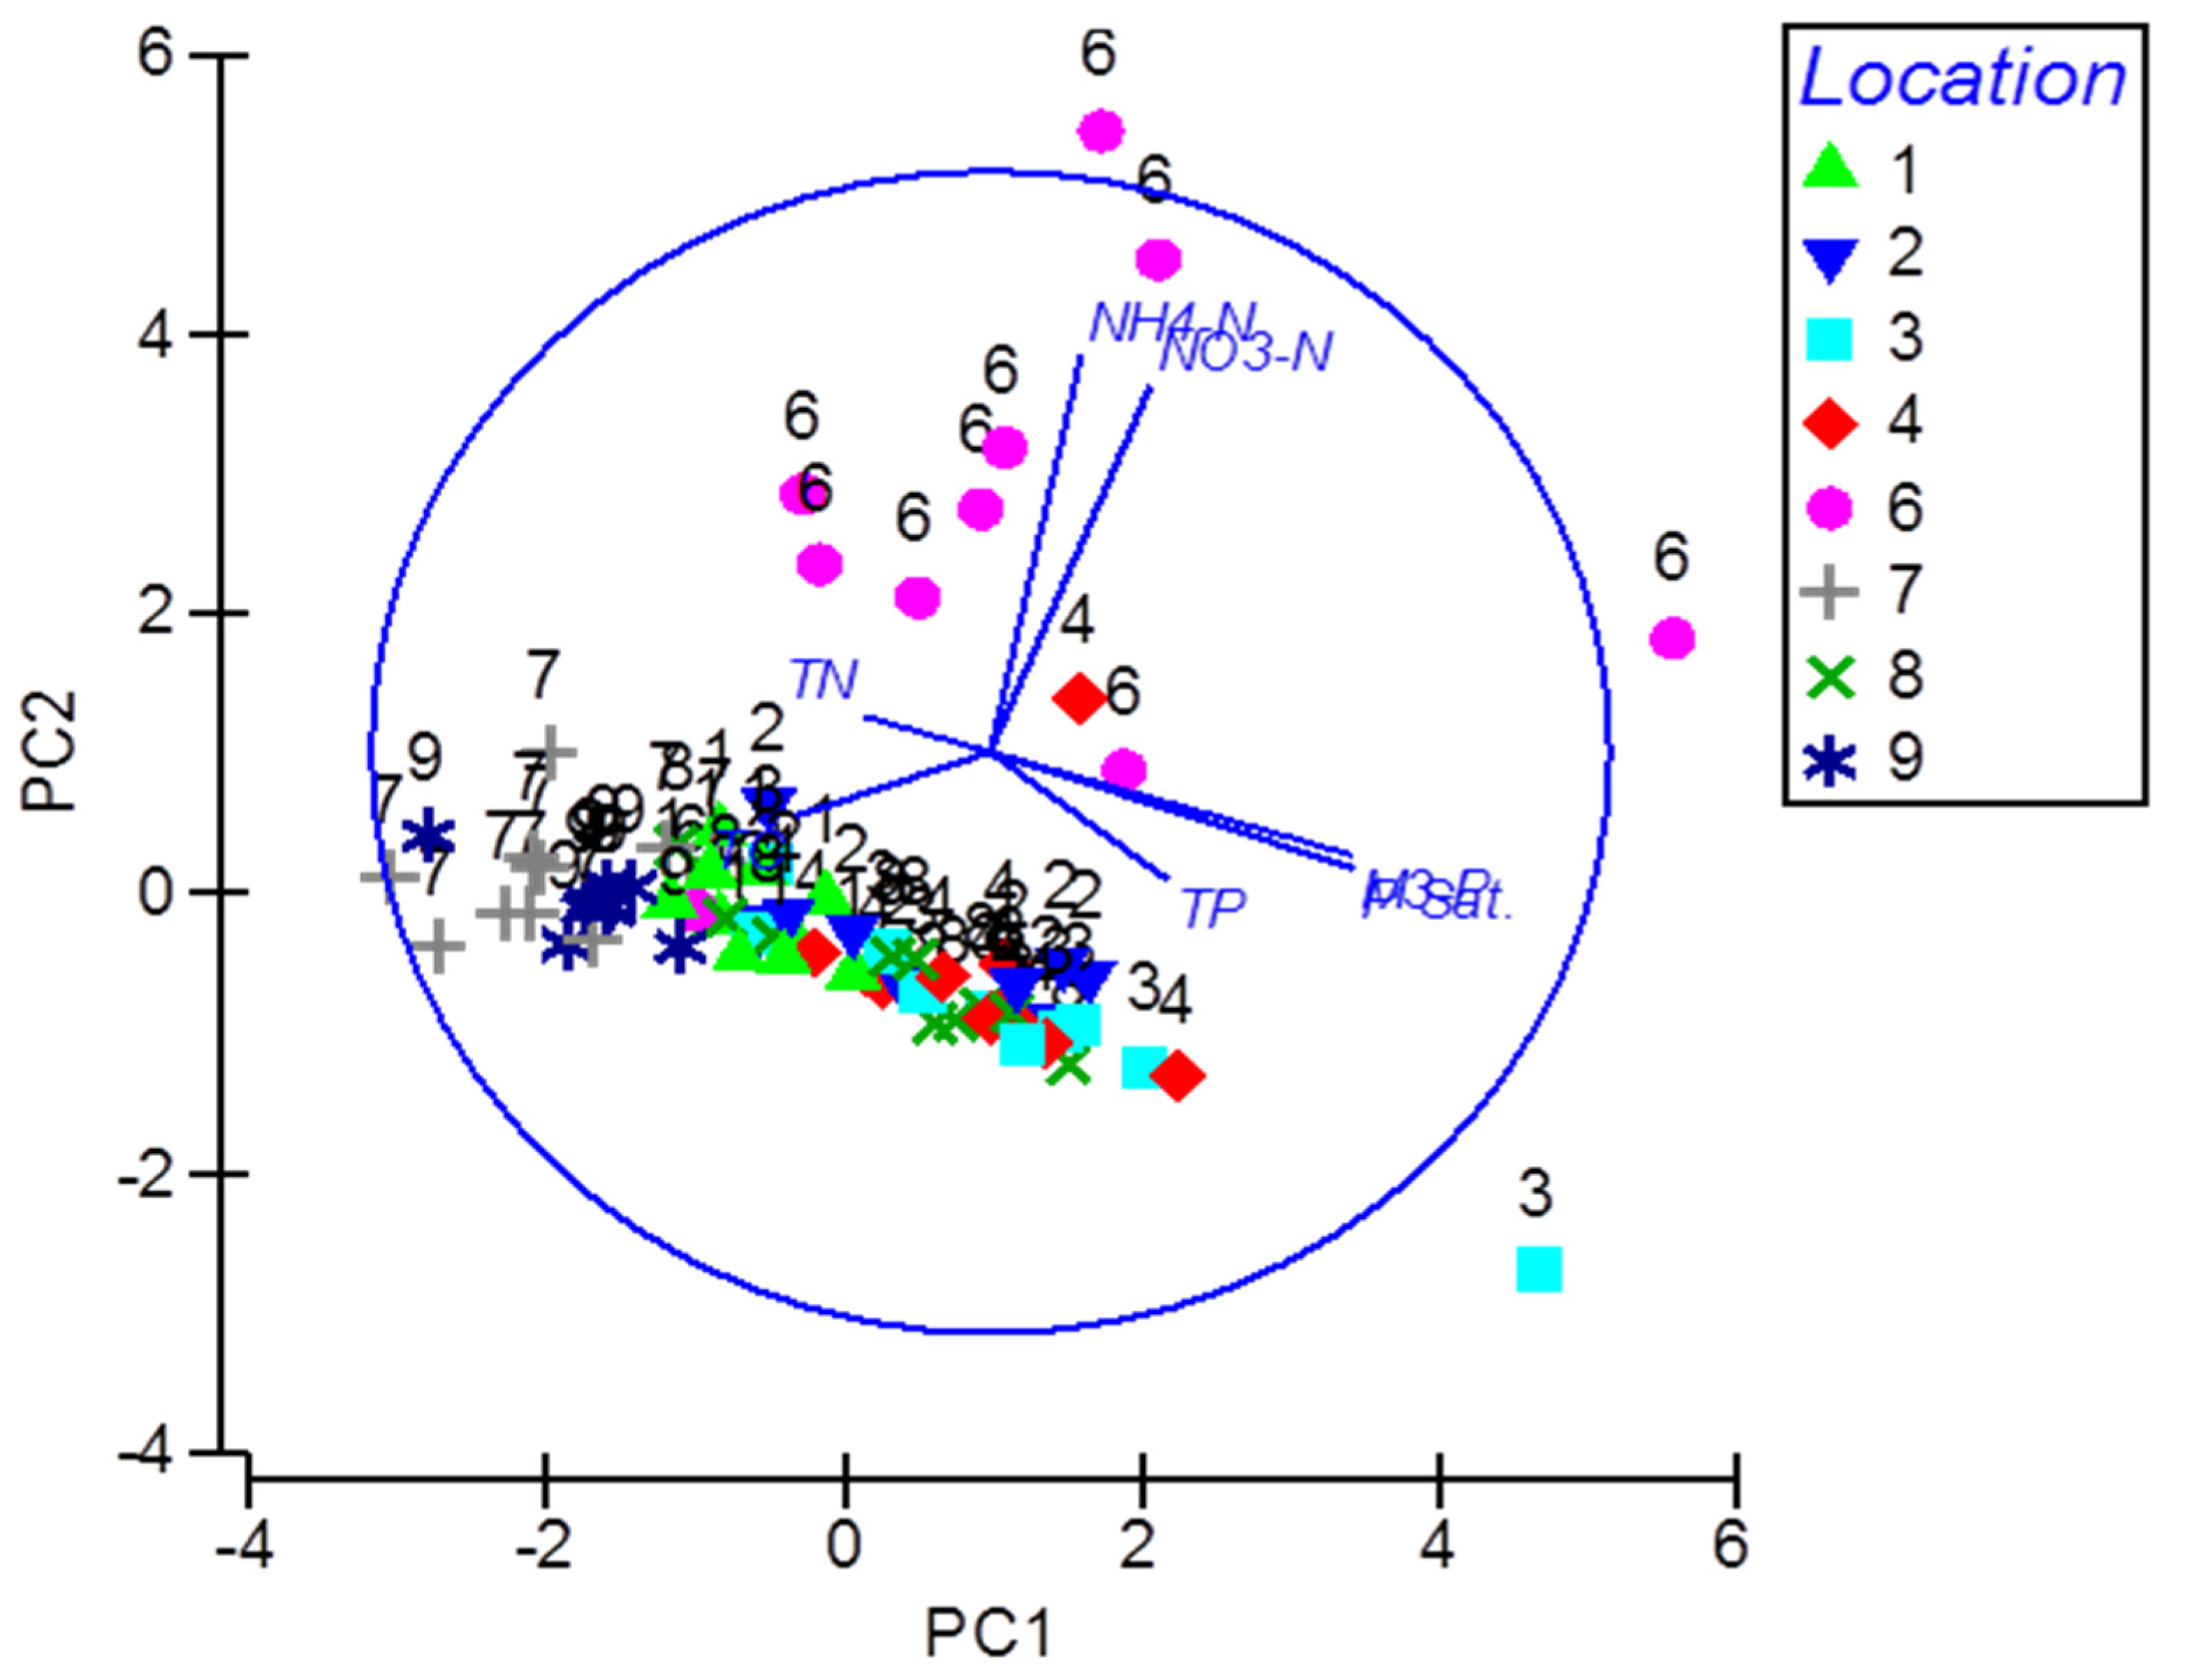
A poultry manure storage pile (sample 5 in site I) was used as a positive control to estimate the maximum nutrient loads on the farm. PCA analysis as shown in Figure 6 was performed to understand the similarities and differences among the study sites with regard to the soil nutrients. As the manure storage pile contained high levels of nutrients (Mehlich 3 phosphorus, ammonia, calcium, sulfur, and others), these data were excluded from the PCA analysis in Figure 6. The purpose of this was to understand the real variation within the soil nutrients among the study sites. When the manure pile was included in the analysis (Figure 5), real differences among the study sites could not be observed because the manure pile was skewing the results.
Most of the soil samples in Site I, except for the manure pile, had pH in the slightly alkaline range (7.1–7.2) throughout the sampling season; however, sample 7 had a pH lower than 7 (Table S1 for Site I Data). PCA analysis for nutrients was performed for these samples without considering sample 5 (manure pile), which shows that sample 6 is high in ammonia nitrogen. Samples 1, 7, and 9 are high in total carbon, and samples 3, 4, and 8 have more total phosphorus (Figure 6). However, these results are not statistically significant because % variation for the parameters analyzed is only 57%. These results thereby show that the HUAP pads on the poultry farm have a key role in trapping excess nutrients from the poultry litter and decreasing contamination of the soil.
Aside from sample 17, Site II soil samples had near-neutral pH. Mehlich 3-P content of the soils was relatively higher when compared with Site I (Table S2 for Site II Data). Recall that Site II had been in operation since 2005, but the HUAP pads were built in 2006, which might lead to accumulation of phosphorous and increasing its load at site II. Ammonium and nitrate concentrations of both the sites were comparable, except for a few sampling times. The ammonia nitrogen and nitrate nitrogen content of sample 6 was found to be significantly higher than other samples throughout the year (Table S2 for Site II Data). This sample was collected from the area surrounded by trees and was usually saturated with water.
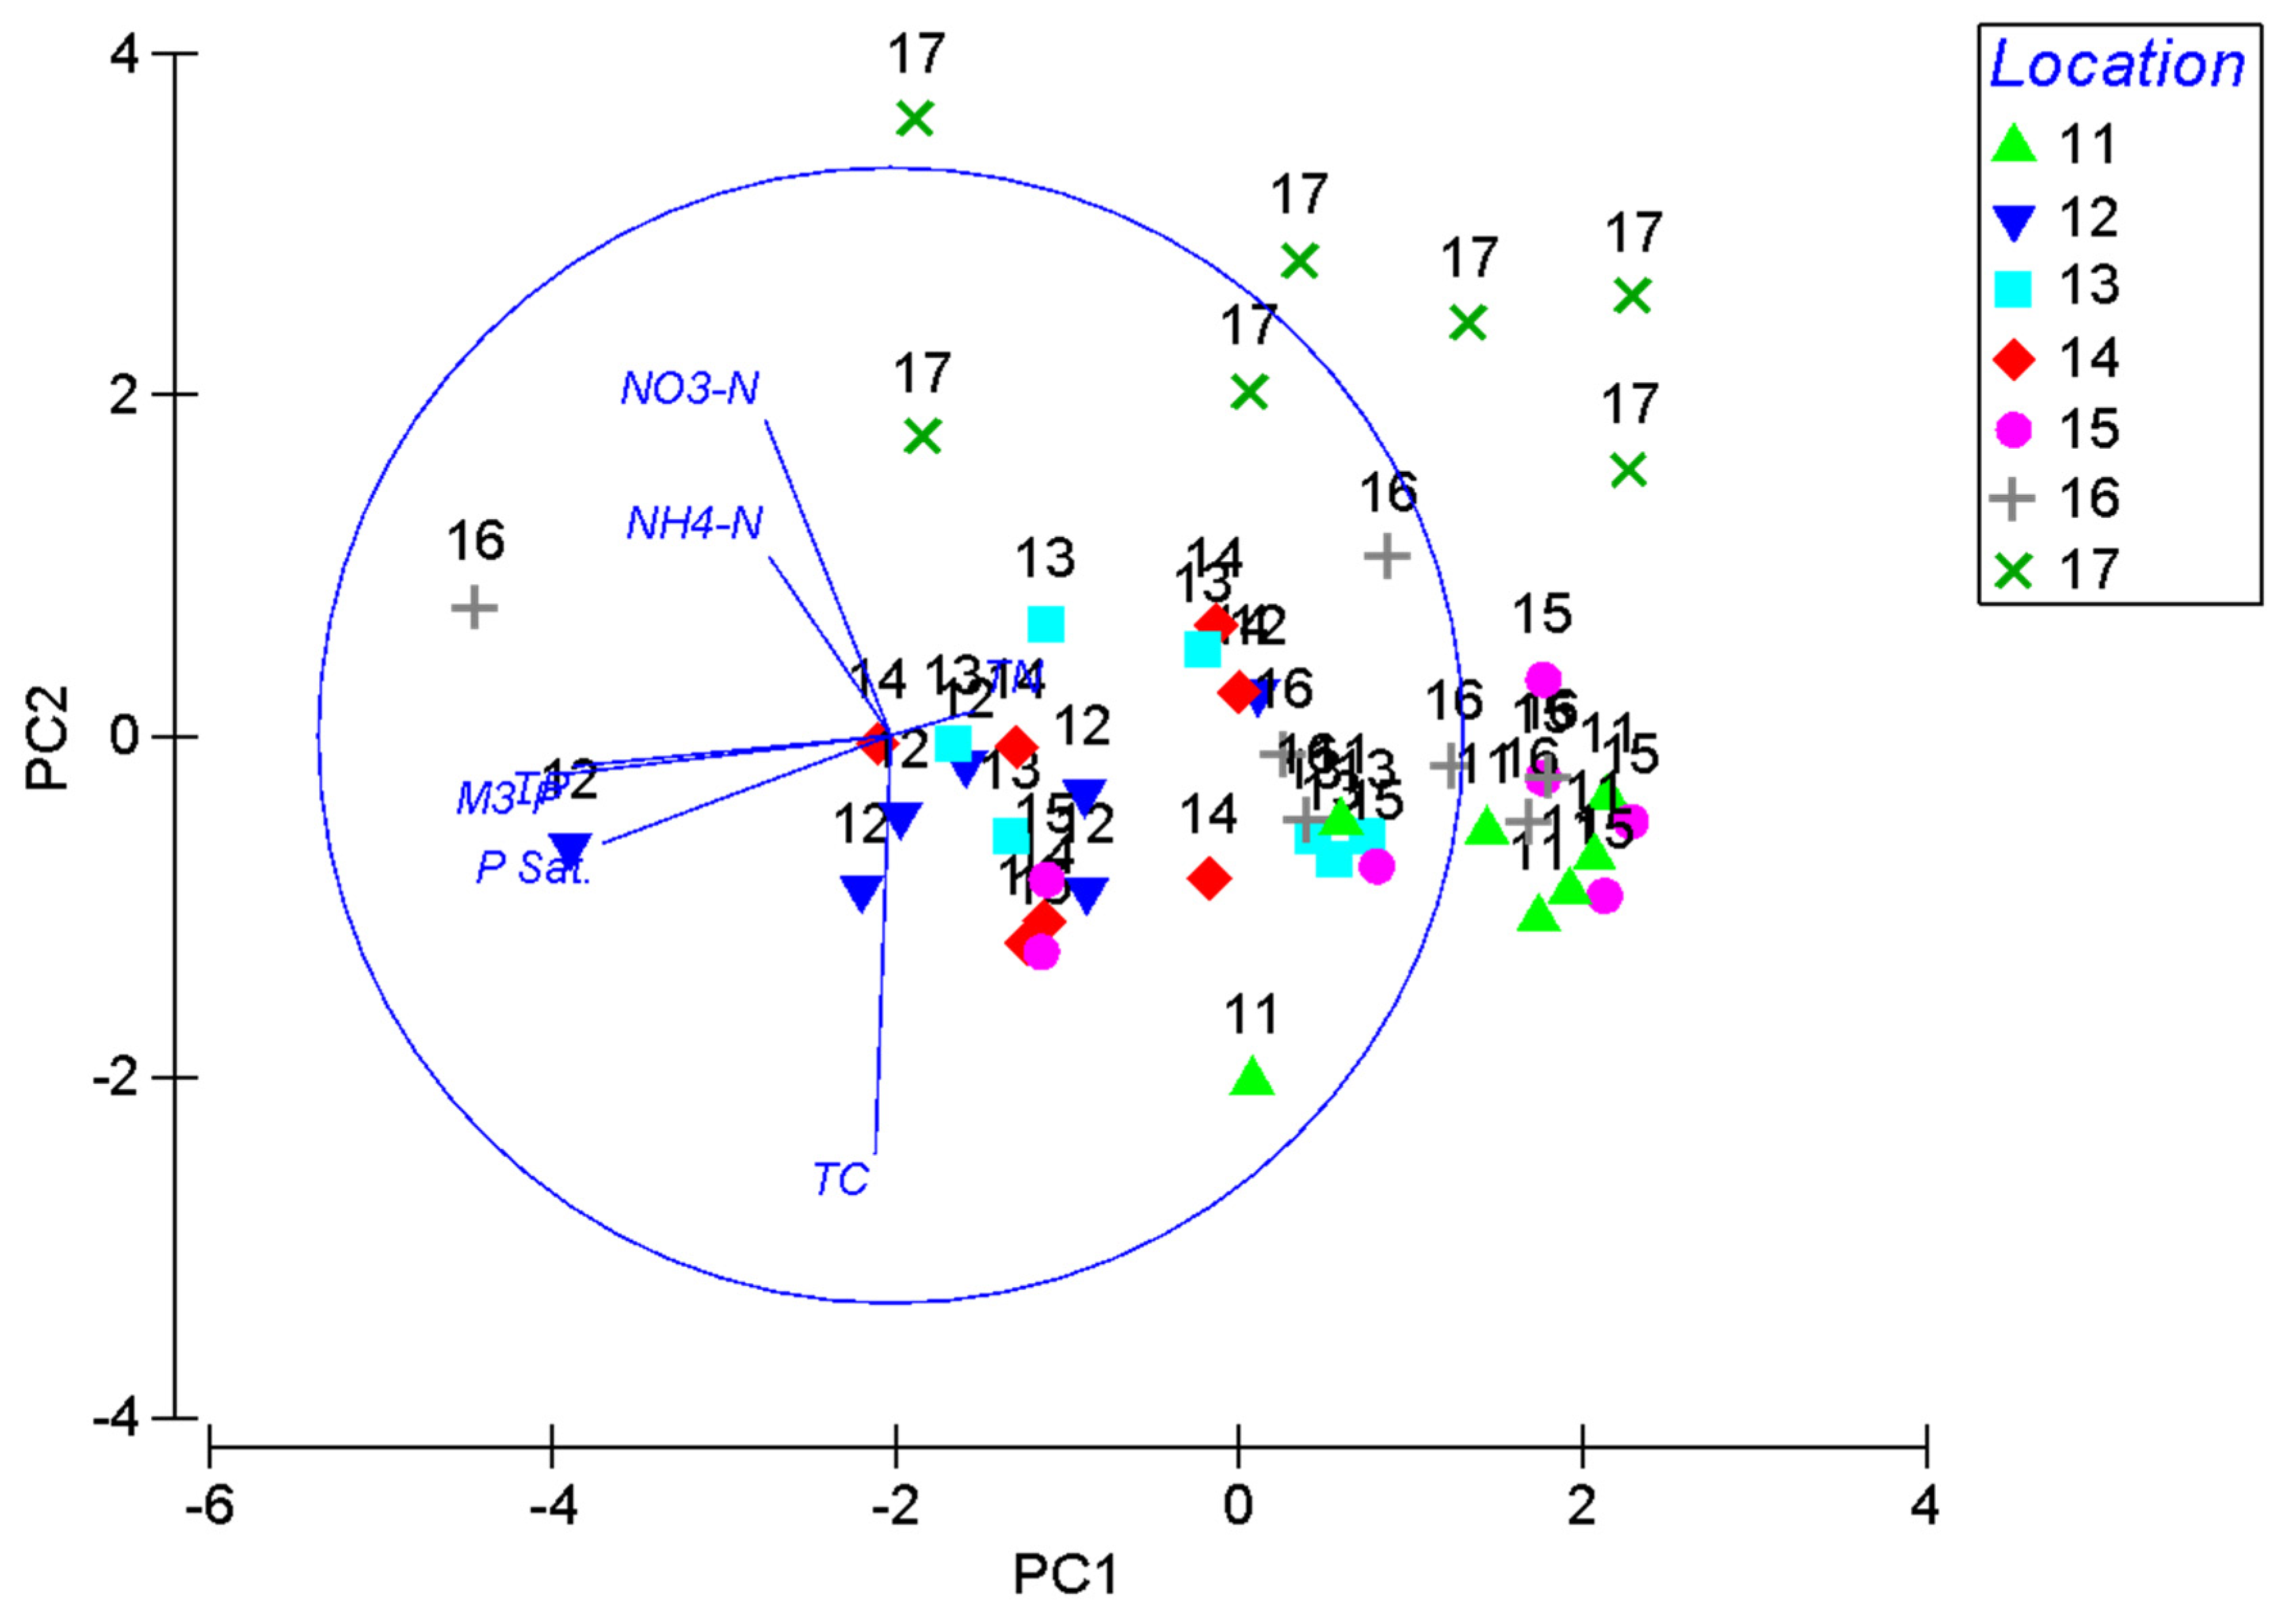
Study Site II was an older poultry site operating since 2005; the HUAP pads were installed in 2006, whereas Site I was constructed in 2009. Because the HUAP pads were older in Site II, there might be comparable differences in the soil nutrient levels among Sites I and II depending on the quality of pads and their potential to retain the nutrients. For this reason, PCA analysis was performed separately for Site I (Figure 5 and Figure 6) and Site II (Figure 7).
The PCA plot (Figure 7) shows that there are clear grouping trends between the samples based on their locations. Samples from sites 12, 13, and 14 are together and show high levels of total nitrogen. This might be because of their locations in front of the poultry house and more leaching of nutrients into the soil as the pads get older. Samples 17 and 11, which are located on the edges of the house, have low levels of total nitrogen.
Comparing the water samples with the soil samples, the contribution of soils for increasing concentrations of ammonium and nitrate in water was significantly lower based on our results. Also, phosphate content of water was significantly lower, but Mehlich 3-P content was higher in the soil samples and poultry litter. Our results suggest that there were no major differences in nutrient composition of soil and water samples after rainfall and the poultry house cleanout. The amount of water added due to the rainfall might have neutralized the amount of nutrients added to the soil and water system. Edwards and Daniel [40] conducted field-based experiments on the effect of poultry litter rate and rainfall intensity on runoff from the field. The authors observed similar results; however, an increased transfer of litter mass was found with increasing litter load and rainfall intensity. Schroder et al. [41] also did not find any correlation of soil test P levels to runoff P concentration for surface-applied poultry manure. They found that the pattern of rainfall had an effect on P concentration in runoff. P levels in runoff were more concentrated with high litter rate and immediate rainfall, compared with rainfall after 30 d of litter application and small rainfall events every 7 d for 30 d. Nguyen et al. [42] evaluated the application of poultry manure (168 kg N/ha−1) on subsurface drainage water quality under a corn/soybean rotation system. They found significantly lower concentrations of nitrate flow and the minimum nitrogen losses to subsurface soil in comparison with using inorganic fertilizer. As our study area was covered and protected with HUAP pads, there was no direct mass transfer loss observed. In a pilot study on phosphorus runoff and soil phosphorus concentrations in relation to HUAP pads, Ozbay et al. [12] observed that the concentrations of orthophosphate and total phosphorous (<0.05 mg L−1) were less than the USEPA upper limit in the ditch receiving farm runoff. They found Mehlich 3-P ranging from 22.82 to 200 mg kg−1 at the new poultry site locations, while it ranged from 48.17 to 1179.6 mg kg−1 at the old sites, with some of those being higher concentrations than the optimal soil concentrations.
The soil samples had a significant amount of Mehlich 3-P. However, if we compare the phosphate content of water samples, it was negligible. The HUAP pads that had been constructed on both study sites minimized the load of nutrients to the soil and water, as our data suggest. The water leaving the poultry house did not have any greater amount of nutrients compared to that of stream water entering the poultry house. Even though some amounts of nutrients (nitrate, nitrite, and phosphate) were added to water near the poultry house entrance, the level was neutralized as the water moved downstream. Although we did not directly measure the contribution of the relatively narrow buffer strips with native grass and bushes, we believe that the low nutrient concentration of water in the stream adjacent to the buffer strip in front of the HUAP pads by the poultry house deserves mentioning in this paper. Vegetative buffer strips were closer to the ditch restricting soil and nutrient runoff.
3.2. Water Sample Analysis
The results of water quality parameters are summarized in Table 3. The PCA analysis did not show a significant difference in nutrient levels between the sampling locations or over time. However, sample B (the point where poultry retention pond water met the stream water) had the maximum concentration of total phosphorus and electrical conductivity during June and July 2012, and the nitrate nitrogen concentration was at the highest level in December 2012. The pond located next to the poultry house accumulated rooftop water and surface runoff. It was not used for any kind of poultry house discharge collection. The concentrations of phosphate (maximum 3.873 mg L−1) and ammonium (0.67 mg L−1) were negligible in the samples analyzed; however, nitrate concentration was higher for sample B in December (7.7 mg L−1). In most of the water samples, calcium (maximum 23.247 mg L−1), sodium (maximum 8.56 mg L−1), and sulfur (maximum 5.29 mg L−1) were higher when compared with other nutrients, but these levels were still below the maximum allowable EPA limits (250 mg L−1 sulfate); sodium and calcium limits are not yet set by EPA. This suggests that there are no major issues of hardness in the farm water runoff from the poultry houses. Likewise, other elements, such as extractable aluminum (<0.67 mg L−1), boron, and copper, were negligible in all samples except sample B (14.8 mg L−1 Cu+2) collected on 11 July 2012.
The maximum electrical conductivity (EC) was recorded in sample station B. Temporally, it was at its peak during June and July. One possible reason for this is that the activity of the poultry farm increased during these months and the water levels dropped in the ditch. No significant increase was observed in the nutrient levels of the samples collected after rainfall events and removal of chickens from the houses. The pH of all water samples tested was near-neutral (pH = 7), except for water sample B collected in November 2012, which had a pH of 6.05 right after Hurricane Sandy (22–31 October 2012). Although there are some differences in the nutrient levels among the study locations, they were not considered to be significant as % variation for the variables (parameters) tested between the sites is lower. The PCA plot shows that these study sites have a variation of 75%, which is not considered significant. From the PCA analysis, samples from location B that were collected during June and July can be grouped together, and all other samples can be pooled as one group because of the very small differences between the samples.
Groundwater is the sole water supply in the farm for both household and farm operation. Although we did not test the groundwater quality from the farm in our laboratory, a groundwater sample from the farm was obtained and submitted to the Public Health Laboratory, Smyrna, DE. The samples were tested for pH, nitrite, nitrate, sulfate, alkalinity, fluoride, hardness, iron, total coliform, and E. coli. All the parameters fell in the acceptable ranges with no nutrient or bacterial contaminants.
3.3. Rainfall Measurement
The total monthly rainfall data are shown in Figure 8. The highest rainfall was recorded in October due to Hurricane Sandy, but this event did not significantly affect the leaching of soil nutrients on the farm as effective waste management practices (i.e., covered manure storage and HUAP pads) were adopted. Our result shows that HUAP pads may have the potential to help control the nutrient runoff on the farm. The rainfall time and distribution were found to impact farmers’ scheduling of daily farm operations, including chicken house cleaning, maintenance, chicken harvesting, and manure transport, which also helps farmers to minimize potential spillage issues.
4. Summary and Conclusions
The analysis of soil and water samples around the HUAP pads did not show a significant increase in the concentration of nutrients in the surrounding area. The HUAP pads made a contribution to reducing the nutrient loads in the soil and water at our study sites. The results suggest that there was a minimal transfer of nutrients from soil into the water and that the added amount of nutrients was neutralized with downstream flow of the water. The house cleaning and storm events had a minimal effect on raising the concentration of nutrients in soil and water samples in the particular farm we tested.
This study shows that there are some differences in the efficiency of HUAP pads between Sites I and II. Site II had higher total nitrogen and phosphorous surrounding the pads, whereas no excess nutrients were recorded at Site I. There was a lag period of over a year in constructing the pads at Site II, and our study was unable to determine if these excess loads of nutrients were a result of degraded pads or due to the lag period. Long-term monitoring of soil and water quality in poultry farms is required to comprehensively assess the efficiency of HUAP pads in preventing nutrient contamination of surface and subsurface waters. We recommend continuous monitoring of the soil and water quality in the poultry farm, along with monitoring of the weather conditions. Also, studying the nutrient loadings of the poultry house without HUAP pads would provide a better picture of the efficiency of HUAP pads in protecting the soil and water quality. Unfortunately, we could not get any farmers not using HUAP to participate in our study due to potential regularity concerns among the farmers regarding nutrient loads. Therefore, it is advisable to conduct this research in different farms with and without HUAP pads to better assess the effectiveness of the pads in controlling the nutrient runoff. Further research on microbial contaminant monitoring will also ensure the efficacy of using these pads to reduce the nutrient loads for both chemical and biological origins.
Supplementary Materials
The following data on the characteristics of soil samples at Site I and Site II in tabular format are available online at https://0-www-mdpi-com.brum.beds.ac.uk/2077-0472/11/2/154/s1.
Author Contributions
Conceptualization, G.O. and S.S.; methodology, R.K. and L.K.C.; software, L.K.C.; validation, G.O., S.S., R.K. and L.K.C.; formal analysis, R.K.; data curation, G.O., S.S., R.K. and L.K.C.; writing—original draft preparation, R.K., G.O.; writing—review and editing, G.O., S.S., R.K. and L.K.C.; funding acquisition, G.O. and S.S. All authors have read and agreed to the published version of the manuscript.
Funding
This project was funded primarily by the USDA-NRCS Grant Agreement No. 69-21J2-1-14 2010-12 and partially USDA Evans-Allen Grant—Award# DELX0029-06-8, and NOAA-LMRCSC Program—Award# NA16SEC4810007.
Institutional Review Board Statement
Every year we receive annual permit from Delaware Department of Natural Resources and Environmental Control (DNREC) to collect soil, water, plants, fish, oysters, and blue crabs samples for testing for environmental contaminants. No animals or human subjects were used in our study. No Institutional Review Board application was needed from Delaware State University.
Informed Consent Statement
The authors declare that the research was conducted in the absence of any commercial or financial relationships that could be construed as a potential conflict of interest.
Data Availability Statement
The datasets generated during and analyzed during the current study are available from the corresponding author on reasonable request, and most of the datasets are also included in this published article (and its supplementary information files).
Acknowledgments
This project was funded by USDA-NRCS grant agreement No. 69-21J2-1-14 2010-12 awarded to Ozbay and Smith. We would like to thank Mingxin Guo and Karen Gartley for their support with soil and water sample analyses. We would also like to thank Amy Cannon, research technician, for her assistance and contribution to the project and Zohreh Mazaheri Kouhanestani for her editorial assistance and review of our manuscript. Most of all, we would like to thank the poultry farmer who assisted us throughout this project and made everything available to ensure we collected our samples in a timely manner. We would also like to thank NRCS Delaware State Conservation Engineer Lawrence Tennity and Conservationist Russell Morgan for their support. Undergraduate internship support was provided by the USDA-NIFA and DSU EPSCOR–CIBER Program. Staff supports were provided by USDA-NRCS, USDA Evans-Allen Grant Program, and NOAA LMRCSC Grant Program.
Conflicts of Interest
The authors declare that the research was conducted in the absence of any commercial or financial relationships that could be construed as a potential conflict of interest.
References
- National Research Council Soil and Water Quality. Soil and Water Quality; National Academies Press: Washington, DC, USA, 1993; pp. 21–34. [Google Scholar]
- European Commission (EC). Communication from the Commission to the Council, the European Parliament, the European Economic and Social Committee and the Committee of the Regions. Thematic Strategy for Soil Protection, 22 September 2006. COM (2006) 231 Final. European Commission. 2006. Available online: https://eur-lex.europa.eu/LexUriServ/LexUriServ.do?uri=COM:2006:0231:FIN:EN:PDF (accessed on 10 February 2021).
- Johannsen, S.S.; Armitage, P. Agricultural Practice and the effects of agricultural land use on water quality. Freshw. Forum. 2010, 28, 45–59. Available online: https://core.ac.uk/download/pdf/228601686.pdf (accessed on 10 February 2021).
- Roberts, A.D.; Prince, S.D. Effects of urban and non-urban land cover on nitrogen and phosphorus runoff to Chesapeake Bay. Ecol. Indic. 2010, 10, 459–474. [Google Scholar] [CrossRef]
- United States Environmental Protection Agency (USEPA). Technical Support Document for Identification of Chesapeake Bay Designated Uses and Attainability. United States Environmental Protection Agency, Region ΙΙΙ: Chesapeake Bay Program. 2003. Available online: https://www.chesapeakebay.net/content/publications/cbp_13218.pdf (accessed on 10 February 2021).
- Parker, A. The non-linear, naturally oscillating pattern of sea-levels in the Chesapeake Bay, East Coast, USA. Nonlinear Eng. 2013, 2, 1–20. [Google Scholar] [CrossRef] [Green Version]
- Ozbay, G.; Fan, C.; Yang, Z. Relationship between Land Use and Water Quality and its Assessment Using Hyperspectral Remote Sensing in Mid- Atlantic Estuaries. Water Qual. 2017. [Google Scholar] [CrossRef] [Green Version]
- United States Environmental Protection Agency (USEPA). Chesapeake Bay: Health and Restoration Assessment. United States Environmental Protection Agency, Region ΙΙΙ: Chesapeake Bay Program. 2007. Available online: https://www.chesapeakebay.net/documents/cbp_26038.pdf (accessed on 10 February 2021).
- Andres, A.S.; Ullman, W.J.; Savidge, K.B. Storm-Water and Base Flow Sampling and Analysis in the Nanticoke River Watershed: Preliminary Report of Findings 2002–2004: Delaware Geological Survey Open-File Report No.46; University of Delaware: Newark, DE, USA; p. 20.
- Boesch, D.F.; Brinsfield, R.B.; Magnien, R.E. Chesapeake Bay Eutrophication: Scientific Understanding, Ecosystem Restoration, and Challenges for Agriculture. J. Environ. Qual. 2001, 30, 303–320. [Google Scholar] [CrossRef] [PubMed] [Green Version]
- Vaux, H. Groundwater under stress: The importance of management. Environ. Earth Sci. 2011, 62, 19–23. [Google Scholar] [CrossRef] [Green Version]
- Ozbay, G.; Khatiwada, R.; Chintapenta, L.K.; Handy, E.F.; Smith, S.L. Sustainable farm practice: Study of total and soluble phosphorus in a poultry farm equipped with heavy use area protection pads, Dover, Delaware. Prof. Agric. Work. J. 2016, 4, 1–17. Available online: http://tuspubs.tuskegee.edu/pawj/vol4/iss1/7, (accessed on 10 February 2021).
- Homsey, A.; Haaf, L.; Somers, K. Current land cover. In Technical Report for the Delaware Estuary and Basin; Partnership for the Delaware Estuary: Wilmington, DE, USA, 2017; 379p, Available online: http://www.delawareestuary.org/wp-content/uploads/2018/01/Chp1-landscape.pdf (accessed on 10 February 2021).
- Delmarva Poultry Industry, Inc. Best Management Practices for Good Neighbor Relations; University of Maryland Extension: College Park, MD, USA, 2015; Available online: http://extension.umd.edu/sites/default/files/_docs/locations/2015%20june%20good%20neighbor%20bmps%20final%20board%20approved%20version%20.pdf (accessed on 10 February 2021).
- Delaware Department of Natural Resources and Environmental Control (DNREC). Delaware’s Phase I Chesapeake Watershed Implementation Plan; Delaware’s Chesapeake Interagency Workgroup: Dover, DE, USA, 2010; pp. 1–440. [Google Scholar]
- United States Environmental Protection Agency (USEPA). Chesapeake Bay Total Maximum Daily Load for Nitrogen, Phosphorus and Sediment. 2010. Available online: http://www.epa.gov/reg3wapd/pdf/pdf_chesbay/FinalBayTMDL/CBayFinalTMDLExecSumSection1through3_final.pdf (accessed on 10 February 2021).
- United States Environmental Protection Agency (USEPA). EPA Interim Evaluation of Delaware’s 2014–2015 Milestones. 2015. Available online: http://www.epa.gov/reg3wapd/tmdl/2015Evaluations/Delaware2014-2015InterimMilestoneEvaluation_61015.pdf (accessed on 10 February 2021).
- Timely Topics; Delmarva Poultry Industry, Inc.: Georgetown, DE, USA, 2013; Volume 30.
- University of Delaware Cooperative Extension. Phosphorous in Poultry Litter: Guidelines from the University of Delaware; University of Delaware College of Agriculture and Natural Resource: Newark, DE, USA, 2012; Available online: https://www.udel.edu/academics/colleges/canr/cooperative-extension/fact-sheets/phosphorous-in-poultry-litter-guidelines-from-the-university-of-delaware/ (accessed on 10 February 2021).
- Ator, S.W.; Denver, J.M. Understanding nutrients in the Chesapeake Bay watershed and implications for management and restoration: The Eastern Shore. Circular 2015. [Google Scholar] [CrossRef] [Green Version]
- Hodne, C.J. Concentrating on Clean Water: The Challenge of Concentrated Animal Feeding Operations. The Iowa Policy Project, Mount Vernon, Iowa. 2005. Available online: https://www.iowapolicyproject.org/2005docs/050406-cafo-fullx.pdf (accessed on 10 February 2021).
- Hornbuckle, K.C.; Weldon, M.B. Concentrated Animal Feeding Operations, Row Crops, and Their Relationship to Nitrate in Eastern Iowa Rivers. Environ. Sci. Technol. 2006, 40, 3168–3173. [Google Scholar] [CrossRef] [Green Version]
- Vitale, J.D.; Penn, C.J.; Park, S.; Payne, J.; A Hattey, J.; Warren, J. Animal Manure as Alternatives to Commercial Fertilizers in the Southern High Plains of the United States: How Oklahoma Can Manage Animal Waste. In Integrated Waste Management—Volume II; Sunil, K., Ed.; IntechOpen: London, UK, 2011; Volume II, pp. 143–164. [Google Scholar]
- Kibet, L.C.; Allen, A.L.; Church, C.; Kleinman, P.J.A.; Feyereisen, G.W.; Saporito, L.S.; Hashem, F.; May, E.B.; Way, T.R. Transport of dissolved trace elements in surface runoff and leachate from a Coastal Plain soil after poultry litter application. J. Soil Water Conserv. 2013, 68, 212–220. [Google Scholar] [CrossRef] [Green Version]
- López-Mosquera, M.; Cabaleiro, F.; Sainz, M.; López-Fabal, A.; Carral, E. Fertilizing value of broiler litter: Effects of drying and pelletizing. Bioresour. Technol. 2008, 99, 5626–5633. [Google Scholar] [CrossRef]
- Sims, J.; Wolf, D. Poultry Waste Management: Agricultural and Environmental Issues. Adv. Agron. 1994, 52, 1–83. [Google Scholar] [CrossRef]
- Kleinman, P.J.A.; Allen, A.L.; Needelman, B.A.; Sharpley, A.N.; Vadas, P.A.; Saporito, L.S.; Folmar, G.J.; Bryant, R.B. Dynamics of phosphorus transfers from heavily manured coastal plain soils to drainage ditches. J. Soil Water Conserv. 2007, 62, 225–235. [Google Scholar]
- Delaware Department of Natural Resources and Environmental Control (DNREC). Delaware Nonpoint Source Program Annual Report; Delaware Nonpoint Source Program: Dover, DE, USA, 2007; pp. 1–65. [Google Scholar]
- Dan, L.C.; Casey, W.R.; William, C.M. Best Management Practices for Storing and Applying Poultry Litter; The University of Georgia Cooperative Extension: Athens, GA, USA, 2012; pp. 1–12. [Google Scholar]
- Extension. How Long does it Take for Broiler Chickens to be Ready for the Market? Cooperative Extension. 2019. Available online: https://articles.extension.org/pages/67129/how-long-does-it-take-for-broiler-chickens-to-be-ready-for-the-market (accessed on 10 February 2021).
- Miller, R.O.; Kissel, D.E. Comparison of Soil pH Methods on Soils of North America. Soil Sci. Soc. Am. J. 2010, 74, 310–316. [Google Scholar] [CrossRef]
- North American Proficiency Testing (NAPT). North American Proficiency Testing- Performance Assessment Program (NAPT-PAP). 2006. Available online: https://www.naptprogram.org/files/napt/pap-2018-document.pdf (accessed on 10 February 2021).
- Salehi, M.; Beni, O.H.; Harchegani, H.B.; Borujeni, I.E.; Motaghian, H. Refining Soil Organic Matter Determination by Loss-on-Ignition. Pedosphere 2011, 21, 473–482. [Google Scholar] [CrossRef]
- Sims, J.T.; Maguire, R.O.; Leytem, A.B.; Gartley, K.L.; Pautler, M.C. Evaluation of Mehlich 3 as an Agri-Environmental Soil Phosphorus Test for the Mid-Atlantic United States of America. Soil Sci. Soc. Am. J. 2002, 66, 2016–2032. [Google Scholar] [CrossRef]
- Sims, J.T. Comparison of mehlich 1 and mehlich 3 extractants for P, K, Ca, Mg, Mn, Cu and Zn in atlantic coastal plain soils. Commun. Soil Sci. Plant Anal. 1989, 20, 1707–1726. [Google Scholar] [CrossRef]
- Mehlich, A.; Bowling, S.S.; Hatfield, A.L. Buffer pH acidity in relation to nature of soil acidity and expression of lime requirement. Commun. Soil Sci. Plant Anal. 1976, 7, 253–263. [Google Scholar] [CrossRef]
- Keeney, D.; Nelson, D. Nitrogen-Inorganic Forms. In Sorghum: State of the Art and Future Perspectives; Wiley: Madison, WI, USA, 2015; pp. 643–698. [Google Scholar]
- Oumenskou, H.; El Baghdadi, M.; Barakat, A.; Aquit, M.; Ennaji, W.; Karroum, L.A.; Aadraoui, M. Multivariate statistical analysis for spatial evaluation of physicochemical properties of agricultural soils from Beni-Amir irrigated perimeter, Tadla plain, Morocco. Geol. Ecol. Landsc. 2018, 3, 83–94. [Google Scholar] [CrossRef] [Green Version]
- Jolliffe, I.T.; Cadima, J. Principal component analysis: A review and recent developments. Philos. Trans. R. Soc. A Math. Phys. Eng. Sci. 2016, 374, 20150202. [Google Scholar] [CrossRef]
- Edwards, D.R.; Daniel, T.C. Effects of Poultry Litter Application Rate and Rainfall Intensity on Quality of Runoff from Fescuegrass Plots. J. Environ. Qual. 1993, 22, 361–365. [Google Scholar] [CrossRef]
- Schroeder, P.D.; Radcliffe, D.E.; Cabrera, M.L. Rainfall Timing and Poultry Litter Application Rate Effects on Phosphorus Loss in Surface Runoff. J. Environ. Qual. 2004, 33, 2201–2209. [Google Scholar] [CrossRef] [PubMed]
- Nguyen, H.Q.; Kanwar, R.S.; Hoover, N.L.; Dixon, P.; Hobbs, J.; Pederson, C.; Soupir, M.L. Long-Term Effects of Poultry Manure Application on Nitrate Leaching in Tile Drain Water; American Society of Agricultural and Biological Engineers: St Joseph, MI, USA, 2013; Volume 56, pp. 91–101. [Google Scholar] [CrossRef]
Figure 1.
Aerial view of the poultry farm equipped with heavy use area protection pads. Please see Table 1 for the specific sites descriptions.
Figure 1.
Aerial view of the poultry farm equipped with heavy use area protection pads. Please see Table 1 for the specific sites descriptions.

Figure 2.
Aerial view showing the soil sampling points in the farm—Site I. Numbers in figure denotes sampling locations. Please see Table 1 for the specific sites descriptions.
Figure 2.
Aerial view showing the soil sampling points in the farm—Site I. Numbers in figure denotes sampling locations. Please see Table 1 for the specific sites descriptions.

Figure 3.
Aerial view showing the water sampling points in the poultry farm. Letters in figure denotes sampling locations. Please see Table 1 for the specific sites descriptions.
Figure 3.
Aerial view showing the water sampling points in the poultry farm. Letters in figure denotes sampling locations. Please see Table 1 for the specific sites descriptions.

Figure 4.
Aerial view showing soil sampling points in the farm—Site II. Numbers in figure denotes sampling locations. Please see Table 1 for the specific sites descriptions.
Figure 4.
Aerial view showing soil sampling points in the farm—Site II. Numbers in figure denotes sampling locations. Please see Table 1 for the specific sites descriptions.

Figure 5.
Principal component analysis (PCA) plot for Site I soil samples including the manure pile (sample 5).
Figure 5.
Principal component analysis (PCA) plot for Site I soil samples including the manure pile (sample 5).

Figure 6.
PCA plot for Site I soil samples without manure pile (sample 5).

Figure 7.
PCA plot for Site II soil samples.

Figure 8.
Total rainfall data in the farm.


Table 1.
Sampling site locations and descriptions in a poultry farm, Kent County, Delaware, USA.
| Site | Code | Latitude|Longitude | Description |
|---|---|---|---|
| Site Ι—soil | 1 | 39°11′29.99′′ N 75°36′44.4′′ W | 2nd poultry house facing from back right side surface |
| 2 | 39°11′30.30′′ N 75°36′44.7′′ W | 2nd poultry house side edge deep (10 cm) | |
| 3 | 39°11′30.5′′ N 75°36′44.5′′ W | 2nd poultry house front edge deep (10 cm) | |
| 4 | 39°11′30.54′′ N 75°36′44.3′′ W | 2nd poultry house front edge (surface 5 cm) | |
| 5 | 39°11′28.4′′ N 75°36′41.2′′ W | Manure storage pile located inside the storage shed | |
| 6 | 39°11′30.4′′ N 75°36′44.15′′ W | 2nd poultry house side edge (surface 5 cm) | |
| 7 | 39°11′30.97′′ N 75°36′43.46′′ W | Drainage swale between houses 3 and 5 | |
| 8 | 39°11′30.81′′ N 75°36′46.62′′ W | Before grass buffer strip | |
| 9 | 39°11′30.94′′ N 75°36′45.01′′ W | After grass buffer strip | |
| Site Ι—water | A | 39°11′29.85′′ N 75°36′47.38′′ W | Before ditch water mixed with water from the retention pond |
| B | 39°11′30.21′′ N 75°36′46.79′′ W | Ditch water mixed with water from the retention pond | |
| C | 39°11′31.70′′ N 75°36′43.26′′ W | Front of the third chicken house from 1st station | |
| D | 39°11′32.09′′ N 75°36′43.23′′ W | At far end of 4th chicken house | |
| E | 39°11′32.87′′ N 75°36′41.30′′ W | Further down from Station D | |
| F | 39°11′33.51′′ N 75°36′41.05′′ W | Very far in woods from Station E | |
| Site ΙΙ—soil | 11 | 39°11′26.15′′ N 75°36′28.87′′ W | Right edge near (5 cm) |
| 12 | 39°11′24.05′′ N 75°36′28.56′′ W | Right edge far (5 cm) | |
| 13 | 39°11′26.35′′ N 75°36′28.53′′ W | Front edge right (10 cm) | |
| 14 | 39°11′26.45′′ N 75°36′28.54′′ W | Front edge middle (10 cm) | |
| 15 | 39°11′26.69′′ N 75°36′28.59′′ W | Front edge left (10 cm) | |
| 16 | 39°11′26.74′′ N 75°36′28.72′′ W | Left edge far (10 cm) | |
| 17 | 39°11′26.70′′ N 75°36′28.99′′ W | Left edge near (10 cm) |
Table 2.
Characteristics of the poultry manure at the farm, Kent County, Delaware, USA.
| Sample | OM† | M3-P | M3-Ca | M3-Mg | M3-S | M3-Al | Est. CEC | NH4+ | NO3− | |
|---|---|---|---|---|---|---|---|---|---|---|
| Date | pH | (%) | (mg kg−1) | (mg kg−1) | (mg kg−1) | (mg kg−1) | (mg kg−1) | (meq100g−1) | (mg kg−1) | (mg kg−1) |
| 13-Dec-2011 | 7.8 | 55.1 | 4740.14 | 2849.78 | 2510.69 | 1367.04 | 29.45 | 53.00 | 947.90 | 2.60 |
| 7-May-2012 | 6.9 | 42.9 | 3416.35 | 1771.28 | 1874.34 | 3237.82 | 26.08 | 49.69 | 2607.00 | 0.00 |
| 4-Jun-2012 | 6.4 | 35.6 | 2610.82 | 1330.28 | 1420.62 | 2467.08 | 4.00 | 40.56 | 5409.00 | 0.00 |
| 20-Jun-2012 | 7.1 | 64.2 | 5161.11 | 3854.15 | 2888.05 | 4516.75 | 2.28 | 77.27 | 799.30 | 28.60 |
| 11-Jul-2012 | 7.0 | 52.9 | 3298.70 | 1854.14 | 1771.10 | 3022.44 | 1.98 | 48.09 | 3100.00 | 839.00 |
| 16-Aug-2012 | 7.0 | 51.6 | 3316.14 | 1788.46 | 1780.90 | 2835.18 | 3.83 | 50.90 | 820.50 | 7.52 |
| 18-Sep-2012 | 6.5 | 42.2 | 2648.64 | 1285.43 | 19301.69 | 2423.03 | 18.41 | 193.80 | 5228.00 | 2006.00 |
| 18-Oct-2012 | 6.6 | 41.1 | 3317.03 | 1210.04 | 1366.42 | 2435.93 | 1.10 | 41.40 | 4360.00 | 105.80 |
| 1-Nov-2012 | 7.0 | 37.4 | 3893.87 | 1307.55 | 2143.03 | 3261.05 | 5.26 | 57.60 | 3722.00 | 195.80 |
| 6-Dec-2012 | 7.0 | 45.6 | 5447.16 | 1971.90 | 2992.89 | 4385.92 | 23.38 | 74.90 | 3302.20 | 21.09 |
| Average | 6.9 | 46.9 | 3785.00 | 1922.30 | 3805.00 | 2995.20 | 11.60 | 68.70 | 3029.60 | 320.60 |
OM† = organic matter; M3-P = Mehlich III extractable phosphorus; M3-Ca = Mehlich III extractable calcium; M3-Mg = Mehlich III extractable magnesium; M3-S = Mehlich III extractable sulfur; M3-Al = Mehlich III extractable aluminum; CEC = cation exchange capacity; NH4+ = ammonium nitrogen; NO3− = nitrate nitrogen.
Table 3.
Characteristics of the water samples ranging from the lowest to the highest concentration detected during 10 sampling dates throughout the year.
Table 3.
Characteristics of the water samples ranging from the lowest to the highest concentration detected during 10 sampling dates throughout the year.
| Sample | EC† | PO43− | NH4+ | NO3− | |
|---|---|---|---|---|---|
| Location ID | pH | (mmhoscm−1) | (mg L−1) | (mg L−1) | (mg L−1) |
| A | 6.4–7.3 | 0.00–0.48 | 0.02–3.86 | 0.00–1.64 | 0.00–1.69 |
| B | 6.1–7.1 | 0.10–7.34 | 0.00–0.07 | 0.00–0.67 | 0.34–7.78 |
| C | 6.8–7.2 | 0.06–0.19 | 0.01–0.22 | 0.00–0.32 | 0.55–4.63 |
| D | 6.6–7.2 | 0.06–0.19 | 0.00–0.29 | 0.00–0.46 | 0.30–2.63 |
| E | 6.6–7.1 | 0.06–0.22 | 0.00–0.16 | 0.00–0.44 | 0.34–2.55 |
| F | 6.5–7.0 | 0.06–0.23 | 0.00–0.18 | 0.00–0.17 | 0.05–2.56 |
Publisher’s Note: MDPI stays neutral with regard to jurisdictional claims in published maps and institutional affiliations. |
© 2021 by the authors. Licensee MDPI, Basel, Switzerland. This article is an open access article distributed under the terms and conditions of the Creative Commons Attribution (CC BY) license (http://creativecommons.org/licenses/by/4.0/).
Share and Cite
MDPI and ACS Style
Ozbay, G.; Khatiwada, R.; Smith, S.; Chintapenta, L.K. Efficacy of Heavy Use Area Protection (HUAP) Pads in Poultry Farm. Agriculture 2021, 11, 154. https://0-doi-org.brum.beds.ac.uk/10.3390/agriculture11020154
AMA Style
Ozbay G, Khatiwada R, Smith S, Chintapenta LK. Efficacy of Heavy Use Area Protection (HUAP) Pads in Poultry Farm. Agriculture. 2021; 11(2):154. https://0-doi-org.brum.beds.ac.uk/10.3390/agriculture11020154
Chicago/Turabian StyleOzbay, Gulnihal, Raju Khatiwada, Stacy Smith, and Lathadevi Karuna Chintapenta. 2021. "Efficacy of Heavy Use Area Protection (HUAP) Pads in Poultry Farm" Agriculture 11, no. 2: 154. https://0-doi-org.brum.beds.ac.uk/10.3390/agriculture11020154
Note that from the first issue of 2016, this journal uses article numbers instead of page numbers. See further details here.