
Metagenomic Insight into the Community Structure and Functional Genes in the Sunflower Rhizosphere Microbiome


Food Security and Safety Niche, Faculty of Natural and Agricultural Sciences, North-West University, Private Mail Bag X2046, Mmabatho 2735, South Africa
*
Author to whom correspondence should be addressed.
Agriculture 2021, 11(2), 167; https://0-doi-org.brum.beds.ac.uk/10.3390/agriculture11020167
Submission received: 5 January 2021
/
Revised: 27 January 2021
/
Accepted: 9 February 2021
/
Published: 18 February 2021
(This article belongs to the Section Genotype Evaluation and Breeding)
Abstract
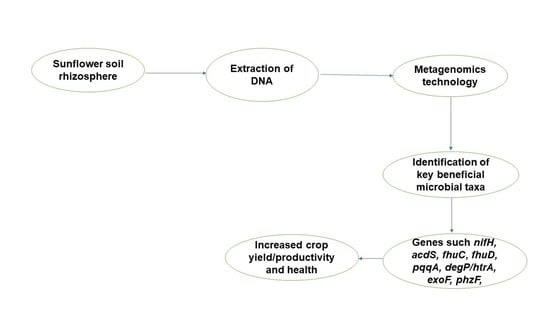
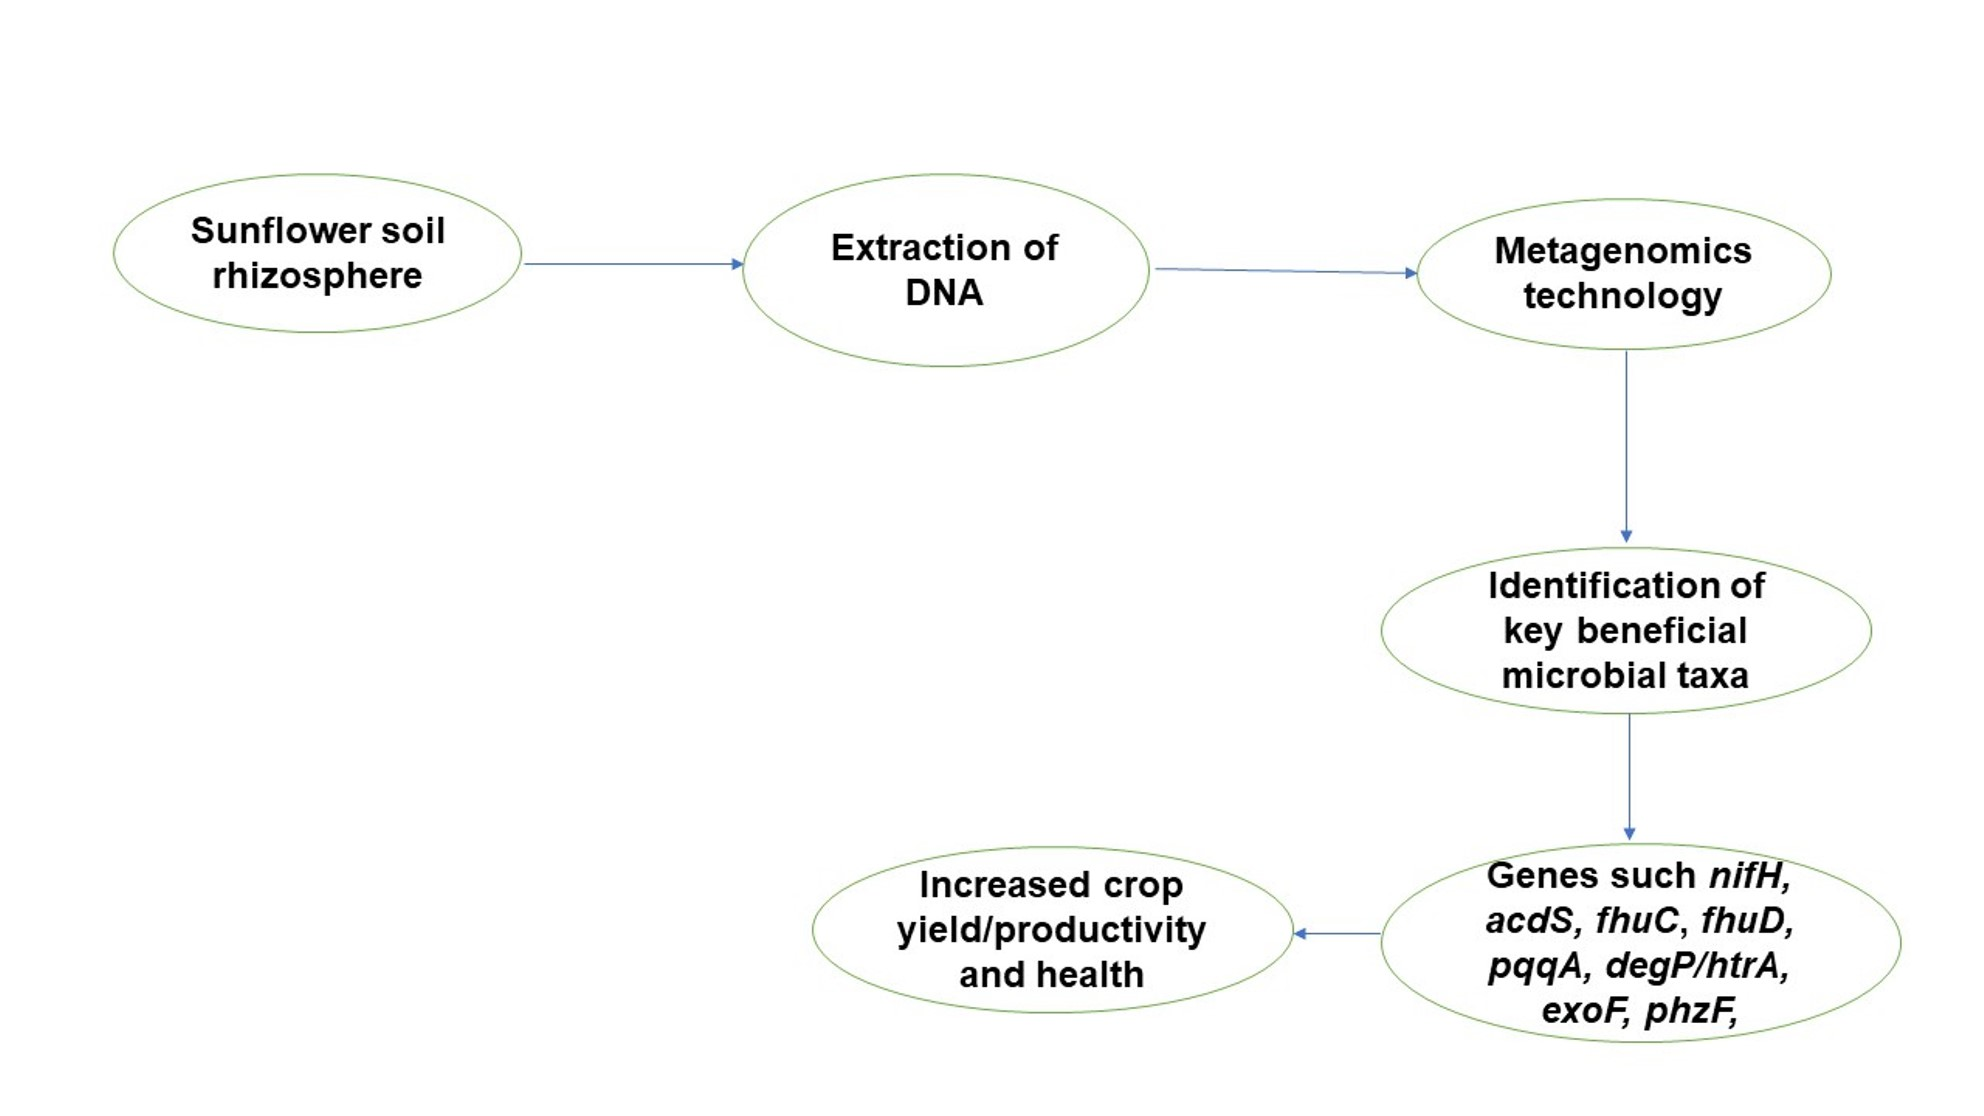
:The rhizosphere’s microbial communities consist of a diverse set of microorganisms that can be beneficial to plants. These beneficial microorganisms are key determinants of plant productivity and health. In this study, we used shotgun metagenomics to explore and characterize the microbiome of the sunflower rhizosphere and bulk soil. The rhizosphere shared features with the bulk soil with dominant phyla such as Actinobacteria, Proteobacteria, Acidobacteria, Bacteroidetes, Planctomycetes, and Verrucomicrobia. There was no significant difference in the alpha diversity of the sunflower rhizosphere and bulk soils, though diversity was lower in the rhizosphere, suggesting a selection of microorganisms by sunflower rhizosphere to the bulk soil community. The genes present in the rhizosphere with their corresponding proteins as observed in our study conferred potential plant-beneficial properties such as siderophore production, nitrogen fixation, phosphate solubilizing, 1-aminocyclopropane-1-carboxylate (ACC) deaminase. Furthermore, other genes such as exopolysaccharides-producing, high-temperature stress response, and heat and cold shock response genes, which help withstand environmental stresses were also identified more in the rhizosphere. Of note from our study is the gene phenazine biosynthesis protein, which confers biocontrol. With the current indiscriminate use of pesticides that are considered harmful to the ecosystem, these potential functional genes can be further exploited and used as a biotechnological application for sustainable agriculture.
1. Introduction
The rhizosphere microbiome, which includes the totality of microorganisms, their genomes, and interactions in the rhizosphere has been the focus of several studies in recent times. The microorganisms that inhabit the rhizosphere have numerous beneficial functions, which range from nutrient acquisition, stress tolerance, and protection against pathogens [1]. Soil is not just a single environment but consists of many environments that have distinct microbial communities. Distinct soil environments may range from a few micrometers to millimeters apart, and their microbial abundances, rate of microbial activity, abiotic characteristics, and composition of the microbial community may differ [2]. Soil microorganisms have the largest reservoir of biodiversity [3], and these microorganisms perform different activities, although these biological activities mostly take place in the rhizosphere, where there is communication between the plant roots and the microorganisms. Plants modify the rhizosphere directly through rhizodeposition and root exudates, leading to changes in the composition and function of the rhizosphere microbiome [3]. Plant species growing in particular environments can recruit significantly different microbial communities in both the endosphere and rhizosphere [4].
Plant-associated microorganisms affect the fitness and physiology of the host plant by altering nutrient availability to the plant, thereby improving plant resistance to biotic and abiotic stressors [5]. Microbial community activity, especially in the rhizosphere, is often connected to variation in the physical or chemical properties of the soil such as soil texture, pH, or changes in land use [6]. Biotic and abiotic factors determine the structure and composition of the soil microbiome. Thus, explaining the strong relationship between plant and microorganism using soil type, soil age, soil pH, and mineralogy [7]. In addition, plant location and plant species are determinants to which microorganisms can grow and thrive in the rhizosphere [8,9].
The microbiome can be explored because it has been postulated to be one of the key components of technological innovation to improve plant health and production [6]. Bacteria being the most dominant domain in the rhizosphere possess plant-growth-promoting-traits. Therefore, they have the potential of being used as a viable tool for sustainable agriculture [10].
Reports have shown that the genes that have been identified to have plant-beneficial attributes range from genes that confer plant-beneficial properties such as phl (phloroglucinol synthesis) [11] or nif (nitrogen fixation) [12] to genes involved in numerous indirect functions or secondary plant-beneficial ones like pqq (pyrroloquinoline quinone synthesis) [13]. Other plant-beneficial function-contributing genes that have been identified to enhance the growth of plants in the rhizosphere are ACC deaminase, auxin synthesis, hydrogen cyanide synthesis, phosphate solubilization, and 2,4-diacetylphloroglucinol synthesis genes [13,14].
Understanding the rhizosphere microbiome through the means of taxonomic, genomic, and functional components is important for sustainable crop production [15]. There has been a good level of success toward the characterization of the rhizosphere microbiome in some crop plants such as rice, soybean, corn, barley, and wheat by exploring the structure, functional genes, and factors that drive the microbiome assemblages [15].
We hypothesized that the rhizosphere microbiome would be more diverse than the bulk soil because of the activities that take place there and because the soil physicochemical parameters affect the microbial diversity and community structure. We also hypothesized that genes beneficial to plant growth would be higher in the rhizosphere than in the bulk soil due to plant selectivity. Previously, to determine the diversity, structural, and functional genes present in the rhizosphere, conventional approaches (culture-dependent methods) have been employed, but these come with biases and omit organisms and functional elements for analysis [16]. Therefore, in this study, we used shotgun metagenomics to determine the diversity, characterize the structure, and identify the plant-beneficial functional genes in sunflower rhizosphere soils, thereby enabling our ability to predict and harness microbiome dynamics and functionality by providing information about belowground effects on microbial communities in order to enhance crop productivity.
2. Materials and Methods
2.1. Soil Sampling and Analyses
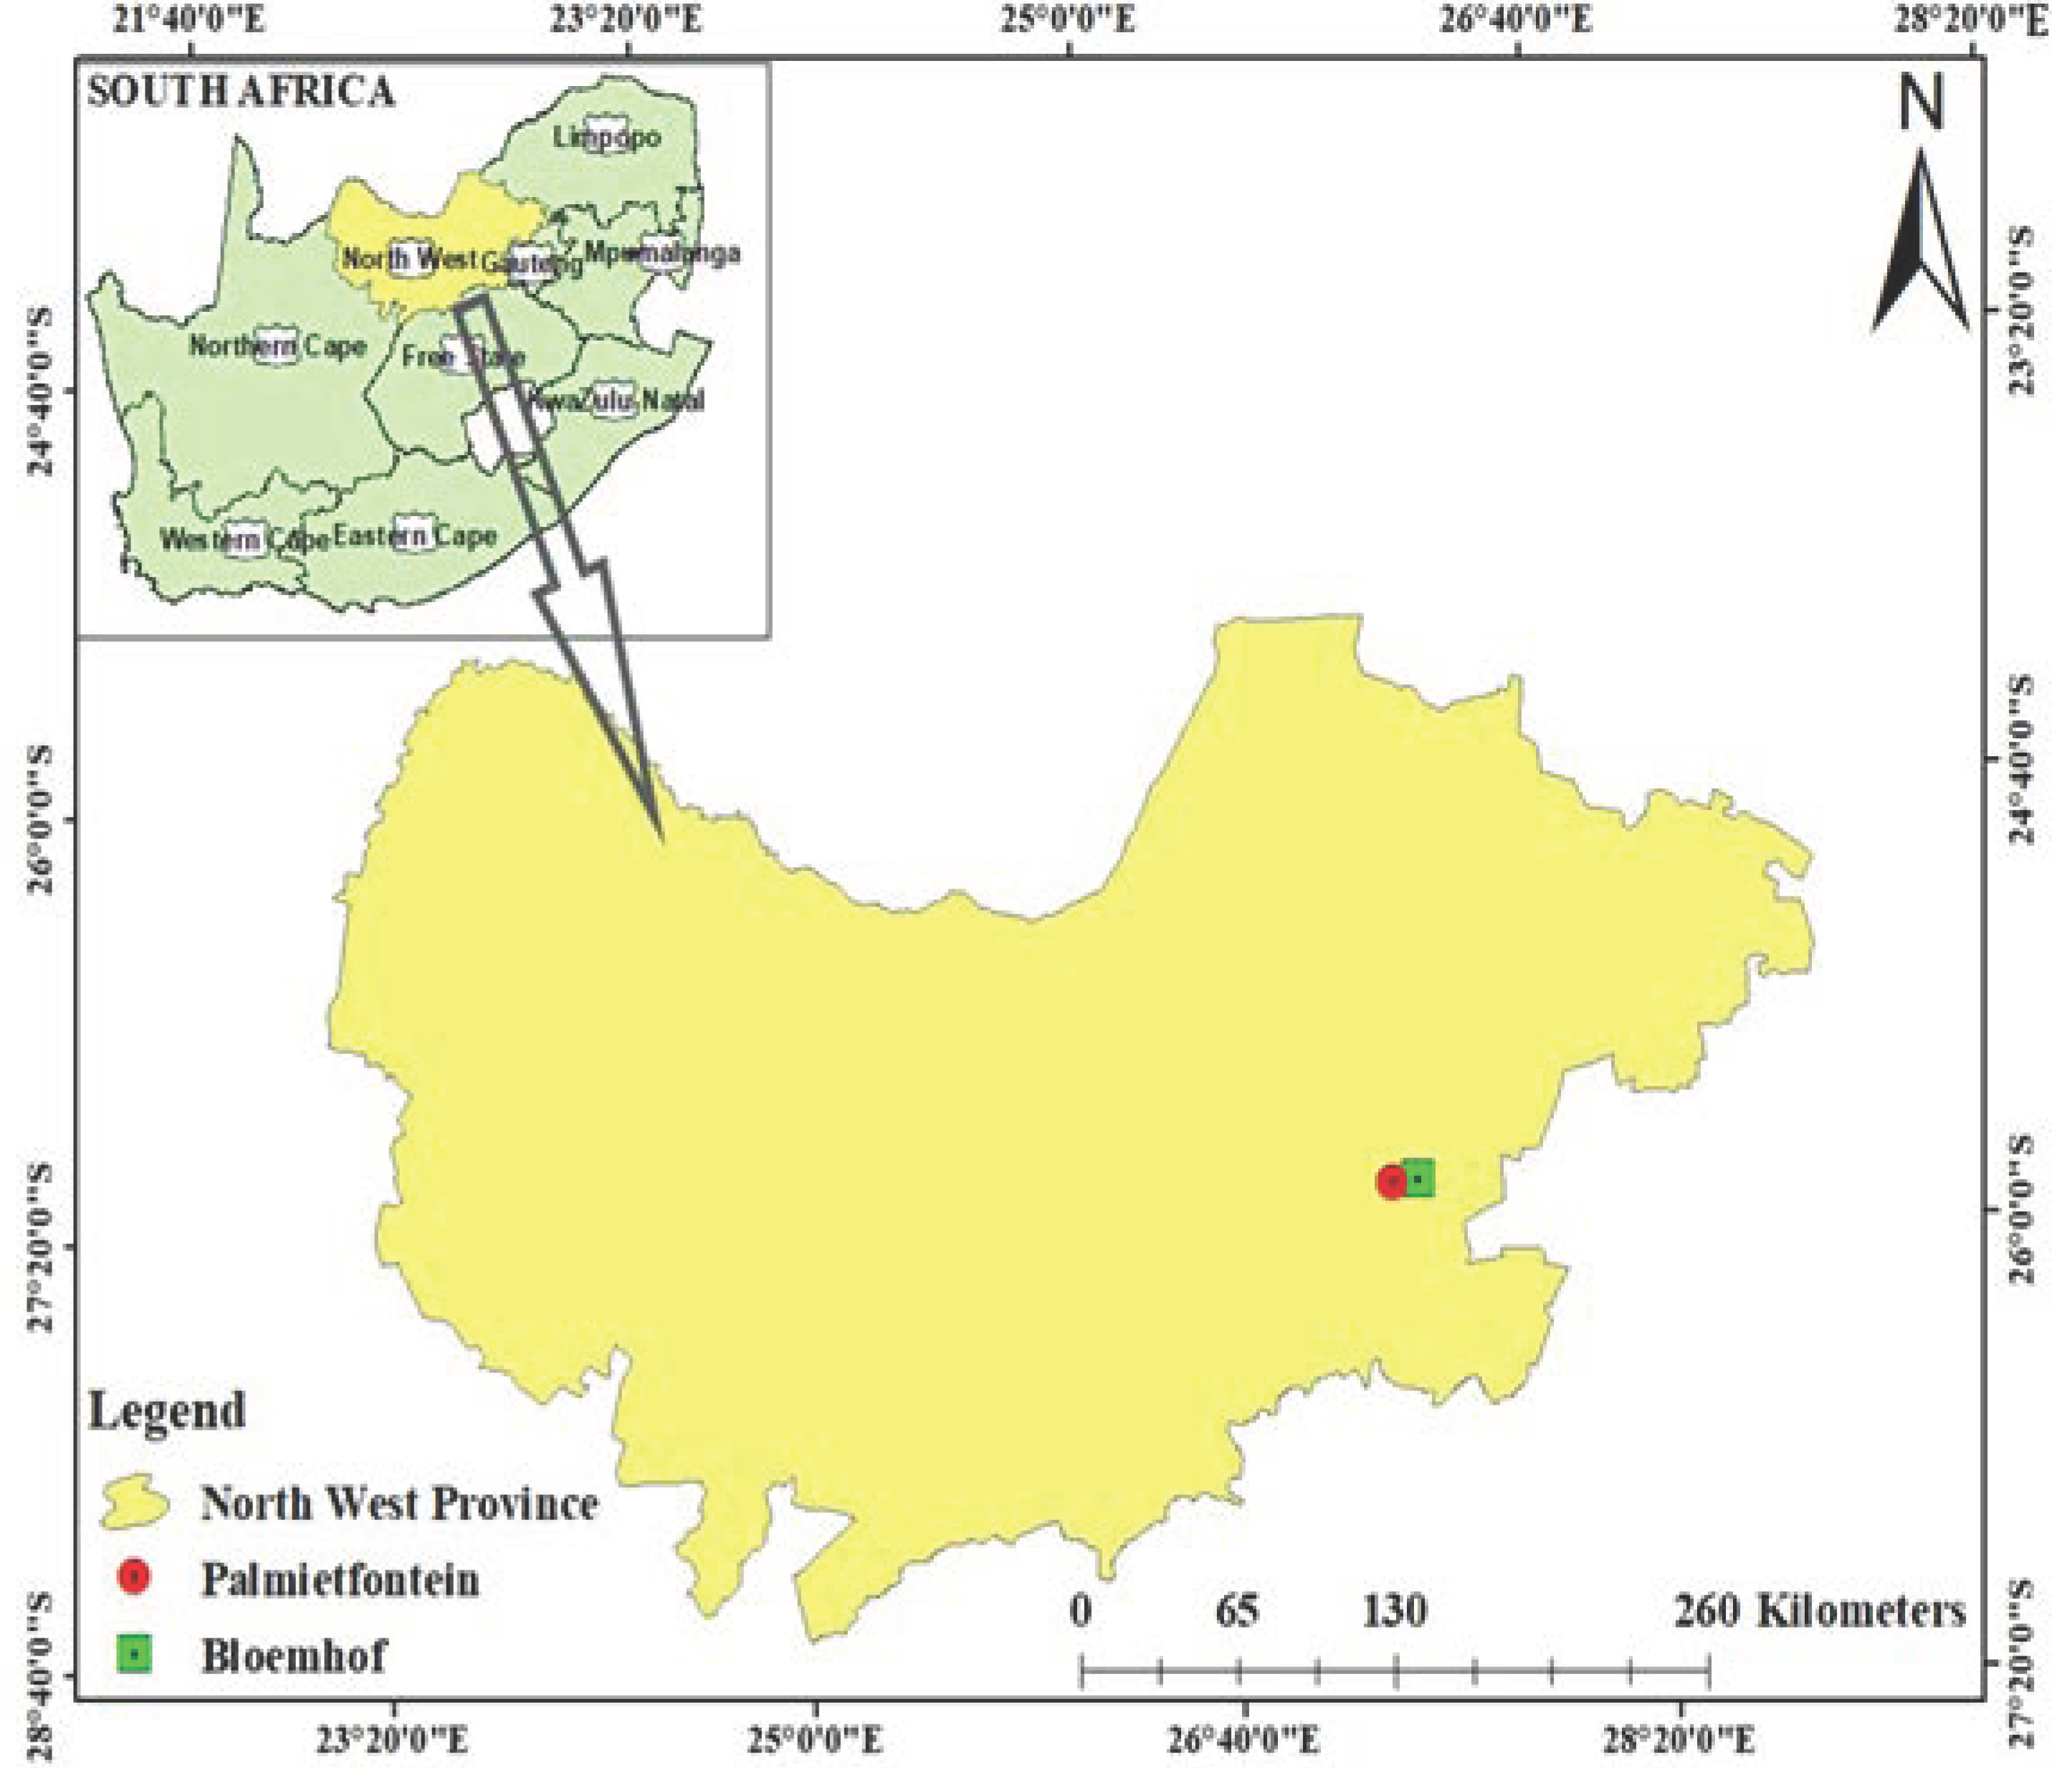
Rhizosphere soils, which were the soils firmly attached to the root and bulk soils, which were loose soils away from the plant [9], were collected from two sunflower fields in South Africa: Palmietfontein (26°19′39.94″ S: 26°52′52.57″ E) and Bloemhof (26°17′46.1″ S: 26°58′19.83″ E). Palmietfontein has an average rainfall of 200 mm and an average annual temperature of 22 °C, and the month of collection, June 2018, had an average temperature of 11 °C. Bloemhof has an average rainfall of 350 mm and an average annual temperature of 20 °C, and the temperature at the month of collection was 9.9 °C. Rhizosphere soil samples from Palmietfontein (R1) and Bloemhof (R2) and bulk soil samples from Palmietfontein (B1) and Bloemhof (B2) were collected in triplicate at 0–20 cm depth using 2 cm soil auger [17]. Samples were collected in sterile bags, after which they were placed in a cooler box and brought to the laboratory for analysis.
Phosphorus (P) was analyzed using the P Bray method, while total carbon (C) and nitrogen (N) were determined using a TruSpec elemental determinator [9]. pH meter using the ratio 1:2.5 (soil/water) was used to measure the soil pH according to Enagbonma et al. [18]. Organic matter (OM) content was measured using the Walkley–Black method. The soil moisture was determined by a procedure described by Cui et al. [19], while the hydrometer technique was used for the particle size analysis [20]. The particle size classes used to assign texture were those of the United States Department of Agriculture (USDA) for sand (0.5–2.0 mm), silt (0.002–0.05 mm), and clay (<0.002 mm). Organic carbon was analyzed using dichromate digestion [21]. Potassium (K) and calcium (Ca) were analyzed by methods described by Deke et al. [22].
2.2. DNA Extraction from Soil Samples, Sample Preparation, and Sequencing
Total genomic DNA was extracted from each soil sample using PowerSoil® isolation kit (MO Bio labs, Carlsbad, CA, USA), following the manufacturer’s user guide. DNA concentration and purity were determined using a NanoDrop Lite Spectrophotometer (Thermo Fischer Scientific, Carlsbad, CA, USA). Extracted DNA was sent for Metagenome Shotgun Sequencing at the Molecular Research Laboratory (www.mrdnalab.com) Texas. Qubit® dsDNA HS Assay Kit (Life Technologies) was used to determine the concentration of DNA.
Library preparation was done using the Nextera DNA Flex library preparation kit (Illumina) according to the manufacturer’s guidelines. In brief, 50 ng of DNA from each sample was used for library preparation. After DNA fragmentation, Illumina sequencing adapters were added and products were amplified using 6 cycles of PCR, during which unique indices were added to each sample. After library amplification, their concentration was estimated using the Qubit® dsDNA HS Assay Kit (Life Technologies), while average library fragment size was measured using the Agilent 2100 Bioanalyzer (Agilent Technologies). Libraries were then pooled in equimolar ratios of 0.7 nM and sequenced paired-end for 300 cycles using the NovaSeq 6000 platform (Illumina).
2.3. Data Processing and Statistical Analysis
The online metagenomics rapid annotation server MG-RAST (www.mg-rast.org, accessed on 11 July 2019) was used for the quality control of the raw shotgun metagenomic sequences [23]. Low-quality sequences were removed using a modified DynamicTrim (where sequences with >5 ambiguous base pairs with 15 phred score cutoff were removed) and a length filtering (where sequences with a length of >2 standard deviations from the mean were removed) according to Cox et al. [24]. Artificial replication reads that occurred during sequencing were removed [25]. After performing quality control (QC), the BLAT (the BLAST-like alignment tool) algorithm was used to annotate the sequences [26] against the M5NR database [27], which encompasses nonredundant integration of many databases. The microbial community groupings were identified using the SEED subsystem. An e-valve of 5, with a maximum identity of 60%, maximum alignment length of 15 base pairs, and maximum abundance of 1 were used when mapped against the subsystems database that integrated SILVA, Greengenes, and RDP (ribosomal database project) databases [28]. The relative abundance of the four samples was determined and used for statistical analysis.
After the dataset for each of three replicates of the rhizosphere and bulk soil samples of the two locations was normalized by finding the average and relative abundance, one-way analysis of variance (ANOVA) was used to determine if there was a significant difference in rhizosphere and bulk soil samples, and Tukey’s pairwise comparison was used for the means at a significant level (p value < 0.05). The diversity indices (alpha and beta diversity) of the structural and beneficial functional genes were also determined. The analysis of similarity (ANOSIM) with 999 random permutations was employed to test for significance for beta diversity. These analyses were done using the PAST software version 2.17c [29]. The distribution of microbial communities’ diversity and structure between the sunflower rhizosphere and the bulk soil was ascertained using principal component analysis (PCA) based on a Bray-Curtis dissimilarity matrix. Likewise, principal coordinates analysis (PCoA) based on Bray Curtis dissimilarity matrix was used to visualize the beta diversity of the structural and functional genes diversity from both rhizosphere and bulk soil habitats.
To determine the environmental variable that best shaped the structures of the microbiome, canonical correspondence analysis (CCA) was performed based on a forward selection of environmental variables, and the Monte Carlo permutation test, with 999 random permutations, was employed to test for significance. The relative abundance of the plant-beneficial functional gene was plotted using circos (http://circos.ca/, accessed on 26 June 2020), while CANOCO 5 (Microcomputer Power, Ithaca, NY, USA) was used to view the PCA and PcoA. The raw sequence has been deposited into the GenBank database, where the SRA (sequence read archive) accession number for R1 is SRR10426233, R2 SRR10418054, while B1 and B2 have accession numbers of SRR10426310 and SRR10418081, respectively.
3. Results
3.1. Physicochemical Characteristics of the Soil
The geographical map of the sample location is shown in Figure 1. The pH is in the range of 5.78–6.6, which is slightly acidic to nearly neutral. The range of the particle size was 72–84% for sand, 0–6% for silt, and 16–24% for clay. Calcium ranged between 246 and 536 mg kg−1, with R1 having the highest and R2 having the lowest. The physical and chemical properties of the soils showed that phosphorus (P) in R2 was predominantly higher than R1, B1, and B2. Potassium (K) measures ranged between 220 and 349 mg/kg. Organic C ranged between 0.29 and 1.77%, with R1 having the highest. The total N of our samples was very low (0.047–0.134%), while R1 has the highest for total C with 1.60%, which ranged between 0.505 and 1.60% for the rhizosphere and bulk soils. The parameters such as organic C, OM, total C, total N, P3−, Ca2+, and K+ were significantly different between the two locations; likewise, there was a significant difference in the rhizosphere and bulk soil samples. Thus, our two locations were different based on the physicochemical parameters (Table 1).
3.2. Genomic Overview of Metagenomic Sequences
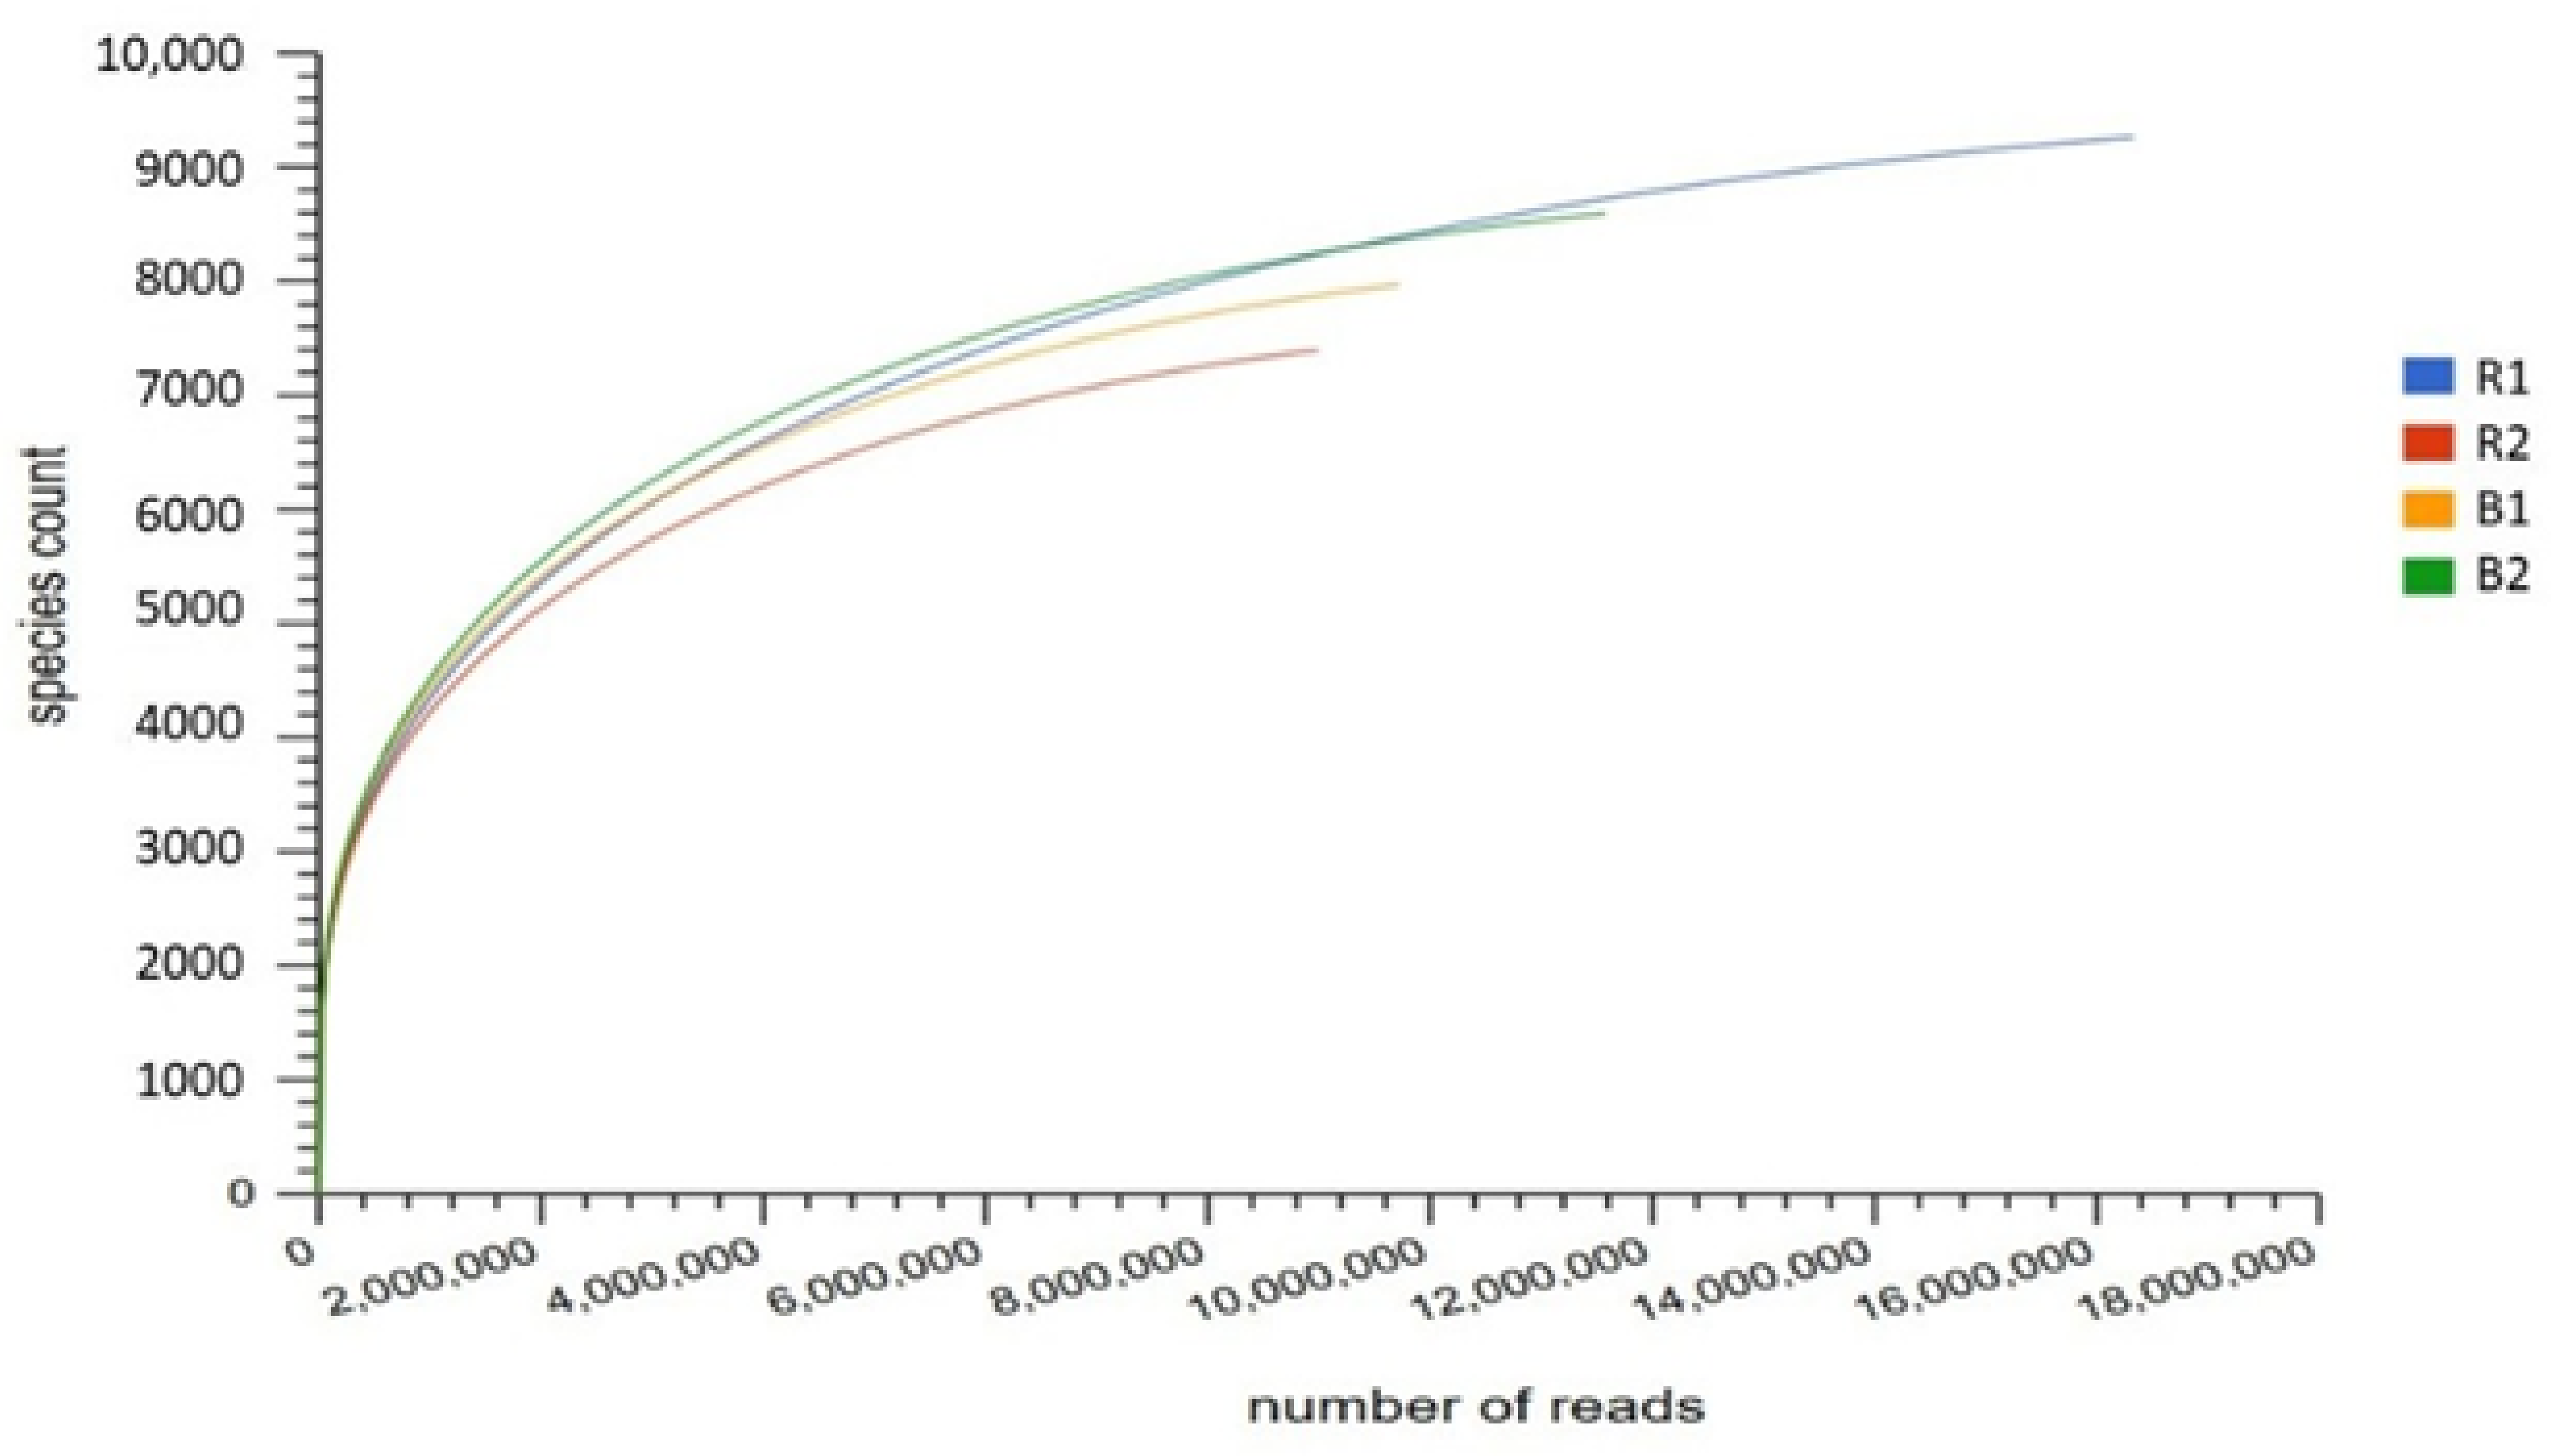
After undergoing quality control, the average sample reads for the four soil samples showed are 10,000, 7000, 8000, and 9000 species count in the R1, R2, B1, and B2 microbiomes, respectively (Figure 2). R1 location had the highest species count when compared to R2 location, indicating that there is more variation of species in R1.
The DNA sequencing from the four soil samples (R1, R2, B1, B2) using Illumina technology resulted in a bp count for R1 of 2,388,568,202 bp, sequence count of 13,736,515, mean square length of 174 bp, and mean GC (guanine-cytosine) percentahe of 66. R2 had a bp count of 1,390,678,255, sequence count of 7,559,132, mean square length of 184, and Guanine Cytosine (GC) content of 67. B1 and B2 had bp counts of 1,551,871,377 bp and 1,789,010,308 bp, respectively; sequence count of 8,282,394 and 9,753,315; mean sequence length of 187 bp and 183 bp; and GC content of 66% and 65%, respectively. The metagenomes of R1, R2, B1, and B2 comprised predicted protein features of 12,015,321, 6,253,966, 7,408,001, and 8,657,907, respectively while possessing identified protein features of 4,985,022, 2,953,873, 3,160,887, and 3,688,032, respectively, for metagenomes R1, R2, B1, and B2.
3.3. Taxonomy Diversity and Community Structure
In the R1 sample, bacteria accounted for 98.82% of the obtained sequences, followed by eukaryota, which accounted for 0.81%, and archaea was 0.29%. Of R2 sequences, 98.47% belonged to bacteria, 1.23% to eukaryota, and 0.2% to archaea. Sequences in bulk soil samples were assigned to bacteria at 98.61% and 98.53%, eukaryotes at 0.82% and 1.05%, and archaea at 0.48% and 0.34% in B1 and B2 samples, respectively, but there was no significant difference (p > 0.05) across the two locations. The statistical value for the soil compartment (R1, B1 and R2, B2) is more than 0.05; hence, there was no significant difference. The small percentage of sequences unaccounted for in each sample were from viruses or unclassified.
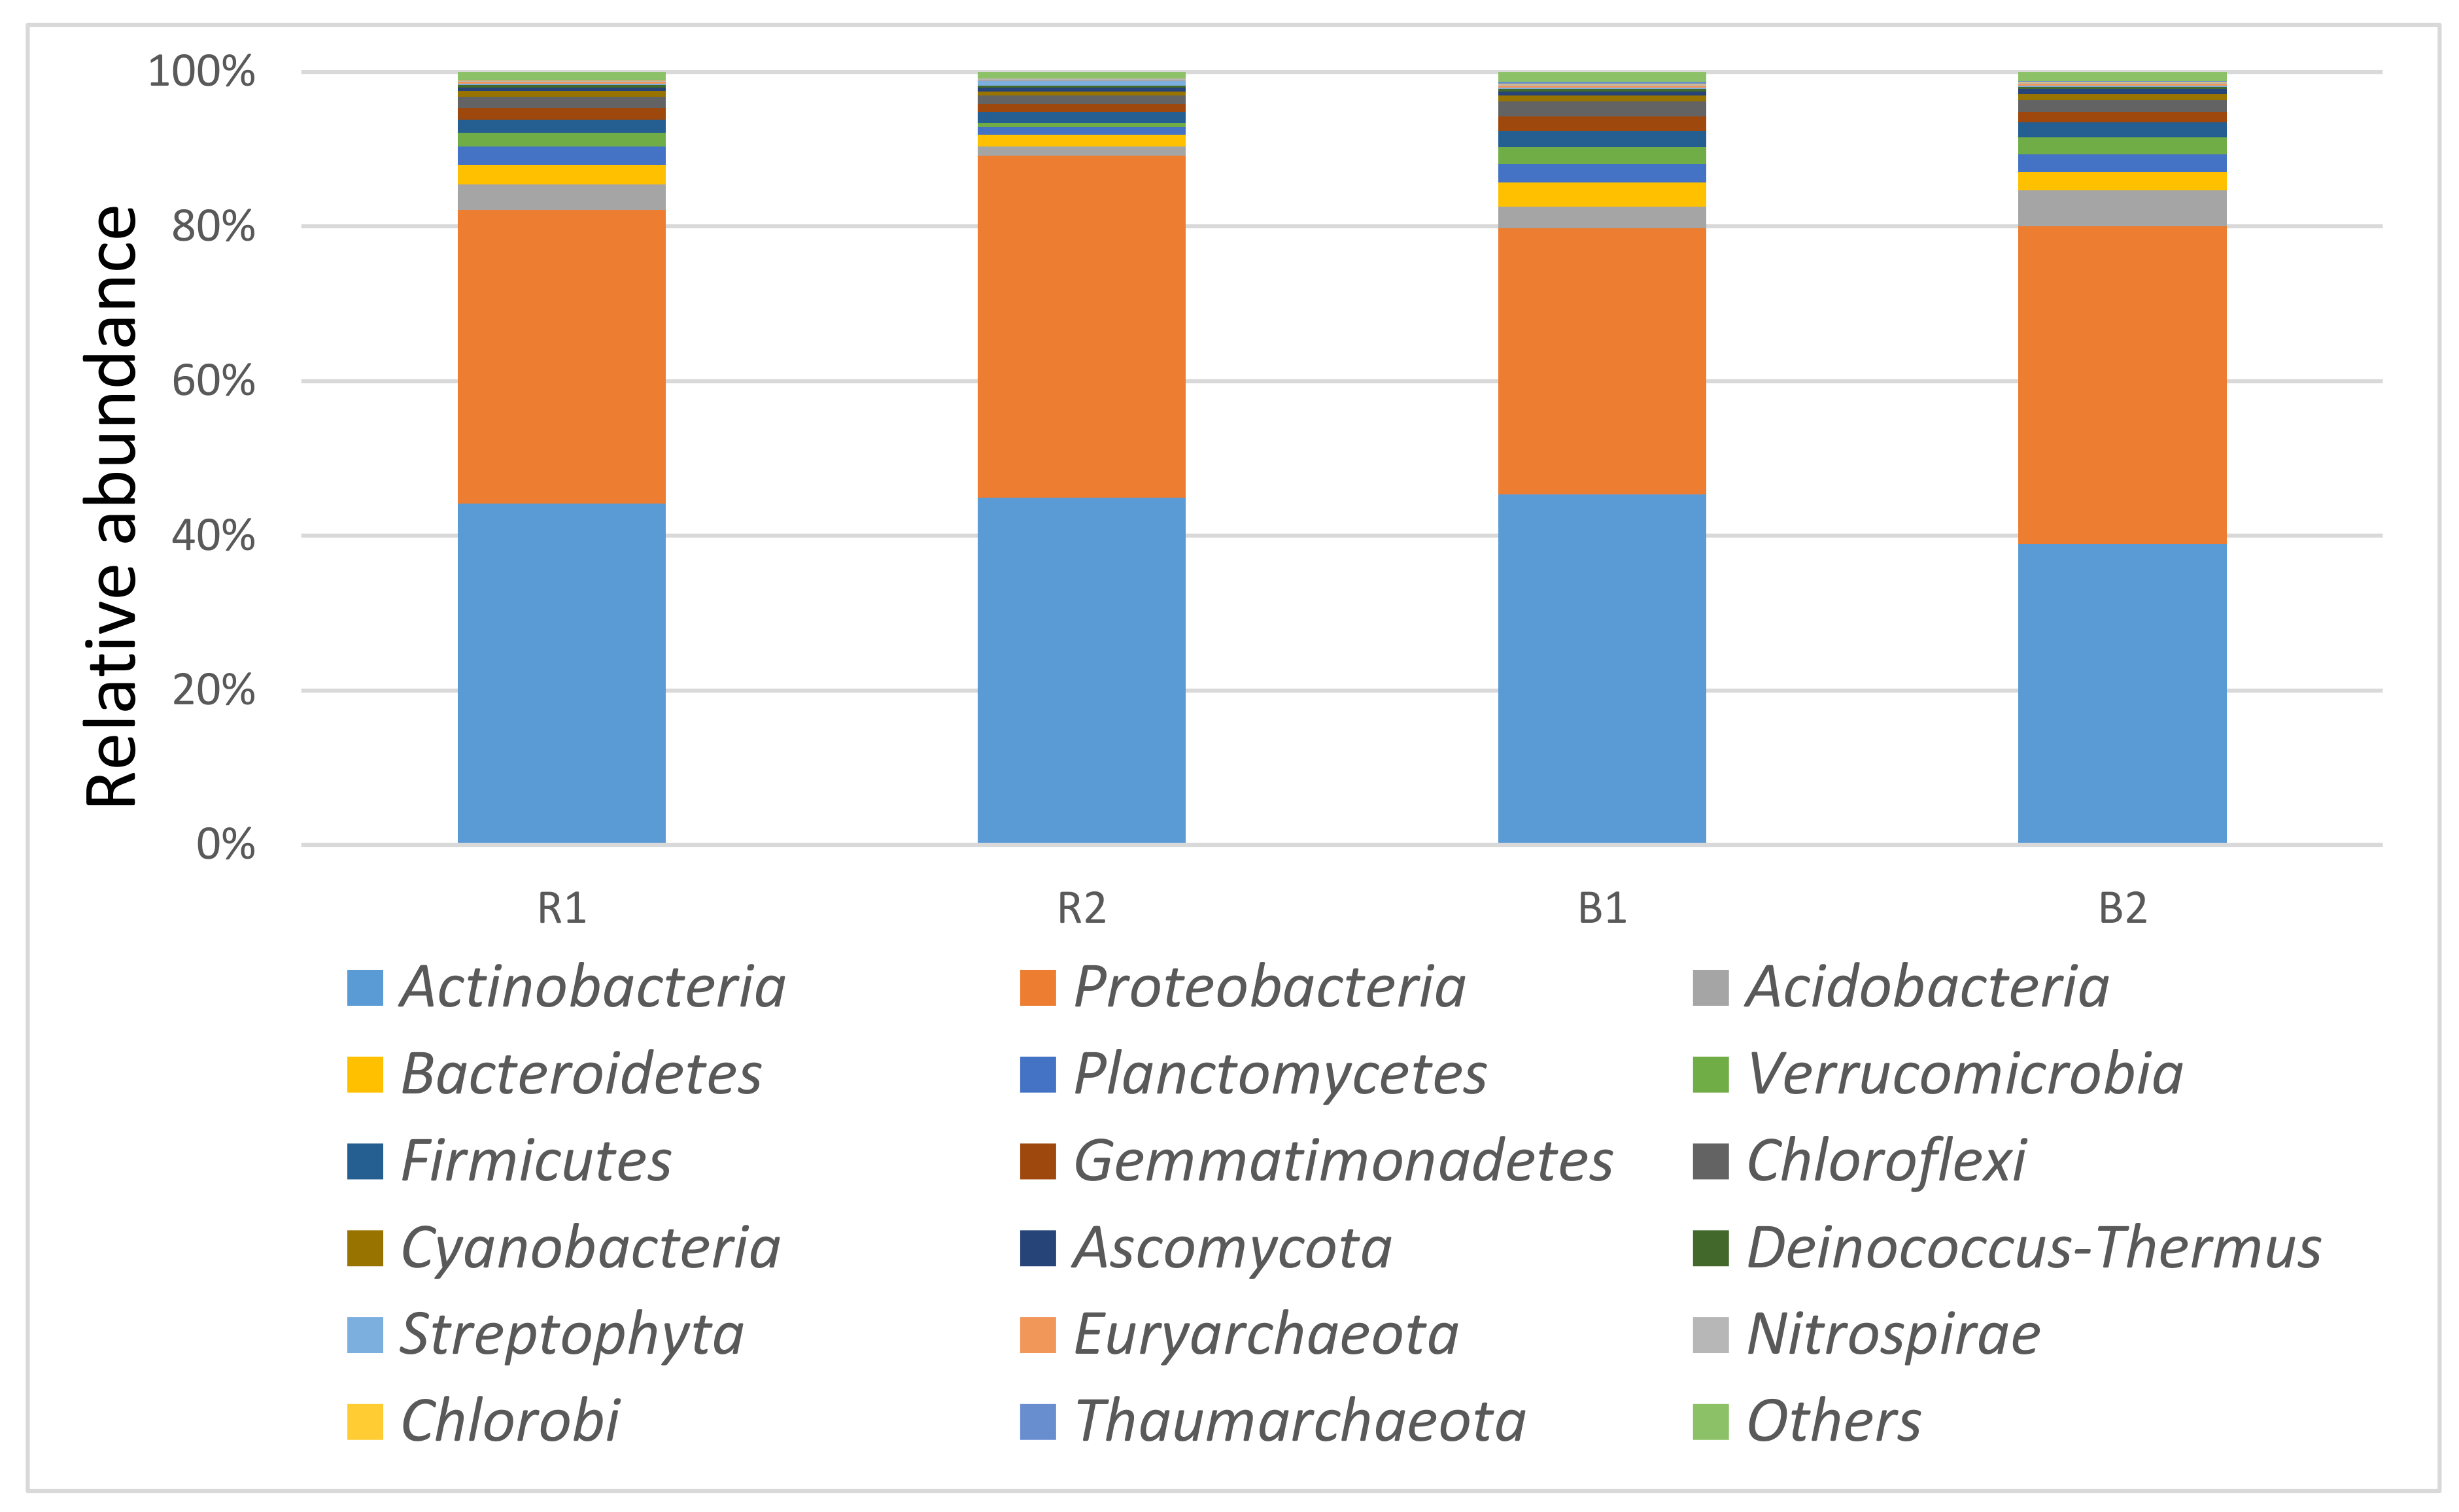
The most dominant phylum was the Actinobacteria, accounting for 44.19% and 45.37% for R1 and B1 respectively, while Proteobacteria represented 37.99% and 34.43% of the total. Acidobacteria, Bacteroidetes, and Planctomycetes had a relative abundance of 3.32%, 2.48%, and 2.42% for R1 and 2.76%, 3.19%, and 2.34% for B1, respectively (Figure 3). For sample R2, the most dominant phyla were Actinobacteria 44.96%, Proteobacteria 44.17%, Bacteroidetes 1.58%, and Firmicutes 1.39%, while B2 had Proteobacteria, Actinobacteria, Acidobacteria, and Bacteroidetes as the dominant phyla with relative abundance of 41.05%, 38.95%, 4.67%, and 2.42%, respectively. There was no significant difference (p > 0.05) in the phylum domain between the locations R1, B1 and R2, B2. In addition, there was no significant difference in the phylum domain of the rhizosphere and the bulk soil samples.
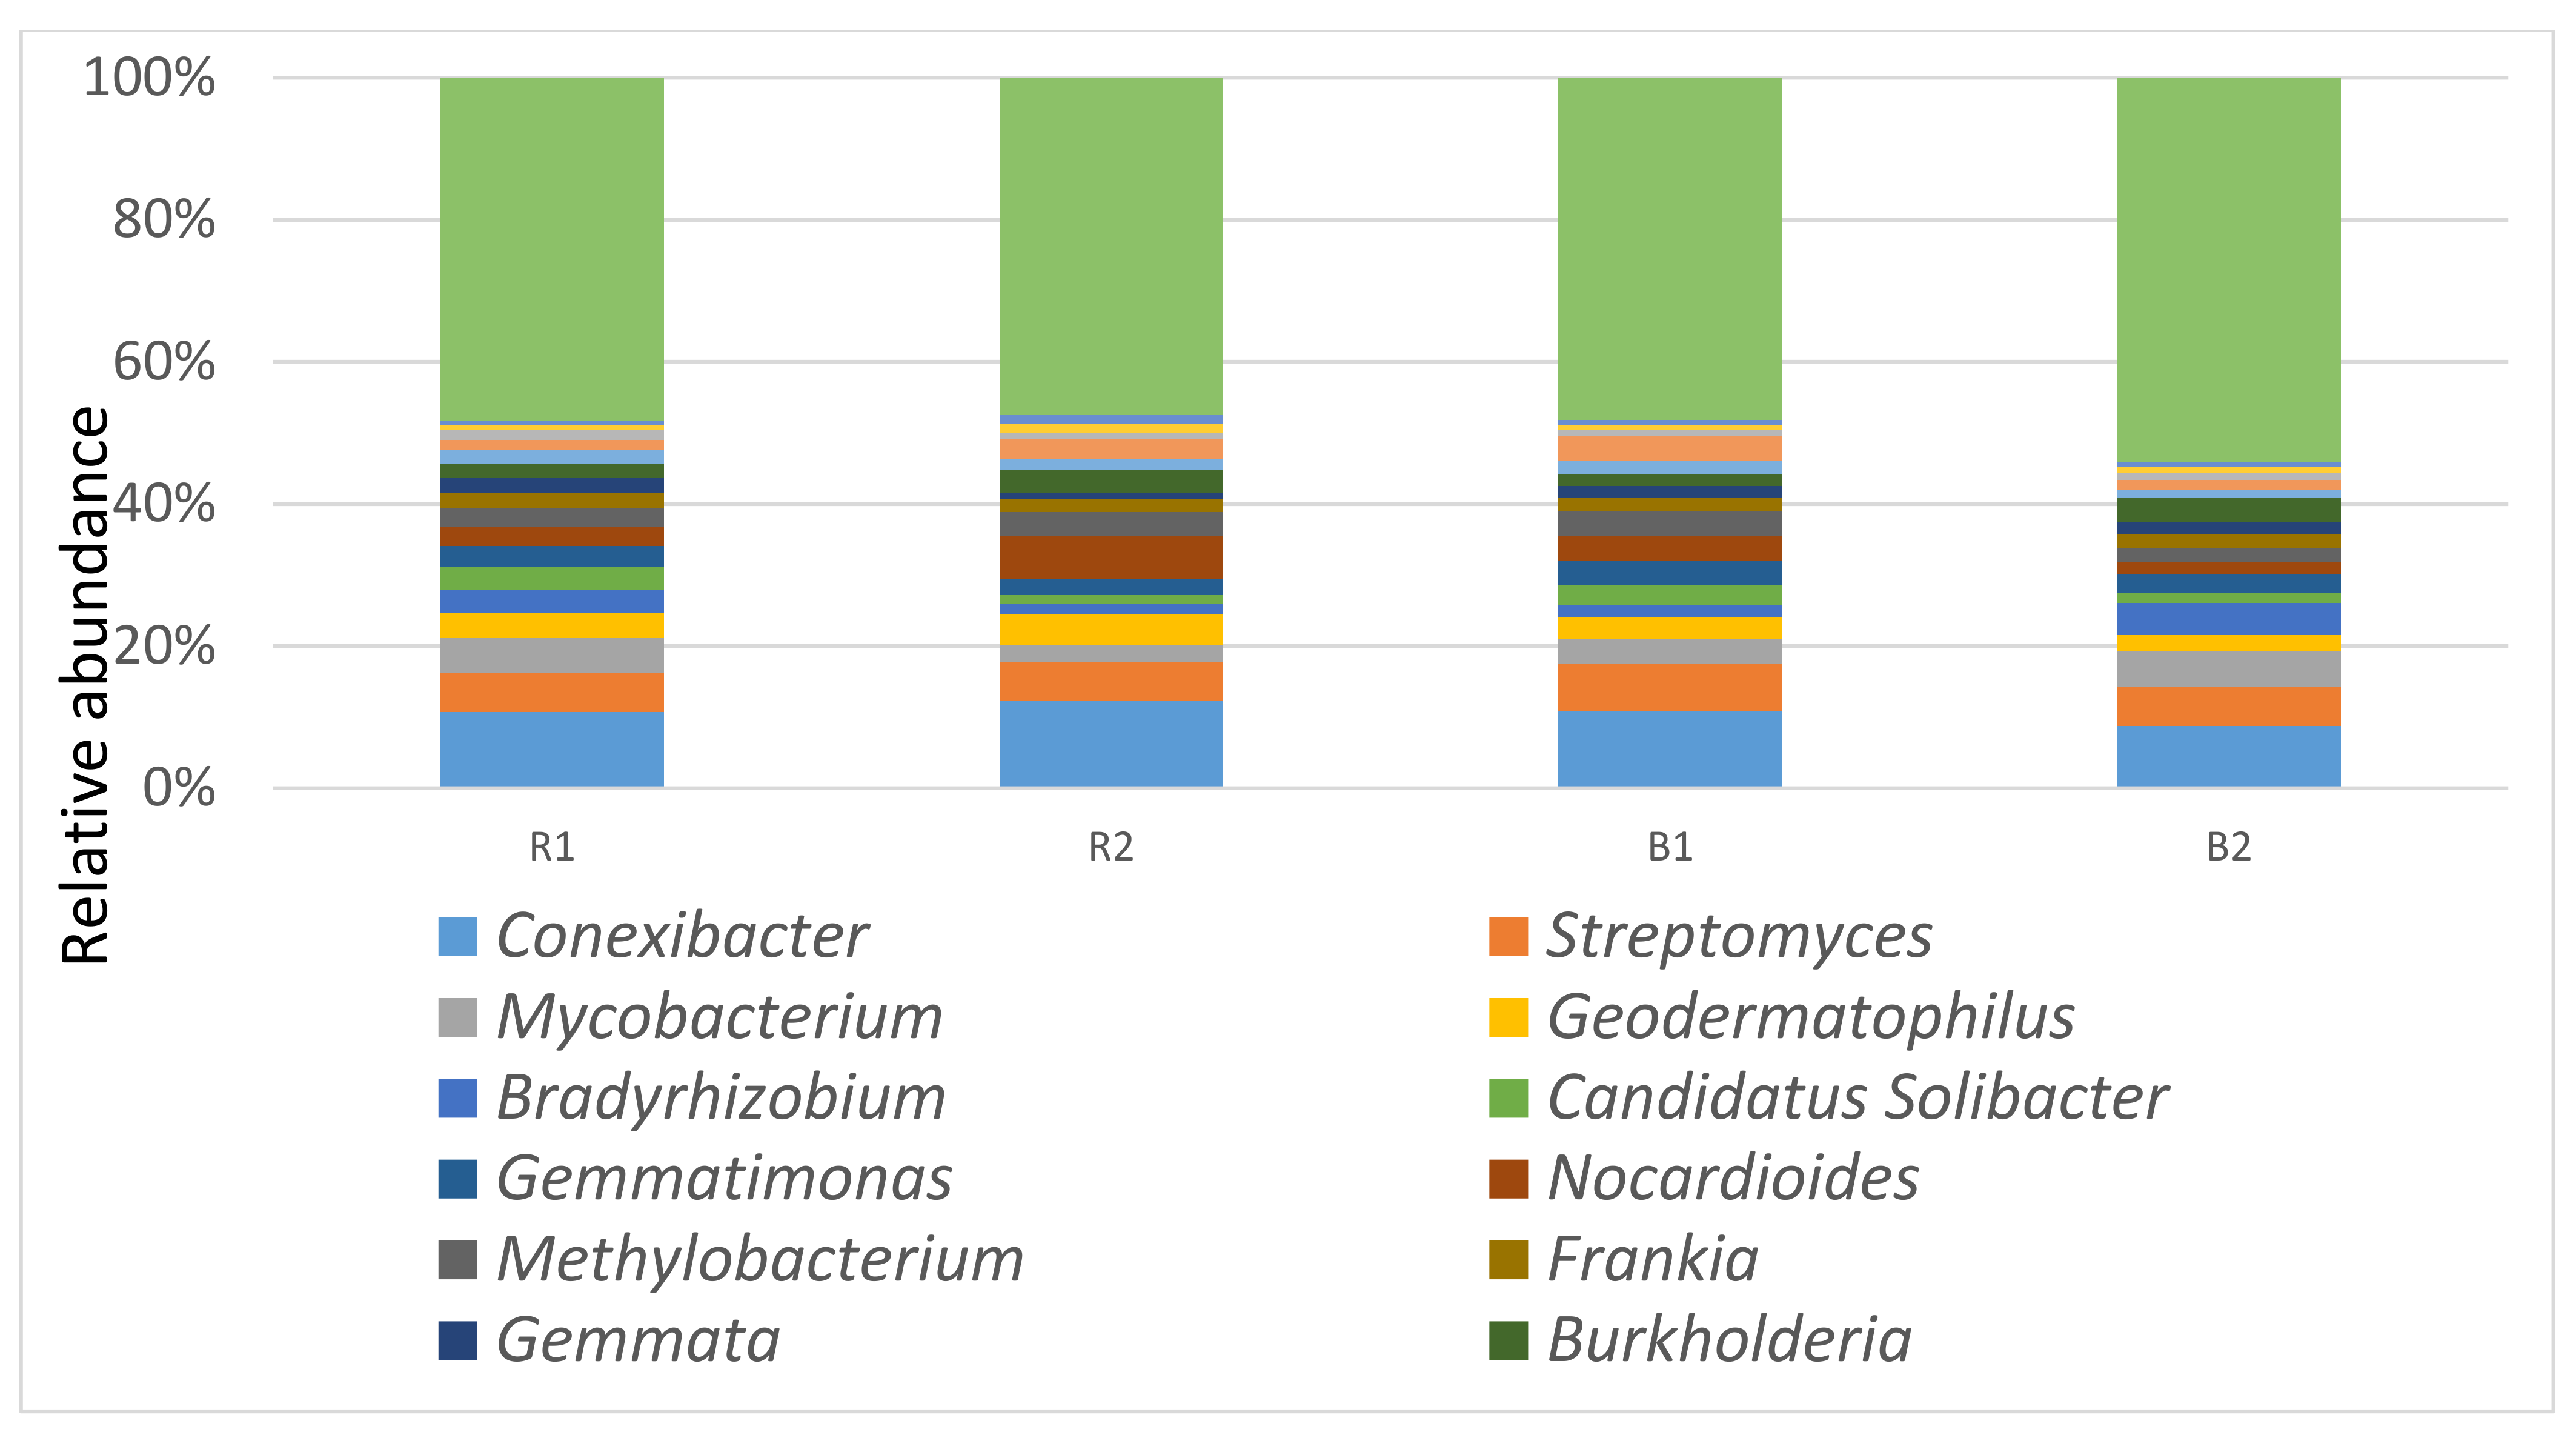
At the genus level, there was no significant difference (p > 0.05) between the rhizosphere and the bulk soil samples, nor between the locations. The dominant genera for R1 are Conexibacter 15%, Streptomyces 8%, Mycobacterium 7%, and Geodermatophilus 5%, respectively, while for the R2 habitat, Conexibacter, Nocardioides, and Streptomyces accounted for 17%, 8%, and 7% of the metagenomic sequence, respectively. Conexibacter 15%, Streptomyces 10%, Arthrobacter 5%, and Nocardioides 5% dominated the B1 habitat, while B2 had Conexibacter 12%, Streptomyces 8%, and Mycobacterium 7% as the dominant genera (Figure 4).
3.4. Microbial Community Diversity Richness and Evenness of Sunflower Rhizosphere R1, R2, and Bulk Soils B1, B2 Examined
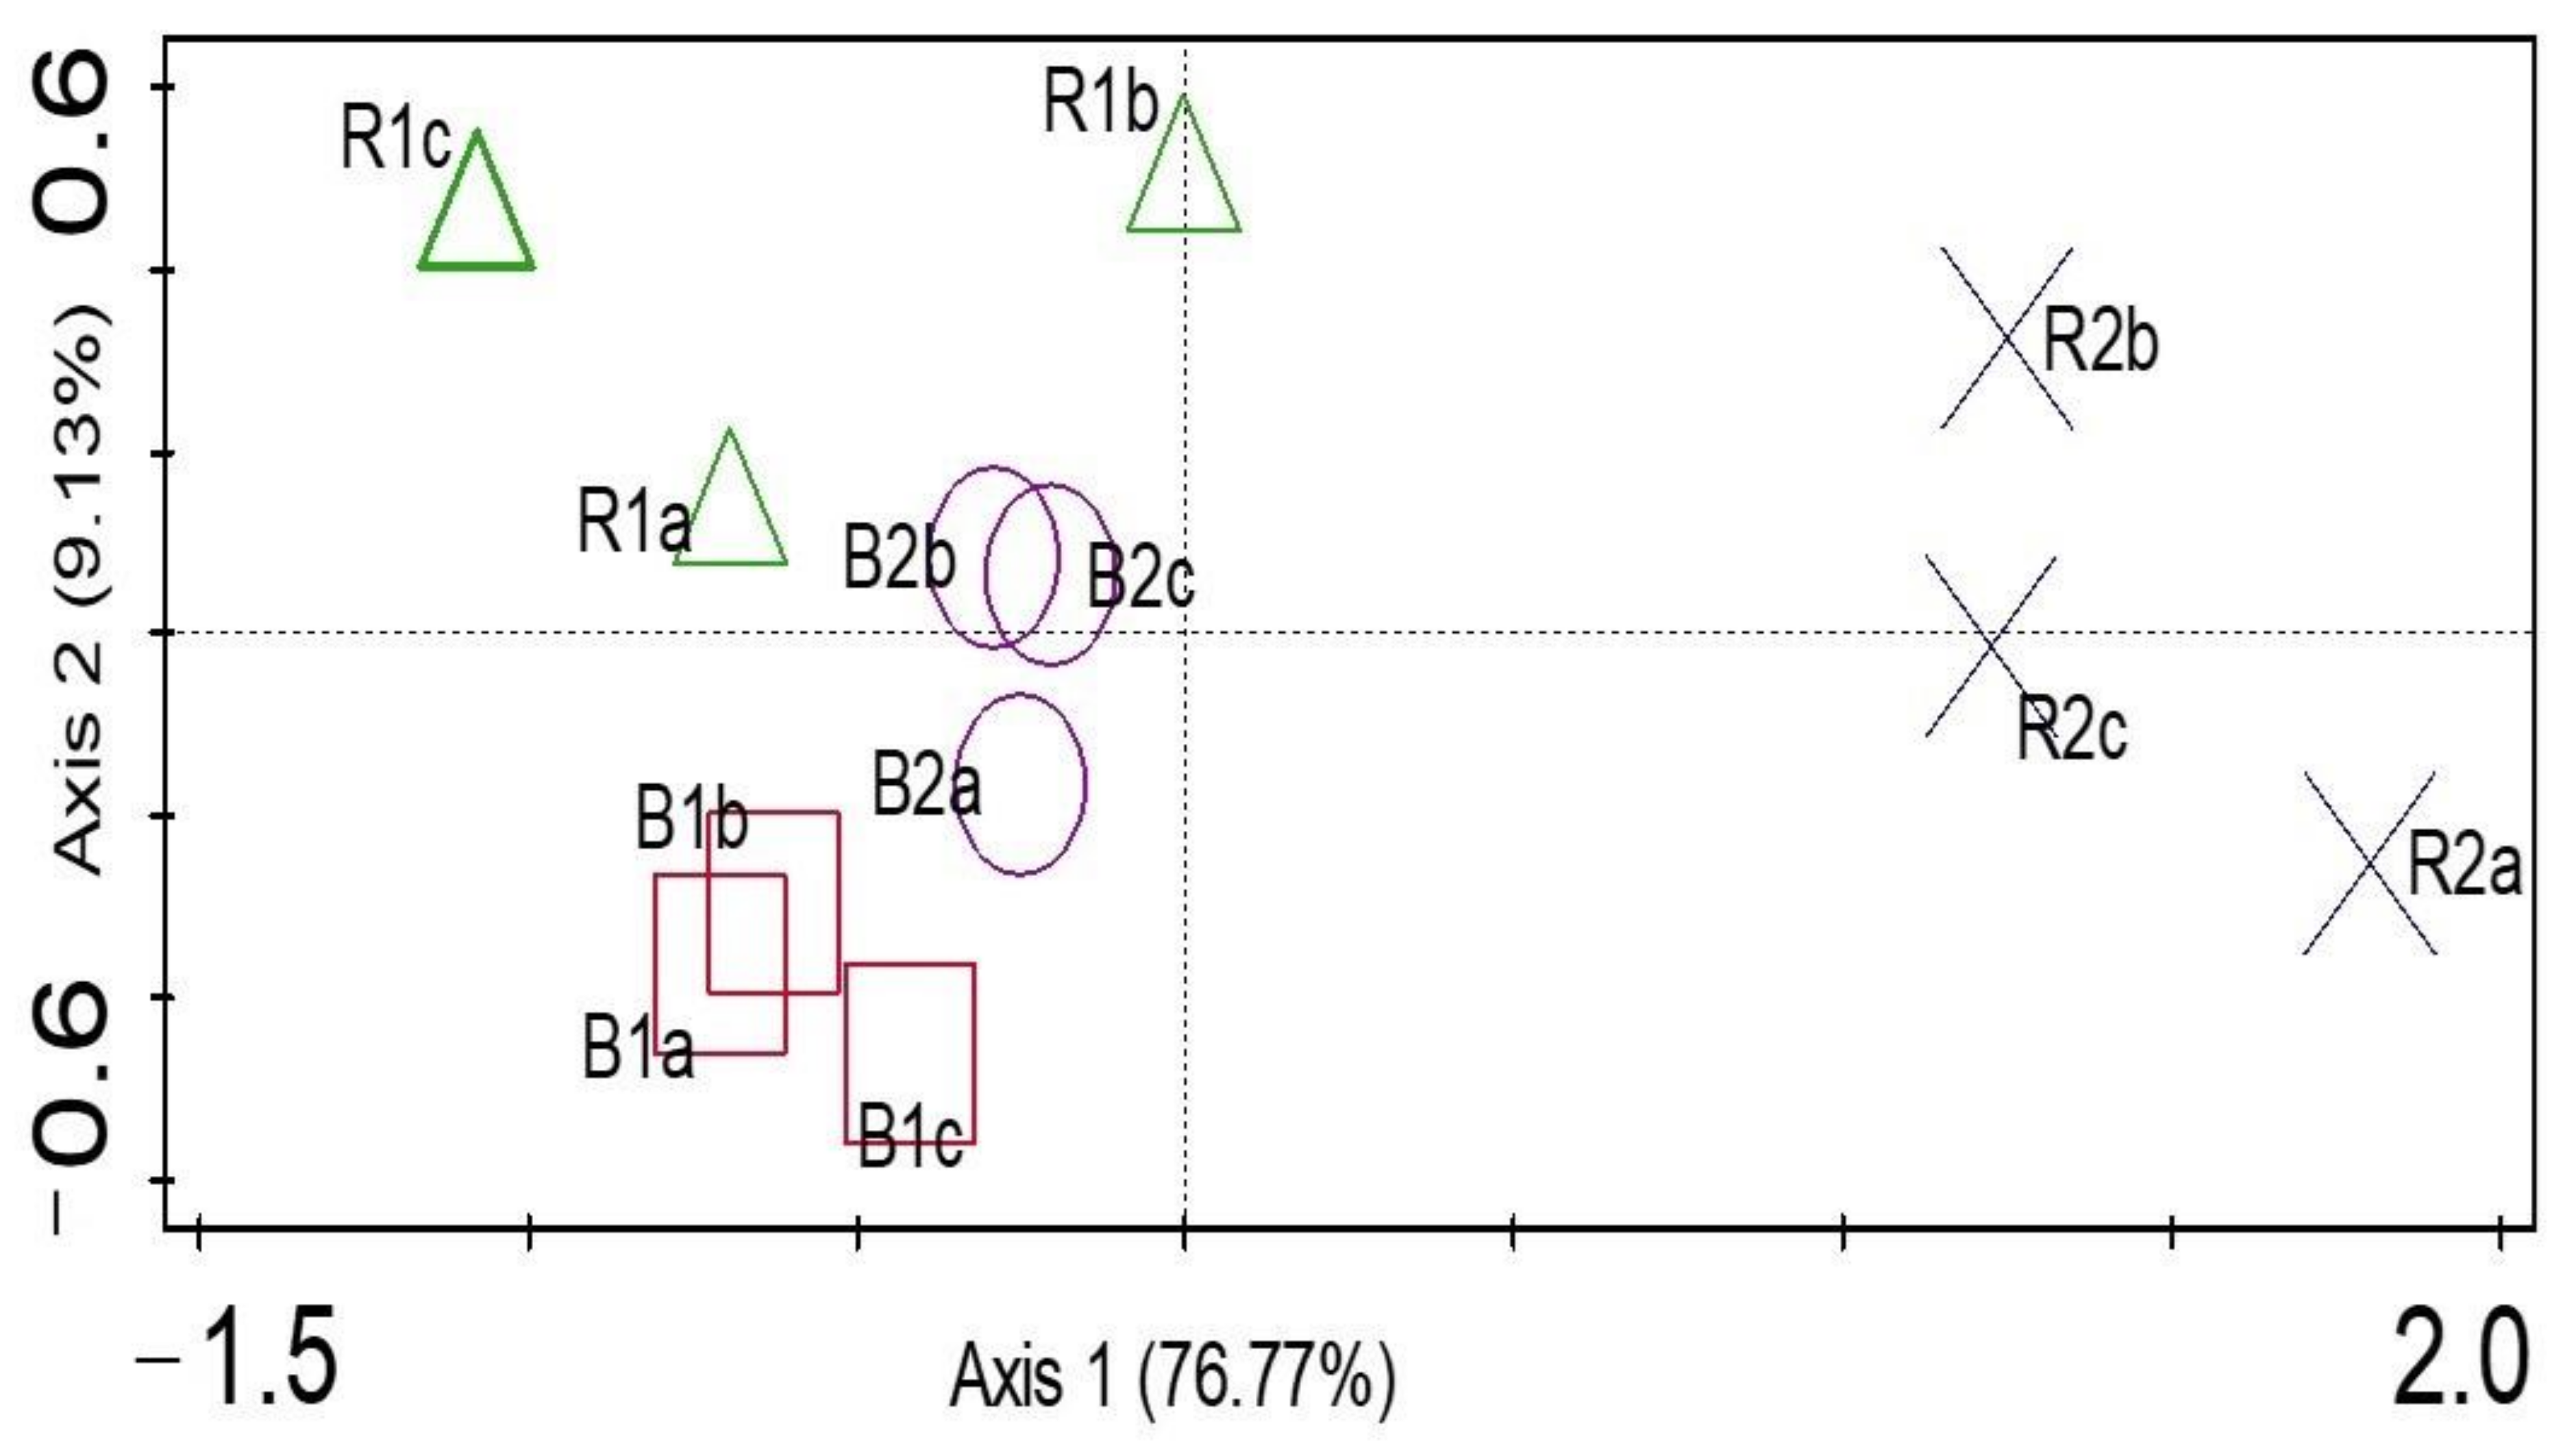
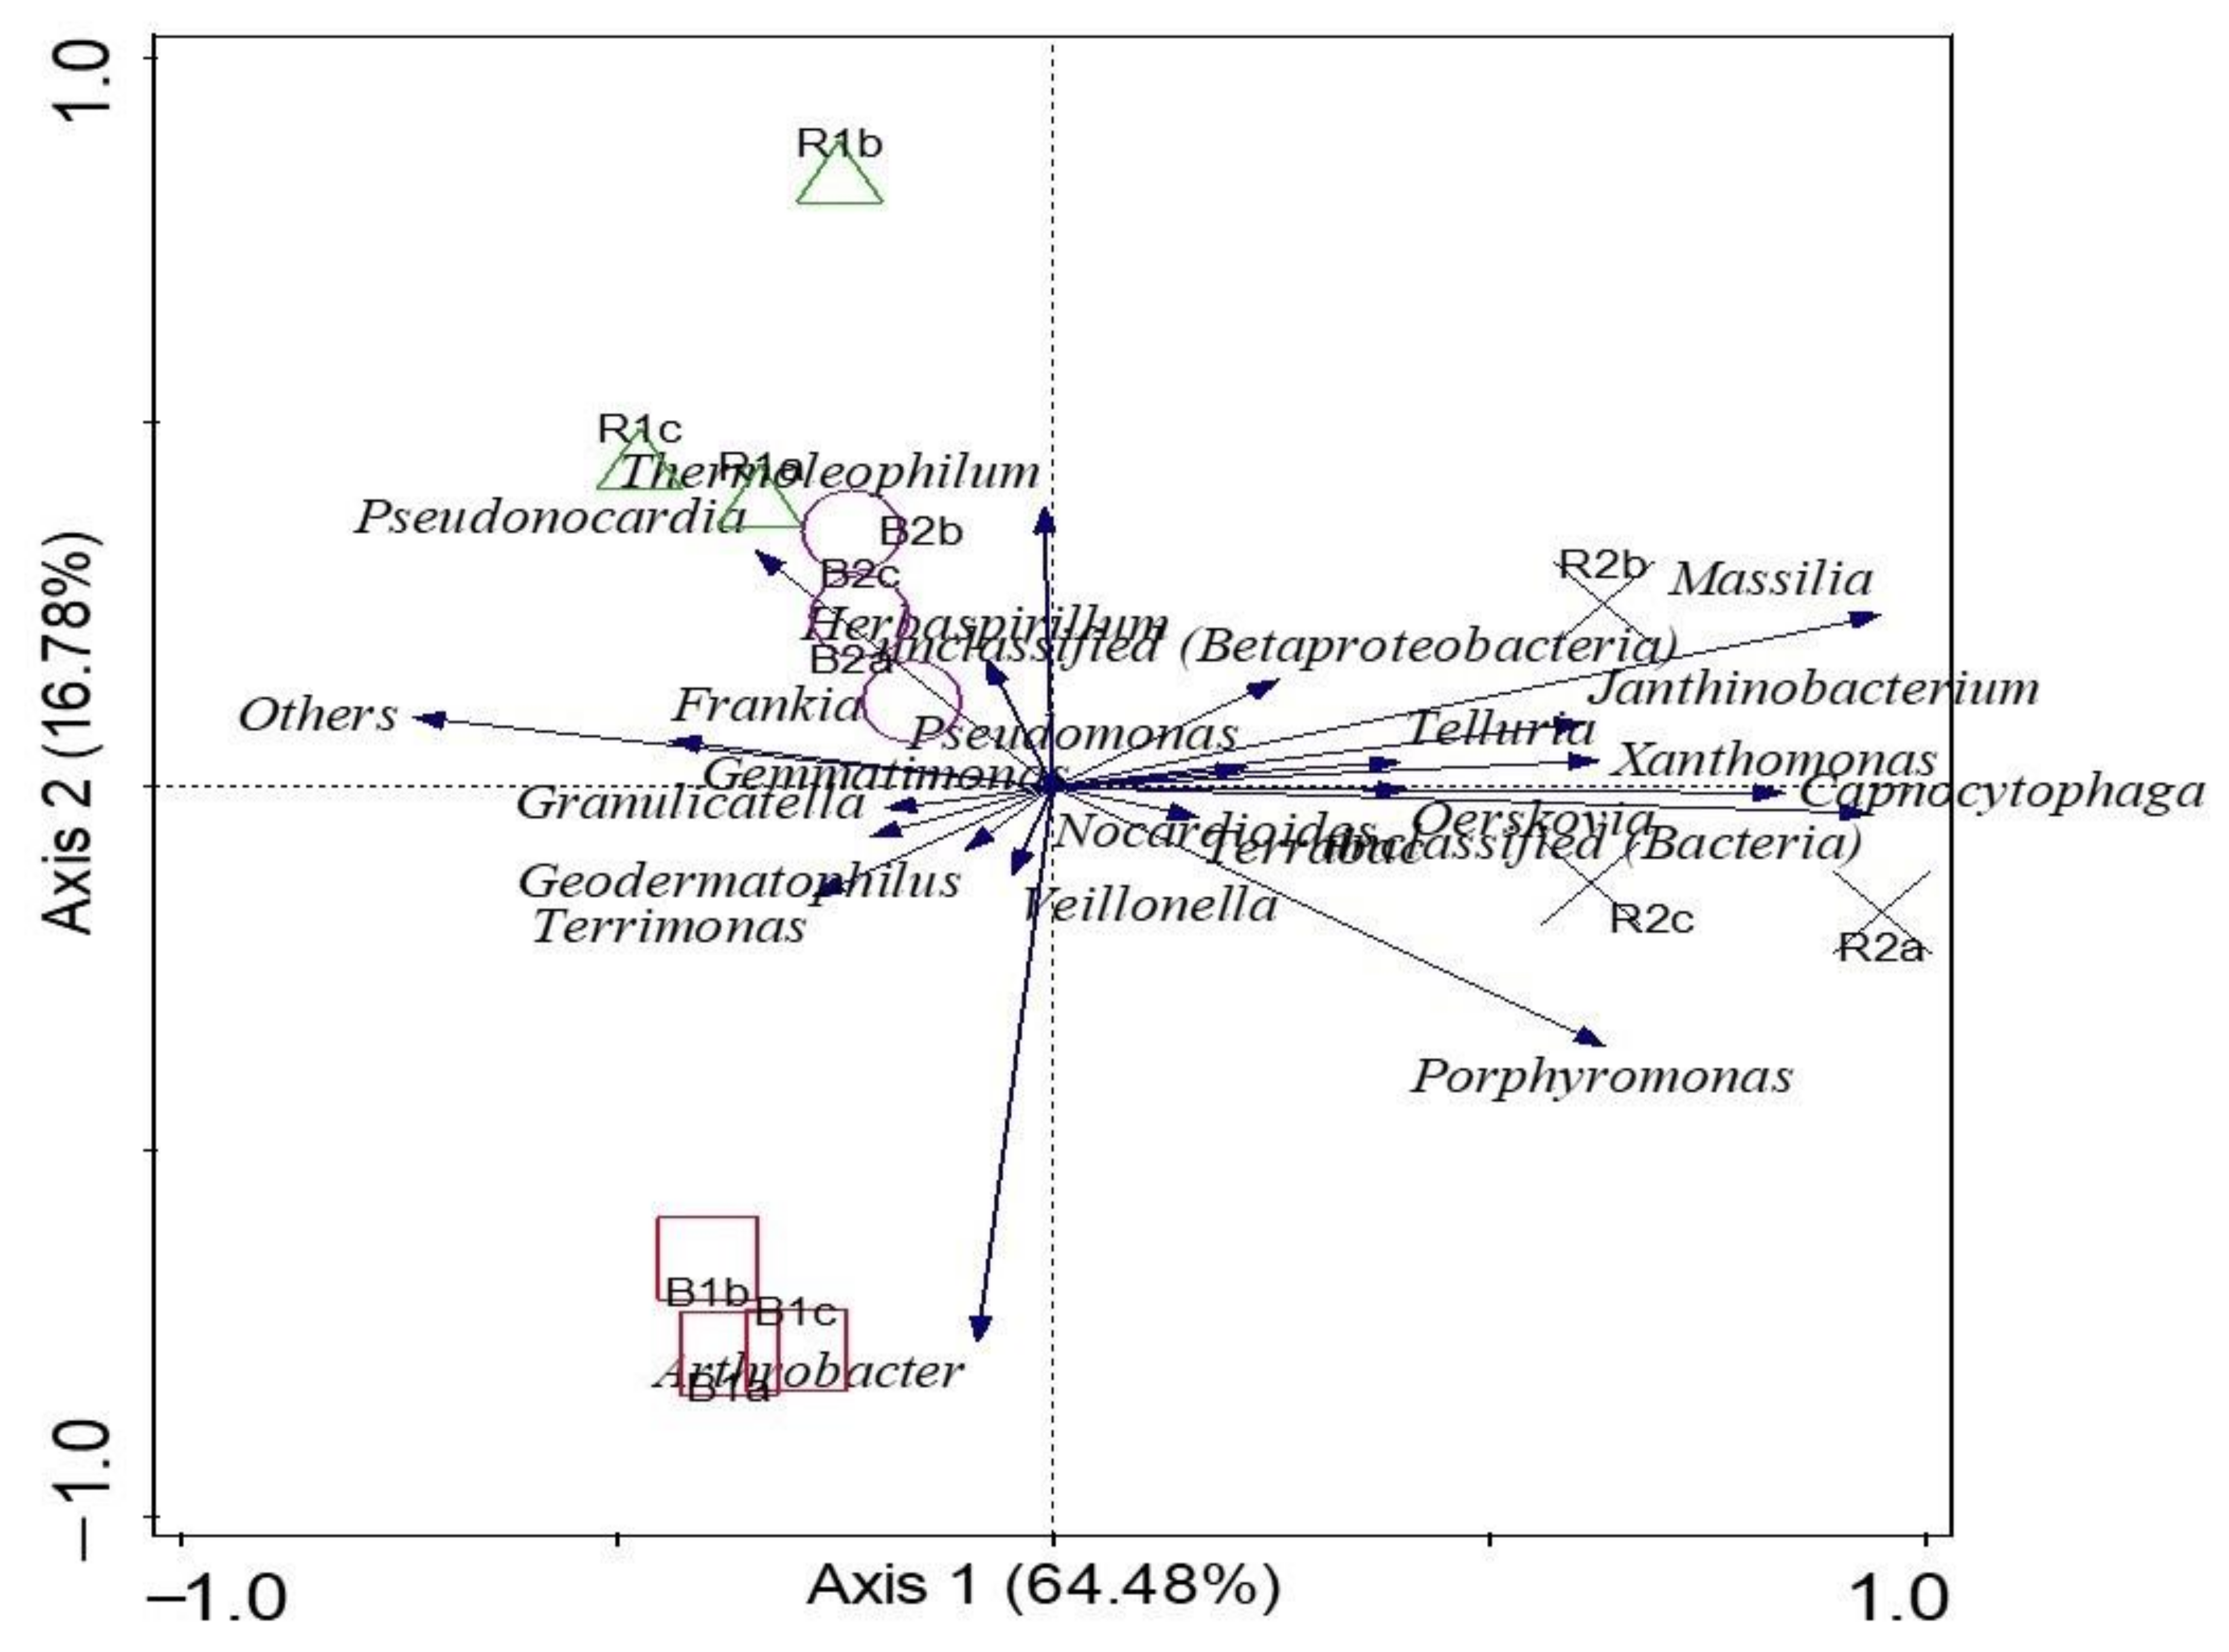
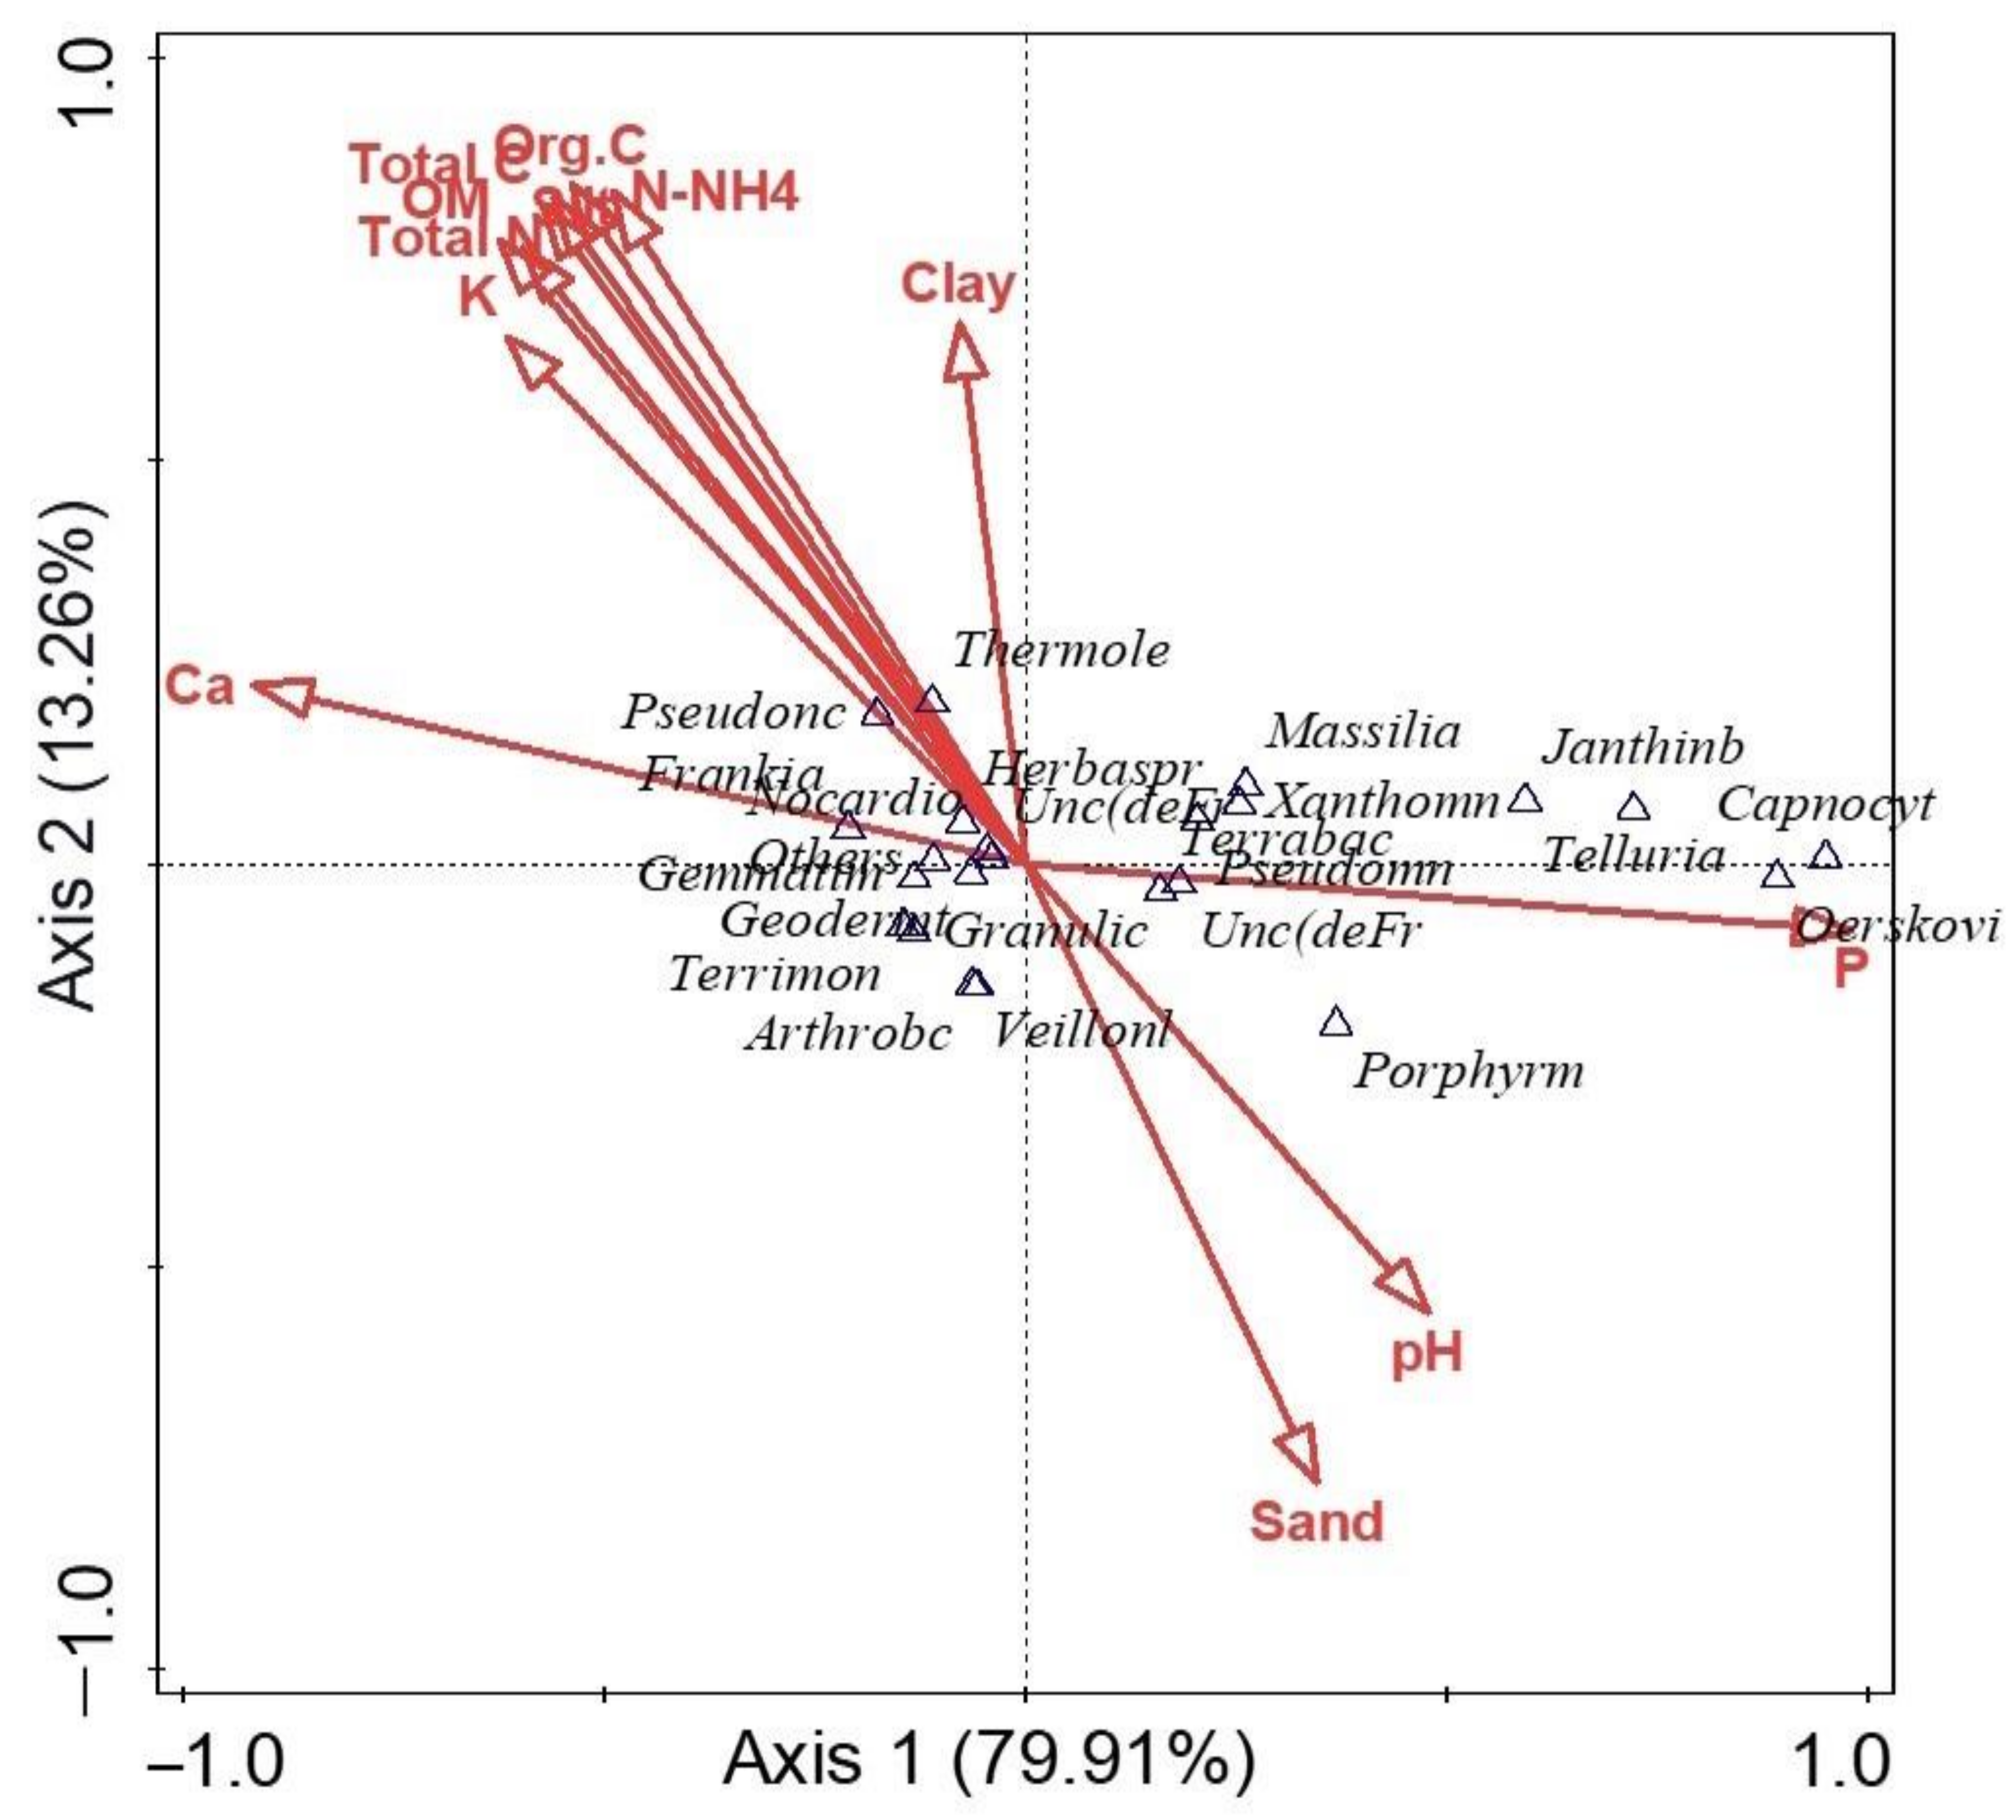
α diversity indices (Shannon and evenness) at the genus level presented no significant difference (p > 0.05) between the rhizosphere and bulk soil samples. R2 had the highest Shannon diversity, but no significant differences were detected (p > 0.05) between the other microhabitats. In addition, there was no significant difference (p > 0.05) between the microbial diversity of the two locations. The results showed that B2 had the least microbial community diversity (Table 2). To test for a significant difference between the β diversity of the rhizosphere soil samples and the bulk soil samples, ANOSIM showed that there was a significant difference between β diversity of the rhizosphere and bulk soil microbial community (p-value = 0.01; R = 0.58). The principal coordinates analysis (PCoA) was used to visualize the β diversity of samples based on the relative abundances of metagenomes obtained from the sunflower rhizosphere and bulk samples (Figure 5). Comparing the microbial communities showed that PCoA indicated no distinct clustering by the rhizosphere and bulk soils and the locations. For example, samples R2 (a–c) were distinct and far from samples B2 (a–c), which explains that microbial structures are unique to those of the rhizosphere R2. Samples R1 (a–c) were slightly away from samples B1 (a–c), which means the community structures are different. In addition, samples B1 (a–c) and B2 (a–c) were close together, which means that the two soil samples are similar. The two locations are also distinct from one another. PCA was used to determine how microorganisms were spread out in the microbial communities (Figure 6). The location of the metagenomes shows the total frequency of each sequence that was associated with the structural composition, with the vector arrow indicating the organism that most strongly determines the distribution. For instance, microorganisms such as Oerskovia, Telluria, Massilia, Xanthomonas, Capnocytophaga, and Janthinobacterium placed the rhizosphere soil microorganism (R2) apart from the microorganisms found in B1, B2, and R1. Arthrobacter strongly correlated with B1, while Pseudonocardia and Thermoleophilum were more distributed in the rhizosphere, R1 (Figure 6).
3.5. Diversity Indices of Functional Genes Observed from Sunflower Rhizosphere and Bulk Soils
The alpha indices that depict the Simpson, Shannon, and evenness (Table 3) showed that there was no significant difference in the alpha diversity, which is the gene diversity within the habitats. Furthermore, it was checked if there was a significant difference in the beta diversity, which indicates the diversity of the functional genes responsible for plant growth in the sunflower rhizosphere compared to the bulk soils. ANOSIM, which provides a way to test statistically whether there is a significant difference between two or more groups of sampling locations, showed that there was a significant difference between the gene orthologs identified in the rhizosphere soil of the two locations (p-value = 0.01; R = 0.58) as displayed using PCoA (Figure 7), where the rhizosphere (R1, R2) is far apart from bulk soils (B1, B2) and the locations Palmietfontein (R1, B1) and Bloemhof (R2, B2) are not close together.
Microbial Diversity and Community Structure Are Influenced by Environmental Variables
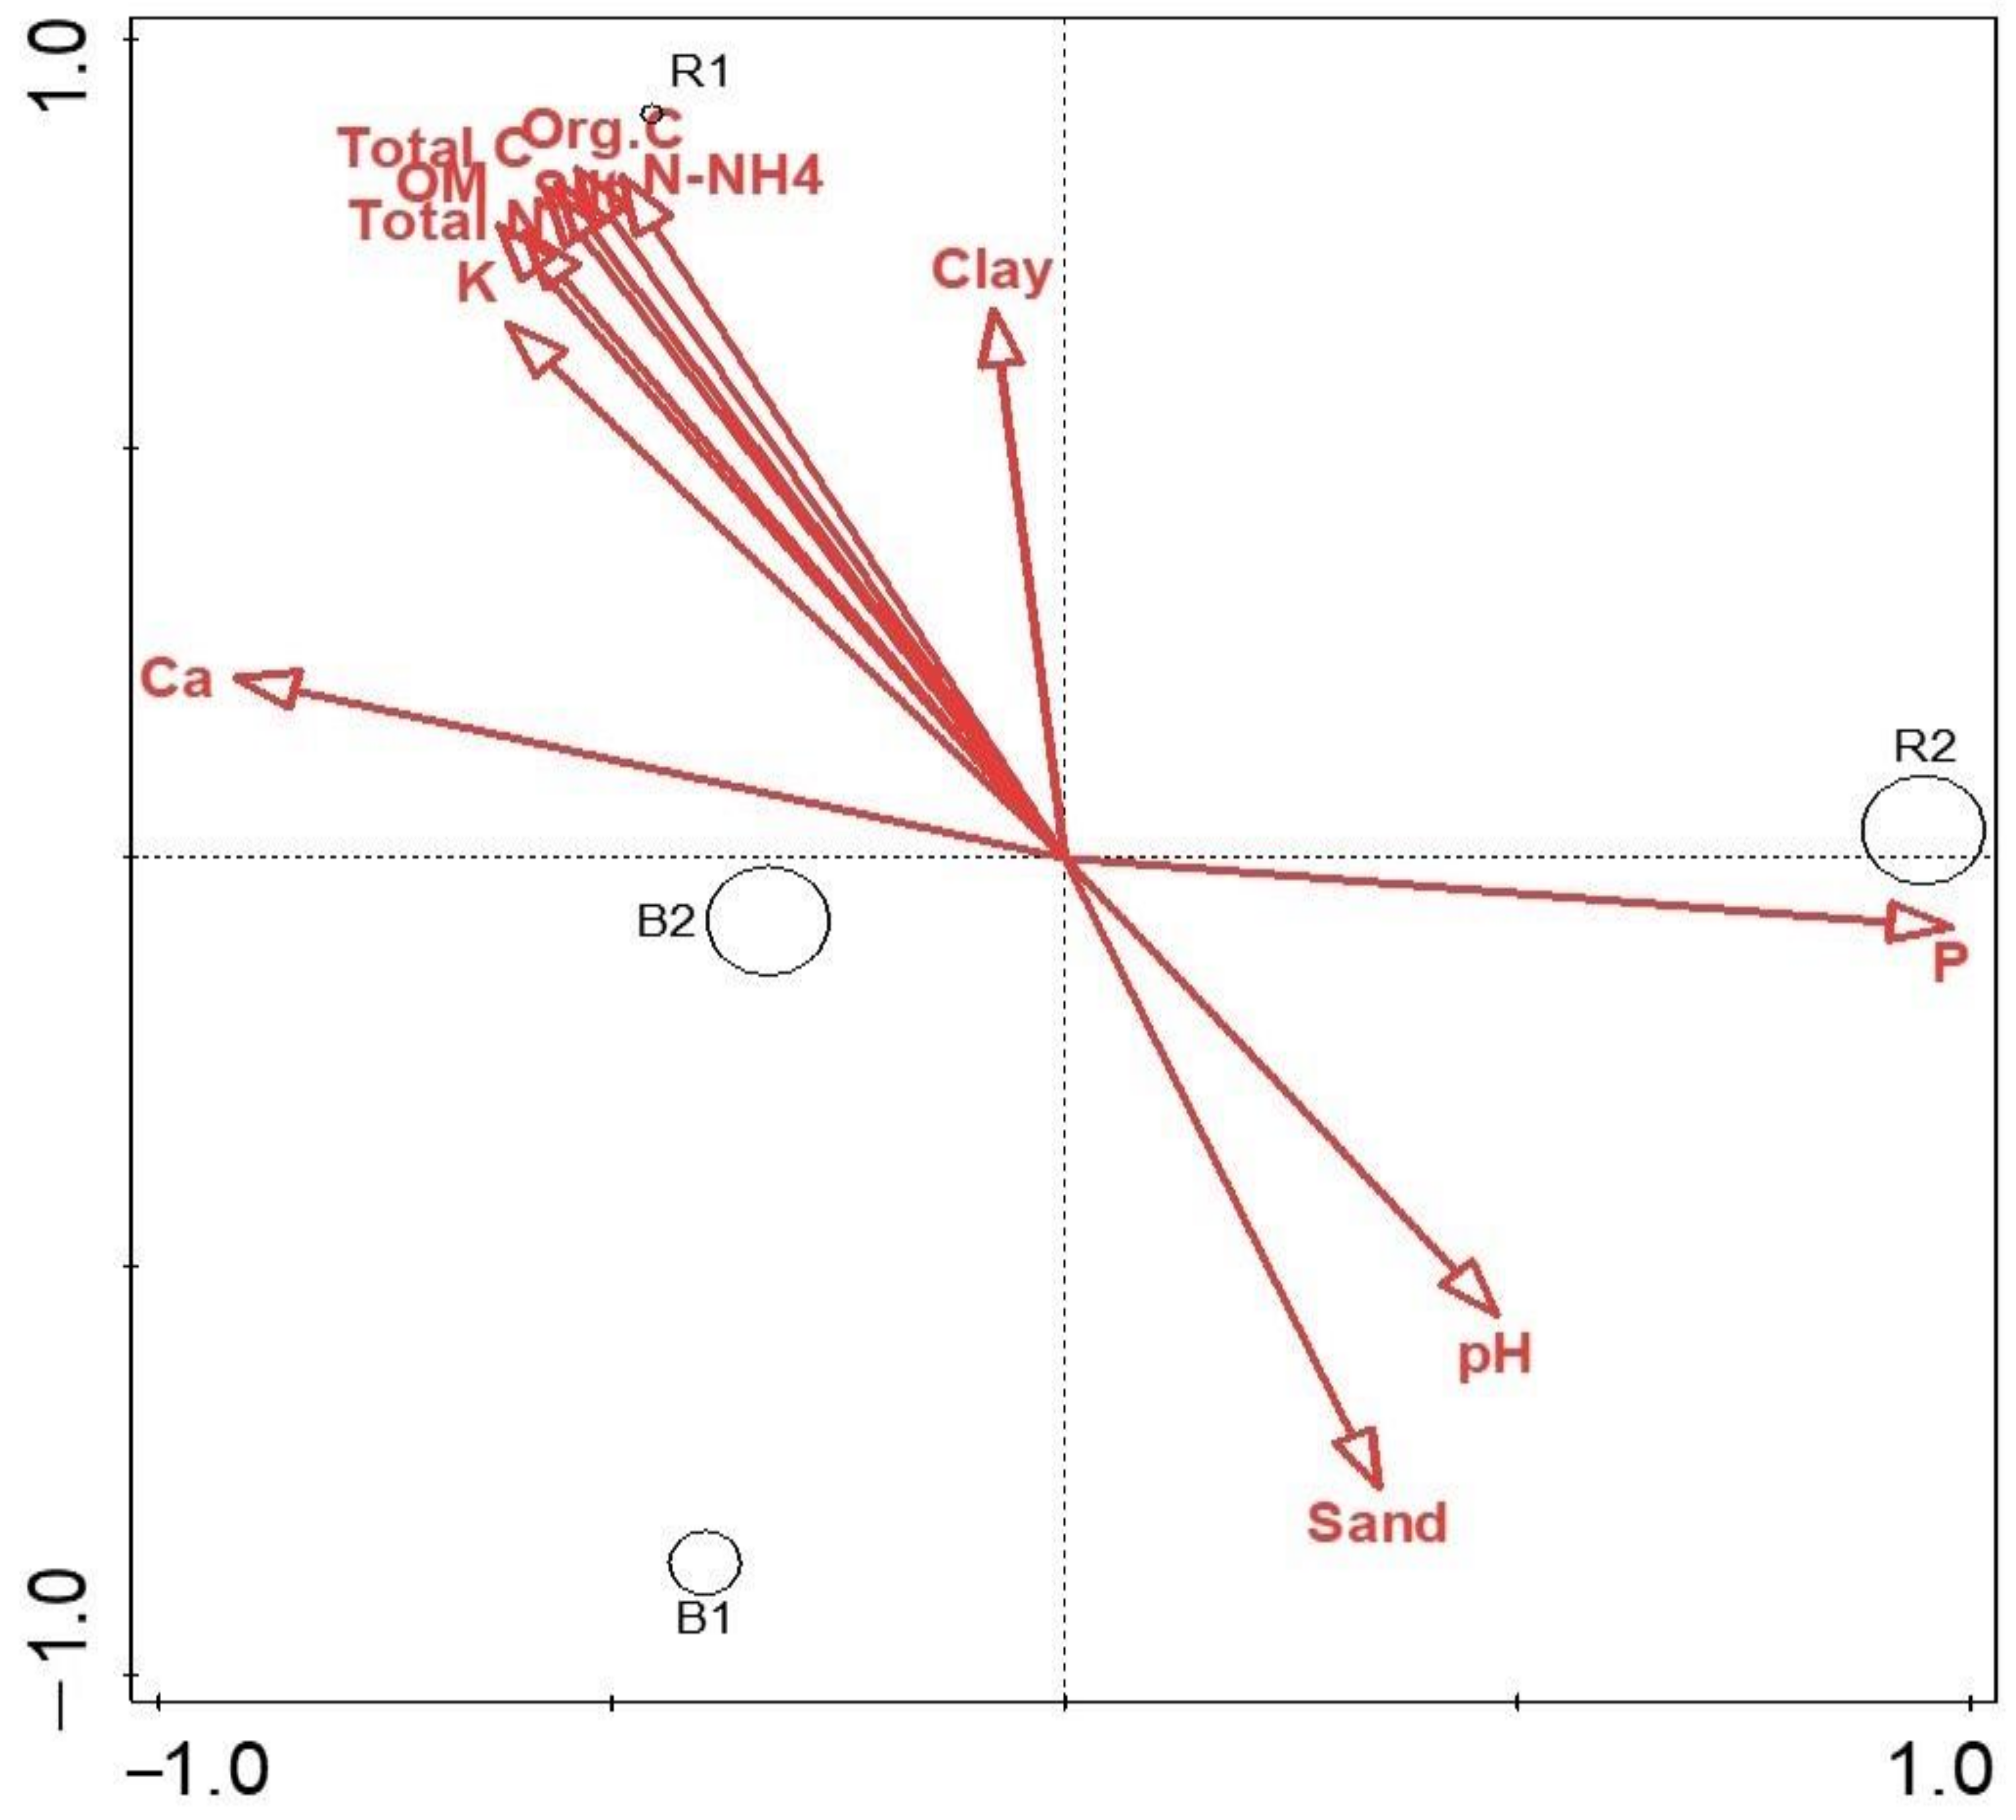
The canonical correspondence analysis indicated that richness and distribution of all the environmental variables influence microbial diversity and community structure. The correlation between the soil microbial community taxonomic composition and the soil physicochemical parameters was analyzed using canonical correspondence analysis (Figure 8). Calcium, organic C, OM, N-NH4, and N positively correlated with the abundance of genera such as Thermoleophilum, Frankia, Pseudonocardia, Nocardioides, Pseudomonas, Xanthomonas, and Herbspirillum. Similarly, Phosphorus concentration positively correlated with genus Oerskovi, Porphyromonas, Veillonella, and Geodermatophilus but negatively correlated with Gemmatimonas, Terrimonas, Granulicatella, and Arthrobacter. The R2 soil type also correlated with phosphorus, which could explain why diversity was higher in that environment (Figure 9).
3.6. Plant Growth Promoting Properties from Sunflower Rhizosphere and Bulk Soils
Shotgun metagenomics sequencing revealed genes that possess plant-beneficial potential, plant-growth-promoting, and biocontrol traits with different functions in the provision of nutrients, antagonist tendencies against plant pathogens, synthesis of plant hormones, and hormone level modulation (Figure 10). There was no significant difference (p-value = 0.405) in the genes from the two sampling locations (that is, Palmietfontein and Bloemhof). In addition, the genes obtained from the rhizosphere and bulk soil samples were also not significant (p-value = 0.852).
3.7. Nitrogen-Fixing Genes
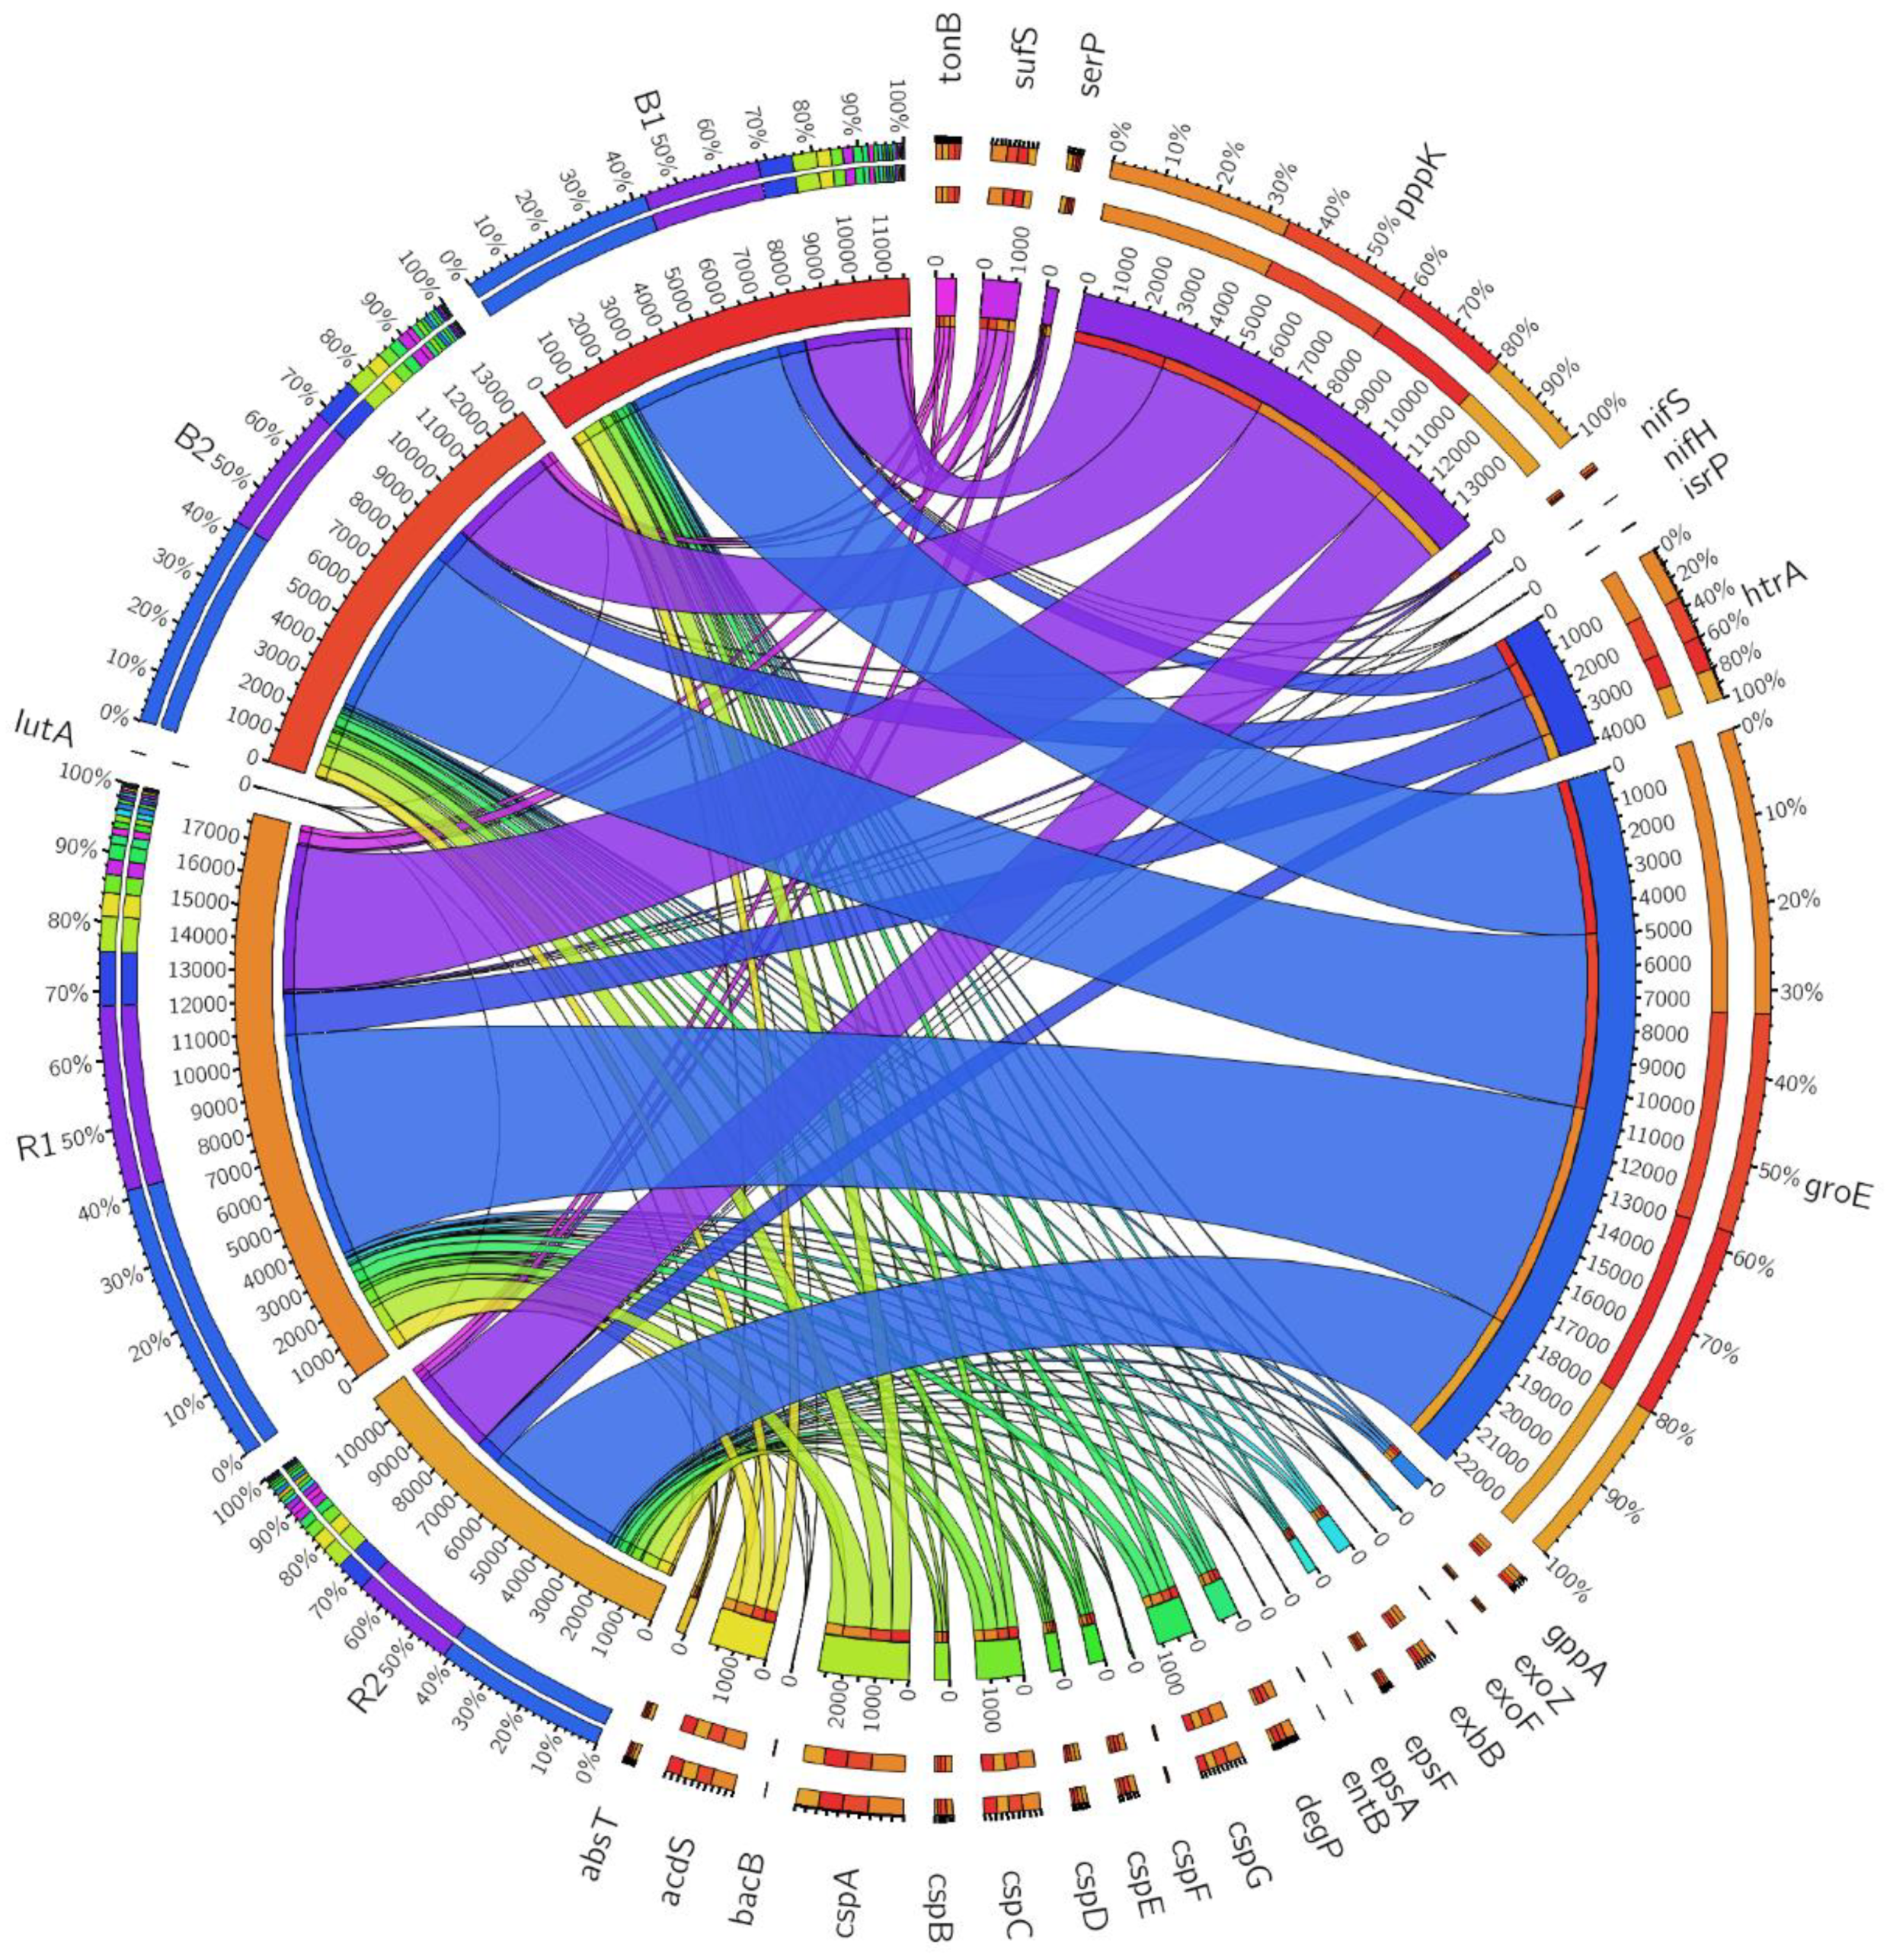
Nitrogen-fixing genes are important due to their involvement in the conversion of atmospheric nitrogen to a form plants can utilize. Two types of nif genes belonging to the Cysteine desulfurase (Enzyme Commission (EC) 2.8.1.7) nifS subfamily and sufS subfamily were identified. Sample R1 and R2 has sufS gene had a relative abundance of 395 and 211, respectively, while B1 and B2 had a relative abundance of 262 and 272 (Table 4, Figure 10). The nifS subfamily possessed relative abundance of 94 and 44 for the R1 and B1 soils, respectively. Another gene that confers fixation of nitrogen observed was the iron-sulfur cluster assembly scaffold protein nifU containing a relative abundance of 25 in the whole samples. Generally, the relative abundance of sufS and nifS were much more enriched in the location R1 than R2, with the rhizosphere having more abundance than the bulk soil samples.
3.7.1. Siderophore-Producing Genes
Two types of 2,3-dihydro-2,3-dihydroxybenzoate dehydrogenase genes were found belonging to the (EC 1.3.1.28) bacillibactin and (EC 1.3.1.28) enterobactin. Other key functions of the siderophore producing gene are the ABC Fe3+ siderophore transporter inner membrane subunit, which had a relative abundance of 73 and 112 for R1 and R2 metagenomes respectively, while B1 and B2 possessed a relative abundance of 58 and 43, respectively (Table 4, Figure 10). These genes are responsible for transmembrane transport. Moreover, R1 was discovered to have 146 producing siderophore of Ferric siderophore transport system with aliases (alternative name for genes) exbB, while R2 had 116. B1 and B2 had a relative abundance of 110 and 103 of Ferric siderophore transport system, respectively. In addition, the biological-function-dependent siderophore receptor with alias tonB had a relative abundance of 176 for R1, 163 for R2, 135 for B1, and 161 for B2. From our results, the Palmiefontein (R1) location possesses a high relative abundance of siderophore producing genes of EC 1.3.1.28 bacillibactin, tonB, exbB, and Iron siderophore receptor protein compared to the Bloemhof location (R2). The bulk soil samples contain a smaller number of siderophore-producing genes compared to the rhizosphere soils.
3.7.2. ACC Deaminase Producing Genes
ACC deaminase possesses enzymatic activities that potentially help in the growth of a plant either in a stressed or normal condition. From our study, only one type of ACC deaminase gene was discovered belonging to the EC 3.5.99.7 aliases. The sunflower rhizosphere soil samples R1 and R2 possessed a relative abundance of 599 and 395 of ACC deaminase, while the bulk soil samples B1 and B2 had a relative abundance of 371 and 400, respectively. In addition, the location R1 had a higher relative abundance of acdS gene than R2 location.
3.7.3. Exopolysaccharide Producing Genes
R1 metagenome with the biological function of exopolysaccharide biosynthesis glycosyltransferase with alias of epsF (EC 2.4.1.) had a relative abundance of 80, while R2, B1, and B2 had a relative abundance of 48, 74, and 80, respectively. Other exopolysaccharide-producing genes with biological functions such as exopolysaccharide production protein precursor with aliases exoF were also found containing an abundance of 17 for R1 and 3 for R2, while B1 and B2 had a relative abundance of 4 and 2, respectively. Exopolysaccharide production protein exoZ gene had 38 for R1 metagenome, 45 for R2 metagenome, and 24 and 39 for B1 and B2 metagenomes, respectively (Figure 10). The proteins produced by these genes are potentially responsible for biofilm formation and plant colonization. Our results showed that the genes are more abundant in the rhizosphere soils than the bulk soil samples, with R1 possessing more abundance than R2 for most genes.
3.7.4. Genes Potentially Contributing to Phosphate Solubilisation
Phosphorus is the second most important nutrient needed for plant growth. It is found in insoluble form in the soil but can be converted into a soluble form and can then function as a biofertilizer for plant use. From our study, several genes potentially responsible for solubilizing phosphate to release a soluble form of phosphorus for plant utilization were identified. These genes are polyphosphate kinase with the alias of EC 2.7.4.1 and phosphatase with the alias ppx/gppA family. The R1 location had the most abundant gene of phosphate kinase with 4725, compared to the R2 location relative abundance of 2691 (Figure 10). Regarding the biological function of phosphatase ppx/gppA, the number of potentially phosphate solubilizing genes identified were 145 for R1 and 108, 81, and 106 for R2, B1, and B2 metagenomes, respectively. In addition, the rhizosphere was more enriched in genes potentially responsible for solubilizing phosphate than bulk soils.
3.7.5. High-Temperature Stress Response Genes
Strikingly, two types of high-temperature stress response genes were discovered in our study. They are involved in the production of protease/chaperone protein and serine protease with aliases htrA and degP/htrA, do-like EC.3.4.21, respectively. The relative abundance of htrA protease/chaperone gene were 1379 and 798 for R1 and R2 locations, respectively, while B1 and B2 had a relative abundance of 874 and 1100, respectively. At the same time, serine protease degP/htrA EC.3.4.21 had 246 for R1, while R2, B1, and B2 had 104, 148, and 151, respectively. These genes confer plants with adaptive mechanisms that help survive stressed environmental conditions. From our results, the rhizosphere is more enriched than the bulk soil samples, althoug R1’s location is the most enriched across the location.
3.7.6. Heat and Cold Stress Genes
Well represented from our study are the cold and heat stress genes cspABCDEFG, groEL and groES (Table 4, Figure 10). cspA had a relative abundance of 898 for R1, 557 for R2, and 616 and 653 for B1, and B2, respectively. cspB had a relative abundance of 166 and 63 for both R1 and R2, while B1 and B2 had a relative abundance of 93 and 128, respectively. cspC had 456 for R1, 319 for R2, 312 for B1, and 341 for B2. The heat shock protein chaperone with aliases groEL had a relative abundance of 7318 in R1, 4453 in R2 metagenome, 4977 in B1 and 5603 in B2, while co-chaperone groES gene had 1409 for R1, 814 for R2, 1016 for B1 and 1134 for B2. CspABCEG was more abundant in the rhizosphere than the bulk soils, although rhizosphere location R1 was more enriched than R2.
4. Discussion
Soil is a very complex ecosystem in which microorganisms play an important role. High-throughput sequencing is the current gold standard to characterize soil microbial communities. Here, the diversity, structural composition, and functional genes of microbial communities in sunflower rhizosphere and bulk soils were examined using metagenome sequencing. α diversity was used to estimate the number of taxa (richness) and distribution (evenness) within the microbial community using Shannon and Simpson indices. Contrary to previous results, our study shows that α diversity is lower in the rhizosphere than the bulk soil communities, which answers our first hypothesis that rhizosphere microbiome would be more diverse than the bulk soil because of the activities that take place there. Guo et al. [30] and Cui et al. [19] report that plant selects microorganisms and as a result, diversity of the microbial community is usually low in the rhizosphere when compared to the bulk soils. β-diversity of the microbiome for the two habitats was estimated using canonical correspondence analysis based on Bray-Curtis dissimilarity matrix. PCoA of difference vectors showed clear separations between the sunflower rhizosphere and bulk soil samples and also the two locations sampled.
PCA was used to visualize how distributed and predominant the microorganisms were between the sunflower rhizosphere in comparison to the bulk soil samples, and this explains 85.90% of the total variation. The results show that the relative abundance of microorganisms such as Oerskovia, Telluria, Pseudomonas, Massilia, Xanthomonas, Capnocytophaga, and Janthinobacterium was more in R2 than in B1, B2, and R1. The abundance and distribution around R2 could be a result of factors such as soil type, management practices, and soil properties, and this is in agreement with previous studies [31,32]. On the other hand, genera such as Terrimonas, Veillonella, Arthrobacter, Granulicatella, Geodermatophilus, Gemmatimonas, and Frankia are present in higher abundance in bulk soil samples than in rhizosphere samples [33].
The canonical correspondence analysis found that Ca2+, organic C, OM, N-NH4, N, P, K+, and pH influenced the microbial diversity and community structure. However, the microbial diversity of each location was directly proportional to the richness and distribution of the physicochemical parameters present. It has been reported that soil microbial diversity is highly influenced by plants through the exudation of carbohydrates, carboxylic acids, and amino acids [9,34]. Other factors such as soil type, nutrition, management practices, soil properties, plant age, and crop species affect diversity [17,35,36]. In our study, from the soil analysis, we noticed that R2 with a phosphorus value of 74.43 mg/kg was higher in the rhizosphere in comparison to the bulk soil (Figure 7). This could explain why diversity is higher in that habitat and most likely due to soil properties or soil type [37,38]. The soil samples in this study are slightly acidic (with an interval of 5.78–6.60) and, this is also a major part of the microbial community predictor. This correlates with a similar finding reported by Rousk et al. [39], which indicates that bacterial diversity and composition have a positive relationship with pH between 4 and 7. pH is said to have an effect on the composition of other domains, but the influence was far weaker in fungi than for the bacterial community [39].
Profiling the functional microbiome unraveled many potential plant-beneficial, plant-growth-promoting, and biocontrol attributes implicated to be involved in functions such as synthesis of plant hormones, provision of nutrients, and signal molecule synthesis necessary for plant–microbe interaction [40]. Regarding the genomic insight into the R1, R2, B1, and B2 metagenomes, they all possess genes that encode nitrogen fixation nifS and sufS with the biological function of cysteine desulfurase. The enzymatic reduction of atmospheric nitrogen to ammonium, which is most needed for plant growth, is an important part of the nitrogen cycle, and this process is known as biological nitrogen fixation. Biological nitrogen-fixation-derived nitrogen plays a crucial role in crop production by substituting chemical fertilizers with biological nitrogen [41].
However, our metagenomes consist of other types of genes such as iscU/nifU, nifU, nifM, nifT, nifX, nifH, nifA, nifE, nifN, nifB, nifQ, nifW, and nifO. Diazotrophic prokaryotes in the ecosystem have the ability to fix molecular nitrogen using a reaction known as nitrogenase enzymes. The nifH gene encodes the Fe protein, which acts as nitrogenase reductase; therefore, the presence of this gene in all diazotrophic bacteria makes it an ideal molecular marker for the N-fixation pathway [42,43]. Nitrogen is one of the most important nutrients needed in crop production. Interestingly, microbial nitrogen cycling was completely represented in our rhizosphere metagenomic samples, resulting in functional genes related to nitrogen fixation (nifH) and denitrification (nirV). In addition, genes responsible for nitrite transporter nirC, expression of nitric oxide, and nitrite reductase nir and nor were also discovered [44].
In a study by Glick [45], 1-aminocyclopropane-1-carboxylate (ACC) deaminase that encodes for acdS genes was discovered. Plant-growth-promoting bacteria contain enzyme ACC deaminase, which improves the growth of plants by lowering the ethylene level under stress conditions. Ethylene is an important plant hormone because its synthesis is accelerated by biotic and abiotic stresses [46,47]. The coping mechanism of a plant to abiotic stresses, for example, salt stress, can be attributed to the reduction of stress ethylene using ACC deaminase enzymes affected by plant-growth-promoting rhizobacteria [48,49]. From previous studies, ACC deaminase has also been discovered and characterized in certain plant-associated fungi, for example, the biocontrol strain Trichoderma asperellum [50]. Interestingly, our results displayed the phylum Ascomycota from the eukaryote domain, which Trichoderma asperellum belongs to. Thus, microbial acdS can be an approach to withstand stressed conditions.
The metagenomes also contain quite large numbers of siderophore-producing genes, which assist in iron acquisition. Siderophores are small molecules synthesized and secreted by a wide range of microorganisms to scavenge iron [51]. There are two ways plants acquire iron. The first is the acidification of the rhizosphere and the reduction of Fe3+ ions by membrane-bound Fe3− chelate reductase, after which the root cells absorb Fe2+, while the second approach in the acquisition of iron is the secretion of low molecule plant siderophore in order to solubilize the bound iron, after which the membrane proteins transport it into the root cells [52,53]. Kumar et al. [54] described some siderophore-producing microorganisms obtained from the rhizosphere, which enhance plant growth in wheat cultivation and at the same time inhibit plant pathogen Fusarium solani. Siderophores act as virulence factors in several pathogenic microorganisms, and it has been proven that siderophores of mutualistic and commensal species can help minimize the increase in plant pathogens [55]. The siderophore genes observed in our study are of the aliases EC 1.3.1.28, which are involved in the production of 2,3-dihydroxybenzoate, an important precursor of the siderophores bacillibactin and enterobactin [56,57]. Of note are the siderophore receptors gene like lutA, which also play a key role in virulence in pathogens, as mutation in siderophore receptors alters the transport of siderophore-iron complex [58]. In addition, the metagenomes revealed genes Ferric hydroxamate ABC transporter (TC 3.A.1.14.3), fhuC, fhuD, and fhuB, which help in ATP-binding protein, periplasmic substrate-binding protein, and permease component, all coding for Ferric hydroxamate ABC transporter. In a study by Dimkpa et al. [59] hydroxamate siderophore produced by Streptomyces tendae F4 strain was proven to enhance cadmium and iron uptake in sunflower plants, consequently promoting the growth of the plant.
Phosphorus is a key component in plant nutrition, playing an important function in metabolic processes such as photosynthesis, nutrient transport, cell division, and signal transduction. Most organic and inorganic phosphates in the soil are in an insoluble form, and a sizeable number of them cannot be used by plants [60]. Phosphate solubilizing genes were well represented in our study. pqqABCDEF gene, a protein coenzyme that is involved in the biosynthesis of pyrroloquinoline quinone (PQQ), plays an important function in solubilizing phosphates in the soil, thereby making it useful for plants [61]. In a study conducted by You et al. [62], bacterial isolate Burkholderia cenocepacia CR318 isolated from the rhizosphere of maize was confirmed to have a mechanism that can solubilize inorganic phosphate and subsequently improved the growth of the maize plant. Phosphate-solubilizing microorganisms have been well established in the rhizosphere, where they possess the ability of solubilizing soil insoluble phosphate by releasing organic acid, most especially gluconic acid (GA), 2-ketogluconic acid, tartaric acid, oxalic acid, citric acid, and other carboxylic acids [63]. The organic acid chelates divalent cations from complex phosphorus mineral-like tricalcium phosphate and hydroxyapatite and releases free P, which the plant eventually takes up [64]. Findings have shown the important role that PQQ synthesis-using phosphate solubilizing microorganisms play, thus establishing microbial phosphate solubilization as one of the important requirements for plant growth [65].
Serine proteases (EC 3.4.21.) are enzymes cleaving peptide bonds normally found in proteins. They are ubiquitous in nature, present in both prokaryotes and eukaryotes, with important biological functions [66]. Proteases that are found in soil originate from different sources including plants, microorganisms, and animals. For instance, the proteases from plant biomass or microbial processes have been discovered to be relevant in the way a plant responds to environmental circumstances across several ecosystems [67]. We discovered two types of high-temperature stress response genes degP/htrA in our study. htrA serves as a stress response protease that helps in degrading proteins that are damaged due to environmental stresses, especially high temperature, and also helps against oxidative damage [68].
Furthermore, exopolysaccharide-producing genes were represented in our study. epsF had biological functions of exopolysaccharide biosynthesis glycosyltransferase, while exoF had the biological function of exopolysaccharide production protein precursor. These EPS genes have shown evidence that they are responsible for biofilm formation. These plant-associated biofilms have biological functions such as protection against numerous environmental stresses, which include pH changes, osmotic shock, desiccation, and salinity [69]. Other important functions include a reduction in microbial competition and protecting the host plant, thereby increasing the growth and yield of the crop [69]. In a study by Kasim et al. [70], it was shown that biofilm formation was increased with increasing salt concentration, which explains why it is most useful during salinity stress.
Another notable gene represented in our study is the phzF encoding gene, which is responsible for phenazine synthesis. The phzF proteins are implicated in the production of phenazine derivative antibiotic and antifungal compounds against bacteria and fungi [71]. For instance, phenazines produced in Pseudomonas are involved in the biocontrol of many diseases, including soil-borne pathogens [72]. In addition, we discovered genes responsible for stress alleviation from our metagenomic samples of sunflower rhizosphere microbiome origin. Genes cspABCDEFG, groES, and groEL, which are responsible for cold shock and heat shock protein production, were observed in our study. These results were in accordance with a study by Enagbonma and Babalola [61] where these genes were responsible for cold and heat shock response. These genes come into play during drought periods when water is a problem. Drought is a major limiting factor in agricultural production, and a plant is said to undergo drought stress either due to difficulty in the water supply to the root or when the transpiration rate becomes extremely high [73]. In addition, chaperones encoding the gene for heat shock are not only expressed when the temperature is high but also in response to other environmental stresses such as salinity and osmotic water, cold, and oxidative stress [74].
5. Conclusions
This study gives insight into the structural diversity, composition, and plant growth functional genes in sunflower rhizosphere and bulk soil from two different locations. The outcomes from this research suggest that sunflower would thrive in both locations because, compositionally, the microbial diversity was not significant in the two locations, although there was a difference in the microbial structure of both R1 (Palmietfontein) and R2 (Bloemhof) sites. Metagenomes of the agricultural sunflower soil revealed the phyla Actinobacteria and Proteobacteria as the dominant members of the community and these phyla have been established to produce several enzymes with growth-promoting traits in plants. The effect of physicochemical parameters on the microbial structural composition was also a determining factor in driving the sunflower microbiome. These findings suggest that edaphic conditions drive microbial communities. We identified genes that confer fixation of nitrogen, siderophore production, ACC deaminase producing genes, heat and cold shock genes, and phosphate solubilizing producing genes, among others. There was no significant difference in the genes responsible for plant growth in the sunflower rhizosphere microbiome in comparison to the bulk soils; likewise, there was no significant difference between the two locations. However, for most of our identified genes, the location R1 possessed more enriched genes for potential plant growth than the location R2. In conclusion, these genes can be harnessed for biotechnological applications in producing bioproducts such as fertilizers and pesticides to enhance food production. Since some of these microbes are still unculturable, micro-cultivation technology can be potentially harnessed where other cultured microorganisms can be co-cultured with uncultivable microorganisms, as recreating this method in the laboratory will increase throughput and access to unique species for commercial production.
Author Contributions
Conceptualization, T.T.A. and O.O.B.; methodology, T.T.A.; formal analysis, T.T.A.; investigation, T.T.A.; resources, O.O.B.; data curation, T.T.A.; writing—original draft preparation, T.T.A.; writing—review and editing, O.O.B.; visualization, T.T.A.; supervision, O.O.B.; funding acquisition, O.O.B. All authors have read and agreed to the published version of the manuscript.
Funding
This research was funded by the National Research Foundation, South Africa, grant number UID123634.
Institutional Review Board Statement
Not applicable.
Informed Consent Statement
Not applicable.
Data Availability Statement
Sequence data obtained in this work have been deposited in the NCBI Sequence Read Archive with Accession Numbers SRR10426233, SRR10418054, SRR10426310 and SRR10418081.
Acknowledgments
T.T.A. would like to thank the North-West University for a postgraduate bursary. O.O.B. thanks the National Research Foundation, South Africa, for a grant (UID123634) that has supported research in our laboratory.
Conflicts of Interest
The authors declare that they have no conflict of interest, either financial or commercial wise.
References
- Mendes, L.; Raaijmakers, J.; de Hollander, M.; Mendes, R.; Tsai, S. Influence of resistance breeding in common bean on rhizosphere microbiome composition and function. ISME J. 2018, 12, 212. [Google Scholar] [CrossRef] [PubMed]
- Fierer, N. Embracing the unknown: Disentangling the complexities of the soil microbiome. Nat. Rev. Microbiol. 2017, 15, 579. [Google Scholar] [CrossRef]
- Qiao, C.; Penton, C.R.; Xiong, W.; Liu, C.; Wang, R.; Liu, Z.; Xu, X.; Li, R.; Shen, Q. Reshaping the rhizosphere microbiome by bio-organic amendment to enhance crop yield in a maize-cabbage rotation system. Appl. Soil Ecol. 2019, 142, 136–146. [Google Scholar] [CrossRef]
- Compant, S.; Samad, A.; Faist, H.; Sessitsch, A. A review on the plant microbiome: Ecology, functions and emerging trends in microbial application. J. Adv. Res. 2019, 19, 29–37. [Google Scholar] [CrossRef]
- Berg, G.; Rybakova, D.; Grube, M.; Köberl, M. The plant microbiome explored: Implications for experimental botany. J. Exp. Bot. 2015, 67, 995–1002. [Google Scholar] [CrossRef] [PubMed]
- Durrer, A.; Gumiere, T.; Taketani, R.; da Costa, D.; e Silva, M.; Andreote, F. The drivers underlying biogeographical patterns of bacterial communities in soils under sugarcane cultivation. Appl. Soil Ecol. 2017, 110, 12–20. [Google Scholar] [CrossRef]
- Uroz, S.; Oger, P.; Tisserand, E.; Cébron, A.; Turpault, M.; Buée, M.; De Boer, W.; Leveau, J.; Frey-Klett, P. Specific impacts of beech and Norway spruce on the structure and diversity of the rhizosphere and soil microbial communities. Sci. Rep. 2016, 6, 27756. [Google Scholar] [CrossRef] [PubMed]
- Philippot, L.; Raaijmakers, J.M.; Lemanceau, P.; Van Der Putten, W.H. Going back to the roots: The microbial ecology of the rhizosphere. Nat. Rev. Microbiol. 2013, 11, 789–799. [Google Scholar] [CrossRef]
- Oberholster, T.; Vikram, S.; Cowan, D.; Valverde, A. Key microbial taxa in the rhizosphere of sorghum and sunflower grown in crop rotation. Sci. Total Environ. 2018, 624, 530–539. [Google Scholar] [CrossRef] [Green Version]
- Alawiye, T.T.; Babalola, O.O. Bacterial Diversity and Community Structure in Typical Plant Rhizosphere. Diversity 2019, 11, 179. [Google Scholar] [CrossRef] [Green Version]
- Vacheron, J.; Moënne-Loccoz, Y.; Dubost, A.; Gonçalves-Martins, M.; Muller, D.; Prigent-Combaret, C. Fluorescent Pseudomonas strains with only few plant-beneficial properties are favored in the maize rhizosphere. Front. Plant Sci. 2016, 7, 1212. [Google Scholar] [CrossRef] [Green Version]
- Nouioui, I.; Cortés, C.J.; Carro, L.; Castro, J.F.; Gtari, M.; Ghodhbane-Gtari, F.; Klenk, H.-P.; Tisa, L.S.; Sangal, V.; Goodfellow, M. Genomic Insights into plant-growth-promoting potentialities of the genus Frankia. Front. Microbiol. 2019, 10, 1457. [Google Scholar] [CrossRef]
- Bruto, M.; Prigent-Combaret, C.; Muller, D.; Moënne-Loccoz, Y. Analysis of genes contributing to plant-beneficial functions in plant growth-promoting rhizobacteria and related Proteobacteria. Sci. Rep. 2014, 4, 6261. [Google Scholar] [CrossRef] [Green Version]
- del Carmen Orozco-Mosqueda, M.; Glick, B.R.; Santoyo, G. ACC deaminase in plant growth-promoting bacteria (PGPB): An efficient mechanism to counter salt stress in crops. Microbiol. Res. 2020, 235, 126439. [Google Scholar] [CrossRef] [PubMed]
- Xu, J.; Zhang, Y.; Zhang, P.; Trivedi, P.; Riera, N.; Wang, Y.; Liu, X.; Fan, G.; Tang, J.; Coletta-Filho, H.D. The structure and function of the global citrus rhizosphere microbiome. Nat. Commun. 2018, 9, 1–10. [Google Scholar] [CrossRef] [Green Version]
- McIntyre, A.B.; Ounit, R.; Afshinnekoo, E.; Prill, R.J.; Hénaff, E.; Alexander, N.; Minot, S.S.; Danko, D.; Foox, J.; Ahsanuddin, S. Comprehensive benchmarking and ensemble approaches for metagenomic classifiers. Genome Biol. 2017, 18, 182. [Google Scholar] [CrossRef] [PubMed] [Green Version]
- Mendes, L.W.; Kuramae, E.E.; Navarrete, A.A.; Van Veen, J.A.; Tsai, S.M. Taxonomical and functional microbial community selection in soybean rhizosphere. ISME J. 2014, 8, 1577–1587. [Google Scholar] [CrossRef] [PubMed]
- Enagbonma, B.; Aremu, B.; Babalola, O. Profiling the functional diversity of termite mound soil bacteria as revealed by shotgun sequencing. Genes 2019, 10, 637. [Google Scholar] [CrossRef] [Green Version]
- Cui, Y.; Bing, H.; Fang, L.; Wu, Y.; Yu, J.; Shen, G.; Jiang, M.; Wang, X.; Zhang, X. Diversity patterns of the rhizosphere and bulk soil microbial communities along an altitudinal gradient in an alpine ecosystem of the eastern Tibetan Plateau. Geoderma 2019, 338, 118–127. [Google Scholar] [CrossRef]
- Kettler, T.; Doran, J.; Gilbert, T. Simplified method for soil particle-size determination to accompany soil-quality analyses. Soil Sci. Soc. Am. J. 2001, 65, 849–852. [Google Scholar] [CrossRef] [Green Version]
- Shi, J.; Yuan, X.; Lin, H.; Yang, Y.; Li, Z. Differences in soil properties and bacterial communities between the rhizosphere and bulk soil and among different production areas of the medicinal plant Fritillaria thunbergii. Int. J. Mol. Sci. 2011, 12, 3770–3785. [Google Scholar] [CrossRef]
- Deke, A.; Adugna, W.; Fite, A. Soil physic-chemical properties in termite mounds and adjacent control soil in Miyo and Yabello Districts of Borana Zone, Southern Ethiopia. Am. J. Agric. For. 2016, 4, 69. [Google Scholar] [CrossRef] [Green Version]
- Meyer, F.; Paarmann, D.; D’Souza, M.; Olson, R.; Glass, E.; Kubal, M.; Paczian, T.; Rodriguez, A.; Stevens, R.; Wilke, A. The metagenomics RAST server–a public resource for the automatic phylogenetic and functional analysis of metagenomes. BMC Bioinform. 2008, 9, 386. [Google Scholar] [CrossRef] [Green Version]
- Cox, M.; Peterson, D.; Biggs, P. SolexaQA: At-a-glance quality assessment of Illumina second-generation sequencing data. BMC Bioinform. 2010, 11, 485. [Google Scholar] [CrossRef] [Green Version]
- Gomez-Alvarez, V.; Teal, T.; Schmidt, T. Systematic artifacts in metagenomes from complex microbial communities. ISME J. 2009, 3, 1314. [Google Scholar] [CrossRef] [PubMed] [Green Version]
- Kent, W. BLAT—the BLAST-like alignment tool. Genome Res. 2002, 12, 656–664. [Google Scholar] [CrossRef] [PubMed] [Green Version]
- Wilke, A.; Harrison, T.; Wilkening, J.; Field, D.; Glass, E.; Kyrpides, N.; Mavrommatis, K.; Meyer, F. The M5nr: A novel non-redundant database containing protein sequences and annotations from multiple sources and associated tools. BMC Bioinform. 2012, 13, 141. [Google Scholar] [CrossRef] [Green Version]
- Garcia-Mazcorro, J.F.; Castillo-Carranza, S.A.; Guard, B.; Gomez-Vazquez, J.P.; Dowd, S.E.; Brigthsmith, D.J. Comprehensive molecular characterization of bacterial communities in feces of pet birds using 16S marker sequencing. Microb. Ecol. 2017, 73, 224–235. [Google Scholar] [CrossRef]
- Hammer, Ø.; Harper, D.A.; Ryan, P.D. PAST: Paleontological statistics software package for education and data analysis. Palaeontol. Electron. 2001, 4, 1–9. [Google Scholar]
- Guo, J.; McCulley, R.; Phillips, T.; McNear, D., Jr. Fungal endophyte and tall fescue cultivar interact to differentially affect bulk and rhizosphere soil processes governing C and N cycling. Soil Biol. Biochem. 2016, 101, 165–174. [Google Scholar] [CrossRef]
- Schlemper, T.R.; Leite, M.F.; Lucheta, A.R.; Shimels, M.; Bouwmeester, H.J.; van Veen, J.A.; Kuramae, E.E. Rhizobacterial community structure differences among sorghum cultivars in different growth stages and soils. FEMS Microbiol. Ecol. 2017, 93. [Google Scholar] [CrossRef] [PubMed] [Green Version]
- Jiang, J.; Song, Z.; Yang, X.; Mao, Z.; Nie, X.; Guo, H.; Peng, X. Microbial community analysis of apple rhizosphere around Bohai Gulf. Sci. Rep. 2017, 7, 1–9. [Google Scholar] [CrossRef]
- Yang, Y.; Wang, N.; Guo, X.; Zhang, Y.; Ye, B. Comparative analysis of bacterial community structure in the rhizosphere of maize by high-throughput pyrosequencing. PLoS ONE 2017, 12, e0178425. [Google Scholar] [CrossRef]
- García-Salamanca, A.; Molina-Henares, M.; van Dillewijn, P.; Solano, J.; Pizarro-Tobías, P.; Roca, A.; Duque, E.; Ramos, J. Bacterial diversity in the rhizosphere of maize and the surrounding carbonate-rich bulk soil. Microb. Biotechnol. 2013, 6, 36–44. [Google Scholar] [CrossRef] [PubMed]
- Yang, Z.; Yang, W.; Li, S.; Hao, J.; Su, Z.; Sun, M.; Gao, Z.; Zhang, C. Variation of bacterial community diversity in rhizosphere soil of sole-cropped versus intercropped wheat field after harvest. PLoS ONE 2016, 11. [Google Scholar] [CrossRef]
- Mahoney, A.K.; Yin, C.; Hulbert, S.H. Community structure, species variation, and potential functions of rhizosphere-associated bacteria of different winter wheat (Triticum aestivum) cultivars. Front. Plant Sci. 2017, 8, 132. [Google Scholar] [CrossRef] [PubMed] [Green Version]
- Hol, W.; De Boer, W.; de Hollander, M.; Kuramae, E.; Meisner, A.; van der Putten, W. Context dependency and saturating effects of loss of rare soil microbes on plant productivity. Front. Plant Sci. 2015, 6, 485. [Google Scholar] [CrossRef] [PubMed] [Green Version]
- Trivedi, P.; Delgado-Baquerizo, M.; Anderson, I.; Singh, B. Response of soil properties and microbial communities to agriculture: Implications for primary productivity and soil health indicators. Front. Plant Sci. 2016, 7, 990. [Google Scholar] [CrossRef] [Green Version]
- Rousk, J.; Bååth, E.; Brookes, P.; Lauber, C.; Lozupone, C.; Caporaso, J.; Knight, R.; Fierer, N. Soil bacterial and fungal communities across a pH gradient in an arable soil. ISME J. 2010, 4, 1340. [Google Scholar] [CrossRef]
- Nelkner, J.; Henke, C.; Lin, T.W.; Pätzold, W.; Hassa, J.; Jaenicke, S.; Grosch, R.; Pühler, A.; Sczyrba, A.; Schlüter, A. Effect of long-term farming practices on agricultural soil microbiome members represented by Metagenomically Assembled Genomes (MAGs) and their predicted plant-beneficial genes. Genes 2019, 10, 424. [Google Scholar] [CrossRef] [Green Version]
- Li, Y.; Pan, F.; Yao, H. Response of symbiotic and asymbiotic nitrogen-fixing microorganisms to nitrogen fertilizer application. J. Soils Sediments 2019, 19, 1948–1958. [Google Scholar] [CrossRef]
- Zehr, J.P.; Jenkins, B.D.; Short, S.M.; Steward, G.F. Nitrogenase gene diversity and microbial community structure: A cross-system comparison. Environ. Microbiol. 2003, 5, 539–554. [Google Scholar] [CrossRef] [PubMed]
- Cobo-Díaz, J.F.; Fernández-González, A.J.; Villadas, P.J.; Robles, A.B.; Toro, N.; Fernández-López, M. Metagenomic assessment of the potential microbial nitrogen pathways in the rhizosphere of a Mediterranean forest after a wildfire. Microb. Ecol. 2015, 69, 895–904. [Google Scholar] [CrossRef]
- Sessitsch, A.; Hardoi:m, P.; Döring, J.; Weilharter, A.; Krause, A.; Woyke, T.; Mitter, B.; Hauberg-Lotte, L.; Friedrich, F.; Rahalkar, M. Functional characteristics of an endophyte community colonizing rice roots as revealed by metagenomic analysis. Mol. Plant-Microbe Interact. 2012, 25, 28–36. [Google Scholar] [CrossRef] [Green Version]
- Glick, B.R. Plant growth-promoting bacteria: Mechanisms and applications. Scientifica 2012, 2012, 963401. [Google Scholar] [CrossRef] [PubMed] [Green Version]
- Melnikava, A.; Volkava, D.; Khramtsova, E. Characteristics of bacterial acdS-gene from the strain Pseudomonas putida B-37 and the creation of a genetic construct for determining its transient expression in the plant cells Nicotiana benthamiana. Proc. Natl. Acad. Sci. Belarus Biol. Ser. 2017, 3, 61–68. [Google Scholar]
- Igiehon, N.O.; Babalola, O.O.; Aremu, B.R. Genomic insights into plant growth promoting rhizobia capable of enhancing soybean germination under drought stress. BMC Microbiol. 2019, 19, 159. [Google Scholar] [CrossRef] [PubMed]
- Singh, R.P.; Shelke, G.M.; Kumar, A.; Jha, P.N. Biochemistry and genetics of ACC deaminase: A weapon to “stress ethylene” produced in plants. Front. Microbiol. 2015, 6, 937. [Google Scholar] [CrossRef]
- Qin, Y.; Druzhinina, I.S.; Pan, X.; Yuan, Z. Microbially mediated plant salt tolerance and microbiome-based solutions for saline agriculture. Biotechnol. Adv. 2016, 34, 1245–1259. [Google Scholar] [CrossRef]
- Viterbo, A.; Landau, U.; Kim, S.; Chernin, L.; Chet, I. Characterization of ACC deaminase from the biocontrol and plant growth-promoting agent Trichoderma asperellum T203. FEMS Microbiol. Lett. 2010, 305, 42–48. [Google Scholar] [CrossRef]
- Thode, S.K.; Rojek, E.; Kozlowski, M.; Ahmad, R.; Haugen, P. Distribution of siderophore gene systems on a Vibrionaceae phylogeny: Database searches, phylogenetic analyses and evolutionary perspectives. PLoS ONE 2018, 13. [Google Scholar] [CrossRef] [Green Version]
- Altomare, C.; Tringovska, I. Beneficial soil microorganisms, an ecological alternative for soil fertility management. In Genetics, Biofuels and Local Farming Systems; Springer: Berlin/Heidelberg, Germany, 2011; pp. 161–214. [Google Scholar] [CrossRef]
- Radzki, W.; Mañero, F.G.; Algar, E.; García, J.L.; García-Villaraco, A.; Solano, B.R. Bacterial siderophores efficiently provide iron to iron-starved tomato plants in hydroponics culture. Antonie Leeuwenhoek 2013, 104, 321–330. [Google Scholar] [CrossRef] [Green Version]
- Kumar, P.; Thakur, S.; Dhingra, G.; Singh, A.; Pal, M.K.; Harshvardhan, K.; Dubey, R.; Maheshwari, D. Inoculation of siderophore producing rhizobacteria and their consortium for growth enhancement of wheat plant. Biocatal. Agric. Biotechnol. 2018, 15, 264–269. [Google Scholar] [CrossRef]
- Kramer, J.; Özkaya, Ö.; Kümmerli, R. Bacterial siderophores in community and host interactions. Nat. Rev. Microbiol. 2019, 1–12. [Google Scholar] [CrossRef]
- Liu, G.; Kong, Y.; Fan, Y.; Geng, C.; Peng, D.; Sun, M. Whole-genome sequencing of Bacillus velezensis LS69, a strain with a broad inhibitory spectrum against pathogenic bacteria. J. Biotechnol. 2017, 249, 20–24. [Google Scholar] [CrossRef]
- Xu, W.-F.; Ren, H.-S.; Ou, T.; Lei, T.; Wei, J.-H.; Huang, C.-S.; Li, T.; Strobel, G.; Zhou, Z.-Y.; Xie, J. Genomic and functional characterization of the endophytic Bacillus subtilis 7PJ-16 strain, a potential biocontrol agent of mulberry fruit sclerotiniose. Microb. Ecol. 2019, 77, 651–663. [Google Scholar] [CrossRef] [Green Version]
- Khan, A.; Singh, P.; Srivastava, A. Synthesis, nature and utility of universal iron chelator–Siderophore: A review. Microbiol. Res. 2018, 212, 103–111. [Google Scholar] [CrossRef]
- Dimkpa, C.; Merten, D.; Svatoš, A.; Büchel, G.; Kothe, E. Siderophores mediate reduced and increased uptake of cadmium by Streptomyces tendae F4 and sunflower (Helianthus annuus), respectively. J. Appl. Microbiol. 2009, 107, 1687–1696. [Google Scholar] [CrossRef]
- Alaylar, B.; Güllüce, M.; Karadayi, M.; Isaoglu, M. Rapid Detection of Phosphate-Solubilizing Bacteria from Agricultural Areas in Erzurum. Curr. Microbiol. 2019, 76, 804–809. [Google Scholar] [CrossRef] [PubMed]
- Enagbonma, B.J.; Babalola, O.O. Unveiling Plant-Beneficial Function as Seen in Bacteria Genes from Termite Mound Soil. J. Soil Sci. Plant Nutr. 2020, 1–10. [Google Scholar] [CrossRef]
- You, M.; Fang, S.; MacDonald, J.; Xu, J.; Yuan, Z.-C. Isolation and characterization of Burkholderia cenocepacia CR318, a phosphate solubilizing bacterium promoting corn growth. Microbiol. Res. 2020, 233, 126395. [Google Scholar] [CrossRef]
- Farhat, M.B.; Farhat, A.; Bejar, W.; Kammoun, R.; Bouchaala, K.; Fourati, A.; Antoun, H.; Bejar, S.; Chouayekh, H. Characterization of the mineral phosphate solubilizing activity of Serratia marcescens CTM 50650 isolated from the phosphate mine of Gafsa. Arch. Microbiol. 2009, 191, 815–824. [Google Scholar] [CrossRef] [PubMed]
- Bharwad, K.; Rajkumar, S. Modulation of PQQ-dependent glucose dehydrogenase (mGDH and sGDH) activity by succinate in phosphate solubilizing plant growth promoting Acinetobacter sp. SK2. 3 Biotech 2020, 10, 5. [Google Scholar] [CrossRef] [PubMed]
- Misra, H.; Rajpurohit, Y.; Khairnar, N. Pyrroloquinoline-quinone and its versatile roles in biological processes. J. Biosci. 2012, 37, 313–325. [Google Scholar] [CrossRef] [PubMed]
- Neitzel, J.J. Enzyme catalysis: The serine proteases. Nat. Educ. 2010, 3, 21. [Google Scholar]
- Vranova, V.; Rejsek, K.; Formanek, P. Proteolytic activity in soil: A review. Appl. Soil Ecol. 2013, 70, 23–32. [Google Scholar] [CrossRef]
- Phillips, R.W.; Roop, R.M. Brucella abortus HtrA functions as an authentic stress response protease but is not required for wild-type virulence in BALB/c mice. Infect. Immun. 2001, 69, 5911–5913. [Google Scholar] [CrossRef] [Green Version]
- Asari, S.Y. Studies on Plant-Microbe Interaction to Improve Stress Tolerance in Plants for Sustainable Agriculture. Ph.D. Thesis, Swedish University of Agricutural Sciences, Uppsala, Sweden, 2015. [Google Scholar]
- Kasim, W.A.; Gaafar, R.M.; Abou-Ali, R.M.; Omar, M.N.; Hewait, H.M. Effect of biofilm forming plant growth promoting rhizobacteria on salinity tolerance in barley. Ann. Agric. Sci. 2016, 61, 217–227. [Google Scholar] [CrossRef] [Green Version]
- Stephan, B.I.; Colombo, R.P.; Silvani, V.A.; Pérgola, M.; Godeas, A.M.; Pardo, A.G.; Bidondo, L.F. Short-term effects of genetically modified potato on arbuscular mycorrhizal fungal communities. J. Soil Sci. Plant Nutr. 2019, 19, 352–356. [Google Scholar] [CrossRef]
- Arseneault, T.; Goyer, C.; Filion, M. Biocontrol of potato common scab is associated with high Pseudomonas fluorescens LBUM223 populations and phenazine-1-carboxylic acid biosynthetic transcript accumulation in the potato geocaulosphere. Phytopathology 2016, 106, 963–970. [Google Scholar] [CrossRef] [PubMed] [Green Version]
- Ghobadi, M.; Taherabadi, S.; Ghobadi, M.-E.; Mohammadi, G.-R.; Jalali-Honarmand, S. Antioxidant capacity, photosynthetic characteristics and water relations of sunflower (Helianthus annuus L.) cultivars in response to drought stress. Ind. Crops Prod. 2013, 50, 29–38. [Google Scholar] [CrossRef]
- Wang, W.; Vinocur, B.; Shoseyov, O.; Altman, A. Role of plant heat-shock proteins and molecular chaperones in the abiotic stress response. Trends Plant Sci. 2004, 9, 244–252. [Google Scholar] [CrossRef] [PubMed]
Figure 1.
Map showing the sampling location.

Figure 2.
Rarefaction curve showing species richness in the sunflower rhizosphere and its bulk soil samples.
Figure 2.
Rarefaction curve showing species richness in the sunflower rhizosphere and its bulk soil samples.

Figure 3.
Classification of the most abundant phyla observed using shotgun metagenomic sequences in the rhizosphere (R1 and R2) and bulk soil samples (B1 and B2) of two sunflower fields in South Africa, Palmietfontein (R1, B1) and Bloemhof (R2, B2).
Figure 3.
Classification of the most abundant phyla observed using shotgun metagenomic sequences in the rhizosphere (R1 and R2) and bulk soil samples (B1 and B2) of two sunflower fields in South Africa, Palmietfontein (R1, B1) and Bloemhof (R2, B2).

Figure 4.
Classification of the most abundant genus observed using shotgun metagenomic sequences in the rhizosphere (R1 and R2) and bulk soil samples (B1 and B2) of two sunflower fields in South Africa, Palmietfontein (R1, B1) and Bloemhof (R2, B2).
Figure 4.
Classification of the most abundant genus observed using shotgun metagenomic sequences in the rhizosphere (R1 and R2) and bulk soil samples (B1 and B2) of two sunflower fields in South Africa, Palmietfontein (R1, B1) and Bloemhof (R2, B2).

Figure 5.
Principal coordinates analysis (PCoA) for genus derived from rhizosphere (R1 and R2) and bulk soil samples (B1 and B2) in Palmietfontein (R1, B1) and Bloemhof (R2, B2).
Figure 5.
Principal coordinates analysis (PCoA) for genus derived from rhizosphere (R1 and R2) and bulk soil samples (B1 and B2) in Palmietfontein (R1, B1) and Bloemhof (R2, B2).

Figure 6.
PCA of microorganisms RDP (ribosomal database project) classifier at the genus level. The length of the vectors reveals the strength of influence of the microorganisms at both rhizosphere and the bulk soil sample.
Figure 6.
PCA of microorganisms RDP (ribosomal database project) classifier at the genus level. The length of the vectors reveals the strength of influence of the microorganisms at both rhizosphere and the bulk soil sample.

Figure 7.
The gene diversity of the soil sample locations R1, R2, B1, B2 as displayed using principal coordinates analysis (PCoA).
Figure 7.
The gene diversity of the soil sample locations R1, R2, B1, B2 as displayed using principal coordinates analysis (PCoA).

Figure 8.
Canonical correspondence analysis of the microorganisms at the genus level and soil chemical parameters for both sunflower rhizosphere and bulk soil samples.
Figure 8.
Canonical correspondence analysis of the microorganisms at the genus level and soil chemical parameters for both sunflower rhizosphere and bulk soil samples.

Figure 9.
Canonical correspondence analysis (CCA) of the major soil chemical parameters based on soil types (R1, R2, B1, B2) explaining the combined variation of 93.17%.
Figure 9.
Canonical correspondence analysis (CCA) of the major soil chemical parameters based on soil types (R1, R2, B1, B2) explaining the combined variation of 93.17%.

Figure 10.
Circos showing the relative abundance of beneficial functional genes obtained from sunflower rhizosphere (R1, R2) and bulk (B1, B2) soil samples. For circos visualization purpose, we coded the genes with no aliases as follows: Siderophore bacillibactin: bacB; Siderophore enterobactin: entB; ABC Fe3+ siderophore transporter: absT; Iron siderophore receptor protein: isrP; Serine protease: serP; Phosphate solubilization polyphosphate kinase: pppK.


Table 1.
Physicochemical properties of the soil rhizosphere (R1 and R2) and bulk soil samples (B1 and B2) of two sunflower fields in South Africa, Palmietfontein (R1, B1), and Bloemhof (R2, B2).
Table 1.
Physicochemical properties of the soil rhizosphere (R1 and R2) and bulk soil samples (B1 and B2) of two sunflower fields in South Africa, Palmietfontein (R1, B1), and Bloemhof (R2, B2).
| Physicochemical Values | Sample Locations | |||
|---|---|---|---|---|
| R1 | R2 | B1 | B2 | |
| Organic C (%) | 1.77 ± 0.06 a | 0.49 ± 0.08 b | 0.47 ± 0.21 b | 0.98 ± 0.21 c |
| OM (%) | 1.83 ± 0.41 a | 0.62 ± 0.07 b | 0.70 ± 0.05 b | 1.27 ± 0.54 ab |
| N-NH4 (mg kg−1) | 19.67 ± 2.30 a | 16.23 ± 1.73 a | 15.67 ± 2.79 a | 18.37 ± 1.23 a |
| Total C (%) | 1.60 ± 0.29 a | 0.51 ± 0.09 b | 0.52 ± 0.06 b | 1.01 ± 0.07 c |
| Total N (%) | 0.13 ± 0.03 a | 0.05 ± 0.01 b | 0.05 ± 0.01 b | 0.09 ± 0.02 ab |
| pH (H20) | 6.00 ± 0.26 a | 6.50 ± 0.30 a | 6.60 ± 0.35 a | 5.78 ± 0.59 a |
| P3- (mg kg−1) | 19.33 ± 3.47 a | 74.43 ± 10.69 b | 28.31 ± 2.38 ac | 16.95 ± 2.40 ac |
| Ca2+ (mg kg−1) | 536.00 ± 34.51 a | 246.00 ± 13.89 b | 462.00 ± 24.56 c | 385.00 ± 21.79 d |
| K+ (mg kg−1) | 349.00 ± 32.23 a | 220.00 ± 17.00 b | 223.00 ± 41.33 b | 342.00 ± 32.70 a |
| Sand (%) | 72.00 ± 7.00 a | 80.00 ± 9.64 a | 84.00 ± 2.00 a | 72.00 ± 9.85 a |
| Silt (%) | 6.00 ± 1.50 a | 0.00 ± 0.00 b | 0.00 ± 0.00 b | 4.00 ± 1.00 a |
| Clay (%) | 22.00 ± 4.00 a | 20.00 ± 3.40 a | 16.00 ± 0.00 a | 24.00 ± 3.61 a |
Each value is expressed as mean ± standard deviation (n = 3). <a–d> indicates a significant difference in values of samples.
Table 2.
Diversity indices indicating the Simpson, Shannon, and evenness of microorganism at the genus level.
Table 2.
Diversity indices indicating the Simpson, Shannon, and evenness of microorganism at the genus level.
| R1 | R2 | B1 | B2 | p Value | |
|---|---|---|---|---|---|
| Simpson-1-D | 0.6891 | 0.7804 | 0.7137 | 0.6817 | 0.54 |
| Shannon-H | 1.673 | 2.096 | 1.745 | 1.637 | |
| Eveness-e^H/S | 0.2538 | 0.3537 | 0.2604 | 0.2235 |
Table 3.
Diversity indices of the functional genes observed in our R1, R2, B1, B2 metagenomes.
| R1 | R2 | B1 | B2 | p-Value | |
|---|---|---|---|---|---|
| Simpson-1-D | 0.7774 | 0.7841 | 0.7748 | 0.7755 | 0.76 |
| Shannon-H | 2.0110 | 2.0630 | 2.0040 | 2.0030 | |
| Eveness-e^H/S | 0.2576 | 0.2714 | 0.2649 | 0.2646 |
Table 4.
Relative abundance of plant growth functional genes as observed in sunflower rhizosphere (R1, R2) and bulk (B1, B2) soil samples.
Table 4.
Relative abundance of plant growth functional genes as observed in sunflower rhizosphere (R1, R2) and bulk (B1, B2) soil samples.
| Genes | Biological Functions | Aliases | Relative Abundance of Genes | |||
|---|---|---|---|---|---|---|
| R1 | R2 | B1 | B2 | |||
| Nitrogen fixation | Cysteine desulfurase nifS | EC 2.8.1.7 nifS | 94 | 19 | 44 | 69 |
| Cysteine desulfurase sufS | EC 2.8.1.7 sufS | 395 | 211 | 262 | 272 | |
| Nitrogenase (molybdenum-iron) reductase and maturation protein nifH | nifH | 6 | 5 | 1 | 0 | |
| Siderophore | 2,3-dihydro-2,3-dihydroxybenzoate dehydrogenase | EC 1.3.1.28 bacillibactin | 8 | 2 | 1 | 3 |
| 2,3-dihydro-2,3-dihydroxybenzoate dehydrogenase | EC 1.3.1.28 enterobactin | 4 | 4 | 0 | 3 | |
| ABC Fe3+ siderophore transporter | 73 | 112 | 58 | 43 | ||
| Ferric siderophore transport system, biopolymer transport protein exbB | exbB | 146 | 116 | 110 | 103 | |
| Aerobactin siderophore receptor IutA | IutA | 2 | 7 | 3 | 2 | |
| Iron siderophore receptor protein | 9 | 2 | 6 | 10 | ||
| TonB-dependent siderophore receptor | tonB | 176 | 163 | 135 | 161 | |
| ACC deaminase | 1-aminocyclopropane-1-carboxylate deaminase acdS | EC 3.5.99.7 | 599 | 395 | 371 | 400 |
| Exopolysaccharides | Exopolysaccharide biosynthesis glycosyltransferase epsF | epsF EC 2.4.1.- | 80 | 48 | 74 | 80 |
| Exopolysaccharide production protein exoF precursor | exoF | 17 | 3 | 4 | 2 | |
| Exopolysaccharide production protein exoZ | exoZ | 38 | 45 | 24 | 39 | |
| Exopolysaccharide biosynthesis transcriptional activator epsA | epsA | 4 | 3 | 3 | 3 | |
| High-temperature stress response | Protease/chaperone protein htrA | htrA | 1379 | 798 | 874 | 1100 |
| Serine protease, degP/htrA, do-like | degP/htrA EC 3.4.21.- | 246 | 104 | 148 | 151 | |
| Serine protease | EC 3.4.21.- | 78 | 147 | 67 | 52 | |
| Phosphate solubilization | Polyphosphate kinase | EC 2.7.4.1 | 4725 | 2691 | 2966 | 3388 |
| Phosphatase, ppx/gppA family | ppx/gppA | 145 | 108 | 81 | 106 | |
| Heat and cold stress shock | Cold shock protein cspA | cspA | 898 | 557 | 616 | 653 |
| Cold shock protein cspB | cspB | 166 | 63 | 93 | 128 | |
| Cold shock protein cspC | cspC | 456 | 319 | 312 | 341 | |
| Cold shock protein cspD | cspD | 110 | 116 | 77 | 92 | |
| Cold shock protein cspE | cspE | 167 | 75 | 115 | 120 | |
| Cold shock protein cspF | cspF | 18 | 9 | 15 | 21 | |
| Cold shock protein cspG | cspG | 388 | 232 | 226 | 291 | |
| Heat shock protein 60 family chaperone groEL | groEL | 7318 | 4453 | 4977 | 5603 | |
| Heat shock protein 60 family co-chaperone groES | groES | 1409 | 814 | 1016 | 1134 |
Publisher’s Note: MDPI stays neutral with regard to jurisdictional claims in published maps and institutional affiliations. |
© 2021 by the authors. Licensee MDPI, Basel, Switzerland. This article is an open access article distributed under the terms and conditions of the Creative Commons Attribution (CC BY) license (http://creativecommons.org/licenses/by/4.0/).
Share and Cite
MDPI and ACS Style
Alawiye, T.T.; Babalola, O.O. Metagenomic Insight into the Community Structure and Functional Genes in the Sunflower Rhizosphere Microbiome. Agriculture 2021, 11, 167. https://0-doi-org.brum.beds.ac.uk/10.3390/agriculture11020167
AMA Style
Alawiye TT, Babalola OO. Metagenomic Insight into the Community Structure and Functional Genes in the Sunflower Rhizosphere Microbiome. Agriculture. 2021; 11(2):167. https://0-doi-org.brum.beds.ac.uk/10.3390/agriculture11020167
Chicago/Turabian StyleAlawiye, Temitayo Tosin, and Olubukola Oluranti Babalola. 2021. "Metagenomic Insight into the Community Structure and Functional Genes in the Sunflower Rhizosphere Microbiome" Agriculture 11, no. 2: 167. https://0-doi-org.brum.beds.ac.uk/10.3390/agriculture11020167
Note that from the first issue of 2016, this journal uses article numbers instead of page numbers. See further details here.