Article

Land Uses, Altitude and Texture Effects on Soil Parameters. A Comparative Study in Two Districts of Nagaland, Northeast India

1
Division of Silviculture and Forest Management, Rain Forest Research Institute, Jorhat 785001, Assam, India
2
Council for Agricultural Research and Economics, Research Centre for Agriculture and Environment, 00184 Rome, Italy
*
Author to whom correspondence should be addressed.
Submission received: 1 December 2020 / Revised: 12 January 2021 / Accepted: 18 February 2021 / Published: 19 February 2021
(This article belongs to the Section Agricultural Soils)

Abstract

:
Northeast (NE) India is a typical tropical ecosystem with a luxuriant forest vegetation cover, but nowadays forests are under stress due to exploitation and land use changes, which are known to affect soil health and productivity. However, due to a scarcity of data, the influence of land uses and altitude on soil properties of this peculiar ecosystem is poorly quantified. This study presents the changes in soil properties in two districts of Nagaland (Mon and Zunheboto) in relation to land uses (forest, plantation, jhum and fallow jhum), altitude (<500 m, 500–1000 m, >1000 m) and soil texture (coarse, medium, fine). For this, a random soil sampling was performed in both the districts. Results indicated that soil organic carbon (SOC) stocks and available potassium (K) were significantly influenced by land uses in the Mon district, while in Zunheboto a significant difference was observed in available phosphorus (P) content. SOC stocks showed an increasing trend with elevation in both districts. The influence of altitude on P was significant and the maximum concentration was at lower elevations (<500 m). In Mon, soil texture significantly affected SOC stocks and the available N and P content. The variability in soil properties due to land uses, altitudinal gradients and textural classes can be better managed with the help of management options, which are still needed for this ecosystem.

1. Introduction

Forest ecosystems are particularly important for the provision of ecosystem services, like species conservation, preservation of habitat, prevention of soil erosion and capacity to offset climate change impact through carbon sequestration [1,2]. Among the different kinds of forests, tropical forests are more diverse in terms of plant communities [3], but they are under threat and disappearing at the alarming rate of 13.5 million hectares per year globally [4]. The pressure on tropical forests is mainly anthropogenic, since forests are cleared for agricultural purposes [5]. Indeed, the conversion of forests to agricultural land is a common practice in Africa and Asia, contributing to more than 50% of total deforestation [6,7,8].
The northeast (NE) region of India is a biodiversity hotspot and is rich in flora and fauna [9]. Its physiographic position, with a favorable climate and healthy soils, provides suitable conditions for a luxuriant forest growth [10] that is typical of tropical areas, and for having a high biological richness, even on the steep slopes that characterize the region [11]. Forestry is the major land use pattern and covers around 65% of the geographical area in NE India, followed by agricultural land use (16%) [12]. About 86% of the total cultivated area of NE India is under jhum, also known as shifting cultivation, mainly practiced in the hilly areas [13,14]. Currently, jhum cultivation is practiced in 1.47 million ha of the area and serve as a major source of livelihood for 4.44 lakh (1 lakh is equal to one hundred thousand) jhumia families [15]. Jhum cultivation has evolved over millennia, through the knowledge of local peoples to manage the natural resources as a practice to cultivate crops or crop mixtures for household consumption for a couple of years, after slashing and burning a part of forest vegetation, without external inputs of nutrients and adopting minimum tillage operations. Jhum cultivation is also known to aggravate the issues related to soil health degradation, soil organic carbon (SOC) depletion and soil loss by erosion [16,17], due to continuous changes in land use from forest to jhum, jhum to fallow and secondary forest or jhum to plantations [17]. Other important land use changes in NE are the conversion of forests to plantations with profitable cash crops such as tea and rubber [18]. There are number of studies in Nagaland addressing various issues such as the relationship between tree diversity and soil properties [19], the assessment of soil quality in different land uses [20,21,22], the estimation of SOC stocks under different land uses [23], SOC stock mapping at the state level [24] and the dynamics of SOC under jhum and forests using the RothC model [25].
The spatial extent of soil degradation processes is influenced by land management, as well as by topographic factors such as altitude. In particular, soils at a higher altitude have generally higher slopes that trigger soil erosion, with consequent translocation and redeposition of the eroded materials downslope and a change in soil parameters, including texture, along the altitudinal gradient. In addition, land use in Nagaland is driven by the socio-economic needs of local people, that can either grow crops for family consumption or choose more market-oriented and profitable systems such as plantations. Thus, land use in Nagaland can be different among districts, considering that local farmers also adapt the land use to the prominent site factors, particularly soil abiotic factors that govern soil fertility, morphology and altitude, and their activity is spread throughout the village boundaries while keeping in mind the proximity to the village where they live. Consequently, land use also depends on local and site-specific factors.
Considering the multiplicity of the factors driving agriculture in Nagaland, our main objective was to assess their effects on specific soil properties related to soil fertility, and resulting from the complex interactions among land use, altitude gradient, and soil texture.
Therefore, the present study was undertaken in the two districts of Nagaland to study the variations in soil properties, with the following specific objectives: (1) to assess the impact of different land uses on important soil properties, (2) to determine how soil properties are varying along the altitudinal gradient, and (3) to evaluate how soil texture is going to influence the different soil properties.

2. Materials and Methods

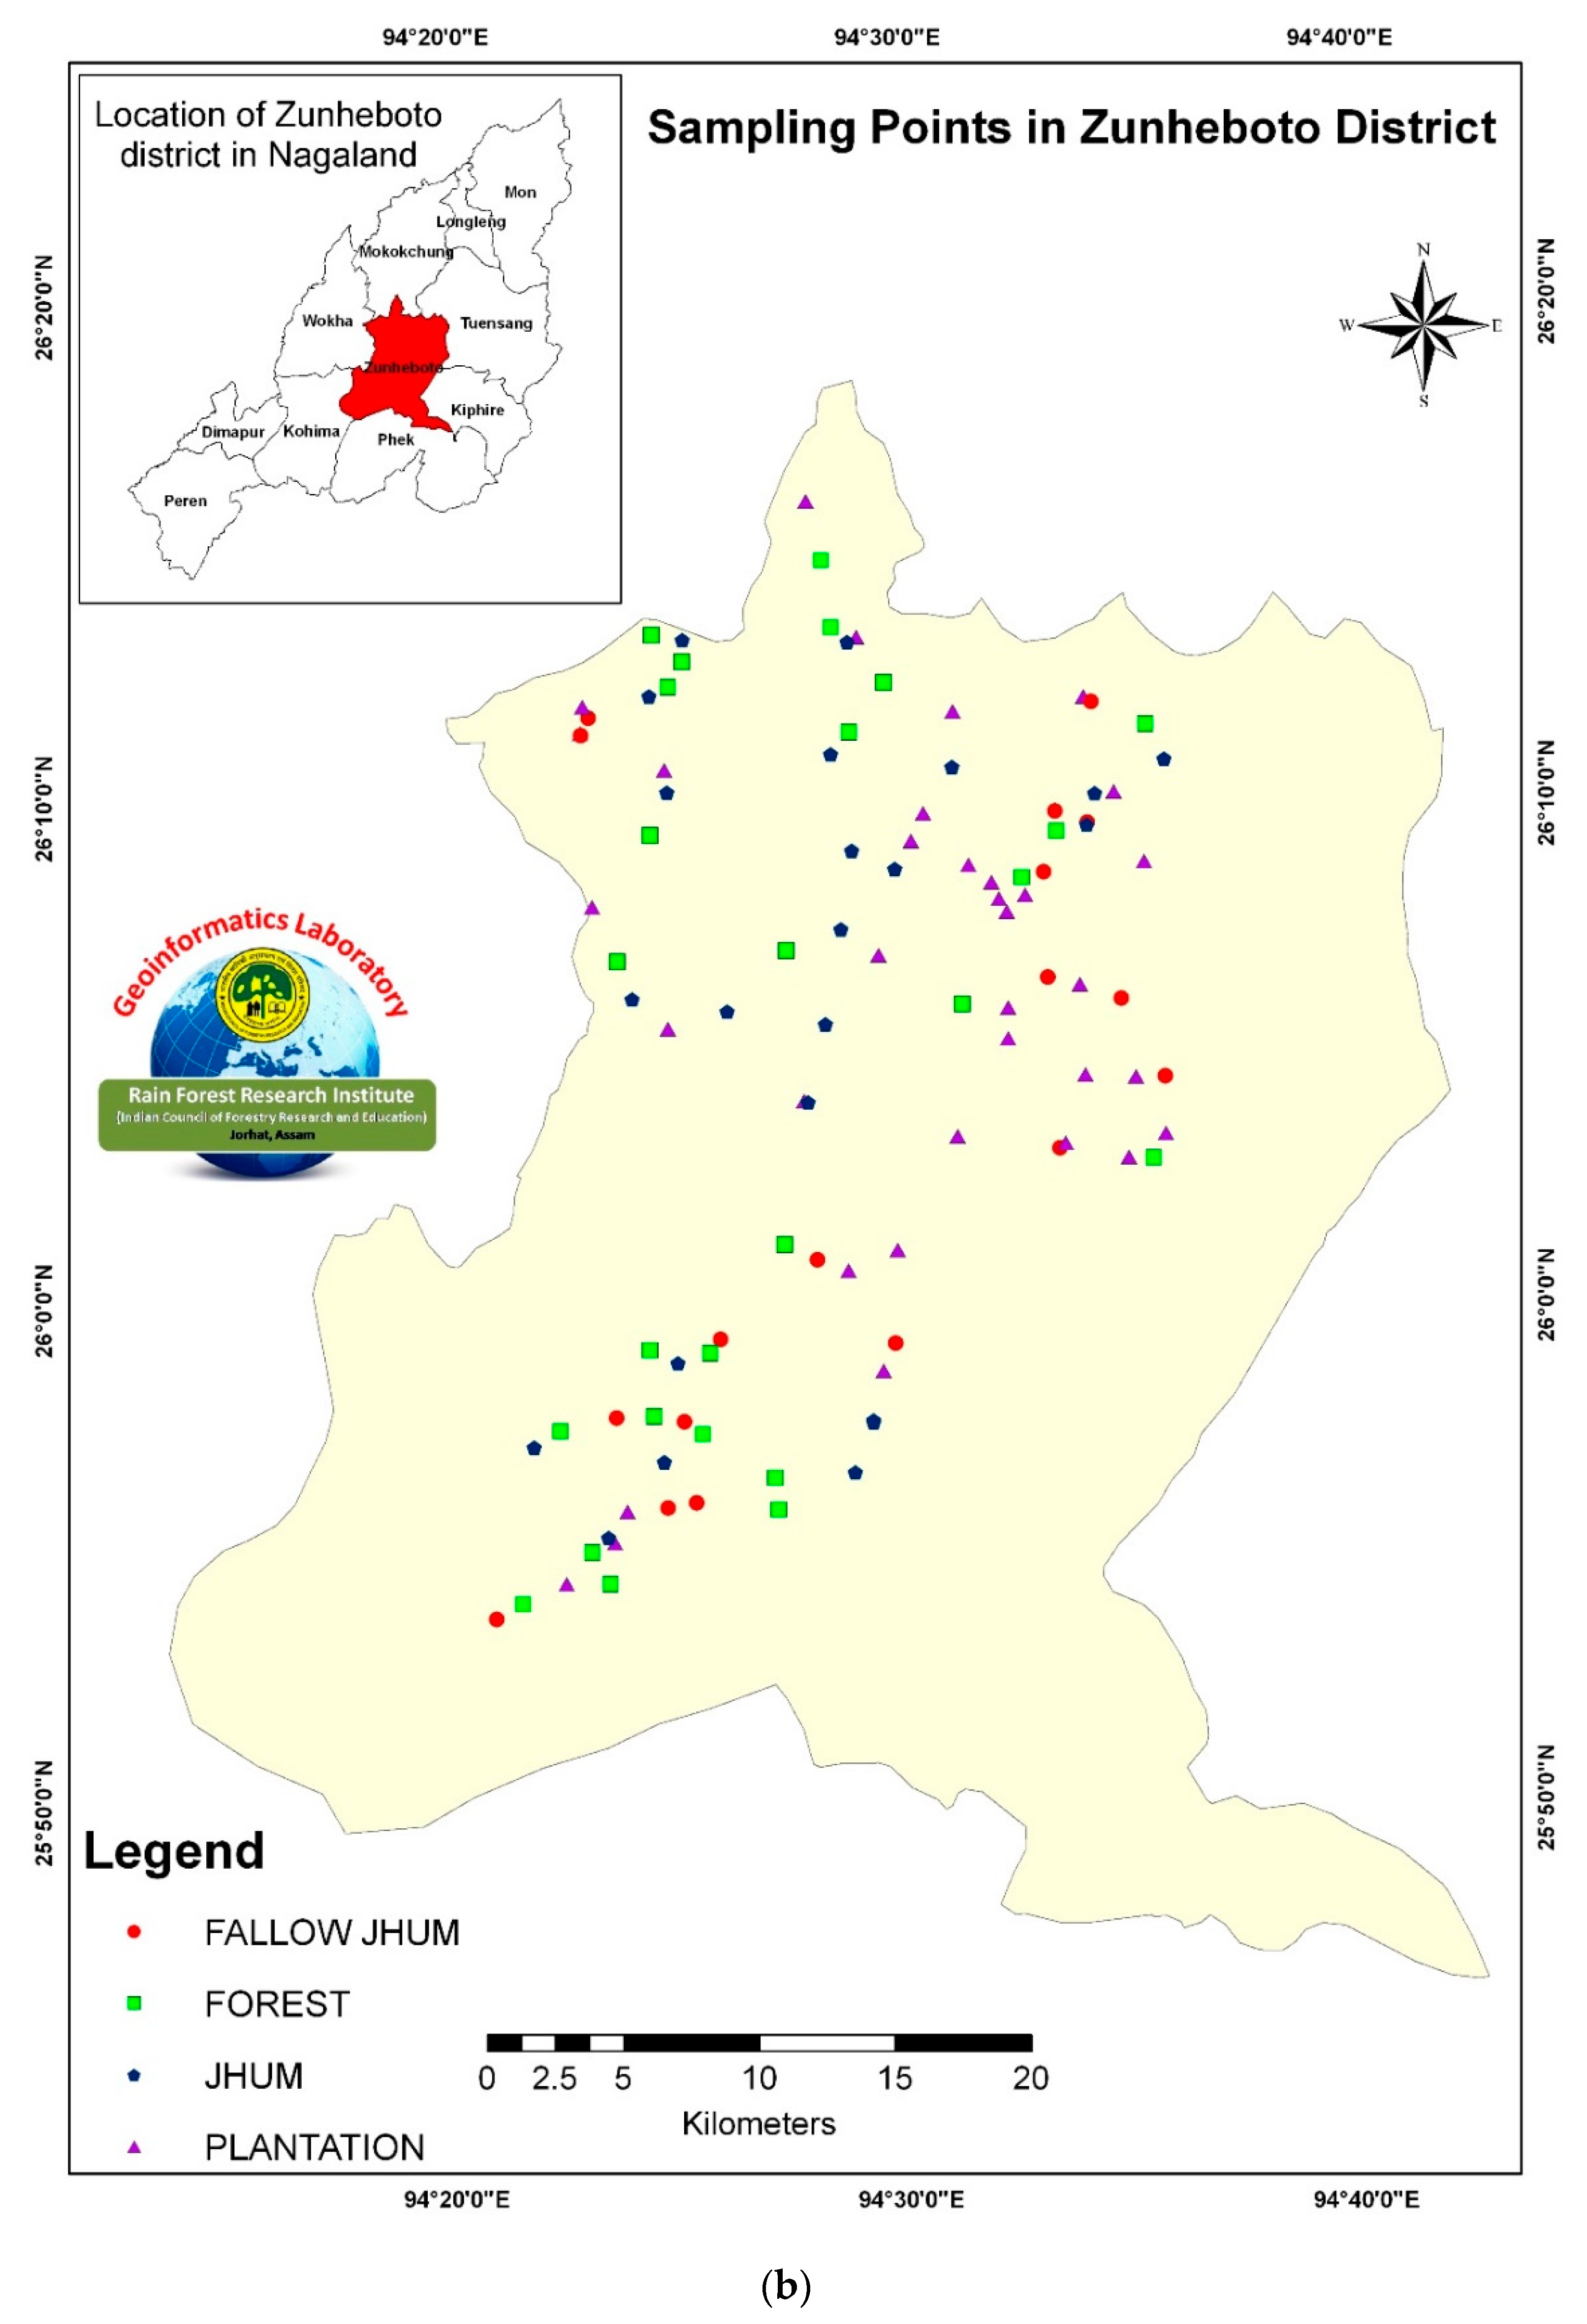
2.1. Study Area and Land Uses

Nagaland state is in the extreme northeast of India, located between 25°10′ N and 27°4′ N Latitude and 93°15′ E and 95°20′ E Longitude, with a geographical area of about 1.66 million ha and an altitudinal variation from 100 m to 3826 m a.s.l. The state is a narrow strip of hilly area running from north east to south west, located in the northern extension of the Arakan Yoma mountain ranges of Myanmar. Nagaland is bounded by Myanmar in the East, Assam in the west and north, Arunachal Pradesh in the North and Manipur in the south, and has eleven districts viz. Kohima, Dimapur, Peren, Phek, Khipre, Tuensang, Zunheboto, Longling, Mon, Mokokchung and Wokha [26]. Land use in the different sites selected for the study (Mon and Zunheboto districts) was forest, plantation, fallow jhum and jhum. Altitude range was 100–1332 m a.s.l. (average 627 m) and 133–1845 m a.s.l. (average 1240 m) in the Mon and Zunheboto districts, respectively. Both districts experience a humid tropical type of climate. In Mon, annual rainfall is 2555 mm and the average temperature is 24.4 °C [27]. In Zunheboto, the annual rainfall is 2340 mm and the average temperature is 21 °C [28]. Soils are mainly Inceptisols and Ultisols [29].
Forest sites were predominantly represented by mixed stands with different forest types (East Himalayan Moist Mixed Deciduous, Assam Subtropical Pine and Secondary Moist Bamboo forests) or pure stands with beechwood (Gmelina arborea) and alder (Alnus nepalensis).
Plantation sites mainly included Khokan (Duabanga grandiflora), teak (Tectona grandis), black cardamom (Amomum subulatum), bamboo (Bambusa sp.), rubber (Hevea brasiliensis) and tea (Camellia sinensis L.). Plantation types differ between the two districts, as bamboo, rubber and tea are cultivated in Mon only, while in Zunheboto plantations are grown mainly for wood exploitation and house heating. Moreover, plantations are grown mainly at lower (<500 m) and higher (>1000 m) altitudes in the Mon and Zunheboto district, respectively. The external input of nutrients in plantations only derive from plant residues.
In fallow jhum sites, the vegetation was typically grasses, herbs and shrubs, the length of the fallow period is variable from 2 to 7 years, no soil management is done, and the vegetation is allowed to regenerate and gradually evolve into a secondary forest. Thereafter, the secondary forest is slashed and burnt, and a new jhum cultivation cycle is started.
Jhum sites were cultivated with rice (Oryza sativa), maize (Zea mays L.) and mixed vegetables, mainly with sweet potato (Ipomoea batatus), tapioca (Manihot esculenta), potato (Solanum tuberosum), and ginger (Zingiber officinale).

2.2. Soil Sampling and Analysis

A total of 205 sites were randomly surveyed in Mon and Zunheboto districts (Figure 1) in 2017–2018. The breakup of sites in terms of land uses, altitude ranges and soil texture are provided in Table 1.
At each site, one quadrat (10 × 10 m) was laid down and five samples (4 at the corners and 1 at the center) were collected at 30 cm soil depth, to make composite samples. In particular, soil samples were collected during the fallow period (with more than 5 years of fallow) in fallow jhum, and the cropping period in jhum.
Collected soil samples were air-dried at room temperature (22 °C) to constant weight, were grounded and passed through a 2-mm sieve to exclude litter, roots and coarse particles. Hydrometer method was used for particle size analysis [30] to evaluate clay, silt and sand contents. Bulk density (BD) was estimated by the core method [31]. Total porosity was calculated from the bulk density assuming a particle density of 2.65 Mg m−3, with the following formula [32]:
Total porosity = [1 − (Bulk density/2.65)] × 100
Texture was considered as coarse (sandy loam, sandy clay loam, loamy sand), medium (clay loam, loam, silty clay loam, silt, silt loam) and fine (clay, silt clay, sandy clay) following USDA methodology [32]. Soil pH was determined in 1:2 soil-water suspensions using a digital pH meter (Systronics System 361). Electrical conductivity (EC) was measured in 1:2.5 soil-water suspensions, with an EC meter (Systronics System 307). Soil organic carbon (SOC), available phosphorus (Av. P), and available nitrogen (Av. N) were determined following the Walkley-Black [33], Bray-Kurtz [34] and Subbiah and Asija [35] methods, respectively.
SOC stocks were calculated with the following equation [18]:
SOC stock = SOC (%) × BD × D
where SOC stock is expressed in Mg C ha−1, SOC (%) is organic carbon concentration, BD is bulk density in Mg m−3 and D is sample depth in cm.
Available potassium (Av. K) and exchangeable cations (Ca, Na, K, and Mg) were estimated by the 1 N ammonium acetate (pH 7.0) method [36]. Cation exchange capacity (CEC) was determined following Sumner and Miller [37] as the sum of exchangeable cations (Na, K, Ca, Mg, and Al). Base saturation (BS) was estimated as the ratio of total bases (excluding Al) to CEC. Exchangeable aluminum (Ex. Al) was extracted with 1N KCl solution and titrated with 0.1N NaOH [38].

2.3. Data Analysis

Descriptive statistics of soil parameters, ANOVA and Spearman Rank Order Correlations were performed with Statistica 8.0 (Statsoft, Tulsa, OK, USA). Differences of soil parameters among land uses, altitude ranges and texture groups were analyzed using One-way ANOVA, since some factors (namely altitude range and texture group) did not have the required degrees of freedom to perform a multifactorial analysis. Significant differences among means (p < 0.05) were evaluated through the Tukey HSD post-hoc test. Spearman Rank Order Correlations were based on 20 soil parameters and altitude, highlighting significant correlations at p < 0.05.

3. Results

3.1. General Soil Parameters

Descriptive statistics regarding the different soil parameters are provided in Table 2. The mean value of sand (50.3%) was higher in Mon, while clay (25.5%) and silt (28.5%) content were highest in the Zunheboto district. Mean value of bulk density (BD) was significantly higher in Mon (0.90 Mg m−3) compared to the Zunheboto district (0.85 Mg m−3), and thus the porosity percentage was significantly higher (67.8%) in Zunheboto. Soils of Zunheboto were significantly less acidic (5.22) in comparison to the Mon district (4.99) and were not-saline (EC = 0.01–0.06 dS m−1) in both districts. A similar mean value of SOC contents (2.19%) was found in both the districts, while SOC stock was highest but not significantly different in Mon (29.33 Mg C ha−1) compared to the Zunheboto district (27.94 Mg C ha−1). The mean values of CEC (10.94 Cmol+ kg−1) and Ex. Mg (1.88 Cmol+ kg−1) were significantly higher in Zunheboto, Ex. Ca (2.03 Cmol+ kg−1) was highest in Zunheboto and Ca:Mg was maximum in Mon (1.23). Moreover, Ex. K (1.77 Cmol+ kg−1) was significantly higher in Zunheboto compared to the Mon district (1.52 Cmol+ kg−1). BS was similar in both districts (about 62%). Ex. Na (0.84 Cmol+ kg−1) and Ex. Al (4.41 Cmol+ kg−1) were higher but not significantly different in the Zunheboto district. Available N (356.4 mg kg−1) content was highest in Mon, while available P (8.19 mg kg−1) and K (38.72 mg kg−1) were maximum in the Zunheboto district, respectively, but differences were not significant.

3.2. Effect of Land Use, Altitude and Texture on Soil Parameters

SOC stock was affected by different land uses in the Mon district only (Table 3). The maximum value of SOC stock was under forests (32.56 Mg C ha−1), followed by jhum (29.71 Mg C ha−1), which was statistically similar to plantation soils (29.55 Mg C ha−1), respectively. There were no significant effect of land uses on available N in both the districts, and on available P in Mon district. The highest value of available P in Zunheboto was found in plantation sites (8.77 mg kg−1), while fallow jhum (8.31 mg kg−1) was statistically similar to jhum (7.94 mg kg−1) and the lowest value was found under forest soils (7.53 mg kg−1). Available K was found to be significantly influenced by the different land uses in the Mon district only, with the highest value in jhum sites (47.91 mg kg−1) and similar values in plantations (31.08 mg kg−1) and fallow jhum (31.04 mg kg−1). The lowest value of available K was found under forest soils (24.50 mg kg−1).
The data regarding the effect of different altitudes on soil properties are presented in Table 4. There was no significant influence of altitude on SOC stocks in both the districts. Available N was found to be significantly affected by the different altitudes in the Mon district and the highest N content (427.99 mg kg−1) was found at lower elevations (<500 m). The lowest N values were found at intermediate (500–1000 m) and higher (>1000 m) elevations and were statistically similar to each other (278.48 and 324.59 mg kg−1, respectively). Available P was affected by different altitudes in both the districts. In the Mon district, the lowest (7.07 mg kg−1) value of available P was found at a higher elevation (>1000 m), which was not statistically different compared to intermediate (7.11 mg kg−1) altitudes (500–1000). The highest value of available P was found at lower elevations (<500 m) in both the districts (9.30 mg kg−1 in Mon and 8.78 mg kg−1 in Zunheboto). Significant differences in available K values were found in the Zunheboto district only, and maximum and minimum values were recorded at lower (53.66 mg kg−1) and intermediate (27.99 mg kg−1) elevations, respectively.
SOC stock was significantly affected by textural classes in the Mon district only (Table 5). Maximum and minimum values of SOC stock were found under fine (27.88 Mg C ha−1) and medium (31.55 Mg C ha−1) textured soils. In both the districts, available N was found to be affected by the different textural classes and the highest values were found in medium textured soils (391.50 mg kg−1) in Mon and in coarse textured soils (422.07 mg kg−1) in Zunheboto. The maximum value of available P (11.94 mg kg−1) was found in the fine textured soils of Mon district and the minimum value of available P (7.33 mg kg−1) was found in coarse textured soil of the Mon district. Finally, there was no significant effect of textural classes on available K in both the districts.
In the Mon district, plantation is the most common land use at altitude <500 m, and soil texture is mainly medium. In the 500–1000 m altitude range, plantations, jhum and fallow jhum are equally represented, and soil texture is medium. In the >1000 m altitude range, all land uses are almost equally represented except for fallow jhum, and soil texture is medium. In the Zunheboto district, only forest and plantation land uses are present at altitude <500 m, and soil texture is coarse and medium. In the 500–1000 m altitude range, all land uses are almost equally represented except for fallow jhum, and the soil texture is mainly medium. In the >1000 m altitude range all land uses are almost equally represented and soil texture is mainly coarse and medium.

3.3. Correlation among Soil Parameters

Spearman correlation results are presented in supplementary Tables S1 and S2. In the Mon district, SOC stock was significantly positively correlated with altitude (r = 0.37), clay (r = 0.38), EC (r = 0.23) CEC (r = 0.29), Ex. Al (r = 0.35) and available P (r = 0.19), and negatively correlated with sand (r = −0.30) and BS (r = −0.32). In the Zunheboto district, SOC stock was negatively correlated with altitude (r = −0.20), porosity (r = −0.28), Ex. Ca (r = −0.24), Ex. Mg (r = −0.25) and BS (r = −0.29), positively correlated with BD (r = 0.28), CEC (r = 0.28) and Ex. Al (r = 0.21) and no significant correlation was found with clay and sand.
Moreover, in Mon, altitude was negatively correlated with silt (r = −0.30), porosity (r = −0.28), available N (r = −0.24) and P (r = −0.38), and positively correlated with sand (r = 0.25), BD (r = 0.28), pH (r = 0.50), EC (r = 0.41), Ex. Na (r = 0.40) and Ex. K (r = 0.27). In the Zunheboto district, a significant negative correlation of altitude was found with BD (r = −0.33), and positive correlations with sand (r = 0.20), porosity (r = 0.33), available P (r = 0.35) and K (r = 0.36).
In Mon, clay was positively correlated with silt (r = 0.21), porosity (r = 0.29), CEC (r = 0.36), Ex. Al (r = 0.43), SOC stock (r = 0.38), available N (r = 0.31) and available P (r = 0.28); negatively correlated with sand (r = −0.72), BD (r = −0.29) and BS (r = −0.40). In Zunheboto, results indicated a significant negative correlation between clay and sand (r = −0.71), pH (r = −0.43), Ca:Mg (r = −0.30), Ex. K (r = −0.26), BS (r = −0.20) and available K (r = −0.20) and a significant positive correlation of clay with CEC (r = 0.39) and Ex. Mg (r = 0.24). In both districts, BS showed a significant negative correlation with clay (r = −0.40–0.20), SOC stocks (r = −0.32–0.29), CEC (r = −0.53–0.61) and Ex. Al (r = −0.93–0.94).

4. Discussion

Differences in soil parameters have been found in both the districts. In the case of textural components, the variations can be due to weathering, erosion, deposition, and soil forming processes [39] and in our case these processes can be enhanced by the high total rainfall coupled with high mean temperatures. In addition, changes in soil texture are due to anthropogenic factors such as cultivation management [40]. The variation in BD may occur for various reasons, such as altitudinal variations in BD [41] or an inverse relationship with SOC and vice versa [42,43,44]. The acidic nature of soil in both the districts is either due to the high rainfall in NE region, which causes the leaching of basic cations from soil colloids, or to the slow decomposition of organic matter, with a continuous release of low molecular acids, which might be another reason for the acidic nature of these soils [45]. The variation observed in CEC, exchangeable cations and BS in the studied districts, may be attributed to a combination of intrinsic (weathering, erosion, deposition and soil-forming processes) or local extrinsic (anthropogenic practices) factors [46]. Cation exchange capacity (CEC) was low in both districts, due to the presence of low-activity clay (kaolinite), and soil mineralogy highly affecting CEC [47]. In both the Mon and Zunheboto districts, positive significant correlations of CEC were found with SOC stocks (0.29 and 0.28, respectively), clay (0.36 and 0.39, respectively), silt (0.22 and 0.24, respectively), Ex. Mg (0.32 and 0.33, respectively), Ex. Al (0.77 and 0.84, respectively) and Av. P (0.33 and 0.22, respectively). CEC was significantly negatively correlated with sand (−0.34 and −0.38, respectively) and BS (−0.53 and −0.61, respectively). BS showed positive significant correlations with sand (0.39 and 0.20, respectively) and pH (0.57 and 0.27, respectively), and was significantly negatively correlated with clay (−0.40 and −0.30, respectively), SOC stocks (−0.32 and −0.29, respectively), CEC (−0.53 and −0.61, respectively) and Ex. Al (−0.94 and −0.93, respectively). Moreover, in the Mon district, Ex. Al was significantly and positively correlated with clay (0.43) and silt (0.27), and in both districts with SOC stocks (0.35 and 0.21, respectively) and CEC (0.77 and 0.84, respectively). These correlations are supported by other research reporting that particle size distribution, pH and SOC are the main drivers of CEC, BS and Ex. Al in soils [48,49,50].
SOC stocks ranked in the order forest > jhum > plantation > fallow jhum in the Mon district, forest > fallow jhum > plantation > jhum in Zunheboto district (Table 2). Additionally, SOC stocks were higher in the Mon district in all the land uses, except for fallow jhum, probably due to soil texture, which is prevalently medium, and to the higher mean temperature (24.4 °C) of sites in the Mon district that might enhance plant growth and result in higher carbon inputs returned to the soil. The higher altitude and the lower mean temperature (21 °C) of Zunheboto sites could explain the higher SOC stock in fallow jhum, that could have enhanced SOC accumulation [51] and the establishment of a semi-natural vegetation, a precursor of the development of a secondary forest after the abandonment of the jhum field, since altitude may affect the amount of sunlight that vegetation receives and the amount of water that plants can absorb [52]. In fact, SOC stocks in forest and fallow jhum of Zunheboto sites are similar (29.54 vs. 29.44 Mg C ha−1, respectively).
Sites under plantation land use showed lower but not significantly different SOC stocks than forest sites, by 9.2% in the Mon and 5.4% in the Zunheboto district, respectively. However, Mishra et al. [18] reported that SOC stocks increase with plantation age for a period up to 40 years for tea plantations, and thus SOC can further increase with time, while SOC stocks decrease in rubber when the plantation is mature. Thus, plantation type and age are important factors to consider; however it was not possible to collect relevant information about plantation age during the soil survey.
In relation to sites under jhum cultivation, SOC stocks were not significantly different compared to forest sites, representing the natural vegetation, but were lower by 8.8% and 17.2% in the Mon and Zunheboto districts, respectively. Other research in the NE India, e.g., Choudhury et al. [9], reported that jhum cultivation showed 22% less SOC stock than the dense forests, but only 9% less that the open forests. Similarly, Mishra et al. [21] showed that in Nagaland, SOC stocks were 17.2% lower in jhum than in forest sites.
Among soil nutrients, jhum sites showed considerably higher contents in available K, deriving from the ash left on the field following the burning of forest vegetation after clearing. In addition, the content in available N in jhum sites was not significantly different compared to the other land uses in both districts, indicating that jhum cultivation for a short period (e.g., 2 years) with no inputs from fertilizers can be sustainable, considering the population increase, and the consequent increase in the demand for food in NE India [21].
The effects of altitude and texture on soil parameters are somehow biased by the random sampling, which resulted in a low number of soil samples for the altitude range < 500 m in Zunheboto district and for the fine texture in the Mon district. Notwithstanding this limitation, data have an increasing trend of SOC stocks with altitude in both districts, and available N and P were significantly higher at the lower altitude range in the Mon district. While nutrient contents are mainly driven by the specific land uses, higher SOC stocks at higher altitudes are mainly a consequence of the decreasing temperature and the increasing rainfall that results in a decreased SOC decomposition at high altitude sites [53,54].
In relation to soil texture groups, SOC stocks were higher in medium textured soils in both districts, as a consequence also of the higher sampling points of this class (37 and 53 sampling points in the Mon and Zunheboto districts, respectively). The effects of soil texture on nutrient contents in the two districts are likely more dependent on the specific land uses and the complexity of the ecosystems [55], but generally SOC stock are higher when soil texture is fine and medium [56].
Sustainable and site-specific land management must be promoted in tropical environments considering that land use changes are rapidly occurring [57]. Current management in plantations and jhum sites is as “organic like” cultivation that totally relies on the return of crop residues to the soil. However, it is also possible that local smallholders use some residues for other purposes such as fuel for household heating (e.g., trimmed branches of tea plantations), building shelters, feeding animals, etc. In the case of jhum cultivation, farmers harvest the edible part of the crop, and leave the residues on the soil with the coupled effect of enhancing soil fertility and protecting the hilly slopes from soil erosion. Sometimes, more crops are grown together in the same jhum field in intercropped systems.
Jhum and fallow jhum land uses are strictly interconnected, since jhum fields are cultivated for a variable period of time by local farmers and are thereafter left to fallow with the regeneration of new vegetation progressively similar to a forest (secondary forest). Fallow jhum fields can also show SOC stocks remarkably similar to a primary forest if the vegetation is allowed to regrow for a long period of time before a new jhum cultivation is started. In this sense, Mishra et al. [18] indicated that local farmers in NE India can benefit in terms of productivity and profitability when adopting a fallow period of 7 years to allow the vegetation regeneration followed by 2 years of jhum cultivation.
A main difference between the districts is plantation distribution with altitude. In Mon, plantations are more present at lower (<500 m) altitudes, in Zunheboto at higher altitudes (>1000 m). In addition, bamboo, rubber and tea plantations are only cultivated in the Mon district, whilst in Zunheboto these types of plantations are not present but existing plantations are specific for wood exploitation and for heating the houses of local villages, indicating that plantation land-use is more specialized and market-oriented in the Mon district. Consequently, SOC stocks in the Mon district were significantly lower in plantation systems compared to forest sites, but they did not differ in the Zunheboto district. Indeed, SOC showed an increasing trend with altitude in both districts. Sites located at higher elevations were mainly associated with a medium texture in the Mon district and a coarse texture in Zunheboto, indicating that translocation and redeposition processes undermining soil quality status are more relevant in the Zunheboto district.

5. Conclusions

This study has addressed the changes in soil properties as affected by land use and altitude gradients and soil texture in two districts of the Northeast region of India (Nagaland state).
Based on the results, we suggest that changes in soil properties can be better managed with the help of management options, which are still needed to preserve this peculiar tropical ecosystem. In particular, the adoption and promotion of best management options can be required for plantations and jhum land uses for climate change mitigation and erosion control, with the perspective to increase SOC stocks and overall soil quality. To increase commercialization opportunities and profits of smallholders, plantations are the best options, but plantation type and age must be considered for higher environmental benefits from a long-term perspective. Long periods of jhum cultivation must be avoided, adopting longer fallow periods to prevent SOC and nutrient depletion and support the increasing demand for food. In addition, adopting terracing of jhum land in wet rice-based farming systems, introducing short-duration crops after rice fallow to avoid continuous rice systems, and agroforestry and horticulture-based farming systems are particularly important management measurements.

Supplementary Materials

The following are available online at https://0-www-mdpi-com.brum.beds.ac.uk/2077-0472/11/2/171/s1, Table S1: Spearman Rank Order Correlations, Mon district, Table S2: Spearman Rank Order Correlations, Zunheboto district.

Author Contributions

Conceptualization, funding acquisition, field investigation, laboratory analyses, G.M.; data elaboration, R.F.; writing—original draft preparation, writing—review and editing, G.M., R.F. All authors have read and agreed to the published version of the manuscript.

Funding

This research was funded by the Indian Council of Forestry Research and Education, Dehradun (India) through grant number RFRI/2015-15/SFM-2.

Data Availability Statement

The data presented in this study are available on request from the corresponding author.

Acknowledgments

The authors are thankful to the Department of Environment, Forest and Climate Change, Government of Nagaland for their support during the field visits and data collection. We greatly acknowledge the help, support and cooperation received from Rain Forest Research Institute, Jorhat, Assam, in completing the study.

Conflicts of Interest

The authors declare no conflict of interest. The funders had no role in the design of the study; in the collection, analyses, or interpretation of data; in the writing of the man-uscript, or in the decision to publish the results.

References

  1. Basu, P. A green investment. If growing forest in India can generate lucrative carbon credits, then why isn’t everyone planting trees? Nat. News 2009, 457, 144–146. [Google Scholar] [CrossRef] [Green Version]
  2. Rahman, M.; Islam, M.; Islam, R.; Sobuj, N.A. Towards Sustainability of Tropical Forests: Implications for Enhanced Carbon Stock and Climate Change Mitigation. J. Forest. Environ. Sci. 2017, 33, 292–299. [Google Scholar]
  3. Saikia, P.; Deka, J.; Bharali, S.; Kumar, A.; Tripathi, O.P.; Singha, L.B.; Dayanandan, S.; Khan, M.L. Plant diversity patterns and conservation status of eastern Himalayan forests in Arunachal Pradesh, Northeast India. For. Ecosyst. 2017, 4, 28. [Google Scholar] [CrossRef] [Green Version]
  4. Kobayashi, S. Landscape rehabilitation of degraded tropical forest ecosystems. For. Ecol. Manag. 2004, 201, 13–22. [Google Scholar] [CrossRef]
  5. Center for Global Development. 2014. Available online: https://www.cgdev.org/publication/ecosystem-services-tropical-forests-review-current-science-working-paper-380 (accessed on 21 October 2020).
  6. FAO. Shifting cultivation. Unasylva 1957, 11, 9–11. [Google Scholar]
  7. Chaplot, V.; Bouahom, B.; Valentin, C. Soil organic carbon stocks in Laos: Spatial variations and controlling factors. Glob. Chang. Biol. 2010, 16, 1380–1393. [Google Scholar] [CrossRef]
  8. Grogan, P.; Lalnunmawia, F.; Tripathi, S.K. Shifting cultivation in steeply sloped regions: A review of management options and research priorities for Mizoram state, Northeast India. Agrofor. Syst. 2012, 84, 163–177. [Google Scholar] [CrossRef]
  9. Choudhury, B.U.; Fiyaz, A.R.; Mohapatra, K.P.; Ngachan, S. Impact of land uses, agrophysical variables and altitudinal gra-dient on soil organic carbon concentration of North Eastern Himalayan Region of India. Land Degrad. Dev. 2016, 27, 1163–1174. [Google Scholar] [CrossRef]
  10. Sharma, P.; Deka, D.; Saikia, R. An analysis of changing land use pattern and its effect on Umtrew Basin, Northeast India. Hung. Geogr. Bull. 2011, 60, 67–78. [Google Scholar]
  11. Choudhury, B.U.; Mohapatra, K.P.; Das, A.; Das, P.T.; Nongkhlaw, L.R.; Fiyaz, A.; Ngachan, S.V.; Hazarika, S.; Rajkhowa, D.J.; Munda, G.C. Spatial variability in distribution of organic carbon stocks in the soils of North East India. Curr. Sci. 2013, 104, 604–614. [Google Scholar]
  12. Saha, R.; Chaudhary, R.S.; Somasundaram, J. Soil Health Management under Hill Agroecosystem of North East India. Appl. Environ. Soil Sci. 2012, 2012, 1–9. [Google Scholar] [CrossRef] [Green Version]
  13. Patel, T.; Karmakar, S.; Sanjog, J.; Kumar, S.; Chowdhury, A. Socio-economic and environmental changes with transition from shifting to settled cultivation in North-Eastern India: An ergonomics perspective. Int. J. Agric. Sci. Res. 2013, 3, 117–136. [Google Scholar]
  14. Yadav, P. Slash-and-Burn Agriculture in North-East India. Expert Opin. Environ. Biol. 2013, 2, 1–4. [Google Scholar] [CrossRef]
  15. Baruah, U.; Bandyopadhyay, S.; Reza, S.K. Land use planning and strategic measures in North Eastern Region of India. Agropedology 2014, 24, 292–303. [Google Scholar]
  16. Salehi, A.; Wilhelmsson, E.; Söderberg, U. Land cover changes in a forested watershed, southern Zagros, Iran. Land Degrad. Dev. 2008, 19, 542–553. [Google Scholar] [CrossRef]
  17. Chase, P.; Singh, O.P. Soil nutrients and fertility in three traditional land use systems of Khonoma, Nagaland, India. Resour. Environ. 2014, 4, 181–189. [Google Scholar]
  18. Mishra, G.; Giri, K.; Jangir, A.; Francaviglia, R. Projected trends of soil organic carbon stocks in Meghalaya state of Northeast Himalayas, India. Implications for a policy perspective. Sci. Total Environ. 2020, 698, 134266. [Google Scholar] [CrossRef] [PubMed]
  19. Mishra, G.; Das, P.K.; Borah, R.; Dutta, A. Investigation of phytosociological parameters and physico-chemical properties of soil in tropical semi-evergreen forests of Eastern Himalaya. J. For. Res. 2016, 28, 513–520. [Google Scholar] [CrossRef]
  20. Singh, A.K.; Bordoloi, L.J.; Kumar, M.; Hazarika, S.; Parmar, B. Land use impact on soil quality in eastern Himalayan region of India. Environ. Monit. Assess. 2013, 186, 2013–2024. [Google Scholar] [CrossRef] [PubMed]
  21. Mishra, G.; Marzaioli, R.; Giri, K.; Borah, R.; Dutta, A.; Jayaraj, R. Soil quality assessment under shifting cultivation and forests in Northeastern Himalaya of India. Arch. Agron. Soil Sci. 2017, 63, 1355–1368. [Google Scholar] [CrossRef]
  22. Mishra, G.; Marzaioli, R.; Giri, K.; Pandey, S. Soil quality assessment across different stands in tropical moist deciduous forests of Nagaland, India. J. For. Res. 2019, 30, 1479–1485. [Google Scholar] [CrossRef]
  23. Mishra, G.; Giri, K.; Das, J. Carbon stock assessment in changing land uses of Mon, Nagaland: An important learning for climate change mitigation from North East India. Curr. Sci. 2019, 116, 174–175. [Google Scholar]
  24. Mishra, G.; Gorai, A.K. Horizontal and vertical profiling of soil organic carbon stock in Nagaland, North East India. Curr. Sci. 2020, 119, 632–640. [Google Scholar]
  25. Mishra, G.; Jangir, A.; Francaviglia, R. Modeling soil organic carbon dynamics under shifting cultivation and forests using Rothc model. Ecol. Model. 2019, 396, 33–41. [Google Scholar] [CrossRef]
  26. Government of Nagaland. Nagaland State Action Plan on Climate Change. Available online: http://moef.gov.in/wp-content/uploads/2017/09/Nagaland.pdf (accessed on 29 November 2020).
  27. Department of Planning and Coordination. District Census Handbook, Mon; Government of Nagaland: Kohima, India, 2011; p. 259.
  28. Department of Planning and Coordination. District Human Development Report—Zunheboto; Government of Nagaland: Kohima, India, 2014; p. 203.
  29. Soil Survey Staff. Keys to Soil Taxonomy; United States Department of Agriculture, Natural Resources Conservation Service: Washington, DC, USA, 2008.
  30. Gee, G.W.; Bauder, J.W. Particle-size Analysis. In Methods in Biogeochemistry of Wetlands; Wiley: Hoboken, NJ, USA, 2018; pp. 383–411. [Google Scholar]
  31. Blake, G.R.; Hartge, K.H. Bulk density. In Methods in Biogeochemistry of Wetlands; Wiley: Hoboken, NJ, USA, 2018; pp. 363–375. [Google Scholar]
  32. USDA, Natural Resources Conservation Service. Soil Survey Laboratory Methods Manual. In Soil Survey Investigations Report No. 42, Version 4.0; National Soil Survey Center: Lincoln, NE, USA, 2004; p. 1031. [Google Scholar]
  33. Walkley, A.; Black, I.A. An examination of the Degtjareff method for determining soil organic matter and a proposed modi-fication of the chromic acid titration method. Soil Sci. 1934, 37, 29–38. [Google Scholar] [CrossRef]
  34. Bray, R.H.; Kurtz, L.T. Determination of total, organic and available forms of phosphorus in soils. Soil Sci. 1945, 59, 39–46. [Google Scholar] [CrossRef]
  35. Subbiah, B.; Asija, C.L. A rapid procedure for the estimation of available nitrogen in soils. Curr. Sci. 1956, 25, 256–260. [Google Scholar]
  36. Schollenberger, C.J.; Simon, R.H. Determination of exchange capacity and exchangeable bases in soil—Ammonium acetate method. Soil Sci. 1945, 59, 13–24. [Google Scholar] [CrossRef]
  37. Sumner, M.E.; Miller, W.P. Cation Exchange Capacity and Exchange Coefficients; SSSA Book Series; Sparks, D.L., Page, A.L., Helmke, P.A., Loeppert, R.H., Soltanpour, P.N., Tabatabai, M.A., Johnston, C.T., Sumner, M.E., Eds.; Soil Science Society of America: Madison, WI, USA, 2018; pp. 1201–1229. [Google Scholar]
  38. McLean, E.O. Aluminum. In Methods of Soil Analysis Part 2, Chemical Methods; Black, C.A., Ed.; Soil Society of Agronomy: Madison WI, USA, 1965; pp. 978–998. [Google Scholar]
  39. Rao, P.; Wagenet, R.J. Spatial Variability of Pesticides in Field Soils: Methods for Data Analysis and Consequences. Weed Sci. 1985, 33, 18–24. [Google Scholar] [CrossRef]
  40. Mishra, G.; Das, J.; Sulieman, M. Modelling Soil Cation Exchange Capacity in Different Land-Use Systems using Artificial Neural Networks and Multiple Regression Analysis. Curr. Sci. 2019, 116, 2020–2027. [Google Scholar] [CrossRef]
  41. Hanawalt, R.B.; Whittaker, R.H. Attitudinally coordinated patterns of soils and vegetation in-the San Jacinto Mountains. California. Soil Sci. 1976, 121, 114–124. [Google Scholar] [CrossRef]
  42. Post, W.M.; Kwon, K.C. Soil carbon sequestration and land-use change: Processes and potential. Glob. Change Biol. 2000, 6, 317–327. [Google Scholar] [CrossRef] [Green Version]
  43. Prevost, M. Predicting soil properties from organic matter content following mechanical site preparation of forest soils. Soil Sci. Soc. Am. J. 2004, 68, 943–949. [Google Scholar] [CrossRef]
  44. Mestdagh, I.; Lootens, P.; Van Cleemput, O.; Carlier, L. Variation in organic-carbon concentration and bulk density in Flemish grassland soils. J. Plant Nutr. Soil Sci. 2006, 169, 616–622. [Google Scholar] [CrossRef]
  45. De Hann, S. Organic Matter Studies; International Atomic Energy Agency: Vienna, Austria, 1977; Volume 1, pp. 21–30. [Google Scholar]
  46. Vasu, D.; Singh, S.K.; Ray, S.K.; Duraisami, V.P.; Tiwary, P.; Chandran, P.; Nimkar, A.M.; Anantwar, S.G. Soil quality index (SQI) as a tool to evaluate crop productivity in semi-arid Deccan plateau, India. Geoderma 2016, 282, 70–79. [Google Scholar] [CrossRef]
  47. Nayak, D.C.; Gangopadhyay, S.K.; Sarkar, D.K.; Sen, T.K. Characteristics and classification of some acid soils of lower Su-bansiri district of Arunachal Pradesh. Agropedology 2002, 12, 112–121. [Google Scholar]
  48. Khaledian, Y.; Brevik, E.C.; Pereira, P.; Cerdà, A.; Fattahe, M.A.; Tazikehf, H. Modeling soil cation exchange capacity in mul-tiple countries. Catena 2017, 158, 194–200. [Google Scholar] [CrossRef] [Green Version]
  49. Mukherjee, A.; Zimmerman, A.R. Organic carbon and nutrient release from a range of laboratory-produced biochars and bi-ochar–soil mixtures. Geoderma 2013, 193, 122–130. [Google Scholar] [CrossRef]
  50. Bpk, Y.; Enang, R.; Kome, G.; Van Ranst, E. Exchangeable aluminium and acidity in Acrisols and Ferralsols of the north-west highlands of Cameroon. Geoderma Reg. 2020, 23, e00343. [Google Scholar] [CrossRef]
  51. Jenny, H. The Soil Resource: Origin and behavior. In Ecological Studies; Springer: Berlin/Heidelberg, Germany, 1980; Volume 37, p. 377. [Google Scholar]
  52. Xu, M.; Ma, L.; Jia, Y.; Liu, M. Integrating the effects of latitude and altitude on the spatial differentiation of plant community diversity in a mountainous ecosystem in China. PLoS ONE 2017, 12, e0174231. [Google Scholar] [CrossRef] [PubMed]
  53. Du, B.; Kang, H.; Pumpanen, J.; Zhu, P.; Yin, S.; Zou, Q.; Wang, Z.; Kong, F.; Liu, C. Soil organic carbon stock and chemical composition along an altitude gradient in the Lushan Mountain, subtropical China. Ecol. Res. 2014, 29, 433–439. [Google Scholar] [CrossRef]
  54. Lugo, A.E.; Sanchez, M.J.; Brown, S. Land use and organic carbon content of some subtropical soils. Plant Soil 1986, 96, 185–196. [Google Scholar] [CrossRef]
  55. Grandy, A.S.; Robertson, G.P. Land-Use Intensity Effects on Soil Organic Carbon Accumulation Rates and Mechanisms. Ecosystems 2007, 10, 59–74. [Google Scholar] [CrossRef]
  56. Nichols, J.D. Relation of Organic Carbon to Soil Properties and Climate in the Southern Great Plains. Soil Sci. Soc. Am. J. 1984, 48, 1382–1384. [Google Scholar] [CrossRef]
  57. Tellen, V.A.; Yerima, B.P. Effects of land use change on soil physicochemical properties in selected areas in the North West region of Cameroon. Environ. Syst. Res. 2018, 7, 3. [Google Scholar] [CrossRef] [Green Version]
Figure 1. Sampling points in the two districts of Nagaland: (a) Mon; (b) Zunheboto.
Agriculture 11 00171 g001aAgriculture 11 00171 g001b
Table 1. Land uses, altitude ranges and texture groups in the two districts of Nagaland.
Mon District (n = 103)Zunheboto District (n = 102)
Land usesForestPlantationFallow jhumJhumForestPlantationFallow jhumJhum
1948122426351823
Altitude<500500–1000>1000<500500–1000>1000
46322533465
Texture 1CoarseMediumFineCoarseMediumFine
34372215314
1 coarse, sandy loam, sandy clay loam, loamy sand; medium, clay loam, loam, silty clay loam, silt, silt loam, fine (clay, silt clay, sandy clay).
Table 2. Descriptive statistics of altitude and soil variables for the two districts.
Variable 1Mon District (n = 103)Zunheboto District (n = 102)
MeanMinMaxStd. Dev.MeanMinMaxStd. Dev.
Altitude (m)627a10013324051240b1331845409
Clay (%)22.90.440.98.525.51.557.814.6
Sand (%)50.324.085.212.646.016.094.619.7
Silt (%)26.82.667.59.028.53.473.613.4
BD (Mg m−3)0.90b0.601.190.140.85a0.621.100.10
Porosity (%)65.9a55.177.45.467.8b58.576.64.0
pH5.22b3.616.690.904.99a3.706.590.74
EC (d sm−1)0.0630.0200.2800.0420.0670.0100.2600.056
SOC (%)2.190.624.570.732.190.703.400.57
Stock (Mg C ha−1)29.339.7070.6110.2127.946.8244.097.51
CEC (Cmol+ kg−1)9.71a4.0715.522.5510.94b5.8220.002.71
Ex. Ca (Cmol+ kg−1)1.920.593.960.552.031.253.920.51
Ex. Mg (Cmol+ kg−1)1.65a0.524.100.631.88b0.754.360.66
Ca:Mg1.230.372.090.311.160.382.960.35
Ex. Na (Cmol+ kg−1)0.700.172.340.430.840.173.300.64
Ex. K (Cmol+ kg−1)1.52a0.204.761.021.77b0.434.300.72
BS (%)62.0018.6392.6317.6861.8629.9994.8513.77
Ex. Al (Cmol+ kg−1)3.920.3011.402.474.410.3014.002.42
Av. N (mg kg−1)356.467.9853.3174.8336.5101.2690.9134.2
Av. P (mg kg−1)8.083.6616.252.488.195.1512.041.60
Av. K (mg kg−1)33.797.73147.5925.2538.729.78157.8729.13
1 Different letters in the same row indicate significant differences (p < 0.05).
Table 3. Effect of land use on different soil parameters in the two districts of Nagaland.
Land Uses 1Soil Carbon Stock
(Mg C ha−1)
Available N
(mg kg−1)
Available P
(mg kg−1)
Available K
(mg kg−1)
MonZunhebotoMonZunhebotoMonZunhebotoMonZunheboto
Forest32.56b29.54352.18308.597.997.53a24.50a33.12
Plantation29.55ab27.95369.41343.948.308.77b31.08ab36.99
Jhum29.71ab24.46323.16329.637.957.94ab47.91b46.89
Fallow Jhum22.52a29.44377.91371.167.588.31ab31.04ab39.72
1 Different letters in the same column indicate significant differences (p < 0.05).
Table 4. Effect of altitude on different soil parameters in the two districts of Nagaland.
Altitude Range 1
(m)
Soil Carbon Stock
(Mg C ha−1)
Available N
(mg kg−1)
Available P
(mg kg−1)
Available K
(mg kg−1)
MonZunhebotoMonZunhebotoMonZunhebotoMonZunheboto
<500 227.3124.54427.99b312.729.30b8.78b32.4953.66c
500–100029.2327.21278.48a317.977.11a7.39a30.4827.99a
>100033.1429.62324.59a347.307.07a8.58ab40.4043.64b
1 Different letters in the same column indicate significant differences (p < 0.05); 2 Zunheboto: 3 sampling sites.
Table 5. Effect of texture on different soil parameters in two districts of Nagaland.
Texture
Class 1
Soil Carbon Stock
(Mg C ha−1)
Available N
(mg kg−1)
Available P
(mg kg−1)
Available K
(mg kg−1)
MonZunhebotoMonZunhebotoMonZunhebotoMonZunheboto
Coarse25.02a27.12285.32a422.07b7.33a8.5733.1548.96
Medium31.55b28.38391.50b307.40a8.34ab8.0733.3036.95
Fine 227.88ab27.00391.26b347.44ab11.94b8.1660.1731.82
1 Different letters in the same column indicate significant differences (p < 0.05); 2 Mon: 2 sampling sites.
Publisher’s Note: MDPI stays neutral with regard to jurisdictional claims in published maps and institutional affiliations.

