Greenhouse Gas Emissions Trends and Mitigation Measures in Australian Agriculture Sector—A Review


1
School of Engineering and Technology, Central Queensland University, Melbourne 3000, Australia
2
Centre for Information Systems, Central Queensland University, Brisbane 4000, Australia
3
School of Health, Medical and Applied Science, Central Queensland University, Bundaberg 4670, Australia
4
Institute of Future Farming Systems, Central Queensland University, Bundaberg 4670, Australia
*
Author to whom correspondence should be addressed.
†
These authors contributed equally to this work.
Agriculture 2021, 11(2), 85; https://0-doi-org.brum.beds.ac.uk/10.3390/agriculture11020085
Submission received: 17 November 2020
/
Revised: 8 December 2020
/
Accepted: 15 December 2020
/
Published: 20 January 2021
(This article belongs to the Section Ecosystem, Environment and Climate Change in Agriculture)
Abstract
:Agriculture is an important source of greenhouse gas emissions. It is one of the economic sectors that impacts both directly and indirectly towards climate change which contributes to greenhouse gas emissions. There has been a continuous trend of agricultural greenhouse gas emissions reduction technologies, but any step taken in this direction must not negatively affect farm productivity and economics. For the agriculture sector to achieve reduced GHG emission, climate-smart activities and improved food security will be needed for this sector to become a climate-smart landscape. Climate-smart technologies are effective at targeting inputs to the fields, helping to lower greenhouse gas emissions. This article explores the key sources of carbon emissions within the agriculture sector and reviews efficient ways to GHG emission via Smart Farming technology. Based on the public archive GHG datasets, we have found that livestock farming is the largest GHG emission sector among other agricultural sectors and responsible for of the total emission. Besides, we also show that Queensland is the largest agricultural GHG contributor compared to other states and territories. The article also captures any possible sources within smart farming that may contribute to carbon emissions and suggest ways to reduce GHG emissions. Besides, an Australian-based best management practice approach is discussed to review the emissions reduction strategy based on climate-specific technology to help the farmers and other stakeholders take environmentally-friendly agricultural decisions.
1. Introduction
Since a few thousand years ago, the agriculture sector has seen many revolutions in terms of animal and plant domestication, systematic crop rotation techniques, systematic breeding and the widespread use of man-made fertilizers and pesticides also known as a green revolution. It is recognized that agriculture is the second largest contributor to Australian greenhouse gas (GHG) emissions by [1]. It is estimated that about 35–60% Nitric Oxide (NO) emissions from agriculture sector shall increase by 2030 which is attributed to increased nitrogen content form the use of fertilizer and increased animal manure production [2]. Additionally, methane (CH4) emissions increase with increasing livestock numbers and are expected to rise by 60% between 1990 and 2030 [2,3]. Assuming the above rates of increase in emissions (10–15%) for 2020–2030, agricultural emissions are expected to rise to 8–8.4%, with an average of 8.3 Pg CO2-eq by 2030. The agriculture sector directly relies on natural resources consuming about 70% of global freshwater, while occupying 40% of the global land area. Most conventional methods already in place within agricultural production are often unsustainable, leading to environmental pollution and depletion of the natural resources on which crop production mainly relies. For example, in Asia, due to inappropriate irrigation practices there have been higher methane emissions and salinization, and high use of nitrogen fertilizer has led to harmful greenhouse gas emissions. This makes the agriculture sector a leading source of methane and nitrous oxide (NOx) emissions, a substantial source amount of carbon emissions, and a key driver behind global deforestation. It is safe to say that about 30% of global greenhouse gas emissions are attributed to agriculture and deforestation.
While we focus predominantly on the direct agricultural emissions, it is important to also look at indirect carbon emissions, which arise from within agriculture as well and have known to add to the total estimate of global GHG. Indirect emissions come from the use of farm machinery, fertilizer production and use of pesticides and irrigation. Total global GHG emissions from agriculture sector will be agricultural emissions (5.1–6.1 Pg, 10–12% of total global emissions), land use (5.9 ± 2.9 Pg; 6–17% of total), agri related chemical production/distribution (0.3–0.7 Pg, 0.6–1.4%) and farm operations (including irrigation) (0.1–0.9 Pg, 0.2–1.8% of total global emissions). Agriculture alone is known to have contributed between 16.8% and 32.2%, including land use and direct and indirect emissions [4]. There has been a growing interest in the need for climate-specific smart farming with an awareness of the agricultural sector impacting the climate negatively. As we continue to understand the environmental sector better, the perspective of agriculture as a source of greenhouse gas emissions and environmental pollution seems to be more balanced. Climate-smart farming techniques have shown promise to achieve an increase in productivity, resilience while offering benefits of reduced GHG emissions in many parts of the world [5].
Artificial Intelligence (AI) and Internet of Things (IoT)-based smart farming techniques have been considered as an essential part of agriculture practice restructuring. For instance, to minimize the use of water, fertilizer, and pesticide, a sensor and Internet of things (IoT) based precision agriculture is used to help monitor the minerals, temperature, and moisture level in the soil [6]. This in turn improves and increases yields and minimizes the use of both resources and land. It will streamline the planning of agricultural processes, such as planting seeds, harvesting, fertilizing, and irrigation. This simplification not only increases efficiency but also helps to reduce carbon footprints. Smart farming also helps tackle deforestation by detecting activities like illegal logging currently, accounting for about of all carbon emissions globally [7]. Having mentioned the above advantages of how the agriculture sector has seen revolutions in terms of smart farming, there is also a consideration that building technical components for smart farming themselves requires resources that might have an adverse effect on the planet. For example, there has been a lot of research on energy harvesting for devices used for IoT to get rid of batteries completely or replace them with biodegradable materials. However, consideration should be given to the fact that more efficiency stimulated by internet-based technologies can potentially drive higher levels of production and consumption. It is therefore in the nation’s and society’s interest to understand properly the risks before planning to move to a cleaner society that is fossil-fuel free. Overall, internet-based smart farming technology demonstrates the ability to cut waste, better use farming resources, and reduce carbon emissions. This ensures its deployment within this prominent sector is a largely positive step towards curbing climate change.
2. Motivation
According to the Australian Bureau of Statistics, agriculture is the second-largest GHG emission sector in Australia [1]. There have been a few studies conducted on GHG emissions from the different agricultural sub sectors in Australia. However, the overall picture and map of GHG emissions from the whole agricultural sector is missing. This study shows and provides a complete map of the GHG emission from the different agricultural sectors in Australia. Besides, we discuss the management practice and the role of smart farming in reducing GHG emissions from the agricultural sector.
We collected GHG emissions datasets from the public archive of the Australian Government “Department of Industry, Science, Energy and Resources” [8]. To the best of the author’s knowledge, this is the most vital source of collecting GHG data where most recent records are available. Hence the key motivation of this paper can be listed as below:
- To map the GHG emission trend from the agricultural section in Australia based on open source data sets.
- To explore the GHG mitigation strategies within Australian agricultural sector.
- To review of currently used techniques used within the agriculture sector.
- To suggest practices to help curb the GHG emissions from Australian agriculture.
The sequential workflow hints of this study are as follows. In Section 2, the overall GHG emissions around the world and Australia have been described. In Section 3, according to the GHG emissions data, the contribution from the agricultural sector in Australia has been portrayed. Current conventional technology and techniques ubsed in agriculture described in Section 4. In Section 5, some important practice has been suggested and discussed to minimize GHG reduction in Australia from the agricultural sector. Finally, a conclusion has been drawn by combining all the important points of the study in Section 3, Section 4 and Section 5.
3. Australia’s Greenhouse Gas Emissions
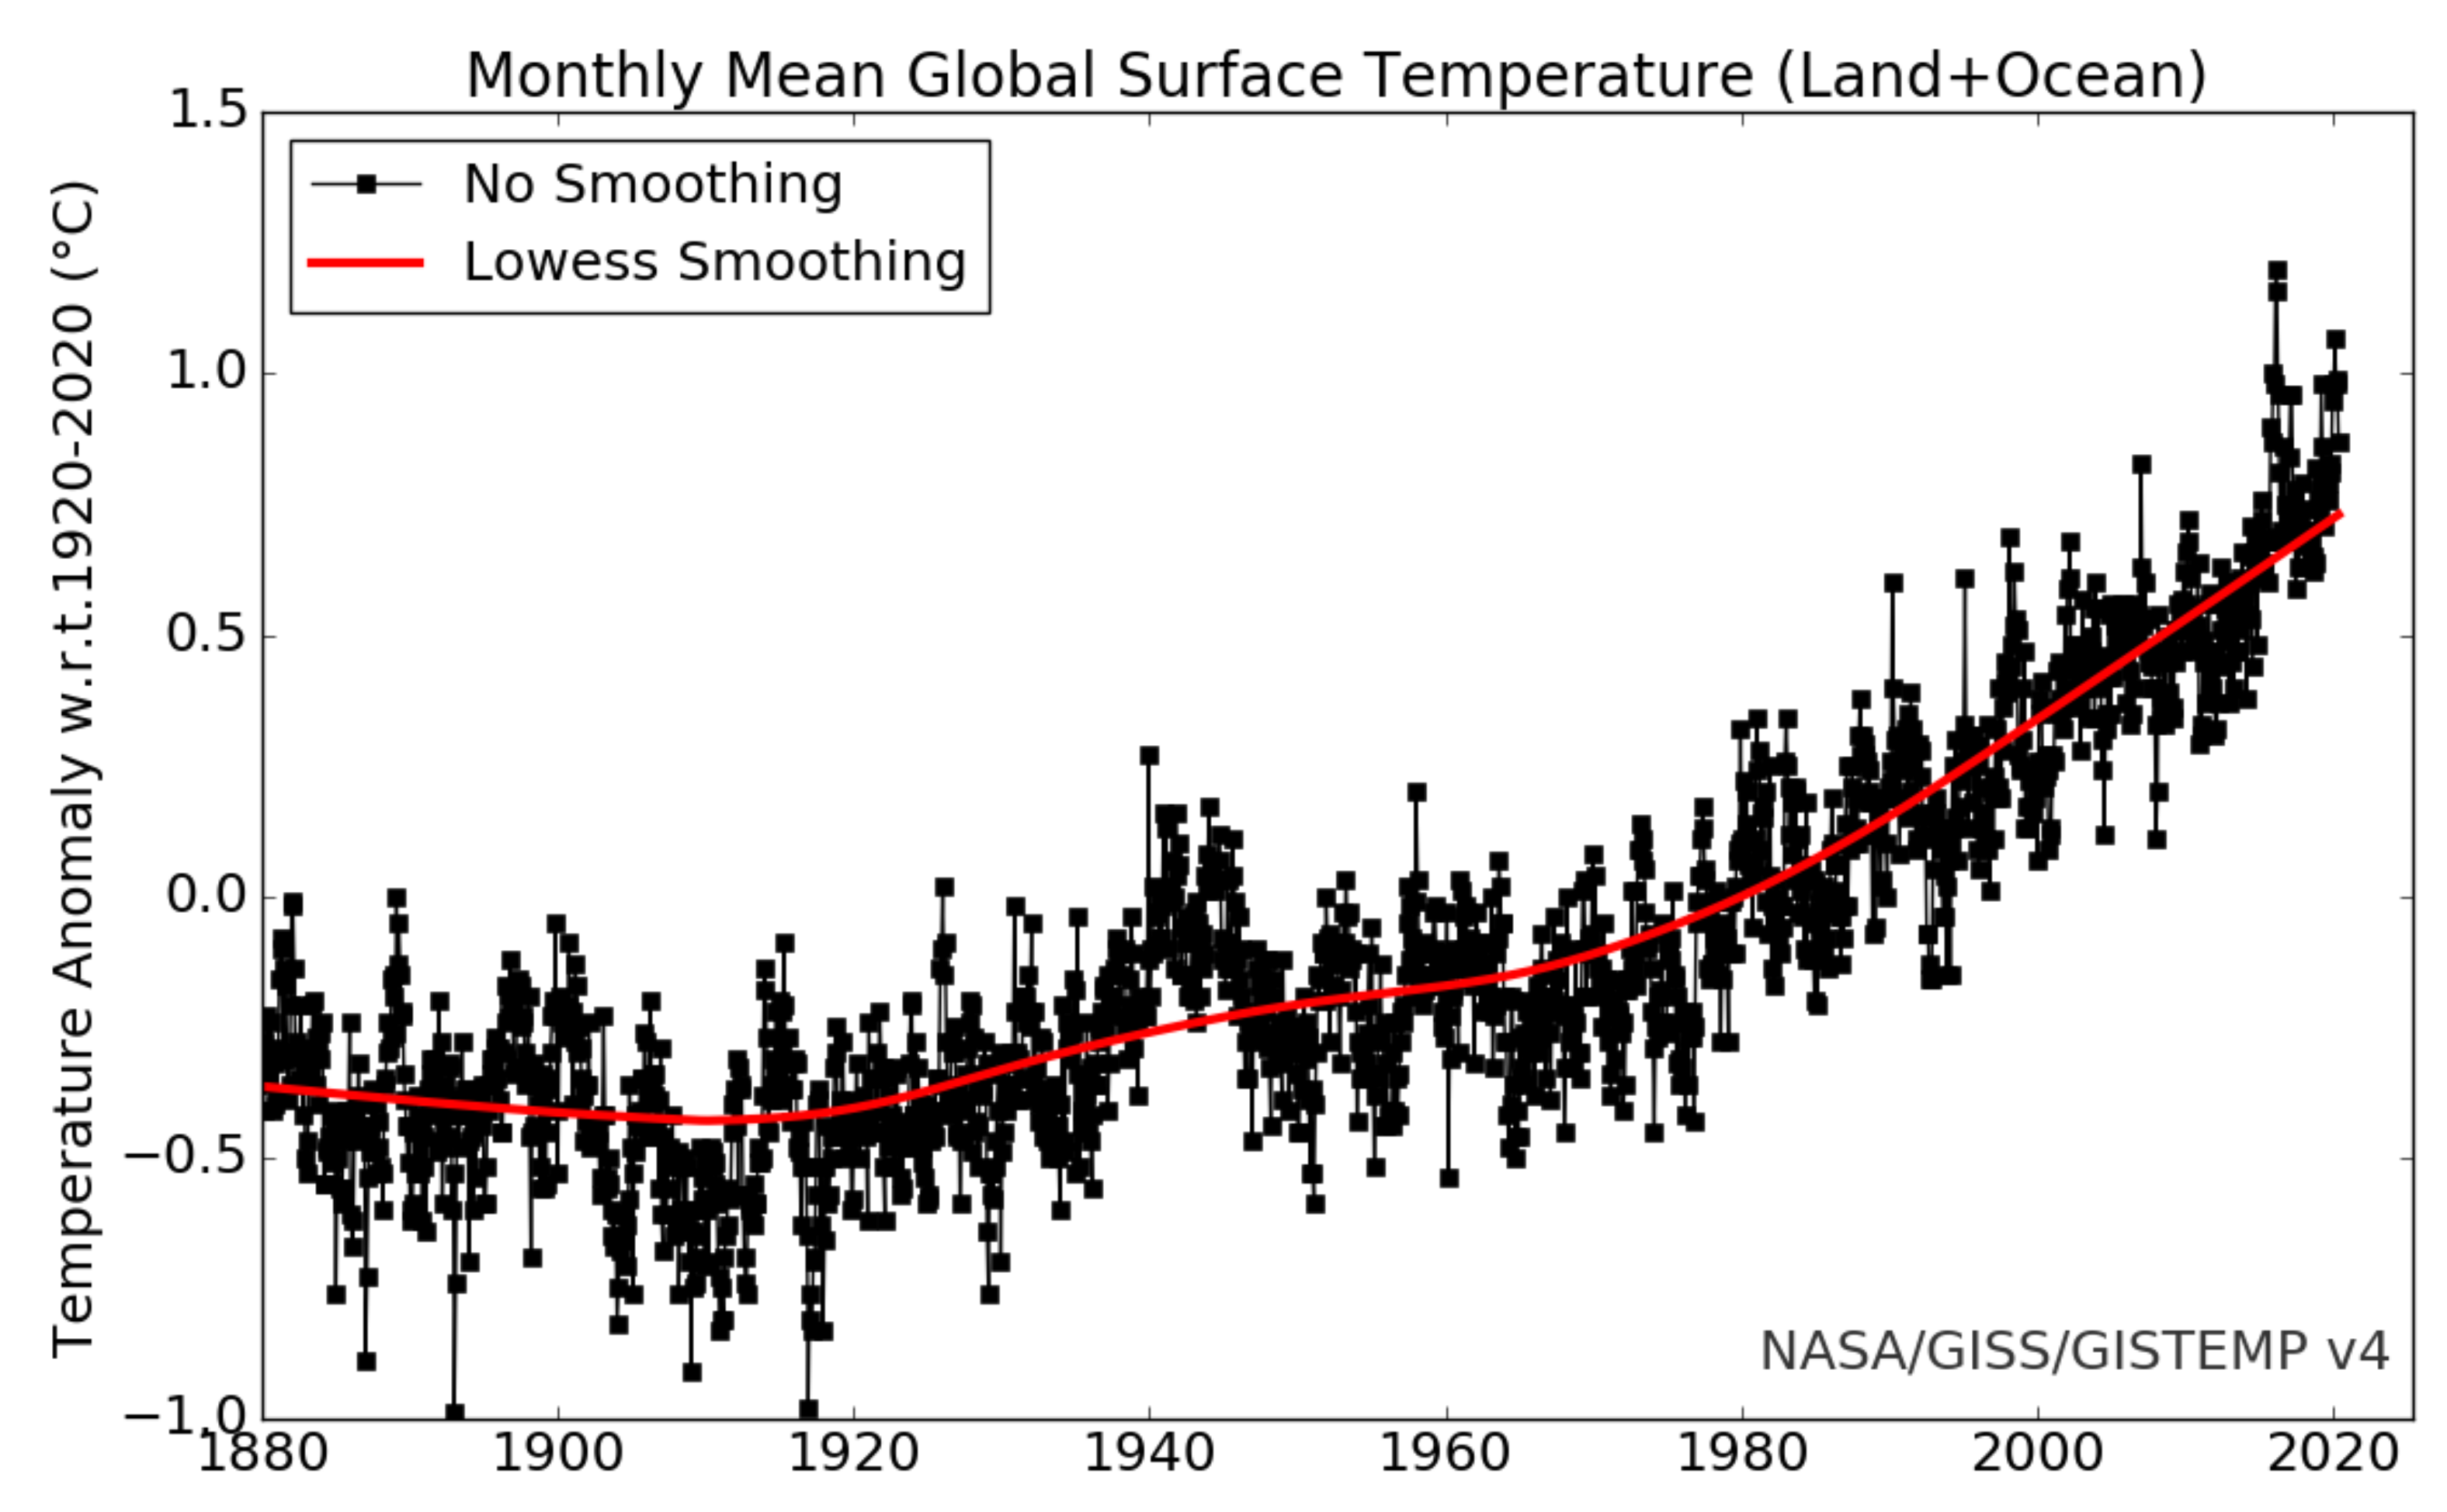
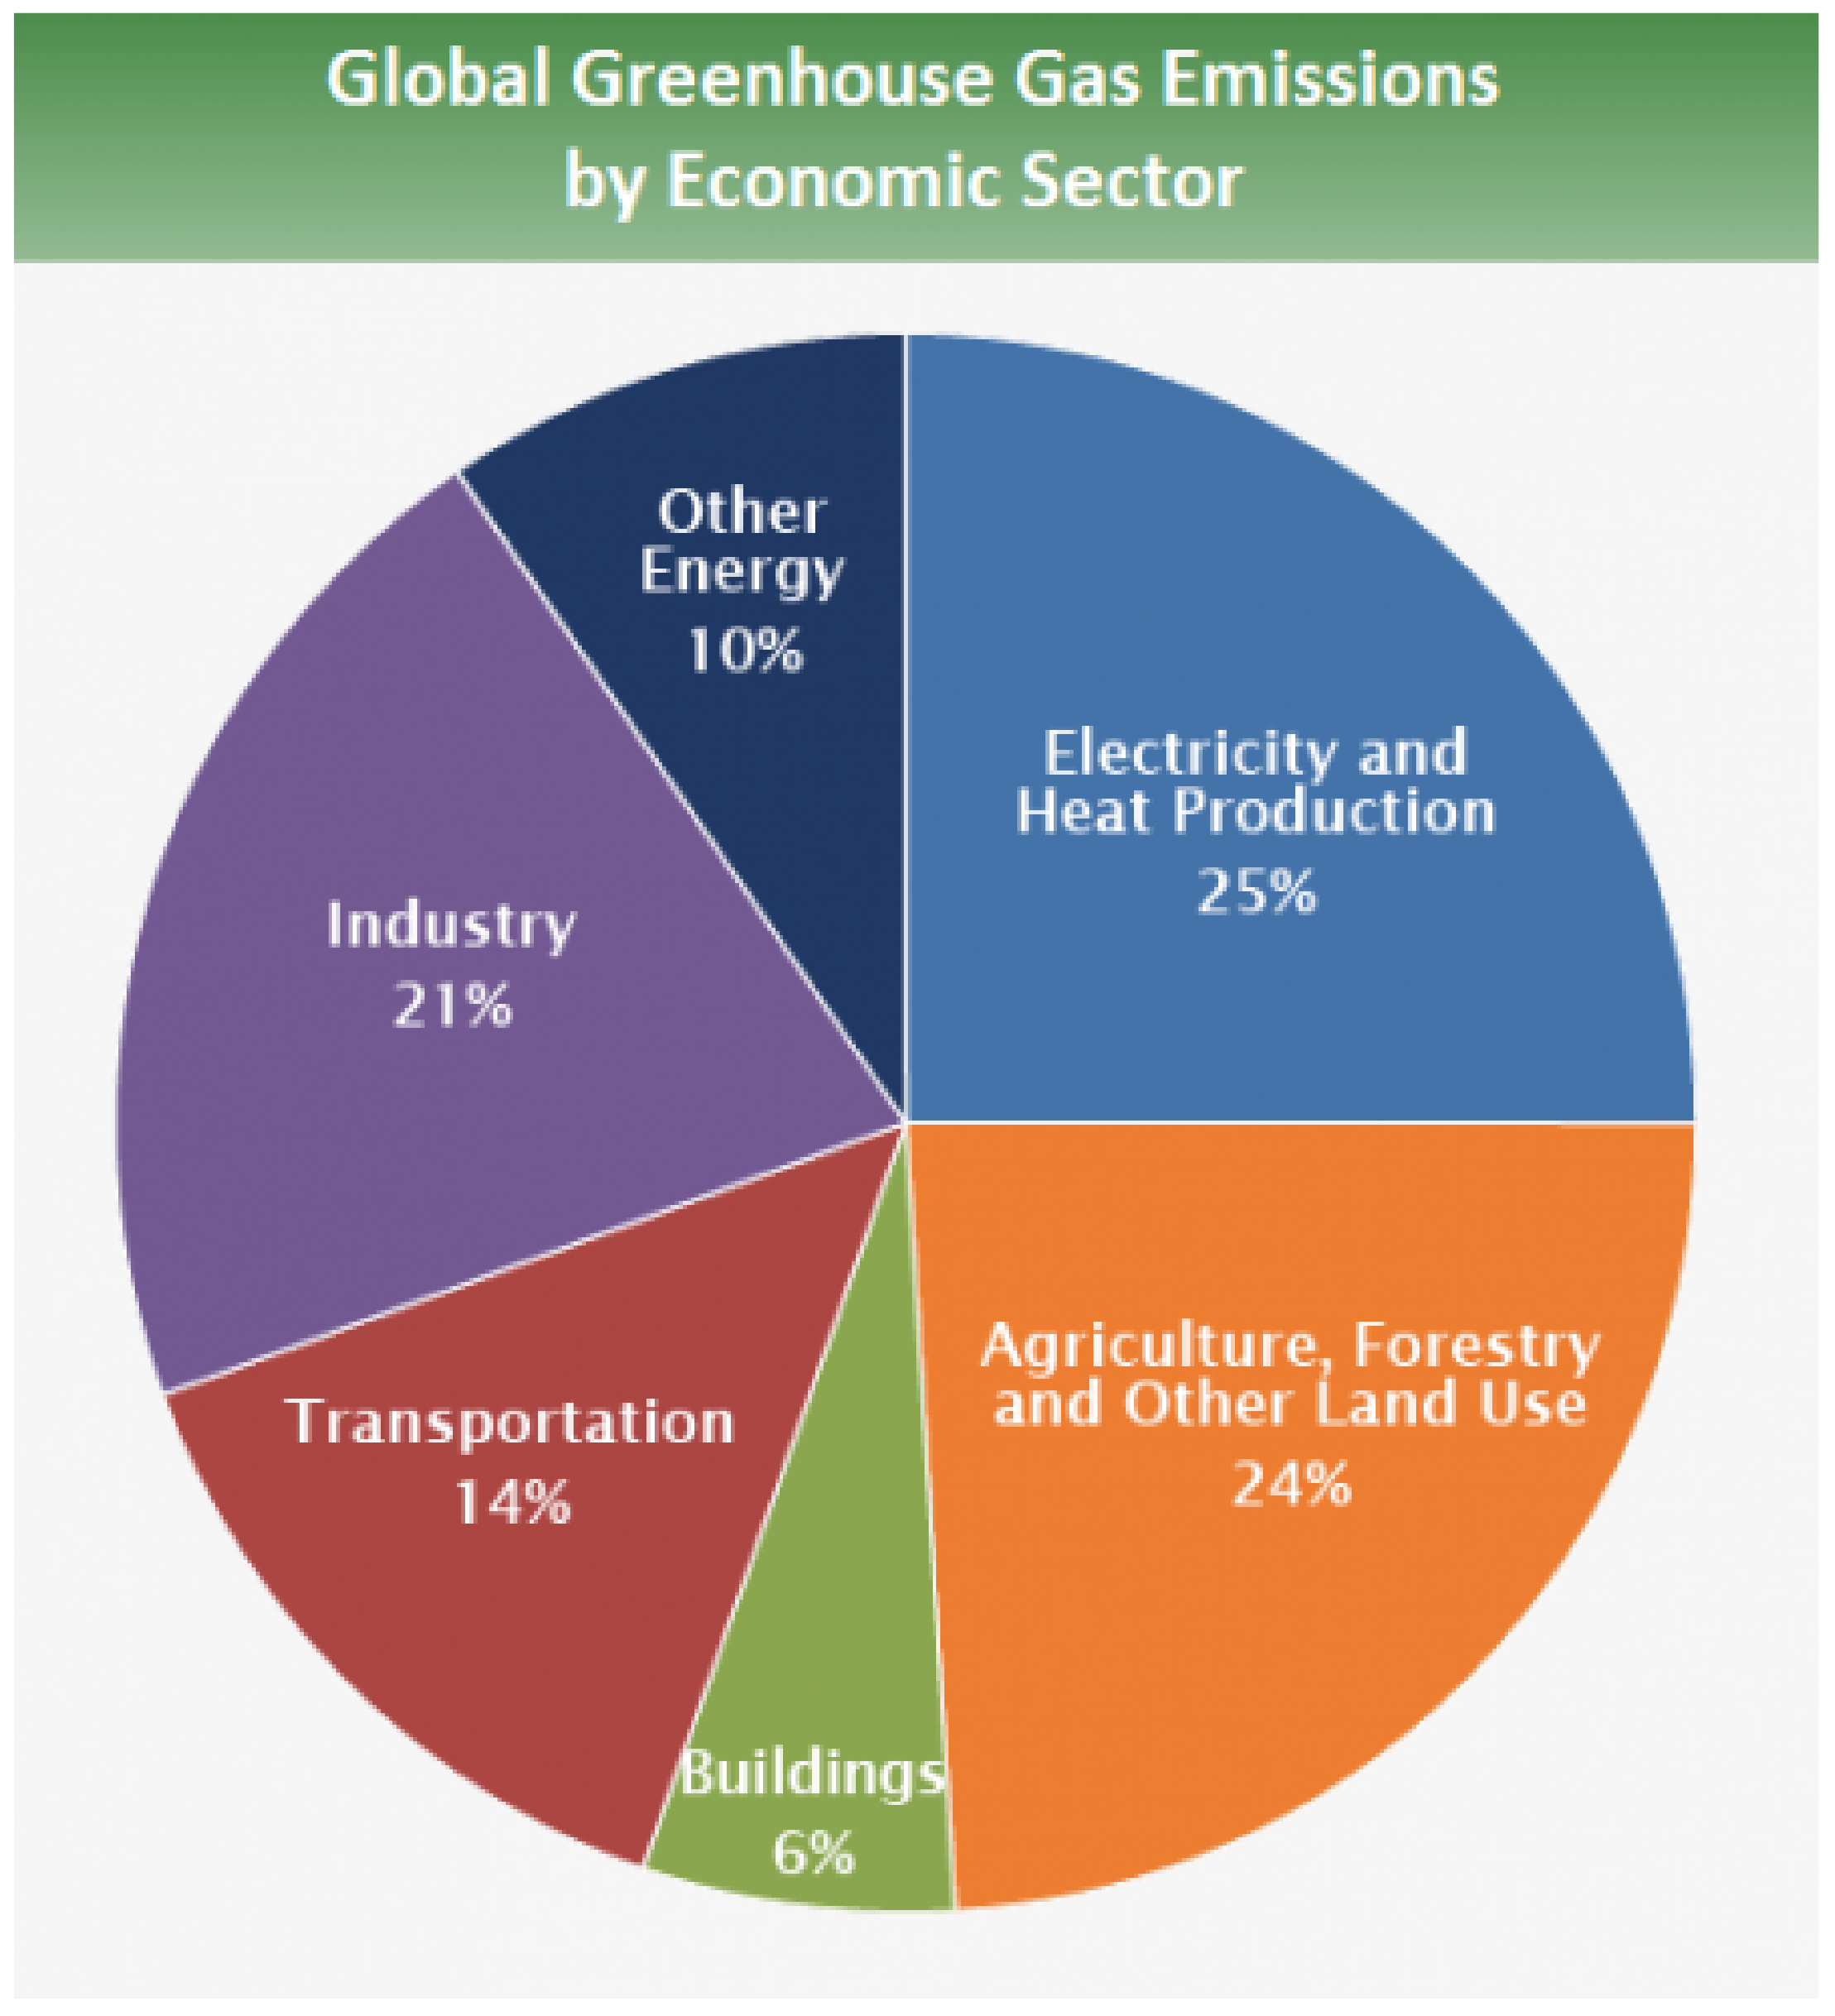
The ever changing climate conditions have become one of the major concerning issues in global agricultural sector. Human-related emissions of greenhouse gases—carbon dioxide (CO),nitrous oxide, methane, and others—have increased global temperatures by ∼1.2-degree Celsius from ∼1920 to ∼2020 as a pre-industrial level (Figure 1) [9]. Global data from 2010 (Figure 2) [10] state food systems contribute about 19–29% of global greenhouse gas (GHG) emissions, which can release the equivalent of up to 9800–16,900 megatonnes of carbon dioxide (CO) (MtCO-eq). Agricultural production, including indirect emissions associated with land-cover change, contributes 80–86% of total food system emissions–one of the highest carbon footprints of all sectors alongside forestry. Production of crops releases greenhouse gases such as nitrous oxide through the use of fertilizers and accounts for about of global emissions.
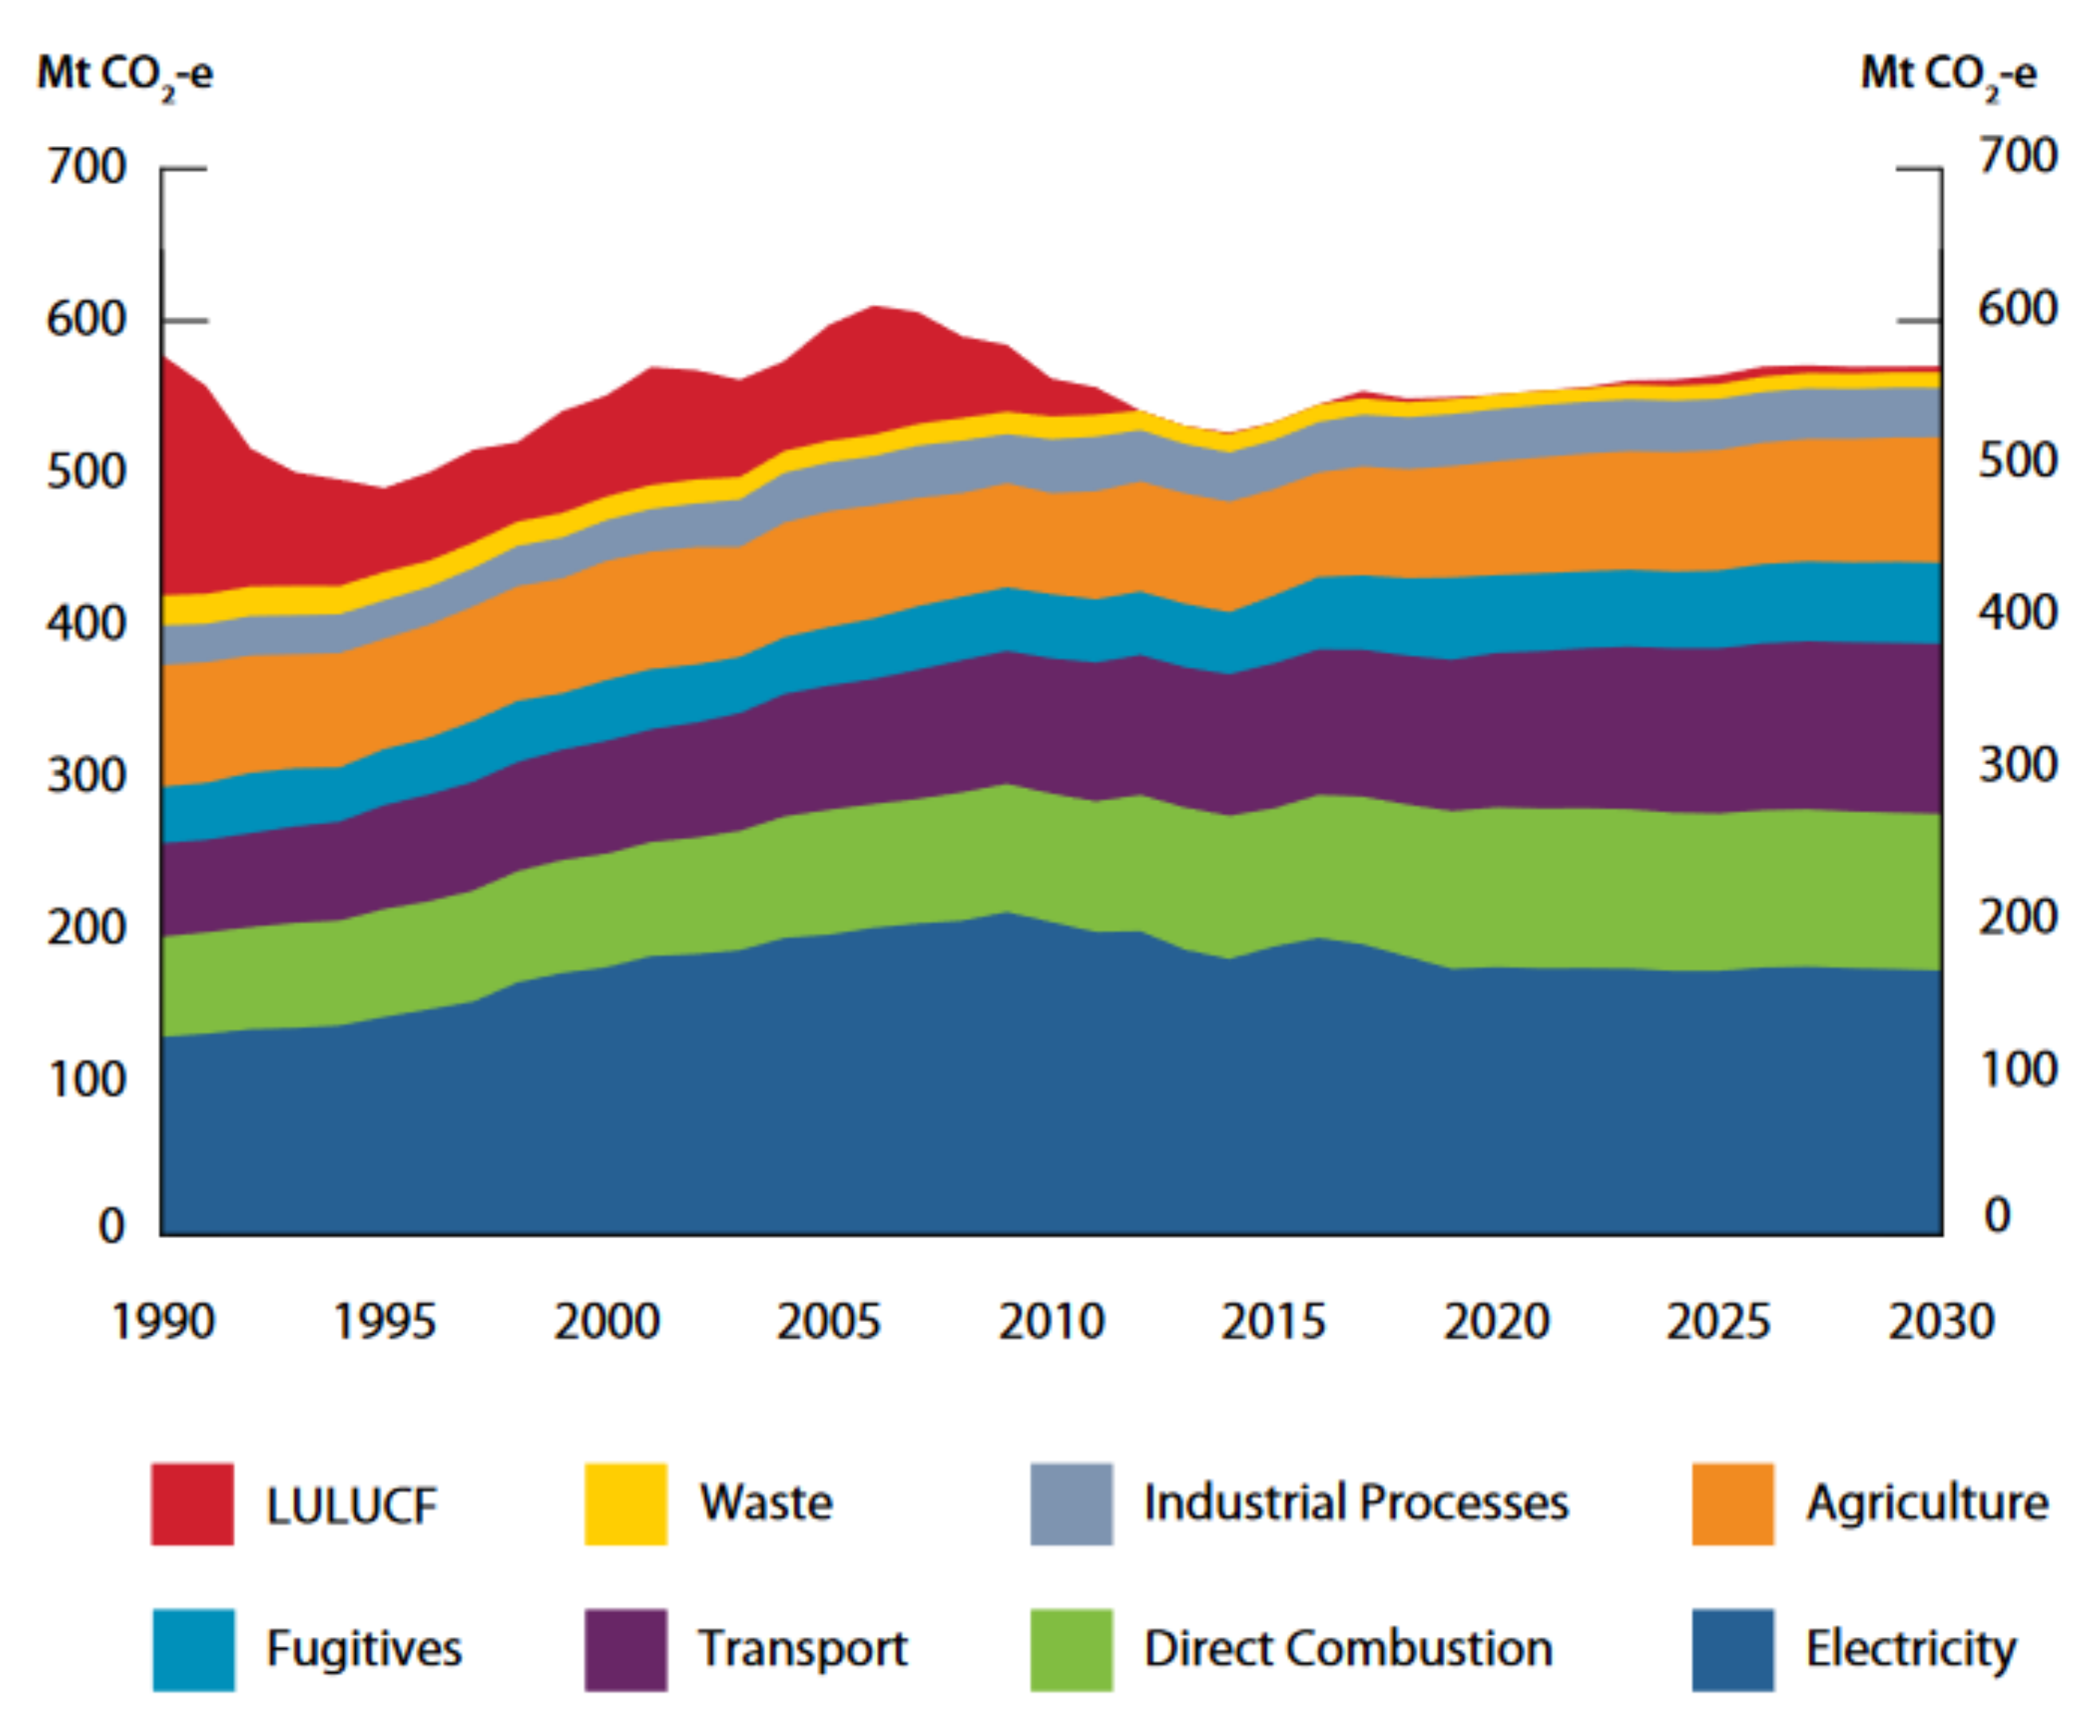
The agricultural sector produced about 71.2 MtCO2-eq in 2017, a increase from 2016. Two-thirds of agricultural emissions, approximately 46 MtCO2-eq, are the result of grazing beef and sheep (Figure 3) [1]. Although emissions have decreased by 6.3% since 2005, when the sector was responsible for 76 MtCO2. This reduction in emissions is attributed to periods of low rainfall during the millennium drought have reduced agricultural activity, causing an overall fall in emissions from the sector over the past 13 years [1].
There are continuing challenges to food security and climate change, both in terms of the negative impacts on productivity and in terms of implementing specific actions to reduce global warming. Global warming steadily increases atmospheric trace gases such as carbon dioxide (CO2), methane (CH4), nitrous oxides (NOx), and chlorofluorocarbons (CFC ) [13,14]. These gases are responsible for penetrating most of the solar radiation that heats the Earth’s surface at the same time preventing some part of the escaping thermal radiation to space, hence trapping some of the surface heat energy mostly referred to as greenhouse gases (GHGs). For instance, about of global GHG emissions from land use come from agriculture, forestry and land clearing and up to is contributed via the entire food chain, including fertilizer usage, transport of agriculture vehicles, processing and sale of the products.
4. Emissions from Agriculture
In 2015, the Paris Agreement aimed to limit the increment of the global average temperature below 2-degree Celsius above pre-industrial levels by 2100. To achieve this aim, a balance is neededbetween the anthropogenic GHG emissions by sources and removals by sinks of GHG in the second half of this century [15]. The Paris Agreement hardly mentioned the agricultural sector even though it contributes around 10–14% global GHG emissions [15,16]. After decades of neglect, the international scientific community is gradually starting to understand that this sector is essential for the achievement of the goal mentioned above.
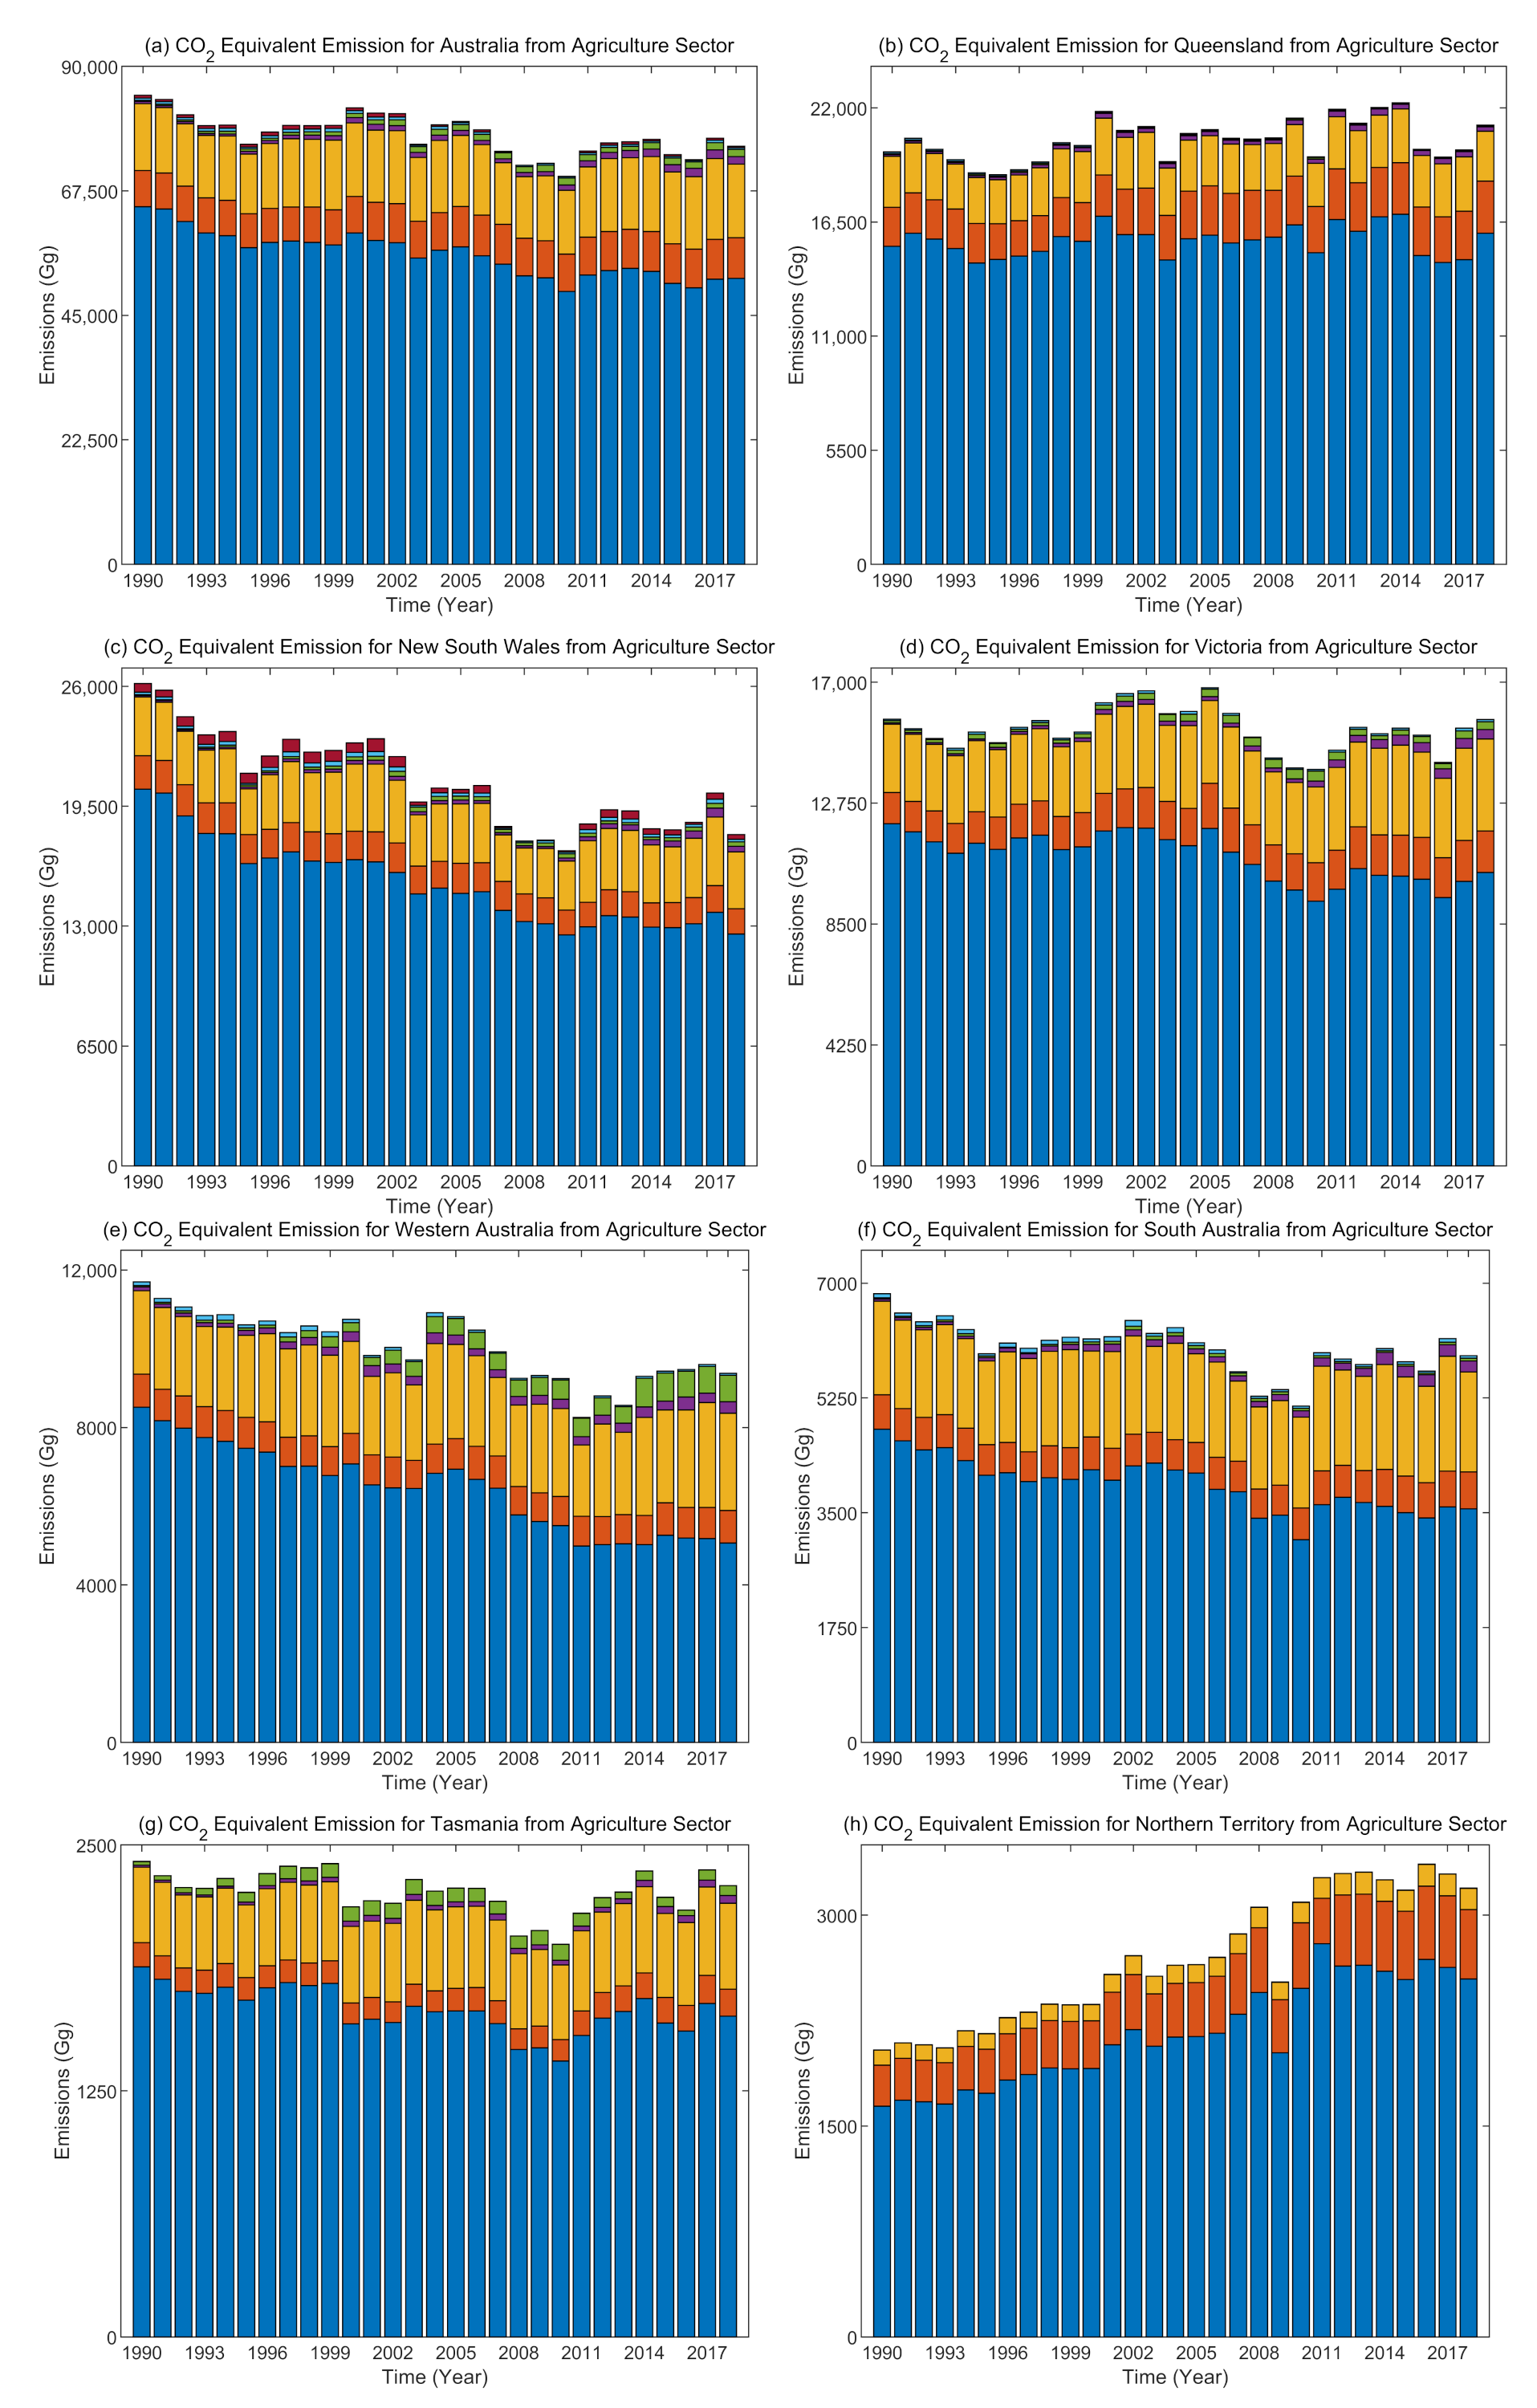
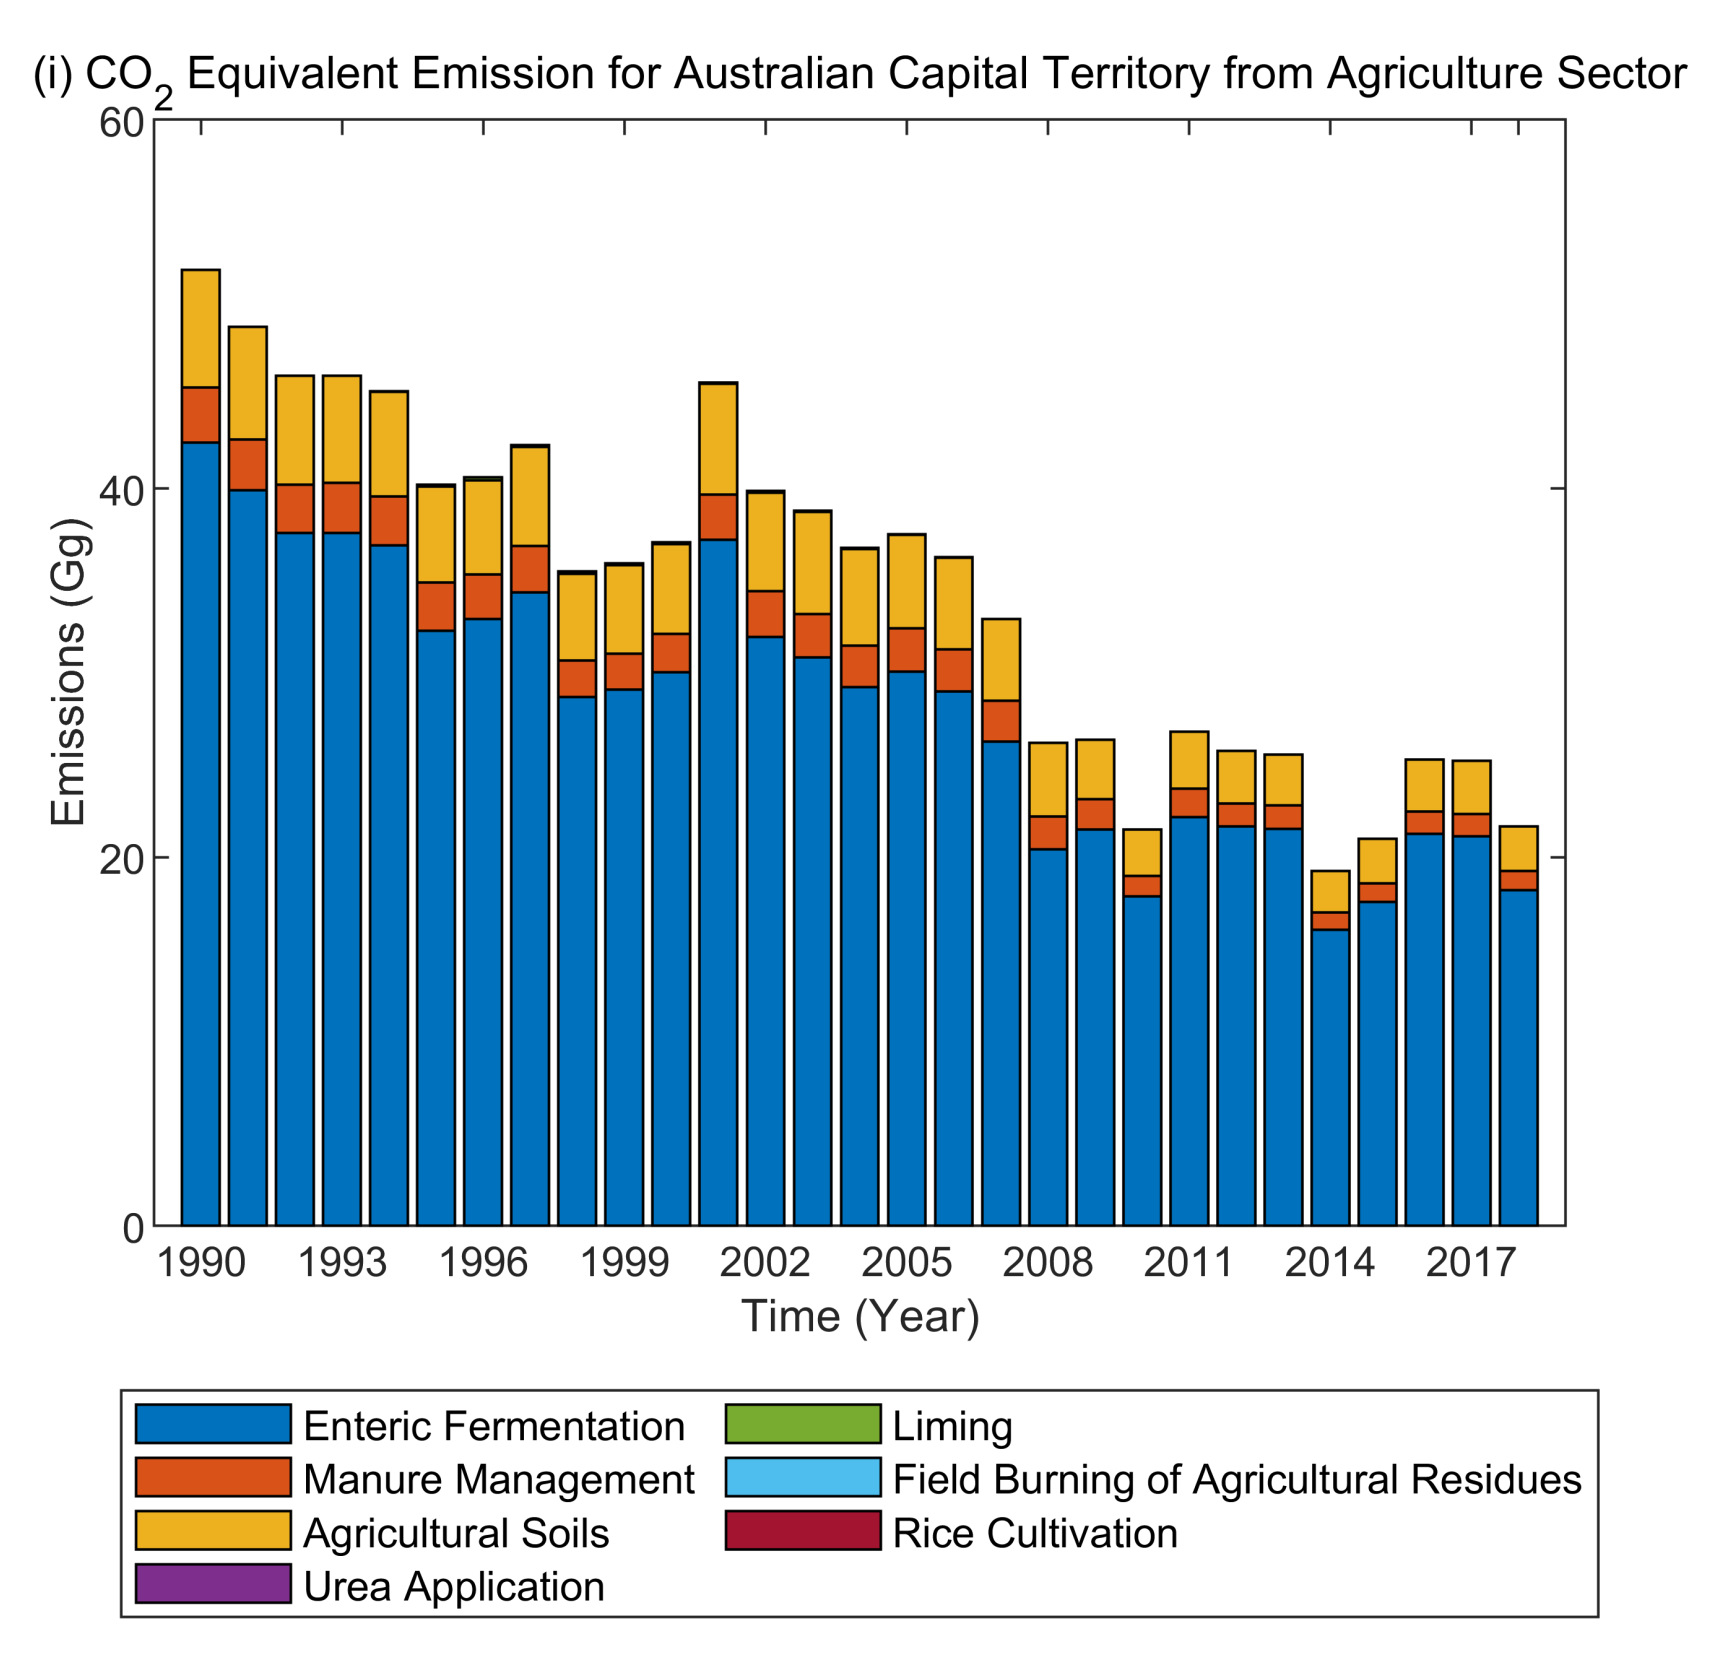
The potentiality of GHG mitigation by the contribution of the agriculture sector is less in developed countries, where this sector typically forms around of national GHG inventories [17,18]. However, there are some developed countries like Australia, where agriculture relatively plays a vital part in the national GHG emission profile. Agriculture is the second-largest source of GHG emissions in Australia, and it contributes of total GHG emissions. Hence, a focus on GHG reduction is a high priority [8]. Figure 4a–h shows the GHG emissions from the different agriculture sectors of the overall and various states in Australia. The primary GHG emissions from agricultural sectors consist of (a) methane from enteric fermentation, (b) carbon dioxide from decomposition of soil organic carbon, and (c) nitrous oxide from manure and synthetic fertilizer.
According to the Department of Industry, Science, Energy, and Resources’ annual agriculture sector GHG inventory, livestock contributes around of the total agricultural GHG emission or of national GHG emission (Figure 4). These livestock emissions are mainly from enteric fermentation. The contribution varies with droughts, during livestock populations go down. The remaining agriculture sector GHG emission is evenly sharing between the burning of agricultural residues and cropping. However, per hectare emission is lowest from livestock because it occupies the largest amount of land [19]. About of total agricultural GHG emission comes from NSW, VIC, and QLD as most of the farms are located around these three states in Australia (Figure 4i). From the trend of Figure 4, it is clear that emission from agriculture reasonably stable. However, the scientific community expected that the emission from the agriculture sector would rise dramatically over the coming years and decades due to the prediction of or more increase in demand of agricultural products around the world (mainly in Asia), for the growing world population and dietary changes caused by a wealthier middle class [15].
The Australian agriculture sector dramatically depends on the international markets as of agriculture products are export to the global market. The value of agriculture, fisheries, and forestry exports to Asia has grown over the last 20 years. Meat and live animals have been the fastest-growing export segment, growing in value over the 20 years to 2018–2019, followed by forest products (up ) and fruit and vegetables up . The agriculture production has increased by in the past 20 years in real terms, from approximately 58 billion in 1999–2000, to around 69 billion in 2018–2019 [8].
Hence, it is clear that Australia is in an excellent position to meet the increasing demand for agriculture products, mainly in Asia. Australian farmers and agri-business companies expect to increase their production of agricultural commodities by from 2007 levels by 2050 to meet the greater Asian demand [8]. The substantial increase in the production of agricultural commodities will cause GHG emissions to go up.
The Australian Government has committed to reducing emissions 5–15% by 2020, 26– by 2030 and by 2050 at below 2000 levels. For the agricultural sector, the plan is to reduce annual emission by 2030. To achieve a low carbon future, we not only need proper emission trading schemes that encourage the farmer and agribusiness by offsets rewarded under the carbon farm initiative but a GHG reduction strategy that discourages the GHG intensive technologies and helps to follow best management practices [20].
5. Common Techniques Used in Agriculture
The challenges posed in the agriculture sector as far as the need to increase the food supply and reduce carbon footprint are now helping agricultural sustainability, also ensuring food security. The need for an efficient global agricultural system that takes into consideration the aspect of sustainability is a must. The right management practices within the agriculture sector may have the potential to mitigate the climate crisis through carbon farming, regenerative agriculture, or carbon smart farming and IoT smart farming techniques. Carbon farming has been implemented since many years in the agriculture industry. This practice simply is a way to reduce GHG emissions by capturing and holding the carbon in vegetation or soils. Carbon farming seeks to reduce the emissions in its production stage while still managing to increase the yield production, sequestering carbon within the landscape [21]. Along with the advantages, there are some concerns about carbon farming practice. For instance, there are far more costs that need to be accounted for like reforestation methodology, that will require numerous audits which other sectors do not normally require. The impediments of storing carbon within the soil are also worse than they appear. With biosequestration, there is a possibility it may lead to emissions of other GHGs such as methane or nitric oxides [22]. For instance, the addition of nitrogen to fertilizers to increase the production of pastures or crops will result in more nitric oxide, which has a 300 times greater global warming potential than carbon dioxide.
Regenerative agriculture practice is a complete management practice that uses the power of photosynthesis in plants to close the carbon cycle, to build soil health, crop resilience, and nutrient density [23]. Among many other benefits, this practice helps to reverse climate change by rebuilding soil organic matter and restoring degraded soil biodiversity resulting in both lowering the carbon and improving the water cycle. Some other practices in the category of carbon smart farming include cover cropping which is growing crops to improve soil quality, rather than harvesting, and crop rotation, and composting. On the other hand, smart farming is a concept that uses technology to improve agricultural production while at the same time lowering the inputs significantly [24]. This information-driven farming approach applies measures that are economically and ecologically meaningful to achieve improved output in production. IoT enabled smart farming can help reshape agriculture tactics in ways such as the temperature of storage, the measure of compost utilized, the measure of underground water, the quantity of seeds planted, the status of cultivating, and apparatus being used.
6. Low GHG Emisison Practices in Agriculture
6.1. Smart Farming/Smart Agriculture
The recent advancement of smart technologies has enabled the vision of smart farming (alternatively known as smart agriculture) based precision agriculture. The aim of smart farming is to improve productivity by increasing crop yields and profitability, and reduce the environmental footprint such as GHG emission by utilizing different techniques such as efficient irrigation [6], targeted and precise use of pesticides and fertilizers for crops etc. In addition, IoT enables the reduction of the inherent environmental impact by performing real-time detection of weeds or infestations [25], monitoring weather conditions, soil condition etc., which consequently reduces and allows adequate use of inputs such as water, pesticides or agro-chemicals [26].
The application of smart technologies in agriculture includes, but is not limited to:
- Field Monitoring: Smart farming helps to reduce spoilage and crop waste with the provision of better monitoring, accurate data collection, and management of the agriculture fields [27]. For instance, smart farming promotes the efficient application of fertilizers, electricity and water.
- Green Houses: Smart farming helps to maximize the production and quality of fruits and vegetables by controlling micro-climate conditions of a green house [28].
- Compost management: Smart technologies prevent fungus and other microbial contaminants in hay, alfalfa, straw, etc. by controlling temperature and humidity [29].
- Livestock Farming: Smart livestock farming helps to monitor animal grazing in open pastures or location in big stables [30]. smart farming also helps in detecting and maintaining air quality, ventilation in farms and detecting and reducing GHG emission from farms.
- Offspring Care: Smart farming helps in monitoring and controlling offspring in animal farms to ensure their survival, growth and health [29].
A significant part of smart agriculture is focused on climate change, GHG emission and environmental footprints. This part is known as climate-smart agriculture, which is discussed extensively in the following subsection.
6.1.1. Climate Smart Agriculture
Climate Smart Agriculture (CSA) is a promising innovation in agriculture which integrates traditional farming practices with technology towards the aim of increasing agricultural productivity considering climate constraints while reducing GHG emissions. Hence, CSA comprises sustainable agricultural systems which contribute to increased crop yields, productivity and revenue; more resilience and adaptation to climate change of food systems; and reduction of greenhouse gas emission as much as possible [31,32,33]. Several farm level studies presented in the research literature suggest that adoption of CSA technologies has proven to improve and increase quality and amount of crop yields, net income, efficient usage of input materials and most importantly has reduced GHG emissions [31,32,33,34,35]. Here we present some widely used CSA practices and technologies which help to improve crop yields and productivity, enhance resilience and reduce GHG emission [32,34,35].
- Carbon-smart practices, which are focused on reducing GHG emission. Examples include [36]:
- Integrated Pest Management (IPM), which is designed to minimize the use of chemicals.
- Agro Forestry (AF) and Fodder management (FM). They emphasise on sustainable land management and carbon reduction.
- Concentrate Feeding (CF) for Livestock, which aims to reduce nutrient losses, hence reduces the food requirement for livestock.
- Energy-smart practices emphasize improving energy efficiency. Examples include:
- Zero Tillage/Minimum Tillage (ZT/MT) practices improve water infiltration and retention of organic matters by reducing energy consumption during land preparation [37].
- Weather-smart practices: these CSA practices utilize technology to make the farmers aware about weather conditions. Besides, they offer income security related services.
- Weather based Crop Agro(CA) advisory, where technology is used to do weather forecasting, gather relevant information on climate condition and advises the farmers accordingly [38].
- Climate Smart Housing (CSH) for livestock uses technologies to help farmers take timely and specific decisions to protect animals from extreme heat or cold stresses [32].
- Crop Insurance (CI) offers crop-specific insurance to farmers in order to compensate the losses due harms caused by weather variation or natural disasters.
- Nutrient-smart practices, which are focused on improving efficient use of nutrients, include:
- Site Specific Integrated Nutrient Management (SINM), which optimizes the supply of soil nutrients according to space, season and type of crops [39].
- Leaf Color Charts (LCC), which are used to detect nitrogen deficiency in crops, such as wheat and maize, by quantifying the required amount of nitrogen based on the greenness of crops. They are also used for split dose applications in rice fields [40].
- Green Manuring (GM) and Intercropping with Legumes (ICL). Both of these practices are used to improve quality of soil and nitrogen supply. The first one uses cultivation of legumes in cropping systems, while the former one uses the same with other main crops in alternative rows of the field [41].
- Knowledge-smart practices, which improves productivity and helps in reducing environmental footprints by using local knowledge and technology, include:
- Improved Crop Varieties (ICV) provide knowledge about varieties of crops which are more tolerant to weather variation such as floods, drought, cold/heat stresses etc. [33].
- Contingent Crop Planning (CC) provides risk management plan to be prepared for different weather conditions such as flood, drought and cold/heat stresses [42].
- Seed and Fodder Banks (SFB) are another part of the risk management plan, which provides information on the conservation mechanism of seeds and fodders [42].
The authors in [34] conducted a study with smallhold farmers in the Indo-Gangetic Plains (IGP) of India to demonstrate the potential economic benefits of CSA technologies and practices. Their study suggested that most of the farmers prefer to use improved crop diversification, improved crop varieties, zero tillage practice and laser land levelling over the other CSA practices and technologies such as residue management and site specific nutrient management. Additionally, the authors estimated the cost of adoption, consequent change in crop yields and income for the implementation of three major CSA practices (improved crop varieties, zero tillage and laser land levelling) in rice–wheat systems. The average cost of adoption were found to be +1402, −1577 and +3037 INR ha for adaption of improved crop varieties, zero tillage and laser land levelling, respectively. On the other hand, the net profit of farmers can be increased with improved crop varieties, zero tillage and laser levelling. It was also evident that the combination of improved crop varieties with laser land levelling and zero tillage technologies can further improve crop yields and consequently net profit.
The authors in [31] have analyzed the effect of adopting a set of CSA technologies to grow three types of crops, such as maize, wheat and rice, on global food production and GHG emissions. Their analytical results showed that CSA practices have the potential to increase food production, improve food security under unfavorable climate conditions, while reducing greenhouse gas emissions. However, their results also indicate that, in order to make a significant impact on global GHG emissions, CSA must be implemented widely across the entire agricultural sector with proper co-ordination. The authors performed their analysis under two different cases: case-1, when the farmers emphasise more on crops yield and are happy to compromise with environmental footprint, and case-2, when the farmers would like to optimize their food production as well as would like to reduce GHG emissions. For case-1, the reduction in GHG emissions is estimated to be equivalent to 44 Mt CO2 year. However, as one can anticipate, the reduction of GHG emissions is significantly higher for case-2 which is 101 Mt CO year reduction. Undoubtedly, the higher amount of reduction of GHG emissions is possible at the cost of production. For the above mentioned case-2 where reducing GHG emission is a priority, the total cumulative production of the three crops is reduced by 21 Mt year compared to that of case-1, which is equivalent to of total yearly global production of rice, maize and wheat. It is noteworthy that the amount on GHG emissions vary from country to country, since the farm sizes, climate and atmosphere varies from country to country. The authors in [43] presented some prominent CSA practices which can potentially mitigate greenhouse gas (GHG) emissions, for example: CSA technologies to improve the management of cropland and grazing land; cultivation of organic soil; restoration of degraded lands; efficient management of livestock, manure, pesticides, water, fertilizers, etc.
In article [33], the authors estimated regionally specific soil GHG reductions because of adopting some CSA practices in soybean and maize farms by using a process-based bio-geochemistry modeling framework with public soils, weather, and crop yield data. They performed site-specific denintrification–decomposition model simulations on agricultural fields throughout 11 states of the USA from 2013 to 2016. They adapted different models according to soil organic carbon (SOC) stocks to a depth of 50 cm, CH fluxes and NO emissions. The results were then shifted to a CO equivalent basis and to estimate regional variability they were weighted spatially to a county-scale. Furthermore, they estimated the potential of county-scale GHG reductions due to converting from conventional tillage to no-tillage practices. Their results showed that a mean reduction of 1477 kg CO-eq ha year is possible which includes NO, SOC and CH flux reductions of 549 kg, 945 kg, −17 kg CO-eq ha year, respectively, with a standard deviation of 605 kg CO-eq ha year. Here, a negative reduction indicates an increase in emissions. Further reduction of CO-eq is possible by adopting cover crop technique. On the other hand, by improving N-fertilizer timing another 413 kg CO-eq emission can be mitigated. Overall, the authors in [33] claimed that, by adopting multiple CSA practices it is possible to reduce GHG emission of 2861 kg CO-eq (NO, SOC, and CH flux reductions of 611 kg, 2210 kg respectively). The authors also suggested that the usage of fossil fuels may be offset by using maize stover as a feedstock for bioenergy or other bioproducts. In order to estimate potential GHG emissions as in NO emissions, SOC changes and CH fluxes, the authors modeled a maize stover biomass removal rate. Additionally, the removal practice effectively removes of the carbon and nitrogen bound in maize on top of what was removed with the grain fraction.
Hence, the articles reviewed in this section indicate that the implementation of CSA technologies and practices has a significant impact in increasing crop yields, net profit and most importantly in reducing GHG emissions.
6.1.2. Reducing GHG Emission with the Aid of Smart Livestock Farming
Efficient and proper utilization of smart farming in livestock sector has proven to reduce GHG emissions and improve environmental footprint. The authors in [44] claimed that smart livestock farming (SLF) can contribute to the reduction of GHG emissions by measuring emission and potentially adjusting temperature, feeding timing and quality and some other parameters that influence the GHG emissions. Farm enterprises in the supply chain are working towards the aim to keep livestock animals under optimal conditions, to lower cost and price of livestock products, as well as to mitigate or reduce GHG emissions as much as possible. SLF can facilitate some business models such as selling meat by protein contents, food miles and emitted GHG gases, hence, can facilitate more informed choices for consumers. The feed producers can get some very important information from carcass composition data [44]. SLF and tractability can help farmers to improve their feeding regime and choose the feed provider with the “best” feed for their animals by retrieving crucial information. According to a study conducted in [45], the European Union (EU) encourages voluntary compliance with CH emission levels in the farm sector, and soon the cattle livestock will be included within the Industrial Emissions Directive (IED). According to this article [45], there are approximately 90 million cattle within Europe and they collectively contribute approximately of EU CH emissions and of ammonia emissions. The influencing factors of these GHG emissions include composition of diet, intake level, feed quality, size and growth rate of animals, energy consumption and some other environmental parameters. The authors in [46,47] analyzed beef and dairy farms, and they suggested that the variation between cows in CH emissions can be substantial even though dairy cows are fed the same diet at the same intake level. As reported in these articles, researchers are putting efforts in modelling CH production of farms have been undertaken. The authors in [47] presented a dynamic model predicting nutrient supply and milk production mechanism, named Karoline, which is a whole dairy cow mechanistic. The model has recently been revised to improve its CH emissions modules and digestion [48]. The authors in [49] have proposed a model to predict CH emissions from an on-farm database, based on digestibility, intake and NDF. Their model provides an improved estimation of CH emission factors from both beef and dairy systems.
6.2. Best Management Practice Approach
The Australian carbon farming aim is to sequester more carbon and reduce GHG emissions as part of Australia’s response to global climate change. The central theme of carbon farming is the process of managing soil, animals, vegetation, and water/irrigation in the best practical way to increase carbon storage and reduce GHG emissions. Best management practice (BMP) is a cost-effective farm and environmental management program for farmers [50,51]. Some of the Australian farmers already implemented the BMP program (mainly cotton growers—grain, banana, and cane growers just started the program) [52,53,54]. This program yet needs to be considered for other agricultural sectors like livestock to solve the emission concern. Individual farmers need to decide which BMP combinations are best suited to their farm enterprise, taking into account the specific climate, soils, sectors, and management factors. We describe below the BMP options based on the leading greenhouses gases of interest to agriculture (methane and nitrous oxide).
6.2.1. Reduction of Methane(CH4) Emission
Based on the literature, we able to achieve around a 20– reduction of methane contribution to the environment by continuing to improve production efficiency with current technology [50,55]. The amount of methane emission from a livestock farm depends on the number of animals (i.e., emission per head), the amount and type of feed consumed, and the type of digestive system they have. CH emission varies per unit of feed intake with different animals, and these variations suggest that there may be genetic differences in methane production. In cattle and sheep farms, the selection for genetic lines of cattle and sheep can cause lower methane emissions as a productivity function (i.e., feed conversion efficiency). It has the potential to be an economical and practical long-term sound approach to lowering methane emissions from livestock. The study of Waghorn et al. [55,56] suggests that through animal breeding, a reduction of 10– methane production could achievable from dry matter during digestion.
The dietary and nutrition management is being trialed to consider whether this management approach can reduce methane emitted by livestock. The high-quality pasture will cause animals to eat more, produce more with less production of methane per unit of output. The higher proportions of forage legumes in the daily diet can also be lowering the emission of methane. Improving diet quality and nutrition management tends to increase the consumption of feeding amount, which increases the energy needed for animal production and growth. However, improving quality and management can result in better performance of animal production and growth as well as reducing the production of methane, as measured by a reduction in methane productions per unit of product.
Supplements such as oils, fats, probiotics, tannins, nitrates, marine algae, native vegetation, and enzymes in the daily diet can profitability reduce the production of methane. The methane production can reduce for every increase in oil in the intake [50]. Secondary compounds of the plant, such as condensed tannins, have shown a 13– reduction of CH production, mainly through a direct toxic effect on methanogens [55,57,58]. However, it may reduce dry matter intake and digestibility. Feeding tannins can also reduce the excess loss of nitrogen through urine, which ultimately reduces nitrous oxide losses.
Better management of livestock stoking rates can reduce the production of CH. This goal can be archived by reducing the unproductive animal number on a farm. The number of animals can be reduced without losing the meat quality and fulfill the market demand through proper breeding and nutrition strategies.
Strategies, for example, extended lactation in dairying where cows calve every 18 months rather than annually, reduce energy demand by [59] and thus potentially reduce a similar amount of methane production [60]. Besides this, with earlier finishing of beef cattle in feedlots, slaughter weights are achieved at a younger age, with reduced per animal lifetime emissions, and thus proportionally fewer animals producing CH [50,55].
CH4 production can also be reduced by the biological control method; so far, three biological processes have been examined to reduce methane emission from livestock [55]. These three processes are:
- Viruses to attack the microbes which produce CH.
- Specialized proteins to target CH-producing microbes.
- Other microbes to break down the CH produced in the rumen into other substances.
6.2.2. Reduction of Nitrous Oxide (N2O) Emission
The reduction potential of N2O can be significant through the improved animal, fertilizer, and soil management, even though actual N2O contribution is relatively small in GHG emission. However, it is an essential GHG that contributes to climate change because it has over 100 years of atmospheric lifetime and is about 300 times better at trapping heat than carbon dioxide, which means a small amount of nitrous oxide can significantly affect the climate. Based on the literature, the following BMPs can increase overall nitrogen efficiency and reduce N2O losses [55].
Fertilizer management can decrease N2O emissions due to the strong link between inorganic nitrogen in the soli and N2O production. Proper management can prevent the buildup of inorganic nitrogen reduces N2O emissions. Nitrate nitrogen source may result in greater leaching and denitrification than ammonia-based N sources (e.g., urea) if applied under wet, clod, and waterlogged conditions. Generally, this nitrate and ammonia strategy reduce N2O emission and increase nitrogen use efficiency. There are four management factors which help to lower the N2O emission from applied nitrogen fertilizer. These are the right application rate, type, timing, and placement of nitrogen fertilizer. Soil disturbance, such as a tillage operation, breaks up soil organic matter. Use minimum tillage for cropping has the potential to minimizes organic matter breakdown and the release of N2O [55].
Nitrification inhibitors show great potential to reduce N2O emissions. These inhibitors work by reducing nitrification, which reduces the production of N2O and nitrate leaching. These can be applied separately or with nitrogen fertilizers. Preventing water logging can reduce N2O emission as these conditions are the most conducive to N2O emission. In this case, soil texture is also important because there is a close link between the drainage of excess water and soil pore sizes. The peak N2O production occurred when around of water-filled pore space.
There are many BMPs approach available for use in farms, many of them are low cost or free, but some of the BMPs are costly and may require assistance. The above BMPs discussed based on Australian farming conditions and these BMPs to reduce GHG emissions need to be evaluated practically by implementing a carbon farming pilot project. It is also interesting to see in the future how the IoT based smart farm with BMPs suggested by this paper reduce GHG emission in Australia practically.
7. Conclusions
Agriculture based land-usage is arguably one of the contributing factors towards GHG emissions globally. In this study, we have explored the key sources of GHG emissions within the agriculture sector in Australia. Among the six states and two internal territories, Queensland produces the highest GHG emissions from agriculture in Australia. Livestock farming (manure management, enteric fermentationn, energy consumption and feed production etc.), which produces methane emissions from animals such as sheep, goats, horses, pigs, and cattle are responsible for of Australia’s total agricultural emissions. The remaining are from: management of agricultural soils, application of urea as a fertilizer, liming, rice cultivation, and burning of agricultural residues. The GHG emissions contribution from liming, rice cultivation, and field burning of agricultural residues are tiny compared to other sectors in agriculture.
Reviewing efficient ways to reduce GHG emissions via the application of smart farming technology and other farming techniques have been part of the study as well. The article also captures any possible sources within smart farming that may contribute towards carbon emissions and suggest ways to reduce the resulting GHG emissions. As an example of low GHG emission practices, we have elaborately discussed climate-smart agriculture and how it helps in reducing GHG emissions. This article will help the farmers and other stakeholders to take an environmentally friendly agricultural decision towards the aim of building a more ecological farming approach and contribute their bit towards a green environment.
Author Contributions
Conceptualization: H.P., N.H.S. and N.I.; methodology: H.P., N.H.S. and N.I.; validation: H.P., N.H.S. and N.I.; formal analysis, H.P., N.H.S. and N.I.; investigation, H.P., N.H.S. and N.I.; resources, H.P., N.H.S. and N.I.; writing–original draft preparation: H.P., N.H.S. and N.I.; writing–review and editing: H.P., N.H.S. and N.I. All authors have read and agreed to the published version of the manuscript.
Funding
This research received no external funding.
Institutional Review Board Statement
Not applicable.
Informed Consent Statement
Not applicable.
Acknowledgments
The GHG emissions data entitled “National Greenhouse Gas Inventory” used in this study were downloaded from public archives at the Department of Industry, Science, Energy, and Resources and Australian Greenhouse Gas Emissions Climate Council, Government of Australia. The monthly global mean surface temperature data and figure downloaded from the NASA “GISS Surface Temperature Analysis” public archive database.
Conflicts of Interest
The authors declare that they have no known conflict of research or financial interest that could have influenced the work reported in this paper.
References
- Climate Council of Australia. Australia’s Rising Greenhouse Gas Emissions; Climate Council: Potts Point, Australia, 2018. [Google Scholar]
- Food and Agriculture Organization. World Agriculture: Towards 2015/2030: An FAO Perspective; FAO: London, UK, 2003. [Google Scholar]
- Tsujimoto, S.; Takagi, T.; Osada, T.; Ogino, A. Greenhouse gas reduction and improved sustainability of animal husbandry using amino acids in swine, poultry feeds. Anim. Sci. J. 2013, 84, 409–415. [Google Scholar] [CrossRef]
- Bellarby, J.; Foereid, B.; Hastings, A. Cool Farming: Climate Impacts of Agriculture and Mitigation Potential; Greenpeace International: Amsterdam, The Netherlands, 2008. [Google Scholar]
- Word Bank. Climate-Smart Agriculture: Increased Productivity and Food Security, Enhanced Resilience and Reduced Carbon Emissions for Sustainable Development-Opportunities and Challenges for a Converging Agenda: Country Examples; World Bank: Washington, DC, USA, 2011. [Google Scholar]
- Islam, N.; Ray, B.; Pasandideh, F. IoT Based Smart Farming: Are the LPWAN Technologies Suitable for Remote Communication? In Proceedings of the 2020 IEEE International Conference on Smart Internet of Things (SmartIoT), Beijing, China, 14–16 August 2020; pp. 270–276. [Google Scholar]
- Curry, J.; Harris, N. Powering the Environmental Internet of Things. Sensors 2019, 19, 1940. [Google Scholar] [CrossRef] [PubMed] [Green Version]
- Jackson, T.; Hatfield-Dodds, S.; Zammit, K. Snapshot of Australian Agriculture; Australian Government, Department of Agriculture and Water Resources, ABARES: Canberra, Australia, 2018.
- Chandra, A.; McNamara, K.E.; Dargusch, P. Climate-smart agriculture: Perspectives and framings. Clim. Policy 2018, 18, 526–541. [Google Scholar] [CrossRef]
- Intergovernmental Panel on Climate Change (IPCC). Mitigation of climate change. In Contribution of Working Group III to the Fifth Assessment Report of the Intergovernmental Panel on Climate Change; IPCC: Geneva, Switzerland, 2014; 1454p. [Google Scholar]
- Team, G. GISS Surface Temperature Analysis (GISTEMP), Version 4; NASA Goddard Institute for Space Studies: New York, NY, USA, 2020. Available online: https://data.giss.nasa.gov/gistemp/ (accessed on 9 July 2020).
- Lenssen, N.J.; Schmidt, G.A.; Hansen, J.E.; Menne, M.J.; Persin, A.; Ruedy, R.; Zyss, D. Improvements in the GISTEMP uncertainty model. J. Geophys. Res. Atmos. 2019, 124, 6307–6326. [Google Scholar] [CrossRef]
- Minato, K.; Kouda, Y.; Yamakawa, M.; Hara, S.; Tamura, T.; Osada, T. Determination of GHG and ammonia emissions from stored dairy cattle slurry by using a floating dynamic chamber. Anim. Sci. J. 2013, 84, 165–177. [Google Scholar] [CrossRef] [PubMed]
- Shibata, M.; Terada, F. Factors affecting methane production and mitigation in ruminants. Anim. Sci. J. 2010, 81, 2–10. [Google Scholar] [CrossRef] [PubMed]
- Jantke, K.; Hartmann, M.J.; Rasche, L.; Blanz, B.; Schneider, U.A. Agricultural Greenhouse Gas Emissions: Knowledge and Positions of German Farmers. Land 2020, 9, 130. [Google Scholar] [CrossRef]
- Tubiello, F.N.; Salvatore, M.; Rossi, S.; Ferrara, A.; Fitton, N.; Smith, P. The FAOSTAT database of greenhouse gas emissions from agriculture. Environ. Res. Lett. 2013, 8, 1. [Google Scholar] [CrossRef]
- Meier, E.A.; Thorburn, P.J.; Kragt, M.E.; Dumbrell, N.P.; Biggs, J.S.; Hoyle, F.C.; van Rees, H. Greenhouse gas abatement on southern Australian grains farms: Biophysical potential and financial impacts. Agric. Syst. 2017, 155, 147–157. [Google Scholar] [CrossRef]
- Suzuki, T.; Sommart, K.; Angthong, W.; Nguyen, T.V.; Chaokaur, A.; Nitipot, P.; Phromloungsri, A.; Cai, Y.; Sakai, T.; Nishida, T.; et al. Prediction of enteric methane emission from beef cattle in Southeast Asia. Anim. Sci. J. 2018, 89, 1287–1295. [Google Scholar] [CrossRef]
- Navarro, J.; Bryan, B.; Marinoni, O.; Eady, S.; Halog, A. Production of a map of greenhouse gas emissions and energy use from Australian agriculture. In Proceedings of the 20th International Congress on Modelling and Simulation, Adelaide, Australia, 1–6 December 2013; pp. 1–6. [Google Scholar]
- Authority, C.C.; Emissions, R.A.G.G. Targets and Progress Review Draft Report; Commonwealth of Australia: Canberra, Australia, 2013. [Google Scholar]
- Kulak, M.; Graves, A.; Chatterton, J. Reducing greenhouse gas emissions with urban agriculture: A Life Cycle Assessment perspective. Landsc. Urban Plan. 2013, 111, 68–78. [Google Scholar] [CrossRef]
- Casper, J.K. Greenhouse Gases: Worldwide Impacts; Infobase Publishing: New York, NY, USA, 2010. [Google Scholar]
- Toensmeier, E. The Carbon Farming Solution: A Global Toolkit of Perennial Crops and Regenerative Agriculture Practices for Climate Change Mitigation and food Security; Chelsea Green Publishing: White River Junction, VT, USA, 2016. [Google Scholar]
- Lal, R. Soil carbon sequestration to mitigate climate change. Geoderma 2004, 123, 1–22. [Google Scholar] [CrossRef]
- Islam, N.; Rashid, M.M.; Wibowo, S.; Wasimi, S.; Morshed, A.; Xu, C. Machine learning based approach for Weed Detection in Chilli field using RGB images. In Proceedings of the International Conference on Natural Computation, Fuzzy Systems and Knowledge Discovery, Xi’an, China, 19–21 December 2020; Springer: Berlin/Heidelberg, Germany, 2020; pp. 13–20. [Google Scholar]
- Alam, M.; Alam, M.S.; Roman, M.; Tufail, M.; Khan, M.U.; Khan, M.T. Real-Time Machine-Learning Based Crop/Weed Detection and Classification for Variable-Rate Spraying in Precision Agriculture. In Proceedings of the 2020 7th International Conference on Electrical and Electronics Engineering (ICEEE), Antalya, Turkey, 14–16 April 2020; pp. 273–280. [Google Scholar]
- Prathibha, S.; Hongal, A.; Jyothi, M. IoT based monitoring system in smart agriculture. In Proceedings of the 2017 International Conference on Recent Advances in Electronics and Communication Technology (ICRAECT), Bangalore, India, 16–17 March 2017; pp. 81–84. [Google Scholar]
- Patil, A.S.; Tama, B.A.; Park, Y.; Rhee, K.H. A framework for blockchain based secure smart green house farming. In Advances in Computer Science and Ubiquitous Computing; Springer: Singapore, 2017; pp. 1162–1167. [Google Scholar]
- Villa-Henriksen, A.; Edwards, G.T.; Pesonen, L.A.; Green, O.; Sørensen, C.A.G. Internet of Things in arable farming: Implementation, applications, challenges and potential. Biosyst. Eng. 2020, 191, 60–84. [Google Scholar] [CrossRef]
- Saravanan, K.; Saraniya, S. Cloud IOT based novel livestock monitoring and identification system using UID. Sens. Rev. 2018, 38, 21–33. [Google Scholar]
- De Pinto, A.; Cenacchi, N.; Kwon, H.Y.; Koo, J.; Dunston, S. Climate smart agriculture and global food-crop production. PLoS ONE 2020, 15, e0231764. [Google Scholar] [CrossRef] [PubMed]
- Khatri-Chhetri, A.; Aggarwal, P.K.; Joshi, P.K.; Vyas, S. Farmers’ prioritization of climate-smart agriculture (CSA) technologies. Agric. Syst. 2017, 151, 184–191. [Google Scholar] [CrossRef]
- McNunn, G.; Karlen, D.L.; Salas, W.; Rice, C.W.; Mueller, S.; Muth, D., Jr.; Seale, J.W. Climate smart agriculture opportunities for mitigating soil greenhouse gas emissions across the US Corn-Belt. J. Clean. Prod. 2020, 268, 122240. [Google Scholar] [CrossRef]
- Khatri-Chhetri, A.; Aryal, J.P.; Sapkota, T.B.; Khurana, R. Economic benefits of climate-smart agricultural practices to smallholder farmers in the Indo-Gangetic Plains of India. Curr. Sci. 2016, 110, 1251–1256. [Google Scholar]
- Sapkota, T.B.; Majumdar, K.; Jat, M.L.; Kumar, A.; Bishnoi, D.K.; McDonald, A.; Pampolino, M. Precision nutrient management in conservation agriculture based wheat production of Northwest India: Profitability, nutrient use efficiency and environmental footprint. Field Crop. Res. 2014, 155, 233–244. [Google Scholar] [CrossRef]
- Maraseni, T.; An-Vo, D.A.; Mushtaq, S.; Smith, K.R. Carbon smart agriculture: An integrated regional approach offers significant potential to increase profit and resource use efficiency, and reduce emissions. J. Clean. Prod. 2020, 124555. [Google Scholar] [CrossRef]
- Pittelkow, C.M.; Liang, X.; Linquist, B.A.; Van Groenigen, K.J.; Lee, J.; Lundy, M.E.; Van Gestel, N.; Six, J.; Venterea, R.T.; Van Kessel, C. Productivity limits and potentials of the principles of conservation agriculture. Nature 2015, 517, 365–368. [Google Scholar] [CrossRef] [PubMed]
- Gangopadhyay, P.K.; Khatri-Chhetri, A.; Shirsath, P.B.; Aggarwal, P.K. Spatial targeting of ICT-based weather and agro-advisory services for climate risk management in agriculture. Clim. Chang. 2019, 154, 241–256. [Google Scholar] [CrossRef] [Green Version]
- Banayo, N.P.; Haefele, S.M.; Desamero, N.V.; Kato, Y. On-farm assessment of site-specific nutrient management for rainfed lowland rice in the Philippines. Field Crop. Res. 2018, 220, 88–96. [Google Scholar] [CrossRef]
- Mitu, S.M.; Akter, N.; Mahmud, M. Rice Plant Nitrogen Deficiency Detection By Leaf Color Chart (LCC). 2019. Available online: http://dspace.daffodilvarsity.edu.bd:8080/handle/123456789/3436 (accessed on 30 August 2020).
- Kumar, S.; Thombare, P.; Kale, P. Climate smart agriculture: Challenges, implications, innovations for achieving food and nutrition security. Agric. Food Newsl. 2019, 1, 267–271. [Google Scholar]
- Pagliacci, F.; Defrancesco, E.; Mozzato, D.; Bortolini, L.; Pezzuolo, A.; Pirotti, F.; Pisani, E.; Gatto, P. Drivers of farmers’ adoption and continuation of climate-smart agricultural practices. A study from northeastern Italy. Sci. Total. Environ. 2020, 710, 136345. [Google Scholar] [CrossRef]
- Smith, P.; Martino, D.; Cai, Z.; Gwary, D.; Janzen, H.; Kumar, P.; McCarl, B.; Ogle, S.; O’Mara, F.; Rice, C.; et al. Greenhouse gas mitigation in agriculture. Philos. Trans. R. Soc. Biol. Sci. 2008, 363, 789–813. [Google Scholar] [CrossRef] [PubMed] [Green Version]
- Banhazi, T.M.; Lehr, H.; Black, J.; Crabtree, H.; Schofield, P.; Tscharke, M.; Berckmans, D. Precision livestock farming: An international review of scientific and commercial aspects. Int. J. Agric. Biol. Eng. 2012, 5, 1–9. [Google Scholar]
- O’Grady, M.J.; O’Hare, G.M. Modelling the smart farm. Inf. Process. Agric. 2017, 4, 179–187. [Google Scholar] [CrossRef]
- Broucek, J. Production of methane emissions from ruminant husbandry: A review. J. Environ. Prot. 2014, 5, 1482. [Google Scholar] [CrossRef]
- Bell, M.J.; Potterton, S.; Craigon, J.; Saunders, N.; Wilcox, R.; Hunter, M.; Goodman, J.; Garnsworthy, P. Variation in enteric methane emissions among cows on commercial dairy farms. Animal 2014, 8, 1540–1546. [Google Scholar] [CrossRef]
- Ramin, M.; Huhtanen, P. Nordic dairy cow model Karoline in predicting methane emissions: 2. Model evaluation. Livest. Sci. 2015, 178, 81–93. [Google Scholar] [CrossRef]
- Jaurena, G.; Cantet, J.M.; Arroquy, J.I.; Palladino, R.A.; Wawrzkiewicz, M.; Colombatto, D. Prediction of the Ym factor for livestock from on-farm accessible data. Livest. Sci. 2015, 177, 52–62. [Google Scholar] [CrossRef]
- Eckard, R. RE: Greenhouse Gas Emissions from Agriculture–Reduction Options; IAEA: Vienna, Austria, 2010. [Google Scholar]
- Eckard, R.; Hegarty, R. Best Management Practices for Reducing Greenhouse Gas Emissions From Dairy Farms. New South Wales Agriculture and The University of Melbourne. 2014. Available online: http://www.greenhouse.unimelb.edu.au/BMP_Dairy_Farm.htm (accessed on 11 January 2021).
- Cotton Australia. Australian Cotton Sustainability Report 2019. 2020. Available online: http://27.111.91.222/xmlui/handle/1/4770 (accessed on 1 June 2020).
- Cook, S.; Harvey, S.; Connolly, C.; Poggio, M. Economic Assessment of Best Management Practices for Banana Growing, Report to the Department of Environment and Science through Funding from the Reef Water Quality Science Program, RP140B Adoption Innovation Profile Report; Department of Agriculture and Fisheries (DAF): Brisbane, Australia, 2018.
- Poggio, M.; Renouf, M.; Connolly, C.; Thompson, M. Profitability and environmental implications when growers transition to best management practices. Int. Sugar J. 2018, 120, 704–711. [Google Scholar]
- Sudmeyer, R.; Parker, J.; Nath, T.; Ghose, A. Carbon farming in relation to Western Australian agriculture. Bulletin 2014, 4856, 1–74. [Google Scholar]
- Waghorn, G.; Woodward, S.; Tavendale, M.; Clark, D. Inconsistencies in Rumen Methane Production—Effects of Forage Composition and Animal Genotype; International Congress Series; Elsevier: Amsterdam, The Netherlands, 2006; Volume 1293, pp. 115–118. [Google Scholar]
- Carulla, J.; Kreuzer, M.; Machmüller, A.; Hess, H. Supplementation of Acacia mearnsii tannins decreases methanogenesis and urinary nitrogen in forage-fed sheep. Aust. J. Agric. Res. 2005, 56, 961–970. [Google Scholar] [CrossRef]
- Grainger, C.; Clarke, T.; Auldist, M.; Beauchemin, K.; McGinn, S.; Waghorn, G.; Eckard, R.J. Potential use of Acacia mearnsii condensed tannins to reduce methane emissions and nitrogen excretion from grazing dairy cows. Can. J. Anim. Sci. 2009, 89, 241–251. [Google Scholar] [CrossRef] [Green Version]
- Trapnell, L.; Malcolm, B. Economic analysis of changing from a 300 day lactation to an extended lactation dairy system. In Proceedings of the Biennial Conference of the Australasian Farm Business Management Network; Marcus Oldham College: Geelong, Australia, 2006. [Google Scholar]
- Netz, B.; Davidson, O.; Bosch, P.; Dave, R.; Meyer, L. Climate Change 2007: Mitigation. Contribution of Working Group III to the Fourth Assessment Report of the Intergovernmental Panel on Climate Change. Summary for Policymakers; Intergovernmental Panel on Climate Change (IPCC): Geneva, Switzerland, 2007.

Figure 2.
Global emissions by economic sector [10].
Figure 2.
Global emissions by economic sector [10].

Figure 3.
Overall GHG emissions from different sectors in Australia [1].
Figure 3.
Overall GHG emissions from different sectors in Australia [1].

Figure 4.
Yearly CO2 emission within agricultural section in different parts of Australia.


Publisher’s Note: MDPI stays neutral with regard to jurisdictional claims in published maps and institutional affiliations. |
© 2021 by the authors. Licensee MDPI, Basel, Switzerland. This article is an open access article distributed under the terms and conditions of the Creative Commons Attribution (CC BY) license (http://creativecommons.org/licenses/by/4.0/).
Share and Cite
MDPI and ACS Style
Panchasara, H.; Samrat, N.H.; Islam, N. Greenhouse Gas Emissions Trends and Mitigation Measures in Australian Agriculture Sector—A Review. Agriculture 2021, 11, 85. https://0-doi-org.brum.beds.ac.uk/10.3390/agriculture11020085
AMA Style
Panchasara H, Samrat NH, Islam N. Greenhouse Gas Emissions Trends and Mitigation Measures in Australian Agriculture Sector—A Review. Agriculture. 2021; 11(2):85. https://0-doi-org.brum.beds.ac.uk/10.3390/agriculture11020085
Chicago/Turabian StylePanchasara, Heena, Nahidul Hoque Samrat, and Nahina Islam. 2021. "Greenhouse Gas Emissions Trends and Mitigation Measures in Australian Agriculture Sector—A Review" Agriculture 11, no. 2: 85. https://0-doi-org.brum.beds.ac.uk/10.3390/agriculture11020085
Note that from the first issue of 2016, this journal uses article numbers instead of page numbers. See further details here.