Co-Inoculation of Aflatoxigenic and Non-Aflatoxigenic Strains of Aspergillus flavus to Assess the Efficacy of Non-Aflatoxigenic Strains in Growth Inhibition and Aflatoxin B1 Reduction

 ,
,  and
and
Abstract
:1. Introduction
2. Materials and Methods
2.1. Fungal Strains
2.2. Preparation of Media and Inoculum
2.3. Diametric Growth Rates of Aflatoxigenic and Non-aflatoxigenic Aspergillus flavus on Malt Extract Agar
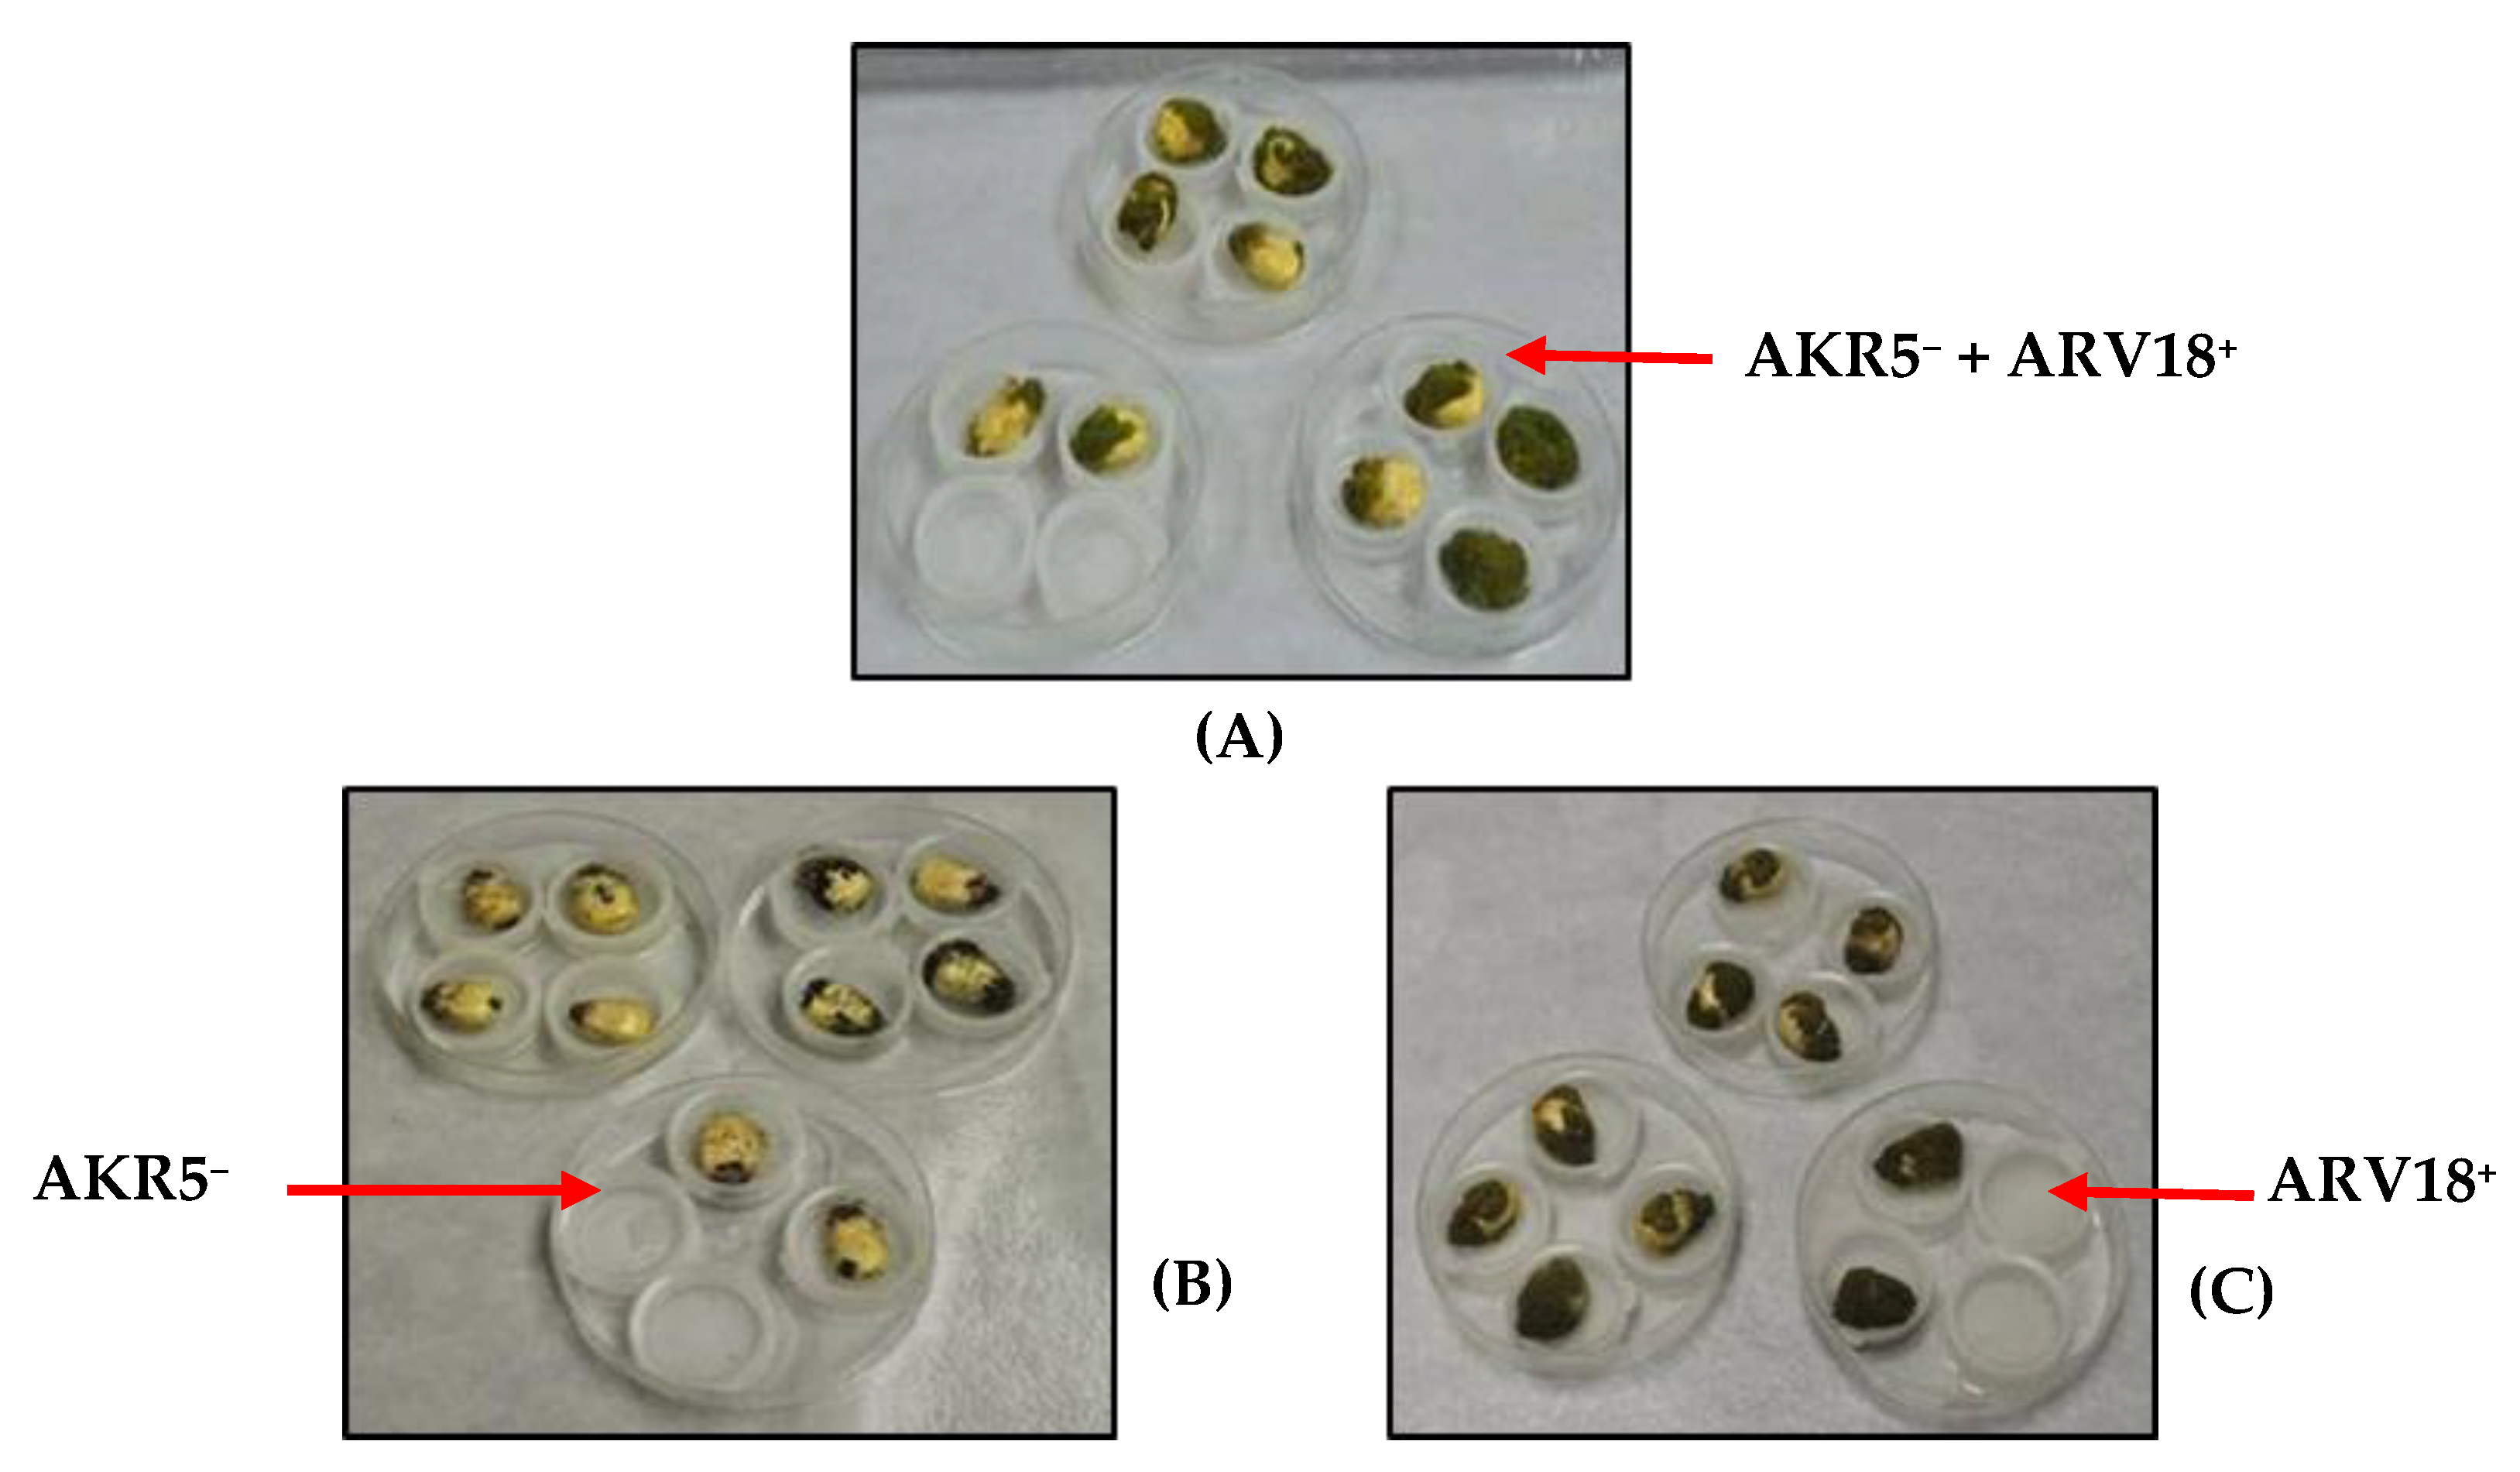
2.4. In Vitro Inoculation
2.5. Aflatoxin Analysis
2.5.1. Chemical and Reagents
2.5.2. Preparation of Standard Solutions of Aflatoxin B1
2.5.3. Aflatoxin Extraction and Cleanup
2.5.4. High-Pressure Liquid Chromatography Procedure
2.6. Statistical Analysis
3. Results
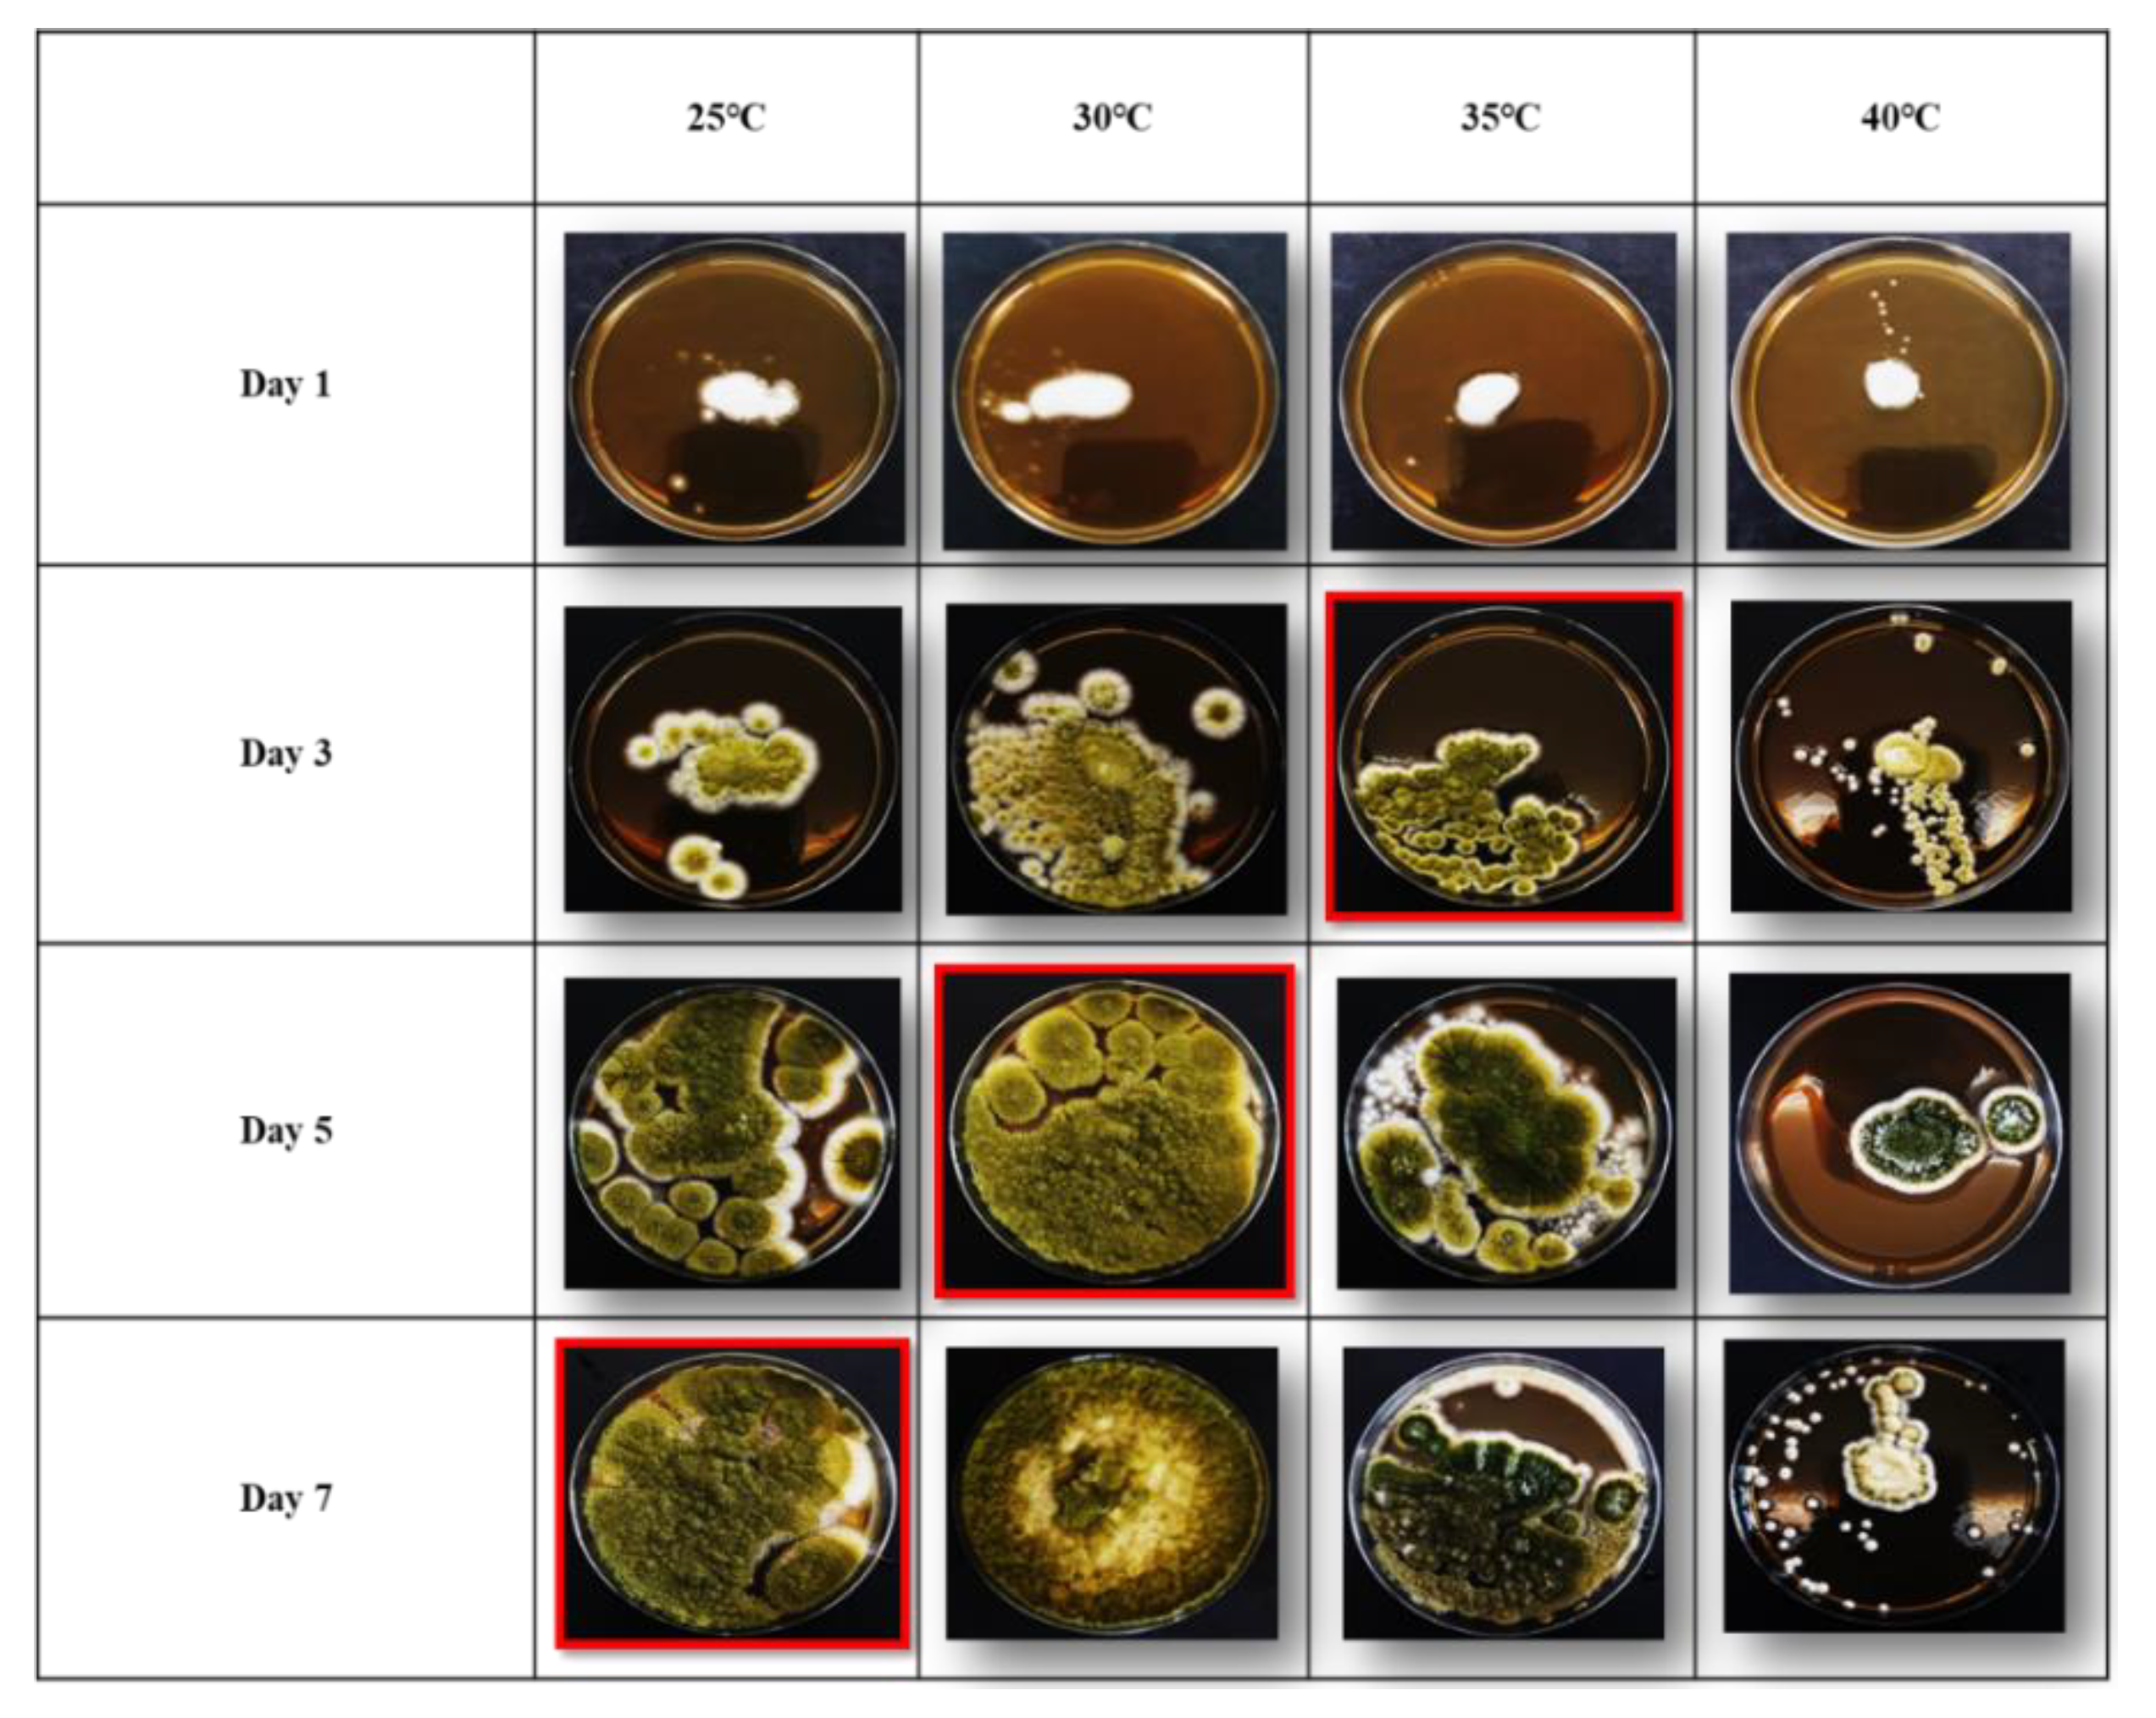
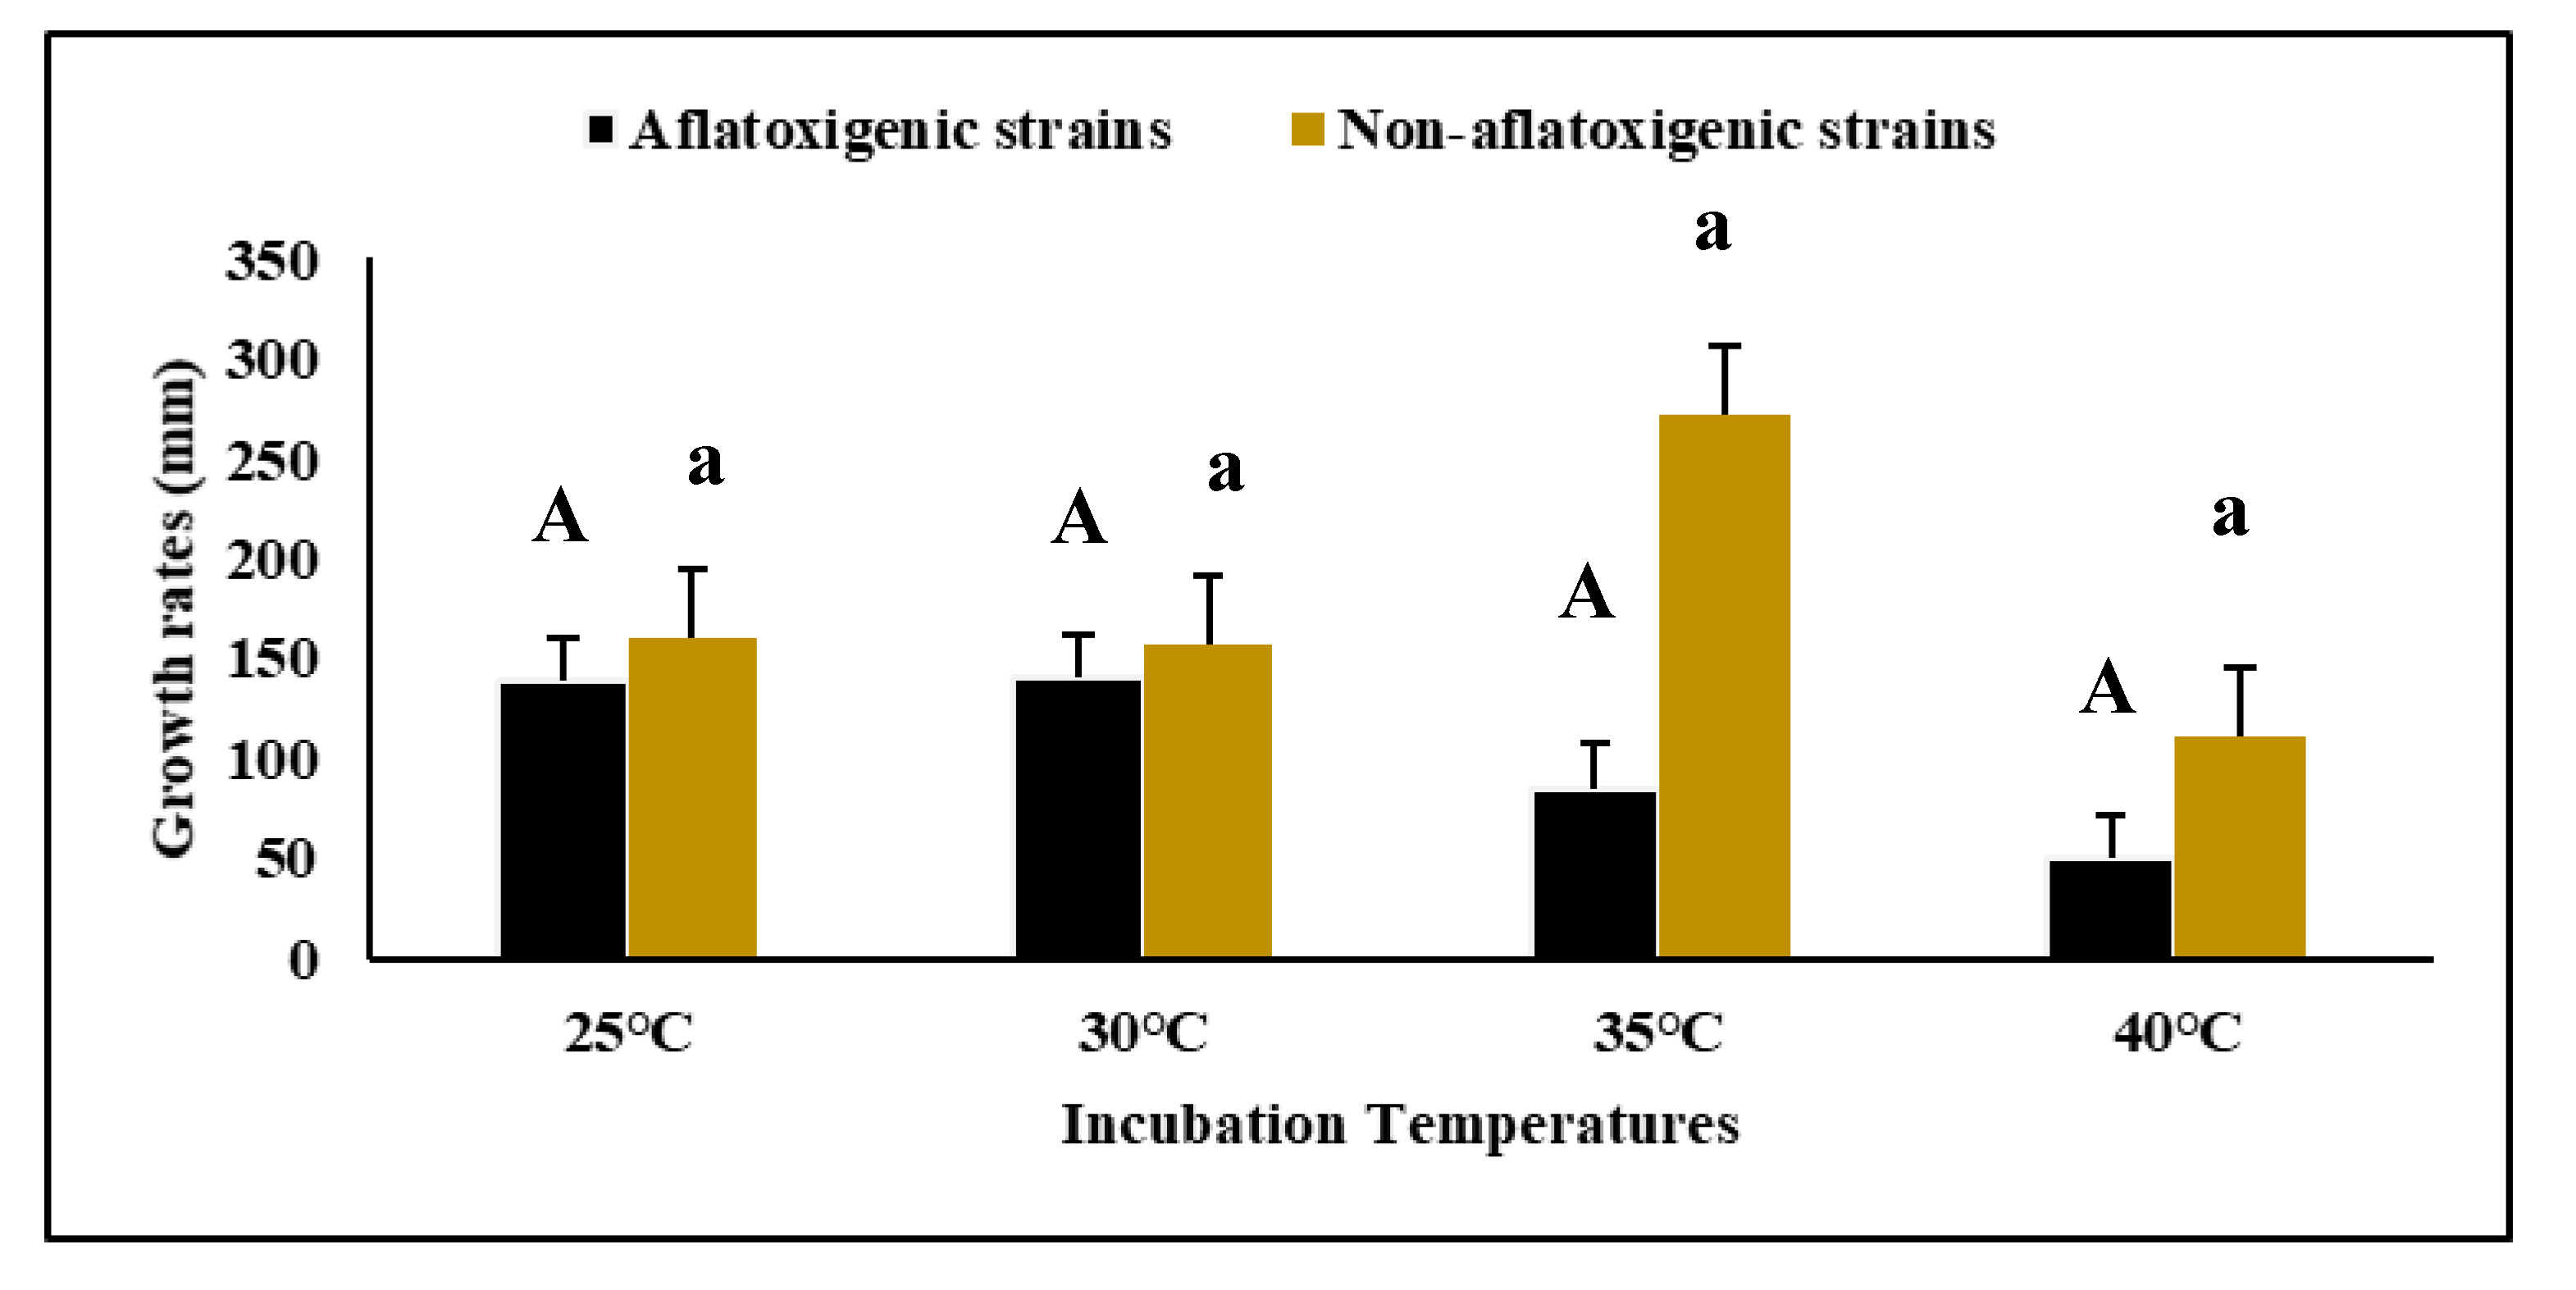
3.1. Growth Rates of Aspergillus flavus on Malt Extract Agar
3.2. Detection of Aflatoxin B1 Using High-Performance Liquid Chromatography
3.3. LOD and LOQ for Aflatoxin B1
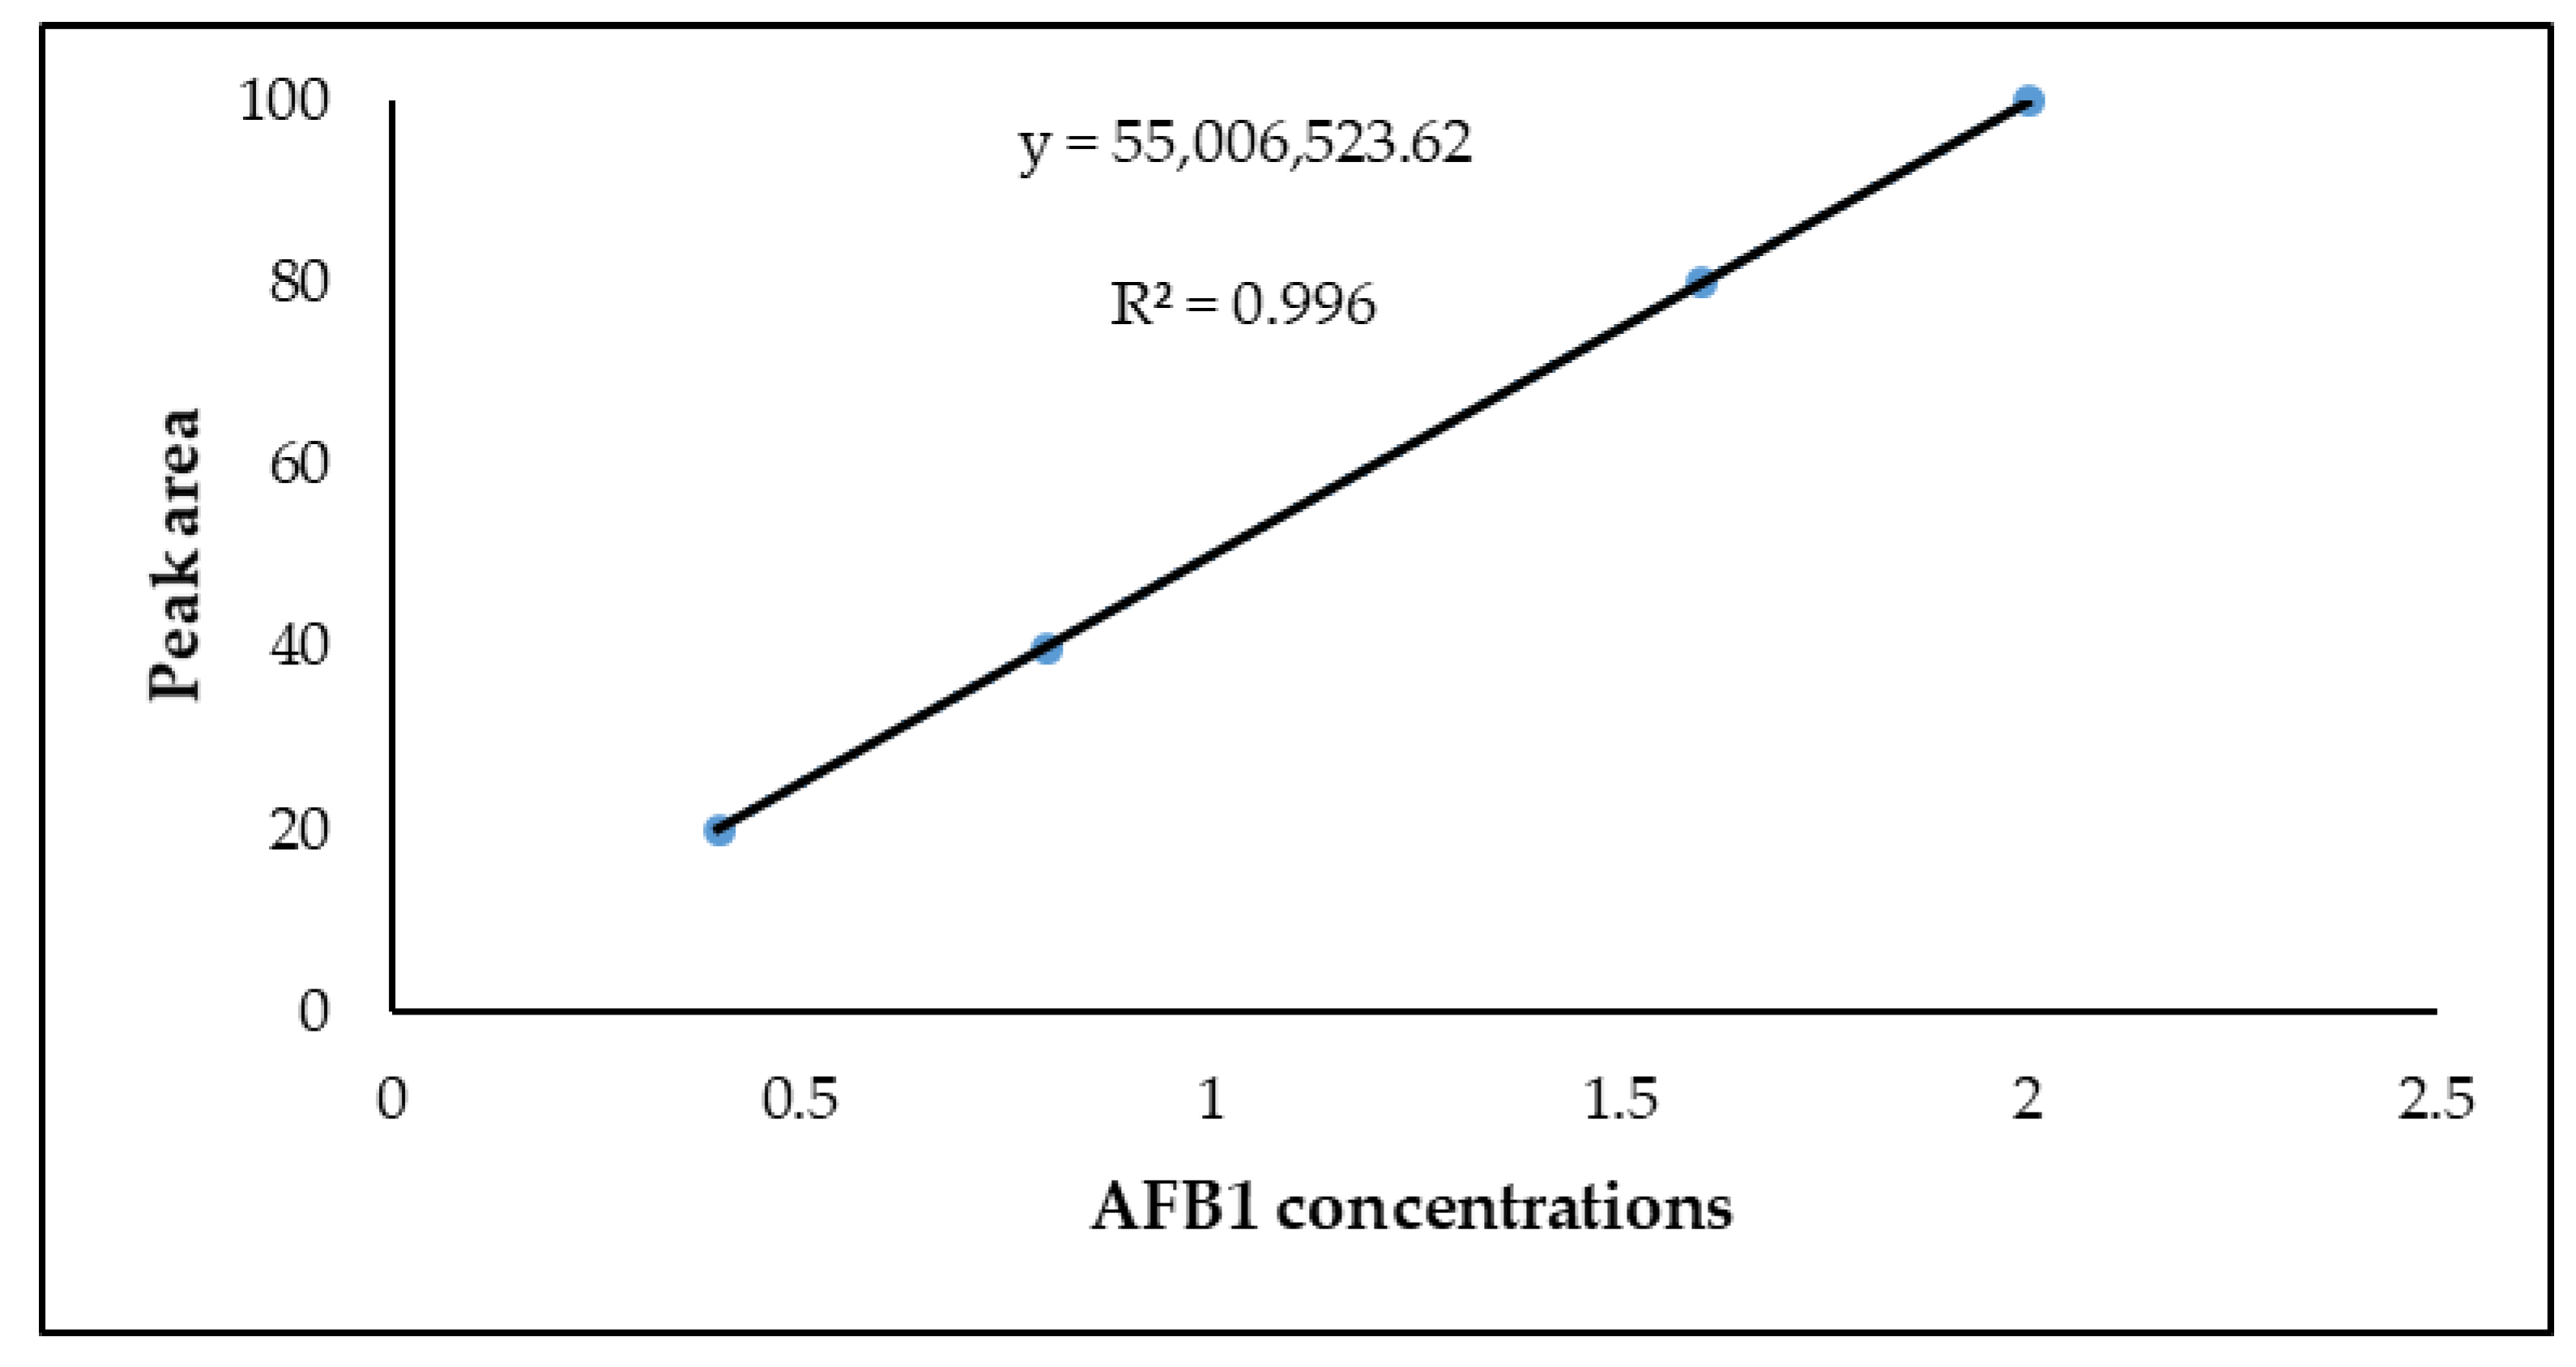
3.4. Linearity
3.5. Quantification and Reduction of Aflatoxin B1
4. Discussion
5. Conclusions
Author Contributions
Funding
Acknowledgments
Conflicts of Interest
References
- Aycicek, H.; Aksoy, A.; Saygi, S. Determination of aflatoxin levels in some dairy and food products consumed in Ankara, Turkey. Food Control. 2005, 16, 263–266. [Google Scholar] [CrossRef]
- Herrman, T.J.; Trigo-Stockli, D.; Pedersen, J.R. Mycotoxins in Feed Grains and Ingredients; Cooperative Extension Service, Kansas State University: New York, NY, USA, 2002; pp. 1–8. [Google Scholar]
- Munkvold, G.P.; Arias, S.; Taschl, I.; Gruber-Dorninger, C. Mycotoxins in corn: Occurrence, impacts, and management. Corn 2019, 3, 235–287. [Google Scholar]
- European Commission (EC). Directive 2002/32/EC of the European Parliament and the Council on undesirable substances in animal feed. Off. J. Eur. Union 2002, 2, 10–22. [Google Scholar]
- Hassan, F.F.; Al-Jibouri, M.H.; Kareem, K. Isolation and Identification of Fungal Propagation in Stored Maize and detection of aflatoxin B1 Using TLC and ELISA Technique. Iraqi J. of Sci. 2014, 55, 634–642. [Google Scholar]
- McGuire, S. World cancer report 2014. Geneva, Switzerland: World Health Organization; International Agency for Research on Cancer; WHO Press, 2015. Adv. Nutr. 2016, 2, 418–419. [Google Scholar] [CrossRef] [Green Version]
- Ishadi, A.; Mazlan, N. Insecticide use impacts on pest resistance: An evidence from diamondback moth. Int. J. Sci. Basic Appl. Res. 2015, 22, 131–150. [Google Scholar]
- Abdallah, F.M.; Girgin, G.; Baydar, T. Occurrence, prevention and limitation of mycotoxins in feeds. Anim. Nutr. Feed. Technol. 2015, 15, 471–490. [Google Scholar] [CrossRef]
- Khan, R.; Ghazali, F.M.; Mahyudin, N.A.; Samsudin, N.I.P. Morphological characterization, and determination of aflatoxigenic and non-aflatoxigenic Aspergillus flavus isolated from sweet corn kernels and soil in Malaysia. Agriculture 2020, 10, 450. [Google Scholar] [CrossRef]
- Yin, Z.; Wang, Y.; Wu, F.; Gu, X.; Bian, Y.; Wang, Y.; Deng, D. Quantitative trait locus mapping of resistance to Aspergillus flavus infection using a recombinant inbred line population in maize. Mol. Breed. 2013, 33, 39–49. [Google Scholar] [CrossRef]
- Ortega-Beltran, A.; Cotty, P.J. Frequent shifts in Aspergillus flavus populations associated with maize production in Sonora, Mexico. Phytopathology 2018, 108, 412–420. [Google Scholar] [CrossRef] [Green Version]
- Ehrlich, K.C.; Mack, B.M. Comparison of expression of secondary metabolite biosynthesis cluster genes in Aspergillus flavus, A. parasiticus, and A. oryzae. Toxins 2014, 6, 1916–1928. [Google Scholar] [CrossRef] [PubMed]
- Chang, P.-K.; Scharfenstein, L.L.; Li, R.W.; Arroyo-Manzanares, N.; De Saeger, S.; Di Mavungu, J.D. Aspergillus flavus aswA, a gene homolog of Aspergillus nidulans oefC, regulates sclerotial development and biosynthesis of sclerotium-associated secondary metabolites. Fungal Genet. Biol. 2017, 104, 29–37. [Google Scholar] [CrossRef] [PubMed]
- Ehrlich, K.; Moore, G.; Mellon, J.; Bhatnagar, D. Challenges facing the biological control strategy for eliminating aflatoxin contamination. World Mycotoxin J. 2015, 8, 225–233. [Google Scholar] [CrossRef]
- Abbas, H.; Accinelli, C.; Shier, W.T. Biological control of aflatoxin contamination in US crops and the use of bioplastic formulations of Aspergillus flavus biocontrol strains to optimize application strategies. J. Agric. Food Chem. 2017, 65, 7081–7087. [Google Scholar] [CrossRef] [PubMed]
- Kachapulula, P.W.; Akello, J.; Bandyopadhyay, R.; Cotty, P.J. Aspergillus section Flavi community structure in Zambia influence aflatoxin contamination of maize and groundnut. Int. J. Food Microbiol. 2017, 261, 49–56. [Google Scholar] [CrossRef] [PubMed]
- Ortega-Beltran, A.; Bandyopadhyay, R. Comments on trial summary on the comparison of various non-aflatoxigenic strains of Aspergillus flavus on mycotoxin levels and yield in maize by M.S. Molo, et al. Agron. J. 2019, 111, 2625–2631. [Google Scholar]
- Damann, J. Atoxigenic Aspergillus flavus biological control of aflatoxin contamination: What is the mechanism? World Mycotoxin J. 2015, 8, 235–244. [Google Scholar] [CrossRef]
- Wei, D.; Zhou, L.; Selvaraj, J.N.; Zhang, C.; Xing, F.; Zhao, Y.; Wang, Y.; Liu, Y. Molecular characterization of atoxigenic Aspergillus flavus isolates collected in China. J. Microbiol. 2014, 52, 559–565. [Google Scholar] [CrossRef]
- Mauro, A.; Battilani, P.; Cotty, P.J. Atoxigenic Aspergillus flavus endemic to Italy for biocontrol of aflatoxins in maize. BioControl 2014, 60, 125–134. [Google Scholar] [CrossRef]
- Bandyopadhyay, R.; Ortega-Beltran, A.; Akande, A.; Mutegi, C.; Atehnkeng, J.; Kaptoge, L.; Senghor, A.; Adhikari, B.; Cotty, P. Biological control of aflatoxins in Africa: Current status and potential challenges in the face of climate change. World Mycotoxin J. 2016, 9, 771–789. [Google Scholar] [CrossRef] [Green Version]
- Samsudin, N.I.P.; Medina, A.; Magan, N. Relationship between environmental conditions, carbon utilization patterns, and niche overlap indices of the mycotoxigenic species Fusarium verticillioides and the biocontrol agent Clonostachys rosea. Fungal Ecol. 2016, 24, 44–52. [Google Scholar] [CrossRef] [Green Version]
- Doster, M.A.; Cotty, P.J.; Michailides, T.J. Evaluation of the atoxigenic Aspergillus flavus strain AF36 in Pistachio orchards. Plant Dis. 2014, 98, 948–956. [Google Scholar] [CrossRef] [Green Version]
- Baquião, A.C.; De Oliveira, M.M.M.; Reis, T.A.; Zorzete, P.; Atayde, D.D.; Correa, B. Polyphasic approach to the identification of Aspergillus section Flavi isolated from Brazil nuts. Food Chem. 2013, 139, 1127–1132. [Google Scholar] [CrossRef] [PubMed] [Green Version]
- Malachová, A.; Sulyok, M.; Beltrán, E.; Berthiller, F.; Krska, R. Optimization, and validation of a quantitative liquid chromatography-tandem mass spectrometric method covering 295 bacterial and fungal metabolites including all regulated mycotoxins in four model food matrices. J. Chromatogr. A 2014, 1362, 145–156. [Google Scholar] [CrossRef] [PubMed] [Green Version]
- Kong, W.; Li, J.-Y.; Qiu, F.; Wei, J.-H.; Xiao, X.-H.; Zheng, Y.; Yang, M.-H. Development of a sensitive and reliable high-performance liquid chromatography method with fluorescence detection for high-throughput analysis of multi-class mycotoxins in Coix seed. Anal. Chim. Acta 2013, 799, 68–76. [Google Scholar] [CrossRef] [PubMed]
- Ehrlich, K.C. Non-aflatoxigenic Aspergillus flavus to prevent aflatoxin contamination in crops: Advantages and limitations. Front. Microbiol. 2014, 5, 50. [Google Scholar] [CrossRef]
- Bhatnagar-Mathur, P.; Sunkara, S.; Bhatnagar-Panwar, M.; Waliyar, F.; Sharma, K.K. Biotechnological advances for combating Aspergillus flavus and aflatoxin contamination in crops. Plant Sci. 2015, 234, 119–132. [Google Scholar] [CrossRef] [PubMed] [Green Version]
- Mohale, S.; Medina, A.; Magan, N. Effect of environmental factors on in vitro and situ interactions between atoxigenic and toxigenic A. flavus strains and control of aflatoxin contamination of maize. Biocontrol Sci. Technol. 2013, 23, 776–793. [Google Scholar] [CrossRef]
- Probst, C.; Bandyopadhyay, R.; Cotty, P.J. Diversity of aflatoxin-producing fungi and their impact on food safety in sub-Saharan Africa. Int. J. Food Microbiol. 2014, 174, 113–122. [Google Scholar] [CrossRef]
- Pitt, J.; Taniwaki, M.H.; Cole, M.B. Mycotoxin production in major crops as influenced by growing, harvesting, storage, and processing, with emphasis on the achievement of food safety objectives. Food Control. 2013, 32, 205–215. [Google Scholar] [CrossRef]
- Degola, F.; Morcia, C.; Bisceglie, F.; Mussi, F.; Tumino, G.; Ghizzoni, R.; Pelosi, G.; Terzi, V.; Buschini, A.; Restivo, F.M.; et al. In vitro evaluation of the activity of thiosemicarbazone derivatives against mycotoxigenic fungi affecting cereals. Int. J. Food Microbiol. 2015, 200, 104–111. [Google Scholar] [CrossRef] [PubMed]
- Jantapan, K.; Poapolathep, A.; Imsilp, K.; Poapolathep, S.; Tanhan, P.; Kumagai, S.; Jermnak, U. Inhibitory effects of Thai essential oils on potentially aflatoxigenic Aspergillus parasiticus and Aspergillus flavus. Biocontrol Sci. 2017, 22, 31–40. [Google Scholar] [CrossRef] [PubMed] [Green Version]
- Spraker, J.E.; Jewell, K.; Roze, L.V.; Scherf, J.; Ndagano, D.; Beaudry, R.; Linz, J.E.; Allen, C.; Keller, N.P. A volatile relationship: Profiling an inter-kingdom dialogue between two plant pathogens, Ralstonia solanacearum, and Aspergillus flavus. J. Chem. Ecol. 2014, 40, 502–513. [Google Scholar] [CrossRef] [PubMed]
- Xu, D.; Wang, H.; Zhang, Y.; Yang, Z.; Sun, X. Inhibition of non-toxigenic Aspergillus niger FS10 isolated from Chinese fermented soybean on growth and aflatoxin B1 production by Aspergillus flavus. Food Control. 2013, 32, 359–365. [Google Scholar] [CrossRef]
- Torres, A.; Barros, G.; Palacios, S.; Chulze, S.N.; Battilani, P. Review on pre-and post-harvest management of peanuts to minimize aflatoxin contamination. Food Res. Int. 2014, 62, 11–19. [Google Scholar] [CrossRef]
- Moore, G.G.; Mack, B.M.; Beltz, S.B. Testing the efficacy of eGFP-transformed Aspergillus flavus as biocontrol strains. Food Nutr. Sci. 2013, 4, 469. [Google Scholar]


| AF | LOD (ppb) a | LOQ (ppb) b | Calibration Curve c | R2 |
|---|---|---|---|---|
| AFB1 | 0.072 | 0.220 | y = 55,006,523.62 | 0.9960 |
| Strains | Concentrations (ppb) | |
|---|---|---|
| AFB1 | ||
| Non-aflatoxigenic strains | AKR1− | ND |
| AKR5− | ND | |
| AKL34− | ND | |
| AKL35− | ND | |
| AKL36− | ND | |
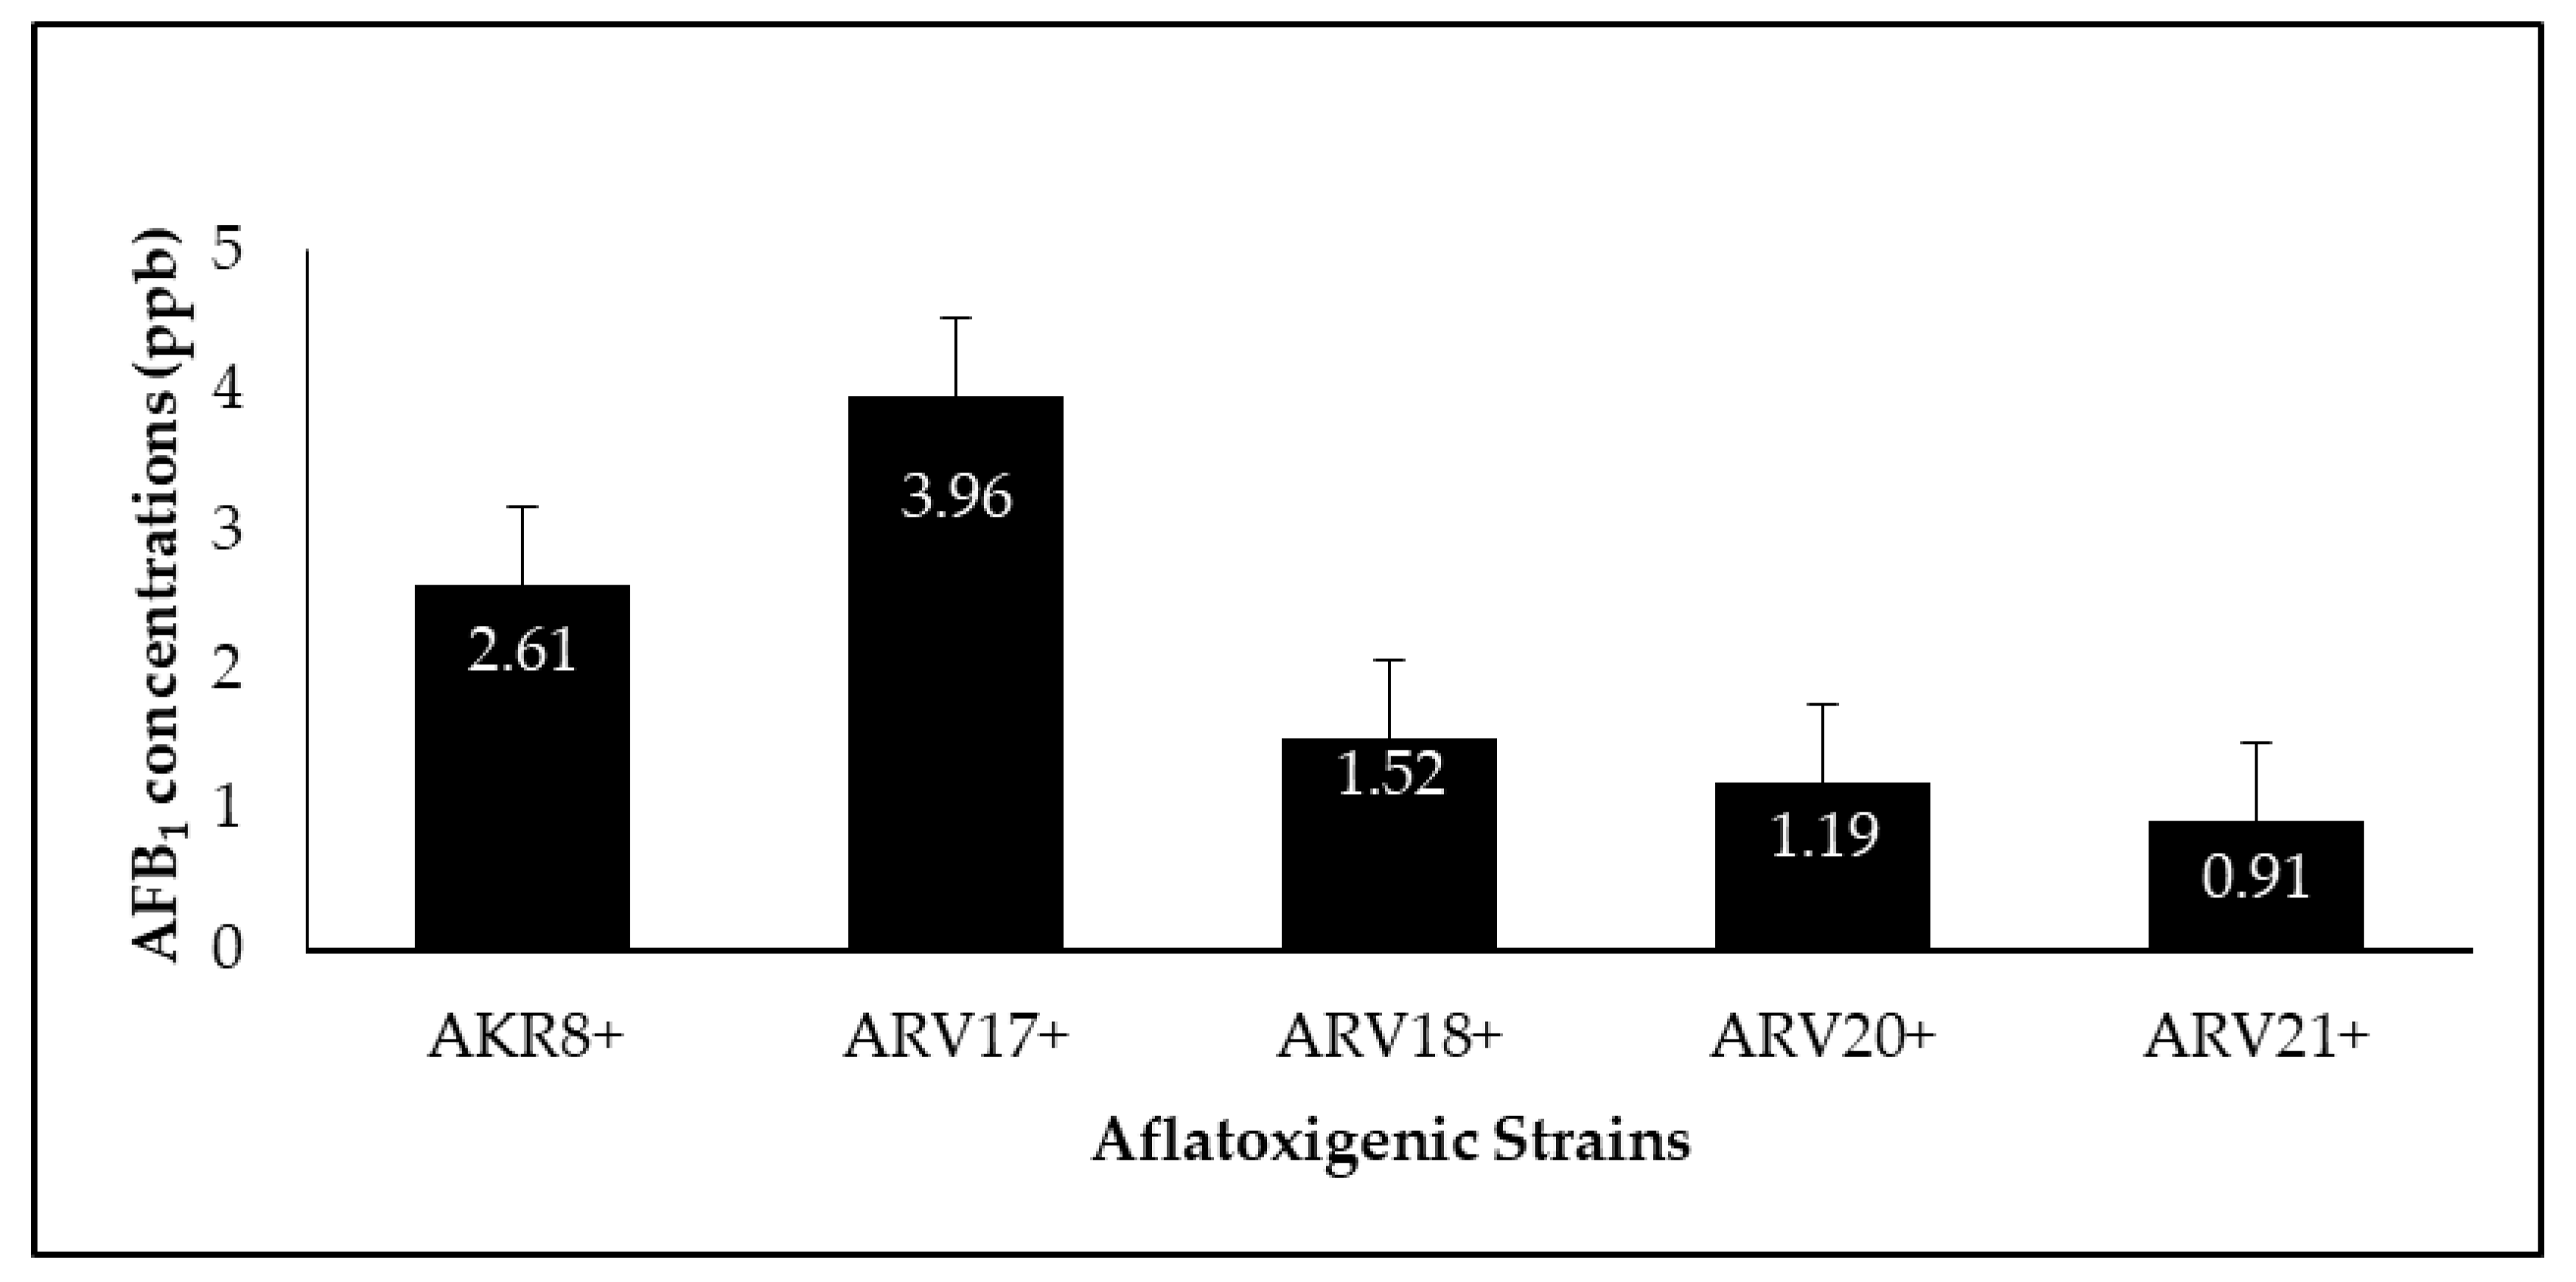
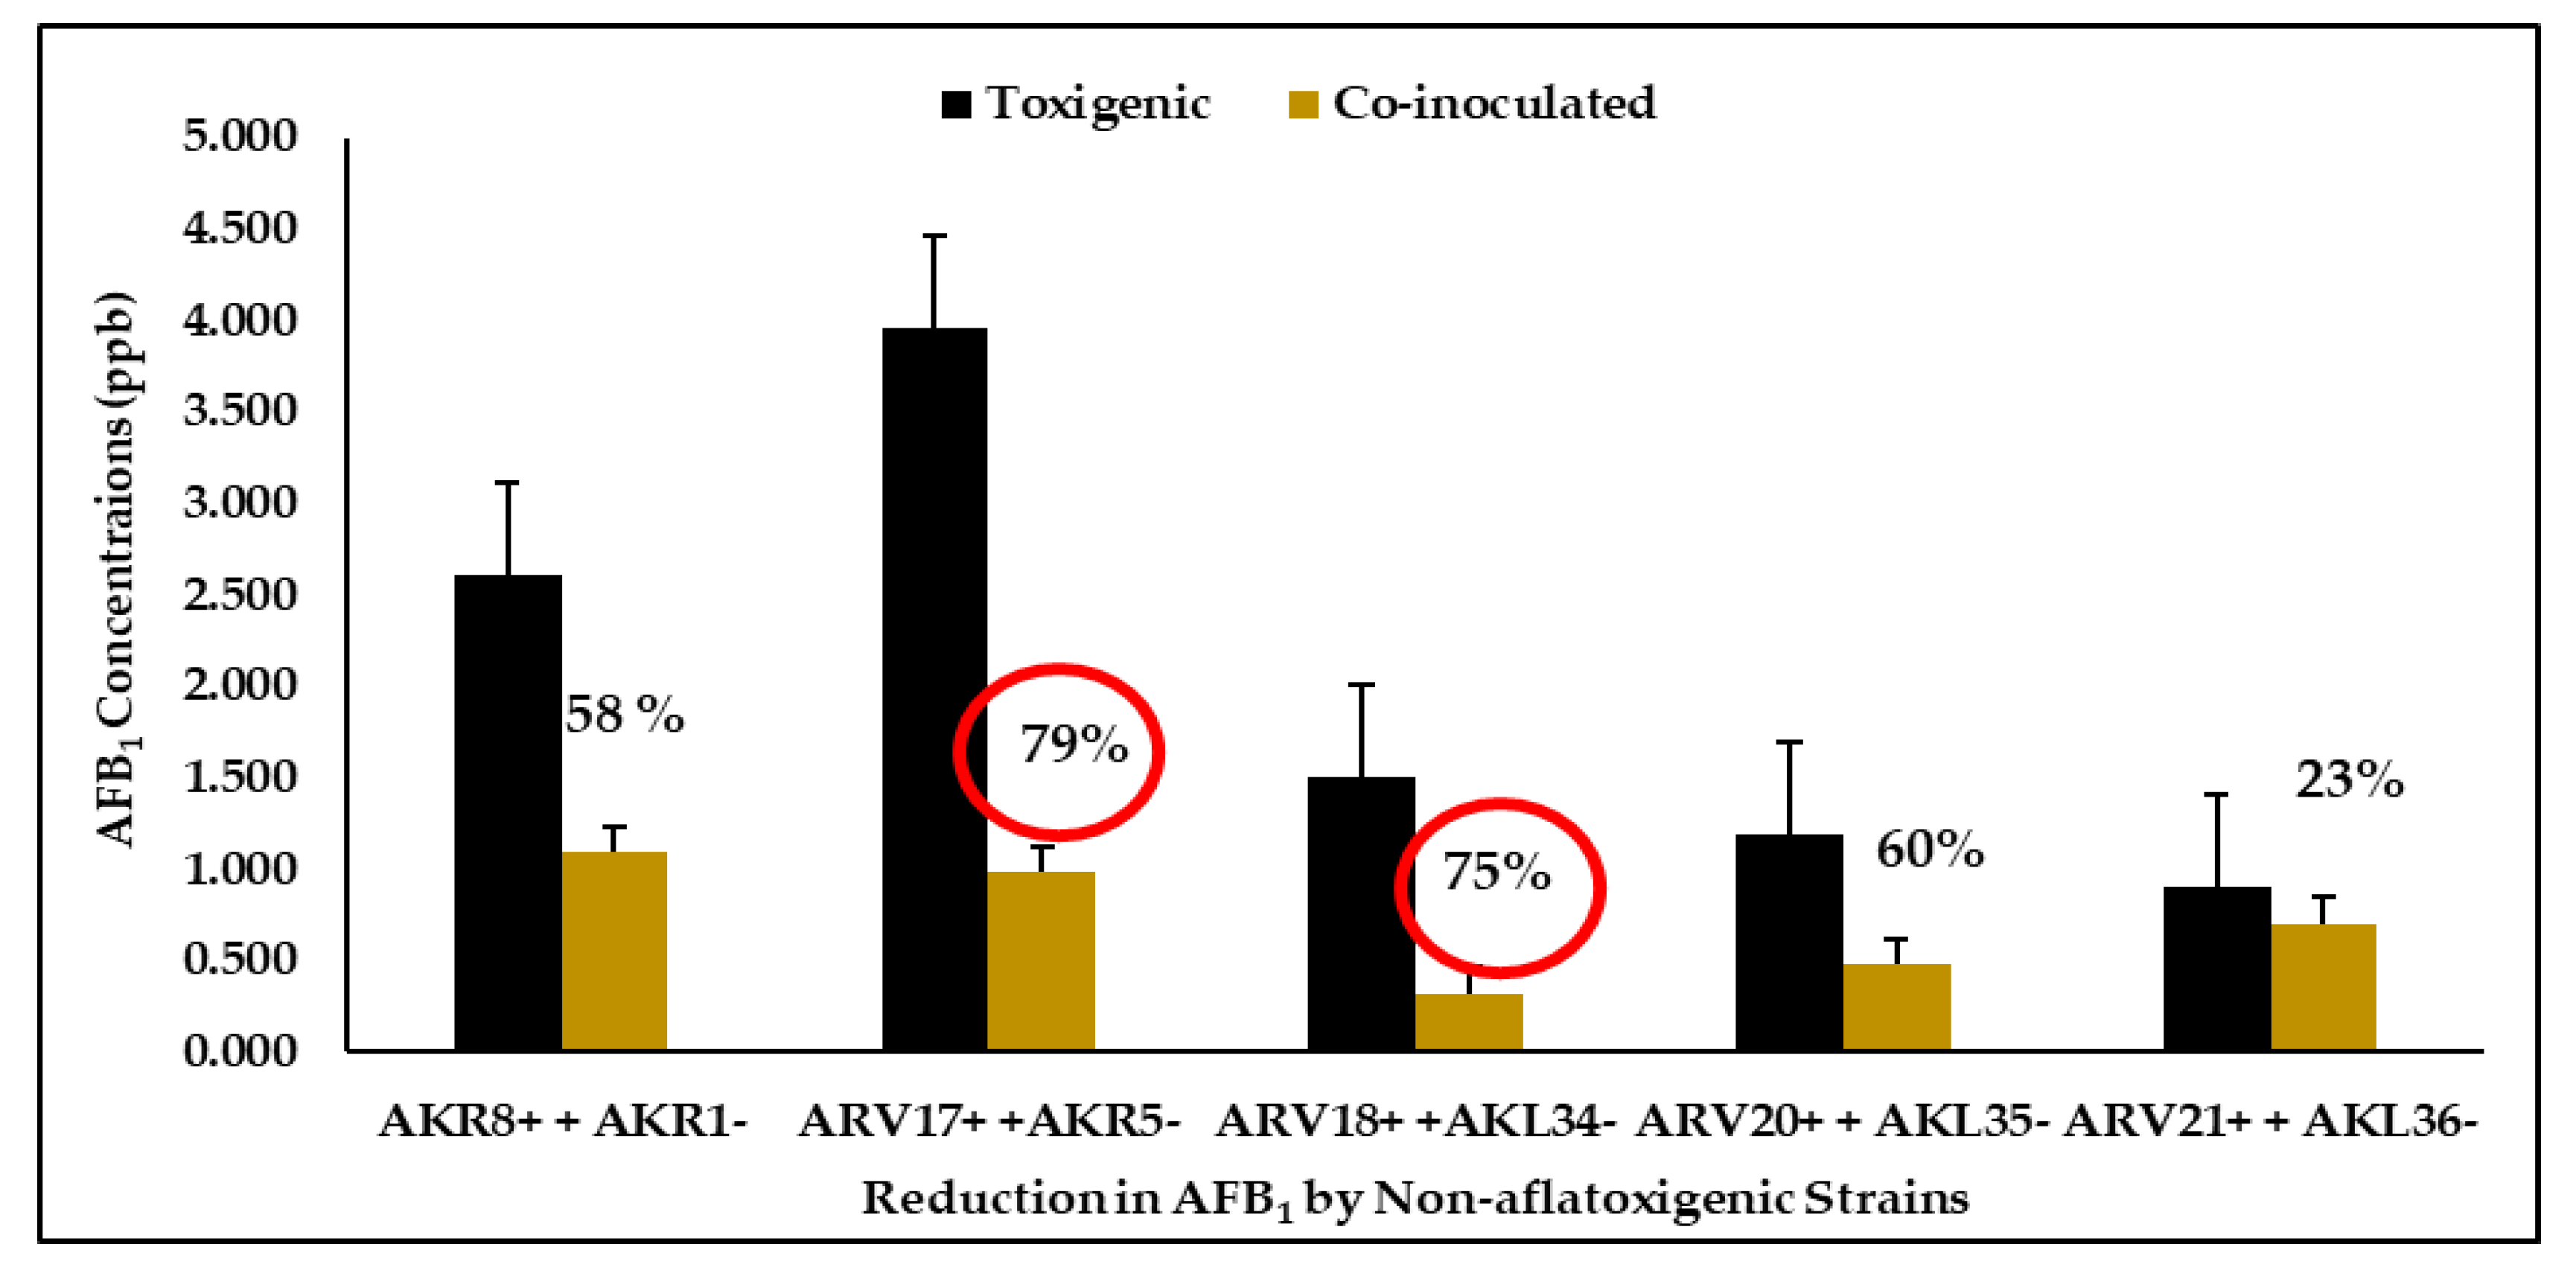
| Aflatoxigenic strains | AKR8+ | 2.615 ± 0.12 |
| ARV17+ | 3.962 ± 0.32 | |
| ARV18+ | 1.509 ± 0.39 | |
| ARV20+ | 1.195 ± 0.51 | |
| ARV21+ | 0.907 ± 0.11 | |
| Co-inoculated strains | AKR1− + AKR8+ | 1.093 ± 073 |
| AKR5− + ARV17+ | 0.983 ± 0.10 | |
| AKL34− + ARV18+ | 0.321 ± 0.30 | |
| AKL35− + ARV20+ | 0.479 ± 0.11 | |
| AKL36− + ARV21+ | 0.702 ± 0.21 | |
| Positive Control | (NRRL 3357) | 1.142 ± 0.42 |
| Negative Control | Water | ND |
Publisher’s Note: MDPI stays neutral with regard to jurisdictional claims in published maps and institutional affiliations. |
© 2021 by the authors. Licensee MDPI, Basel, Switzerland. This article is an open access article distributed under the terms and conditions of the Creative Commons Attribution (CC BY) license (http://creativecommons.org/licenses/by/4.0/).
Share and Cite
Khan, R.; Ghazali, F.M.; Mahyudin, N.A.; Samsudin, N.I.P. Co-Inoculation of Aflatoxigenic and Non-Aflatoxigenic Strains of Aspergillus flavus to Assess the Efficacy of Non-Aflatoxigenic Strains in Growth Inhibition and Aflatoxin B1 Reduction. Agriculture 2021, 11, 198. https://0-doi-org.brum.beds.ac.uk/10.3390/agriculture11030198
Khan R, Ghazali FM, Mahyudin NA, Samsudin NIP. Co-Inoculation of Aflatoxigenic and Non-Aflatoxigenic Strains of Aspergillus flavus to Assess the Efficacy of Non-Aflatoxigenic Strains in Growth Inhibition and Aflatoxin B1 Reduction. Agriculture. 2021; 11(3):198. https://0-doi-org.brum.beds.ac.uk/10.3390/agriculture11030198
Chicago/Turabian StyleKhan, Rahim, Farinazleen Mohamad Ghazali, Nor Ainy Mahyudin, and Nik Iskandar Putra Samsudin. 2021. "Co-Inoculation of Aflatoxigenic and Non-Aflatoxigenic Strains of Aspergillus flavus to Assess the Efficacy of Non-Aflatoxigenic Strains in Growth Inhibition and Aflatoxin B1 Reduction" Agriculture 11, no. 3: 198. https://0-doi-org.brum.beds.ac.uk/10.3390/agriculture11030198